Interstellar nitrogen isotope ratios: New NH3 data from the Galactic center out to the Perseus arm
Abstract
Our aim is to measure the interstellar 14N/15N ratio across the Galaxy, to establish a standard data set on interstellar ammonia isotope ratios and to provide new constraints on the Galactic chemical evolution. The (, ) = (1, 1), (2, 2) and (3, 3) lines of 14NH3 and 15NH3 were observed with the Shanghai Tianma 65 m radio telescope (TMRT) and the Effelsberg-100 m telescope toward a large sample of 210 sources. 141 of these sources were detected by the TMRT in 14NH3. 8 out of them were also detected in 15NH3. For 10 of the 36 sources with strong NH3 emission, the Effelsberg-100 m telescope detected successfully their 15NH3(1, 1) lines, including 3 sources (G081.7522, W51D and Orion-KL) with detections by the TMRT telescope. Thus, a total of 15 sources are detected in both the 14NH3 and 15NH3 lines. Line and physical parameters for these 15 sources are derived, including optical depths, rotation and kinetic temperatures, and total column densities. 14N/15N isotope ratios were determined from the 14NH3/15NH3 abundance ratios. Isotope ratios obtained from both telescopes agree for a given source within the uncertainties and no dependence on heliocentric distance and kinetic temperature is seen. 14N/15N ratios tend to increase with galactocentric distance, confirming a radial nitrogen isotope gradient. This is consistent with results from recent Galactic chemical model calculations, including the impact of super-AGB stars and novae.
1 Introduction
Galactic chemical evolution (GCE) is a powerful tool to study the stellar evolution history in the Milky Way (Milam et al., 2005). Determining isotopic ratios as a function of distance to the Galactic center (), it is possible to trace back the star formation history and/or initial mass function (IMF) along the Galactic plane with different (Wilson & Rood, 1994; Zhang et al., 2018). Nitrogen is the fifth most common element in the universe (Colzi et al., 2018a). The abundance ratio of its two stable isotopes, 14N and 15N, is critical to our understanding of the GCE and the origin of the solar system. 14N/15N ratios are believed to be a good indicator of stellar nucleosynthesis and the mixing that subsequently occurs since the two isotopes are not synthesized in the same way (e.g., Audouze et al., 1975; Wilson, 1999).
Both 14N and 15N can be produced in the carbon-nitrogen-oxygen (CNO) cycle, which is one of the major reaction sequences of stellar hydrogen burning (Wiescher et al., 2010). 15N is believed to enrich the interstellar medium (ISM) mainly during nova outbursts, being synthesized by the hot CNO cycle (Clayton, 2003; Romano et al., 2017; Colzi et al., 2018a). 14N can be created from 13C or 17O in the cold CNO cycle and should mostly be a secondary product. However, a primary component of 14N can also be formed in the so-called Hot Bottom Burning (HBB) of asymptotic giant branch (AGB) stars (e.g. Izzard et al., 2004). Thus 14N may be a more primary product with respect to 15N. Different origins of the two nitrogen isotopes should lead to an increase of 14N/15N ratios with galactocentric distance (Dahmen et al., 1995; Adande & Ziurys, 2012), as predicted by models of Galactic chemical evolution (Romano & Matteucci, 2003; Romano et al., 2017).
Previous measurements of 14N/15N ratios in the interstellar medium are based on spectral radio lines of different molecular tracers. A study of HCN from the Galactic disk by Dahmen et al. (1995) revealed ratios that slightly increase with increasing galactocentric distance, with values of 400 in the local ISM. Subsequently, observations of CN, C15N, HN13C and H15NC lines reported by Adande & Ziurys (2012) led to 14N/15N ratios with increasing (290 40 near the solar circle). For the most recent study, Colzi et al. (2018a) derived 14N/15N ratios from HN13C, H15NC, H13CN and HC15N, which also show a trend with increasing values at larger (375 50 in the local ISM). However, the slope of the increasing 14N/15N ratio with is still a matter of debate. For the Galactic center region, there are only few direct observations. Based on H13CN and HC15N observations, Wannier et al. (1981) obtained a 14N/15N ratio >510 toward Sgr A. An even larger value of 1000, this time from 14NH3/15NH3 data, was reported by Güsten & Ungerechts (1985) toward Galactic center clouds, leading to a ratio surpassing that from the solar system by a factor of four. Towards yet another source in the Galactic center region, Sgr B(N), Mills et al. (2018) measured a much lower 14N/15N ratio (200) in the N2 hot core, through VLA observations of 14NH3 and 15NH3. This is consistent with extrapolated values in the Galactic center region of 123 37 (Adande & Ziurys, 2012) and 250 67 (Colzi et al., 2018a), from their proposed radial Galactic trends, respectively. However, systematic errors in the results from Mills et al. (2018) (e.g. optically thick transitions) could not be excluded. Moreover, galactocentric distances lower than 4 kpc are excluded in Galactic chemical evolution models due to the peculiarity and complexity of this region (e.g., Romano et al., 2017, 2019).
From a theoretical point of view, chemical isotopic fractionation might be significant in star forming regions. This is still not well understood. Current models predict different degrees of fractionation depending on the N-bearing molecular species. However, these models have faced difficulties explaining discrepant 14N/15N ratios with large variations toward different astrophysically relevant interstellar sources (e.g., Charnley & Rodgers et al., 2002; Roueff et al., 2015; Furuya & Aikawa, 2018; Colzi et al., 2019). Thus more observations from as many molecular species as possible and more modeling work, including the Galactic center region, are required.
Many observations used a double isotope ratio also including 12C/13C, which may enhance uncertainties related to the abundance of 14N/15N (e.g. CN, HCN or HNC, Colzi et al., 2018a; Loison et al., 2020). With nitrogen isotope ratios usually surpassing 100, any analysis using HCN, HNC or N2H+ may be hampered by the fact that either the main species is optically thick, that the rare species remains undetectable or that double isotope ratios have to be implemented. Hyperfine splitting, even if present, is in most cases not wide enough to allow for the determination of opacities in the potentially optically thick lines of the main species. In this context, CN and NH3 are the notable exceptions, providing a direct evaluation of line opacities in the critical 14N bearing main species. In the following we focus on ammonia (NH3). Allowing for the observation of many lines in a limited frequency interval, permitting the determination of optical depths, rotational temperatures and total column densities, it is one of the best tools to directly determine 14N/15N isotope ratios. Moreover, so far proposed abundance gradients established across the body of the Milky Way may have been greatly affected by the uncertain distances of the targets (e. g., Adande & Ziurys, 2012; Colzi et al., 2018a). Now, however, NH3 can be measured in a large number of sources with well determined distances (see Sect. 2.1).
Therefore, with the Tianma-65 m (TMRT) and Effelsberg-100 m telescopes, we performed observations of the () = (1, 1), (2, 2) and (3, 3) inversion lines of NH3 and 15NH3 toward a large sample of star formation regions, covering distance bins from the Galactic center out to 10 kpc. Based on comparisons of nitrogen isotope ratios obtained from different molecular species, i.e. NH3, HCN and HNC (for the latter, see Colzi et al., 2018a), systematic discrepancies could be related to the choice of molecular species to quantify for the first time also chemical aspects being caused by potential fractionation (Roueff et al., 2015; Viti et al., 2019) on a Galaxy-wide scale. In Sect. 2, sample and observations are introduced. An analysis of observational data and main results are presented in Sect. 3. In Sect. 4, these results are discussed in the light of possible physical and chemical effects and are compared with previous studies. A brief summary is provided in Sect. 5.
2 TARGETS, OBSERVATIONS, AND DATA REDUCTION
2.1 Sample selection and distance
A total of 210 sources was chosen from previously studied strong NH3 sources (e.g., Wyrowski and Walmsley, 1996; Longmore et al., 2007; Rosolowsky et al., 2009; Lis et al., 2010; Cyganowski et al., 2013; Reid et al., 2014). Sources have accurate distance values, including 113 sources from trigonometric parallax measurements and 97 from the Parallax-Based Distance Calculator (Reid et al., 2014, 2019). Using a Bayesian approach, sources are assigned to arms based on their () coordinates with respect to arm signatures seen in CO and HI surveys. The most reasonable distance (near or far) can be derived through a full distance probability density function from the Parallax-Based Distance Calculator, considering a source’s kinematic distance, displacement from the plane, and proximity to individual parallax sources. We believe that it is an important improvement to reveal radial variations of 14N/15N in an unbiased way. The heliocentric distance was used to calculate the galacocentric distance of targets (Roman-Duval et al., 2009),
| (1) |
is the Galactic longitude, and are the distance of the Sun from the Galactic center (8.122 0.031 kpc, from the Gravity Collaboration et al., 2018) and of the targeted source from the Sun (Reid et al., 2014), respectively.The error in the distance to the Galactic center is so small that it will be neglected in the following.
The sample includes star forming regions at different evolutionary stages, including sources associated with InfraRed Dark Clouds (IRDCs), massive young stellar objects (YSOs) and H II regions 111http://simbad.u-strasbg.fr/simbad/, which are used to better constrain radial trends of the Galactic 14N/15N isotope ratio. The source list is presented in the Appendix.
2.2 Observations
2.2.1 Tianma 65 m observations
For our sample of 210 sources, we made observations of the () = (1, 1), (2, 2) and (3, 3) lines of 14NH3 and 15NH3 (see Table 1), firstly by the Shanghai Tianma 65 m radio telescope (TMRT) in 2019 April, May, November and December, with a beam size of 50. A cryogenically cooled K-band (17.9 - 26.2 GHz) receiver was employed, and the Digital Backend System, DIBAS, was used for recording (see Li et al., 2016). The DIBAS mode 22 was adopted for observations, with eight spectral windows, to cover the 14NH3 and 15NH3 lines simultaneously, each with a bandwidth of 23.4 MHz (16384 channels), supplying a spectral resolution of 1.43 kHz (0.02 km s-1). The active surface system of the primary dish and a subreflector were used to improve the aperture efficiency. Observations were performed in position switching mode. The system temperature was 100 – 200 K on an antenna temperature scale (). The main beam brightness temperature () can be obtained from the antenna temperature scale by = /, where is the main beam efficiency correction factor, with a mean value of 0.6 (Mei et al., 2020). The on-source integration time was about 0.1 – 3.0 hr for each of our sources.
2.2.2 Effelsberg 100 m observations
We used the Effelsberg 100 m telescope222The 100-m telescope at Effelsberg is operated by the Max-Planck-Institut für Radioastronomie (MPIFR) on behalf of the Max-Planck Gesellschaft (MPG). to observe the (, ) = (1, 1), (2, 2) and (3, 3) lines of 14NH3 and 15NH3 (see Table 1) toward 36 selected sources with strong 14NH3 signals from previous TMRT observations in 2019 December and 2020 January. The newly installed Fast Fourier Transform Spectrometer (FFTS) was used as backend. Initially, observations were carried out in the Hi-res (olution) mode, with 2 spectral windows covering the 14NH3 and 15NH3 lines simultaneously, each with a bandwidth of 300 MHz (65536 channels), resulting in a spectral resolution of 4.6 kHz (0.066 km s-1). The Low-res mode was adopted for later observations, with 4 spectral windows, each with a bandwidth of 2 GHz (65536 channels), supplying a spectral resolution of 38.1 kHz (0.6 km s-1). The system temperature was 90 - 250 K on an antenna temperature scale. The beam size is close to 40” near 23 GHz. Strong continuum sources (e.g., NGC 7027 and 3C 286) were used to calibrate spectral line flux densities. Standard 23 GHz flux densities of 5.6 Jy and 2.5 Jy were adopted for NGC 7027 and 3C 286, respectively (Ott et al., 1994). The main beam brightness temperature (K) scale can be determined from the observed flux density (Jy) by a conversion factor, which is 1.7 K Jy-1 at 18.5 GHz, 1.5 K Jy-1 at 22 GHz, and 1.4 K Jy-1 at 23.7 GHz (Gong et al., 2015). The spectra were obtained in a position switching mode. The on-source integration time was, depending on line strength, 0.3 – 2 hr for each source. The focus was checked every few hours. Pointing was obtained every two hours toward nearby pointing sources (e.g., 3C 123, or NGC 7027).
| Line | Frequency | logaaEinstein coefficient for spontaneous emission. | bbEnergy of the upper level above the ground state. | ccUpper state degeneracy. |
|---|---|---|---|---|
| (MHz) | (K) | |||
| 14NH3(1, 1) | 23694.5 | -6.76650 | 24.35 | 6 |
| 14NH3(2, 2) | 23722.6 | -6.31125 | 65.34 | 10 |
| 14NH3(3, 3) | 23870.1 | -6.25203 | 124.73 | 28 |
| 15NH3(1, 1) | 22624.9 | -6.83680 | 23.82 | 6 |
| 15NH3(2, 2) | 22649.8 | -6.71062 | 64.93 | 10 |
| 15NH3(3, 3) | 22789.4 | -6.65097 | 123.91 | 28 |
Note. — The parameters are from the JPL Molecular Spectroscopy Catalog (Pickett et al., 1998).
2.3 Data reduction
The Continuum and Line Analysis Single-dish Software (CLASS) of the Grenoble Image and Line Data Analysis Software packages 333http://http://www.iram.fr/IRAMFR/GILDAS/ (GILDAS, e. g., Guilloteau & Lucas 2000) was used to reduce the spectral line data. After subtracting baselines and applying Hanning smoothing, the line parameters are obtained from Gaussian fits for detected lines (signal-to-noise S/N >3 sigma), with a spectral resolution of 0.78 km s-1 for TMRT and 0.70 km s-1 for Effelsberg observations, respectively.
.
| Object | Telescope | (2000) (2000) | Total time | Molecule | r.m.s. | V | |||
|---|---|---|---|---|---|---|---|---|---|
| () () | (min) | (mK) | () | () | () | (K) | |||
| G032.04 | T | 18:49:36.3 -00:45:37.1 | 11 | 14NH3(1,1) | 46.9 | 34.9 0.3 | 94.7 0.8 | 3.2 0.8 | 3.93 |
| 14NH3(2,2) | 65.6 | 6.10 0.18 | 94.19 0.06 | 3.16 0.14 | 1.80 | ||||
| 14NH3(3,3) | 62.0 | 3.90 0.19 | 94.17 0.12 | 4.7 0.3 | 0.77 | ||||
| 15NH3(1,1) | 77.7 | 0.8 0.2 | 95.6 0.3 | 2.5 0.6 | 0.37 | ||||
| 15NH3(2,2) | 77.4 | … | … | … | … | ||||
| 15NH3(3,3) | 78.4 | … | … | … | … | ||||
| G053.23 | T | 19:29:33.2 +18:01:00.6 | 65 | 14NH3(1,1) | 25.6 | 14.33 0.13 | 24.3 0.8 | 1.2 0.8 | 4.02 |
| 14NH3(2,2) | 28.7 | 1.19 0.04 | 23.7 0.2 | 1.09 0.04 | 1.04 | ||||
| 14NH3(3,3) | 29.4 | … | … | … | … | ||||
| 15NH3(1,1) | 72.8 | 0.09 0.03 | 23.8 0.2 | 1.0 0.5 | 0.08 | ||||
| 15NH3(2,2) | 38.1 | … | … | … | … | ||||
| 15NH3(3,3) | 135 | … | … | … | … | ||||
| G081.75 | T | 20:39:02.0 +42:24:58.6 | 360 | 14NH3(1,1) | 19.5 | 35.8 1.0 | -3.8 0.8 | 2.2 0.8 | 6.04 |
| 14NH3(2,2) | 18.9 | 9.70 0.03 | -4.29 0.06 | 2.23 0.01 | 3.09 | ||||
| 14NH3(3,3) | 14.4 | 2.98 0.03 | -4.07 0.01 | 2.75 0.04 | 1.02 | ||||
| 15NH3(1,1) | 26.3 | 0.14 0.02 | -4.39 0.16 | 2.3 0.4 | 0.06 | ||||
| 15NH3(2,2) | 19.0 | … | … | … | … | ||||
| 15NH3(3,3) | 16.2 | … | … | … | … | ||||
| E | 20:39:02.0 +42:24:58.6 | 235 | 14NH3(1,1) | 27.3 | 27.4 0.5 | -3.9 0.7 | 2.0 0.7 | 4.81 | |
| 14NH3(2,2) | 83.3 | 7.7 0.2 | -4.38 0.01 | 1.94 0.01 | 2.75 | ||||
| 14NH3(3,3) | 13.4 | 2.14 0.03 | -4.17 0.02 | 2.40 0.04 | 0.84 | ||||
| 15NH3(1,1) | 49.3 | 0.09 0.02 | -4.4 0.3 | 2.2 0.8 | 0.06 | ||||
| 15NH3(2,2) | 12.1 | … | … | … | … | ||||
| 15NH3(3,3) | 11.7 | … | … | … | … | ||||
| G121.29 | T | 00:36:47.3 +63:29:02.2 | 331 | 14NH3(1,1) | 14.7 | 27.02 0.13 | -17.6 0.4 | 2.2 0.4 | 4.74 |
| 14NH3(2,2) | 16.2 | 6.45 0.05 | -18.1 0.4 | 2.4 0.4 | 1.85 | ||||
| 14NH3(3,3) | 12.6 | 1.74 0.03 | -18.01 0.03 | 3.05 0.07 | 0.53 | ||||
| 15NH3(1,1) | 36.7 | 0.3 0.1 | -19.5 0.3 | 1.7 0.7 | 0.30 | ||||
| 15NH3(2,2) | 29.3 | … | … | … | … | ||||
| 15NH3(3,3) | 34.7 | … | … | … | … | ||||
| G30.70 | T | 18:47:36.1 -02:00:58.2 | 15 | 14NH3(1,1) | 69.9 | 90.9 1.4 | 91.2 0.4 | 4.9 0.4 | 6.12 |
| 14NH3(2,2) | 73.6 | 34.8 0.7 | 90.6 0.4 | 5.2 0.4 | 4.06 | ||||
| 14NH3(3,3) | 67.6 | 21.6 0.3 | 90.7 0.4 | 5.0 0.4 | 3.99 | ||||
| 15NH3(1,1) | 56.7 | 0.89 0.08 | 89.5 0.2 | 1.0 0.4 | 0.18 | ||||
| 15NH3(2,2) | 54.2 | … | … | … | … | ||||
| 15NH3(3,3) | 58.6 | … | … | … | … | ||||
| NGC 6334 I | T | 17:20:53.3 -35:47:01.2 | 33 | 14NH3(1,1) | 114.0 | 245 4 | -6.9 0.5 | 5.2 0.5 | 15.34 |
| 14NH3(2,2) | 49.4 | 68.7 1.1 | -7.5 0.6 | 5.9 0.6 | 5.68 | ||||
| 14NH3(3,3) | 35.9 | 80.7 1.4 | -7.2 0.6 | 5.8 0.6 | 7.72 | ||||
| 15NH3(1,1) | 46.6 | 1.70 0.19 | -6.7 0.3 | 4.5 1.1 | 0.42 | ||||
| 15NH3(2,2) | 46.9 | 0.82 0.11 | -6.9 0.3 | 4.5 0.6 | 0.31 | ||||
| 15NH3(3,3) | 42.3 | 2.41 0.15 | -6.81 0.13 | 4.4 0.4 | 0.48 | ||||
| Orion-KL | T | 05:35:14.4 -05:22:29.6 | 94 | 14NH3(1,1) | 36.8 | 152.2 1.1 | 7.7 0.4 | 5.5 0.4 | 8.06 |
| 14NH3(2,2) | 42.3 | 146.4 1.2 | 7.1 0.4 | 10.2 0.4 | 8.26 | ||||
| 14NH3(3,3) | 33.1 | 173.2 1.4 | 7.0 0.4 | 13.0 0.4 | 9.78 | ||||
| 15NH3(1,1) | 54.5 | 2.02 0.10 | 7.3 0.4 | 10.7 1.2 | 0.30 | ||||
| 15NH3(2,2) | 29.1 | 1.58 0.08 | 7.4 0.4 | 6.8 0.9 | 0.29 | ||||
| 15NH3(3,3) | 26.5 | 3.11 0.11 | 7.24 0.16 | 8.3 0.4 | 0.38 | ||||
| E | 05:35:14.4 -05:22:29.6 | 40 | 14NH3(1,1) | 66.5 | 168.2 1.3 | 7.2 0.6 | 7.7 0.6 | 7.46 | |
| 14NH3(2,2) | 51.1 | 160.2 1.4 | 7.0 0.6 | 11.8 0.6 | 8.12 | ||||
| 14NH3(3,3) | 49.3 | 170.5 1.7 | 6.8 0.6 | 12.4 0.6 | 8.45 | ||||
| 15NH3(1,1) | 16.1 | 2.06 0.10 | 6.7 0.2 | 9.6 0.6 | 0.29 | ||||
| 15NH3(2,2) | 31.8 | 1.84 0.13 | 6.8 3.9 | 6.6 9.3 | 0.26 | ||||
| 15NH3(3,3) | 23.6 | 2.49 0.09 | 6.87 0.12 | 7.8 0.3 | 0.34 | ||||
| W51D | T | 19:23:40.1 14:31:07.1 | 72 | 14NH3(1,1) | 93.0 | 84.9 1.4 | 60.1 0.6 | 5.8 0.6 | 4.68 |
| 14NH3(2,2) | 24.2 | 37.1 0.3 | 60.3 0.6 | 6.5 0.6 | 2.26 | ||||
| 14NH3(3,3) | 29.7 | 52.3 0.4 | 60.5 0.6 | 7.6 0.6 | 3.05 | ||||
| 15NH3(1,1) | 15.6 | 0.70 0.13 | 59.1 0.6 | 5.5 1.5 | 0.17 | ||||
| 15NH3(2,2) | 16.9 | 0.42 0.02 | 58.6 0.2 | 6.2 0.5 | 0.06 | ||||
| 15NH3(3,3) | 10.7 | 0.76 0.07 | 59.1 0.4 | 6.8 1.2 | 0.09 | ||||
| E | 19:23:39.8 14:31:10.1 | 153 | 14NH3(1,1) | 13.0 | 34.0 0.3 | 59.4 0.6 | 7.7 0.6 | 1.74 | |
| 14NH3(2,2) | 8.54 | 24.1 0.1 | 59.91 0.10 | 7.11 0.04 | 1.57 | ||||
| 14NH3(3,3) | 12.5 | 25.4 0.1 | 59.8 0.6 | 10.4 0.6 | 1.44 | ||||
| 15NH3(1,1) | 18.4 | 0.49 0.20 | 60.3 0.9 | 7.5 1.4 | 0.16 | ||||
| 15NH3(2,2) | 18.1 | 0.34 0.04 | 59.0 0.8 | 8.8 1.7 | 0.05 | ||||
| 15NH3(3,3) | 15.8 | 1.51 0.13 | 59.8 0.4 | 7.4 1.0 | 0.10 | ||||
| G016.92 | E | 18:18:08.5 -13:45:05.7 | 60 | 14NH3(1,1) | 19.6 | 10.2 0.1 | 21.0 0.6 | 2.7 0.6 | 1.43 |
| 14NH3(2,2) | 15.6 | 2.17 0.07 | 20.6 0.1 | 2.93 0.11 | 0.70 | ||||
| 14NH3(3,3) | 40.4 | 0.88 0.05 | 20.34 0.12 | 4.4 0.3 | 0.19 | ||||
| 15NH3(1,1) | 17.0 | 0.51 0.13 | 20.6 0.2 | 2.4 1.0 | 0.22 | ||||
| 15NH3(2,2) | 20.2 | … | … | … | … | ||||
| 15NH3(3,3) | 18.8 | … | … | … | … | ||||
| G10.47 | E | 18:08:38.2 -19:51:49.6 | 60 | 14NH3(1,1) | 29.9 | 54.32 0.13 | 67.55 0.13 | 12.93 0.17 | 2.32 |
| 14NH3(2,2) | 34.4 | 38.2 0.3 | 66.9 0.5 | 8.8 0.4 | 1.96 | ||||
| 14NH3(3,3) | 39.2 | 41.0 0.3 | 67.1 0.5 | 10.0 0.5 | 2.20 | ||||
| 15NH3(1,1) | 35.8 | 0.68 0.08 | 64.9 0.2 | 2.8 0.4 | 0.23 | ||||
| 15NH3(2,2) | 61.2 | 2.3 0.2 | 66.1 2.2 | 9.1 0.9 | 0.28 | ||||
| 15NH3(3,3) | 34.1 | 2.04 0.07 | 65.2 0.2 | 11.4 0.8 | 0.27 | ||||
| G188.79 | E | 06:09:06.9 +21:50:41.4 | 180 | 14NH3(1,1) | 6.38 | 4.40 0.02 | -0.51 0.58 | 3.2 0.6 | 0.61 |
| 14NH3(2,2) | 8.46 | 1.06 0.03 | -0.85 0.04 | 3.07 0.09 | 0.33 | ||||
| 14NH3(3,3) | 7.09 | 0.60 0.02 | -0.59 0.06 | 3.28 0.13 | 0.17 | ||||
| 15NH3(1,1) | 7.85 | 0.15 0.04 | -0.53 0.23 | 3.5 1.1 | 0.09 | ||||
| 15NH3(2,2) | 7.58 | … | … | … | … | ||||
| 15NH3(3,3) | 6.71 | … | … | … | … | ||||
| G35.14 | E | 18:58:07.0 01:37:11.9 | 24 | 14NH3(1,1) | 62.9 | 45.8 0.5 | 33.9 0.5 | 4.4 0.5 | 3.98 |
| 14NH3(2,2) | 52.2 | 9.35 0.03 | 33.5 0.1 | 4.45 0.06 | 1.55 | ||||
| 14NH3(3,3) | 66.8 | 4.69 0.10 | 33.83 0.14 | 4.65 0.13 | 0.91 | ||||
| 15NH3(1,1) | 59.7 | 0.54 0.14 | 34.7 0.2 | 1.9 0.8 | 0.33 | ||||
| 15NH3(2,2) | 52.7 | … | … | … | … | ||||
| 15NH3(3,3) | 52.7 | … | … | … | … | ||||
| NGC 1333 | E | 03:29:11.6 31:13:26.0 | 176 | 14NH3(1,1) | 10.5 | 11.0 0.2 | 7.49 0.04 | 1.57 0.01 | 2.76 |
| 14NH3(2,2) | 11.9 | 1.37 0.02 | 6.94 0.01 | 1.69 0.03 | 0.57 | ||||
| 14NH3(3,3) | 12.0 | 0.67 0.06 | 6.69 0.18 | 3.8 0.6 | 0.10 | ||||
| 15NH3(1,1) | 11.5 | 0.09 0.03 | 7.0 0.4 | 2.4 0.8 | 0.03 | ||||
| 15NH3(2,2) | 10.3 | … | … | … | … | ||||
| 15NH3(3,3) | 11.8 | … | … | … | … | ||||
| SGR A | E | 17:47:52.7 -28:59:59.9 | 60 | 14NH3(1,1) | 30.9 | 8.71 0.09 | 17.7 0.1 | 2.54 0.08 | 1.39 |
| 14NH3(2,2) | 30.0 | 1.21 0.11 | 17.34 0.13 | 2.4 0.3 | 0.41 | ||||
| 14NH3(3,3) | 24.5 | 0.66 0.09 | 17.8 0.3 | 3.2 0.5 | 0.20 | ||||
| 15NH3(1,1) | 41.6 | 0.37 0.14 | 17.9 0.2 | 2.5 0.5 | 0.15 | ||||
| 15NH3(2,2) | 28.7 | … | … | … | … | ||||
| 15NH3(3,3) | 48.9 | … | … | … | … | ||||
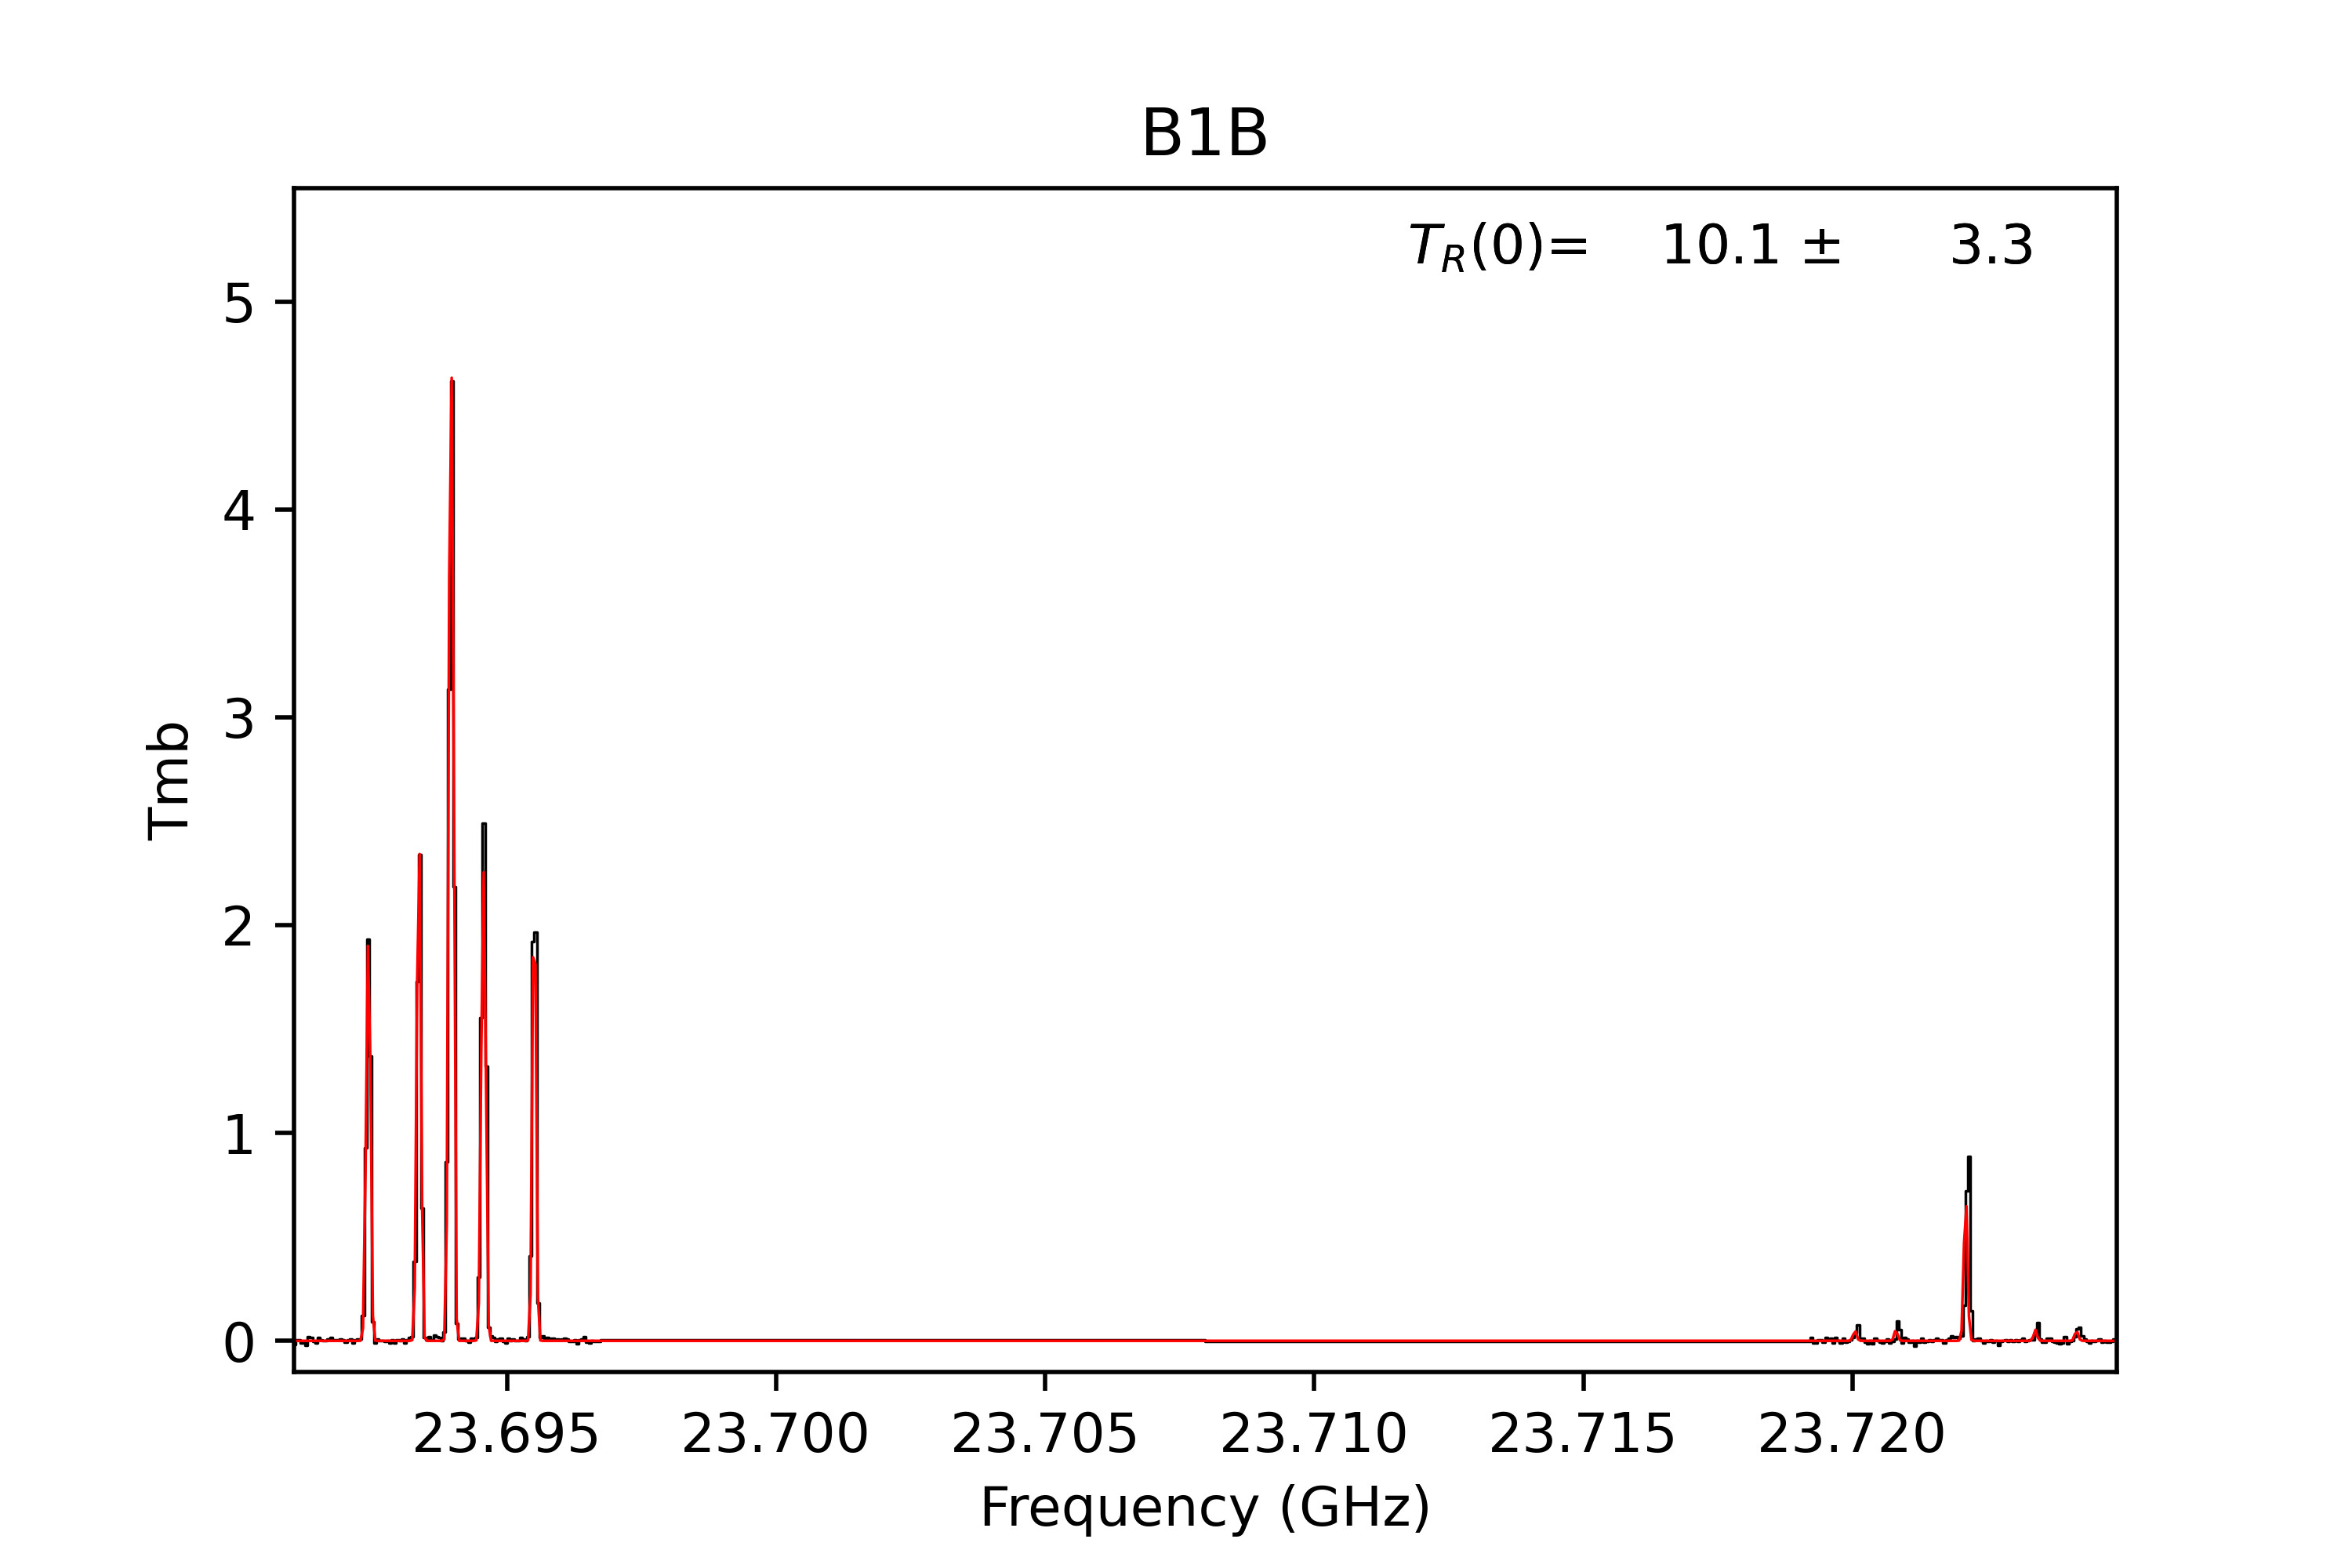
| Barnard-1b | E | 03:33:20.8 +31:07:34.0 | 184 | 14NH3(1,1) | 17.6 | 18.4 0.1 | 6.68 0.06 | 1.23 0.06 | 4.78 |
| 14NH3(2,2) | 16.8 | 1.46 0.01 | 6.16 0.01 | 1.04 0.01 | 1.00 | ||||
| 14NH3(3,3) | 10.0 | 0.11 0.02 | 6.1 0.3 | 3.1 0.7 | 0.03 | ||||
| 15NH3(1,1) | 11.1 | 0.25 0.06 | 6.15 0.10 | 1.2 0.2 | 0.20 | ||||
| 15NH3(2,2) | 9.58 | … | … | … | … | ||||
| 15NH3(3,3) | 11.3 | … | … | … | … |
Note. — Column(1): source name; Column(2): T: TMRT - 65 m; E: Effelsberg-100 m; Column(3): Right ascension (J2000) and Declination (J2000); Column(4): total integration time; Column(5): molecular line; Column(6): the Root-Mean-Square (rms) noise value for channel widths of 0.78 km s-1 (TMRT) or 0.70 km s-1 (Effelsberg); Column(7): the integrated line intensity covering all groups of hyperfine components from Gaussian fitting. For three sources with blended components in the 14NH3 spectra, their spectrum can not be fitted well by Gaussian fitting. Thus we determined their integrated intensities by summing line intensities over the entire velocity interval needed to cover the main and the satellite features (Orion-KL: -45 to 51 km s-1; W51D: 13 to 105 km s-1 and G10.47: 20 to 113 km s-1) using the first moment by the ”Print” command in CLASS; Column(8): LSR velocity; Column(9): line width (FWHM); Column(10): Main beam brightness peak temperature.
3 Results
3.1 Detections and non-detections
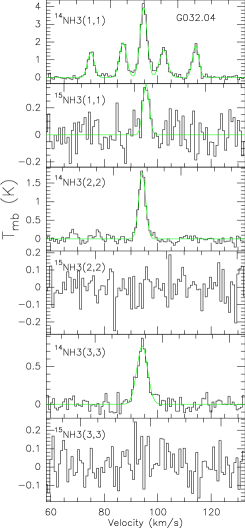
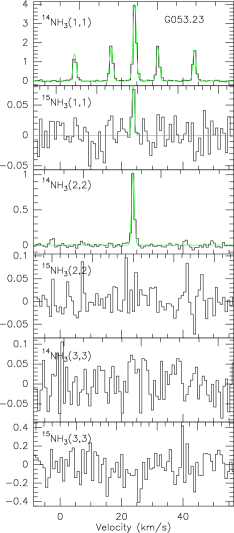
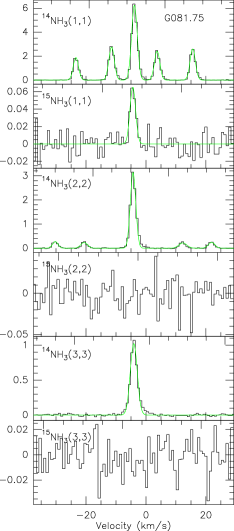
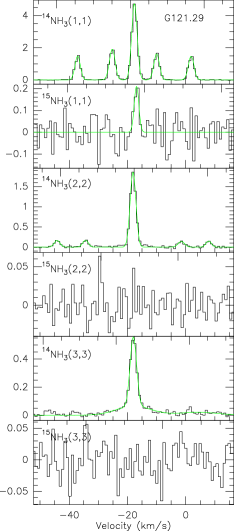
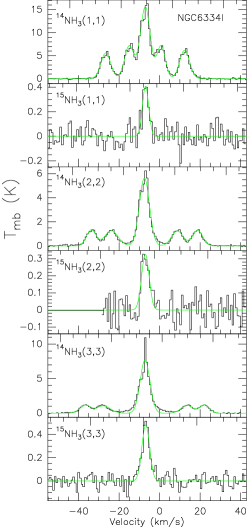
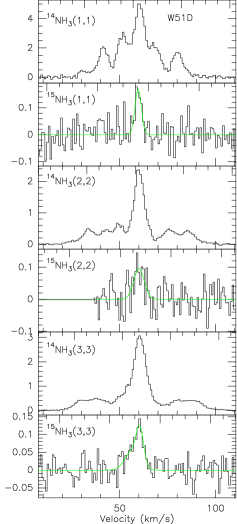
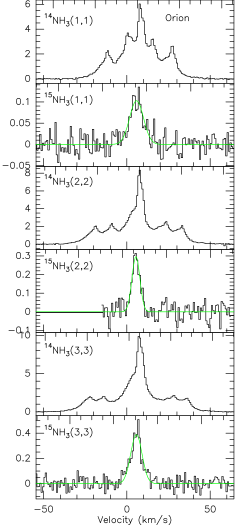
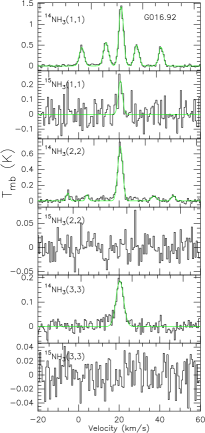
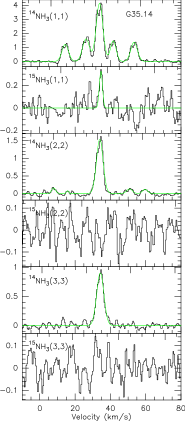
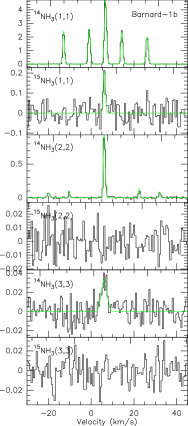
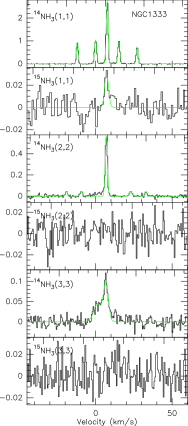
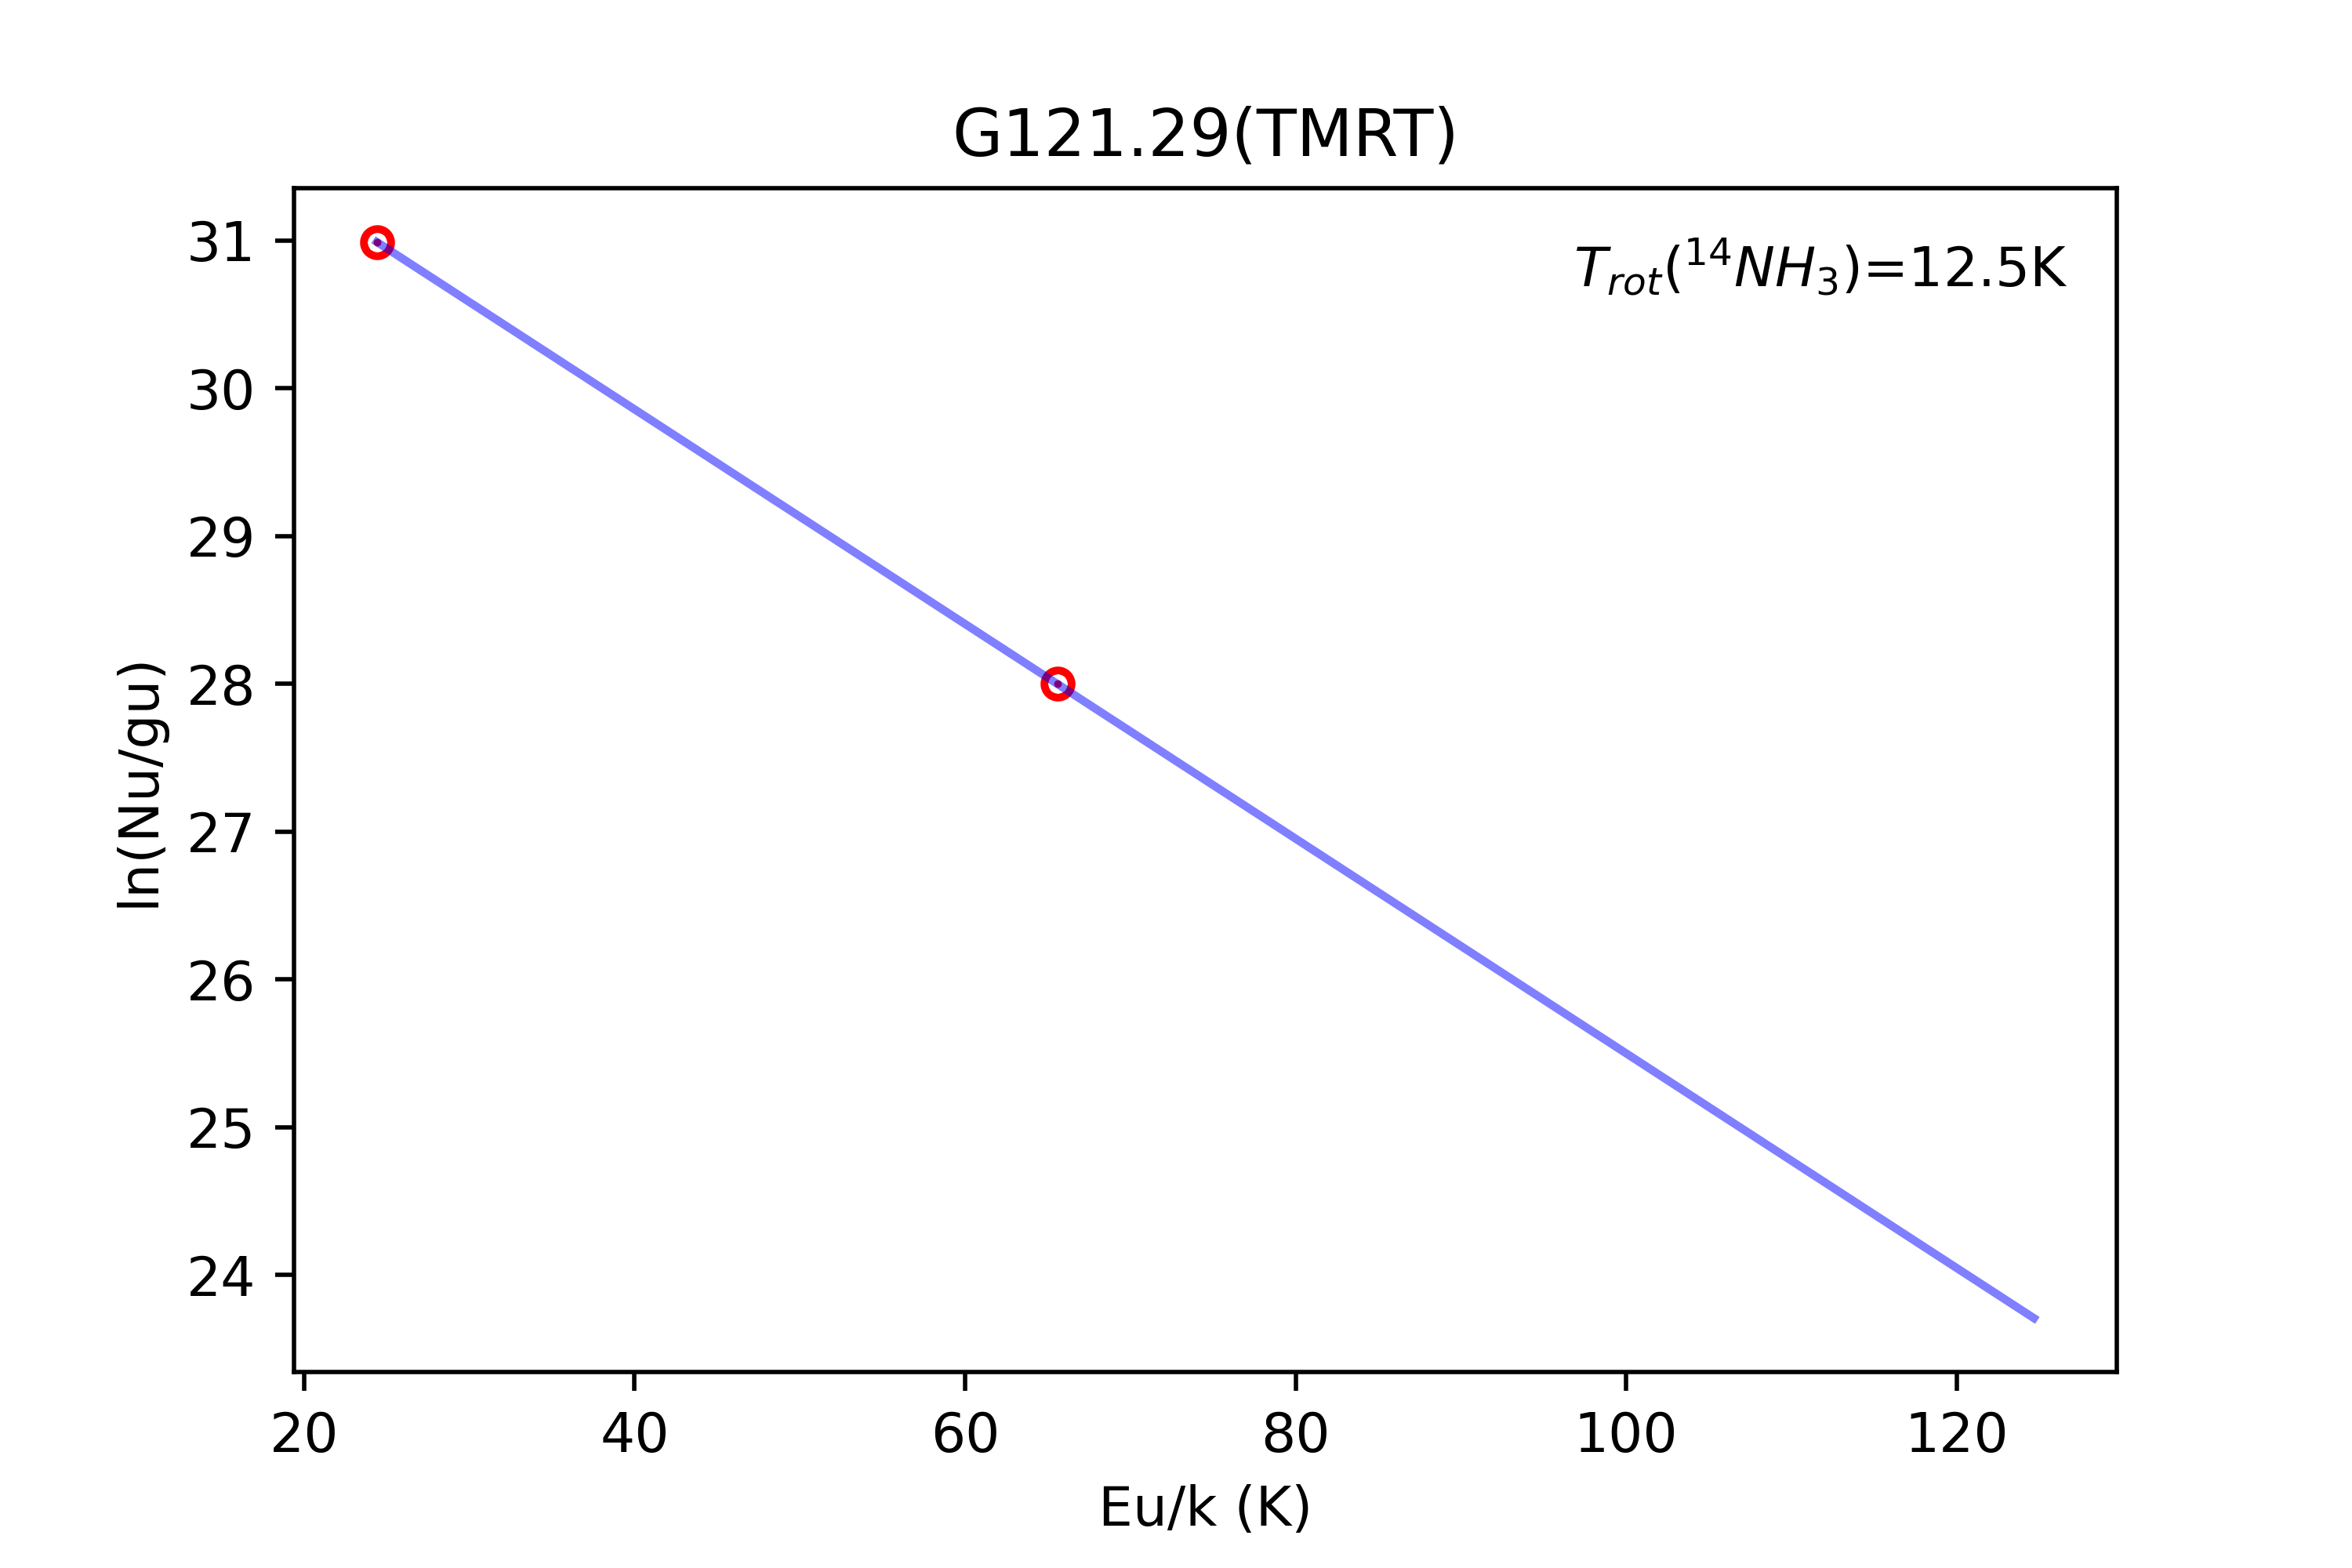
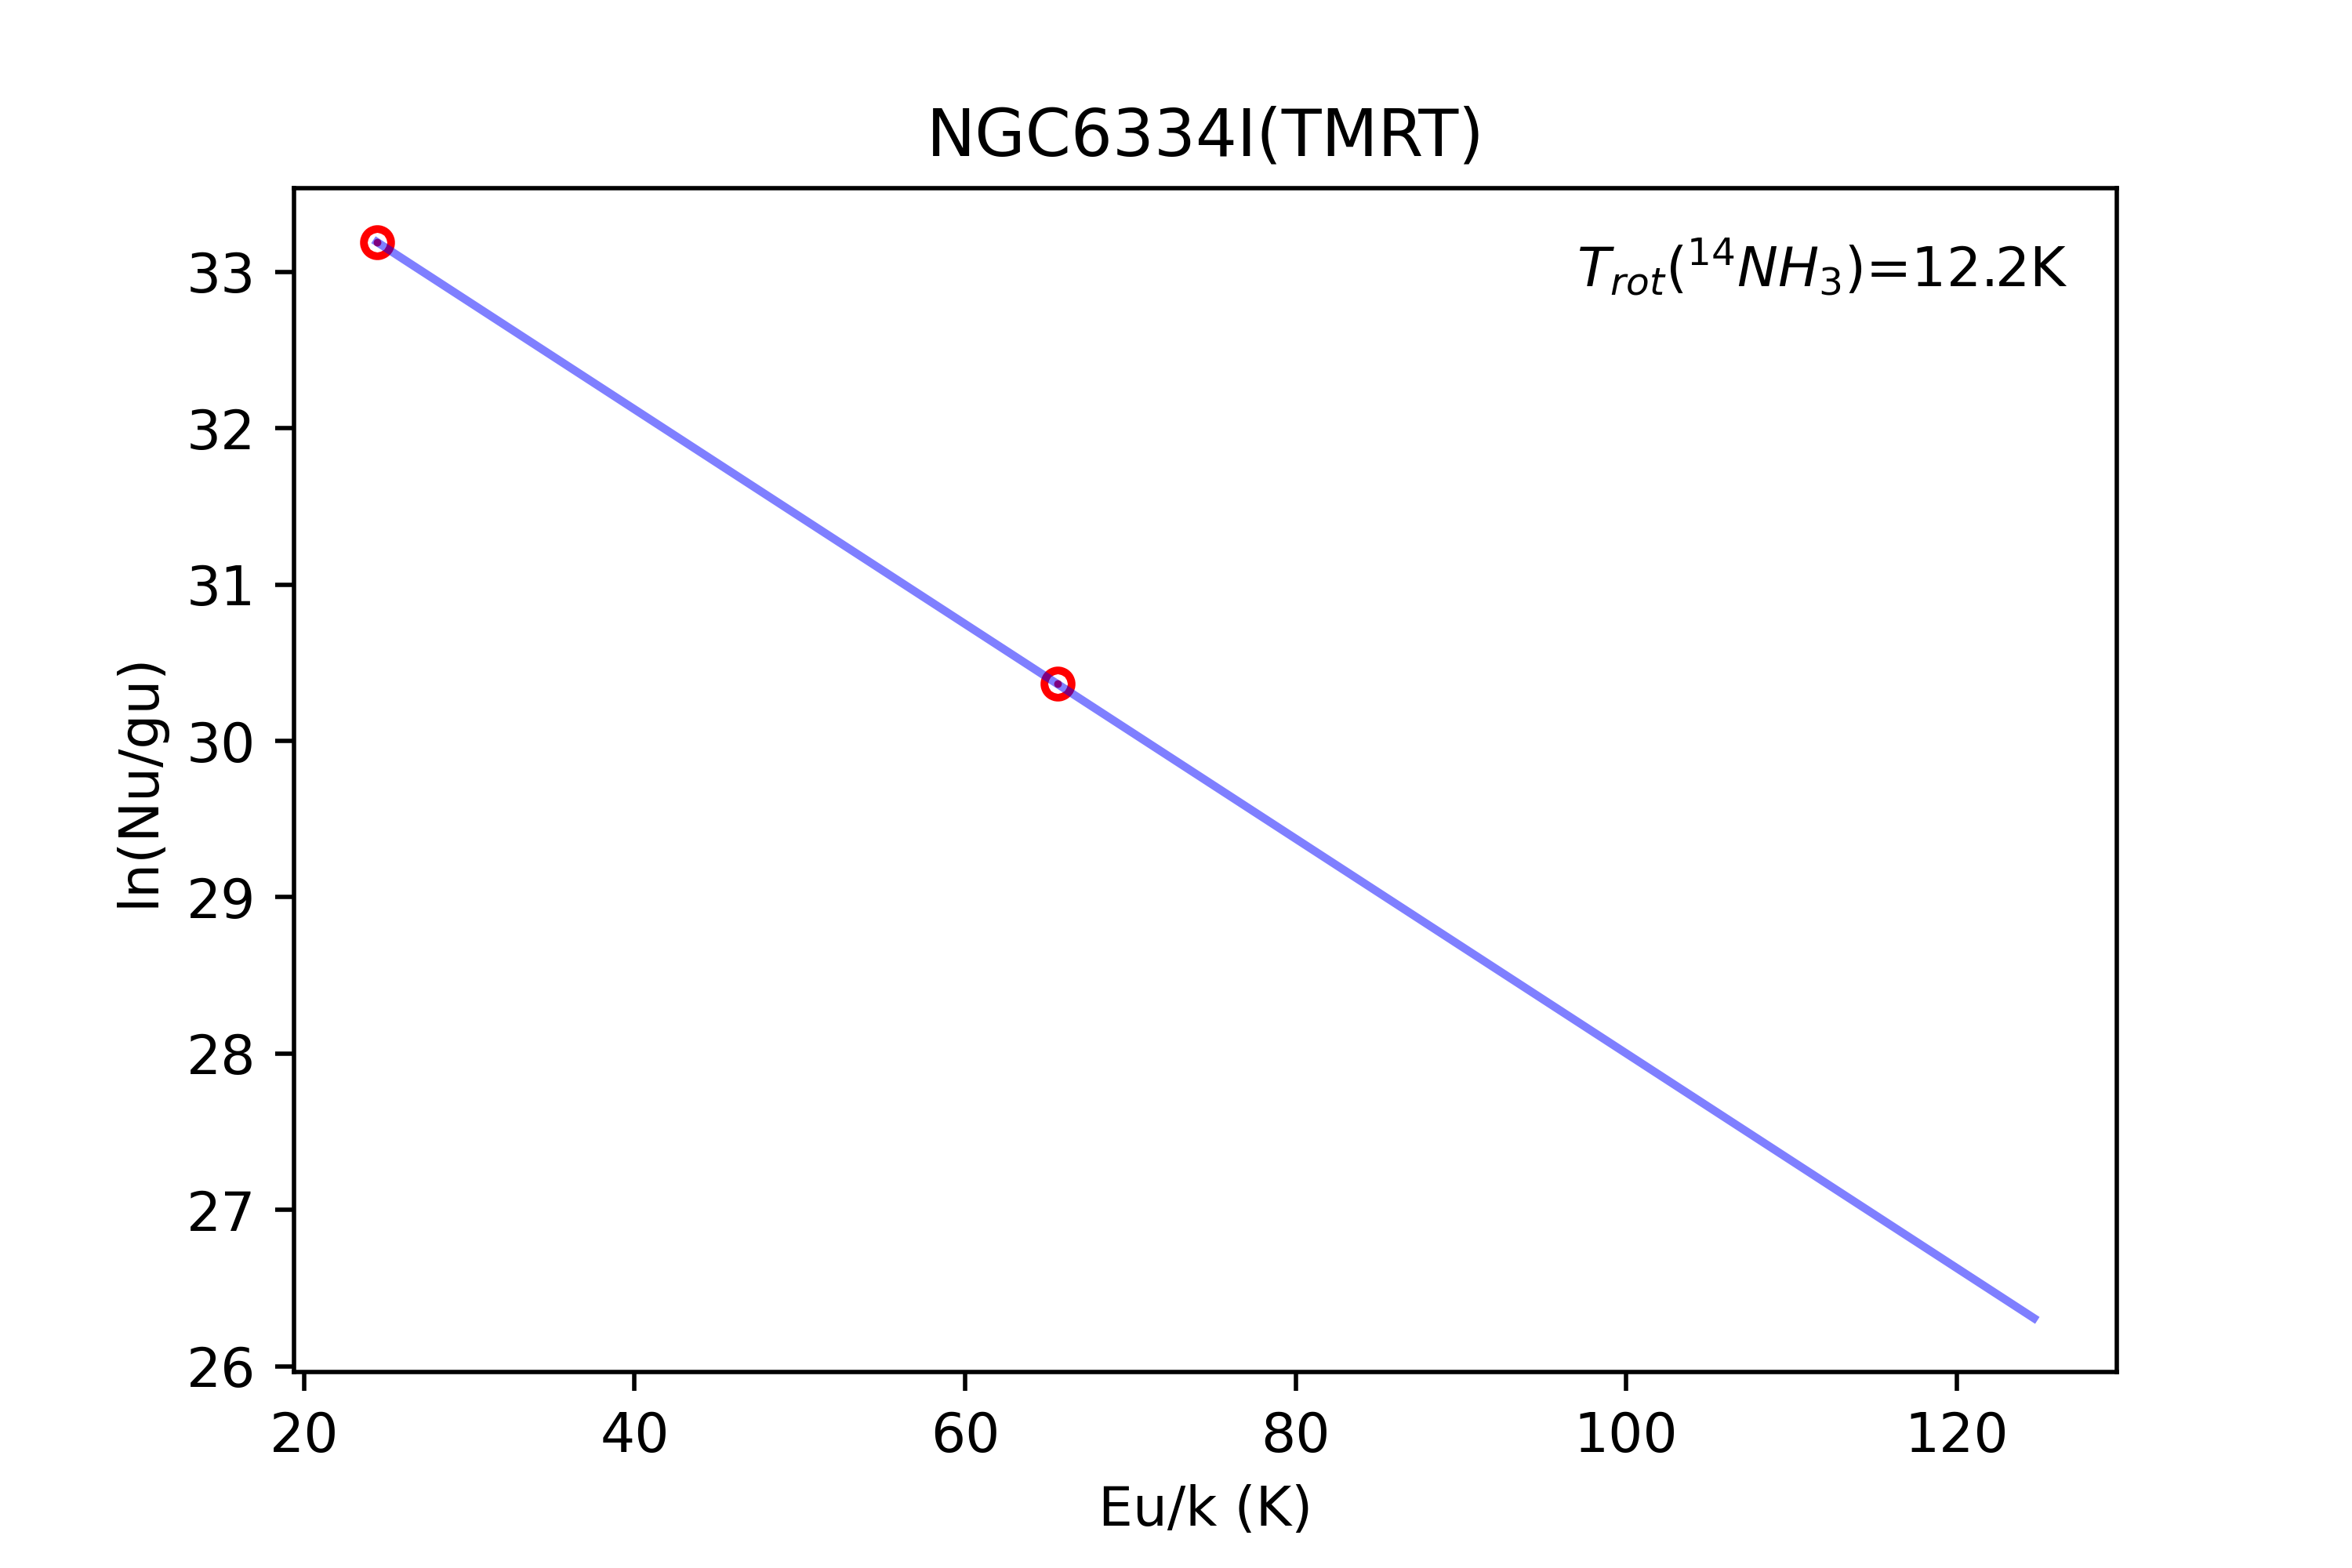
Toward the TMRT 65 m 210 targets, 141 sources were detected in at least one of the 14NH3 lines. Among them, 8 sources were also successfully detected in the 15NH3(1, 1) line. The 15NH3(2, 2) and (3, 3) lines are also detected in three sources (NGC 6334 I, W51D and Orion-KL, see Fig. 1).
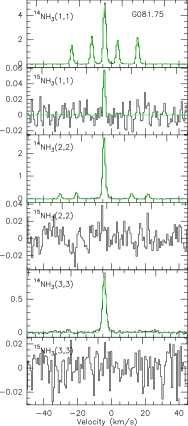
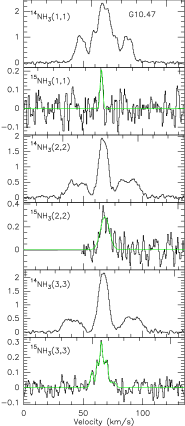
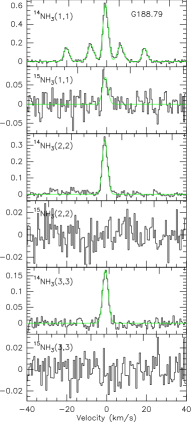
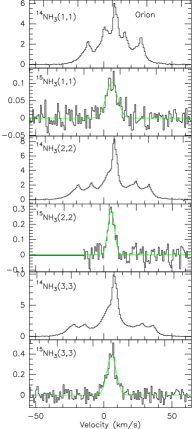
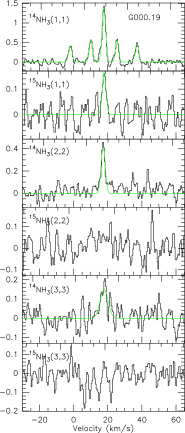
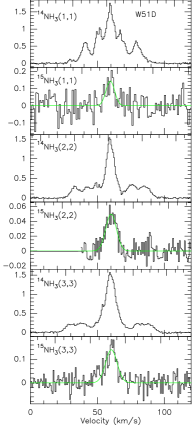
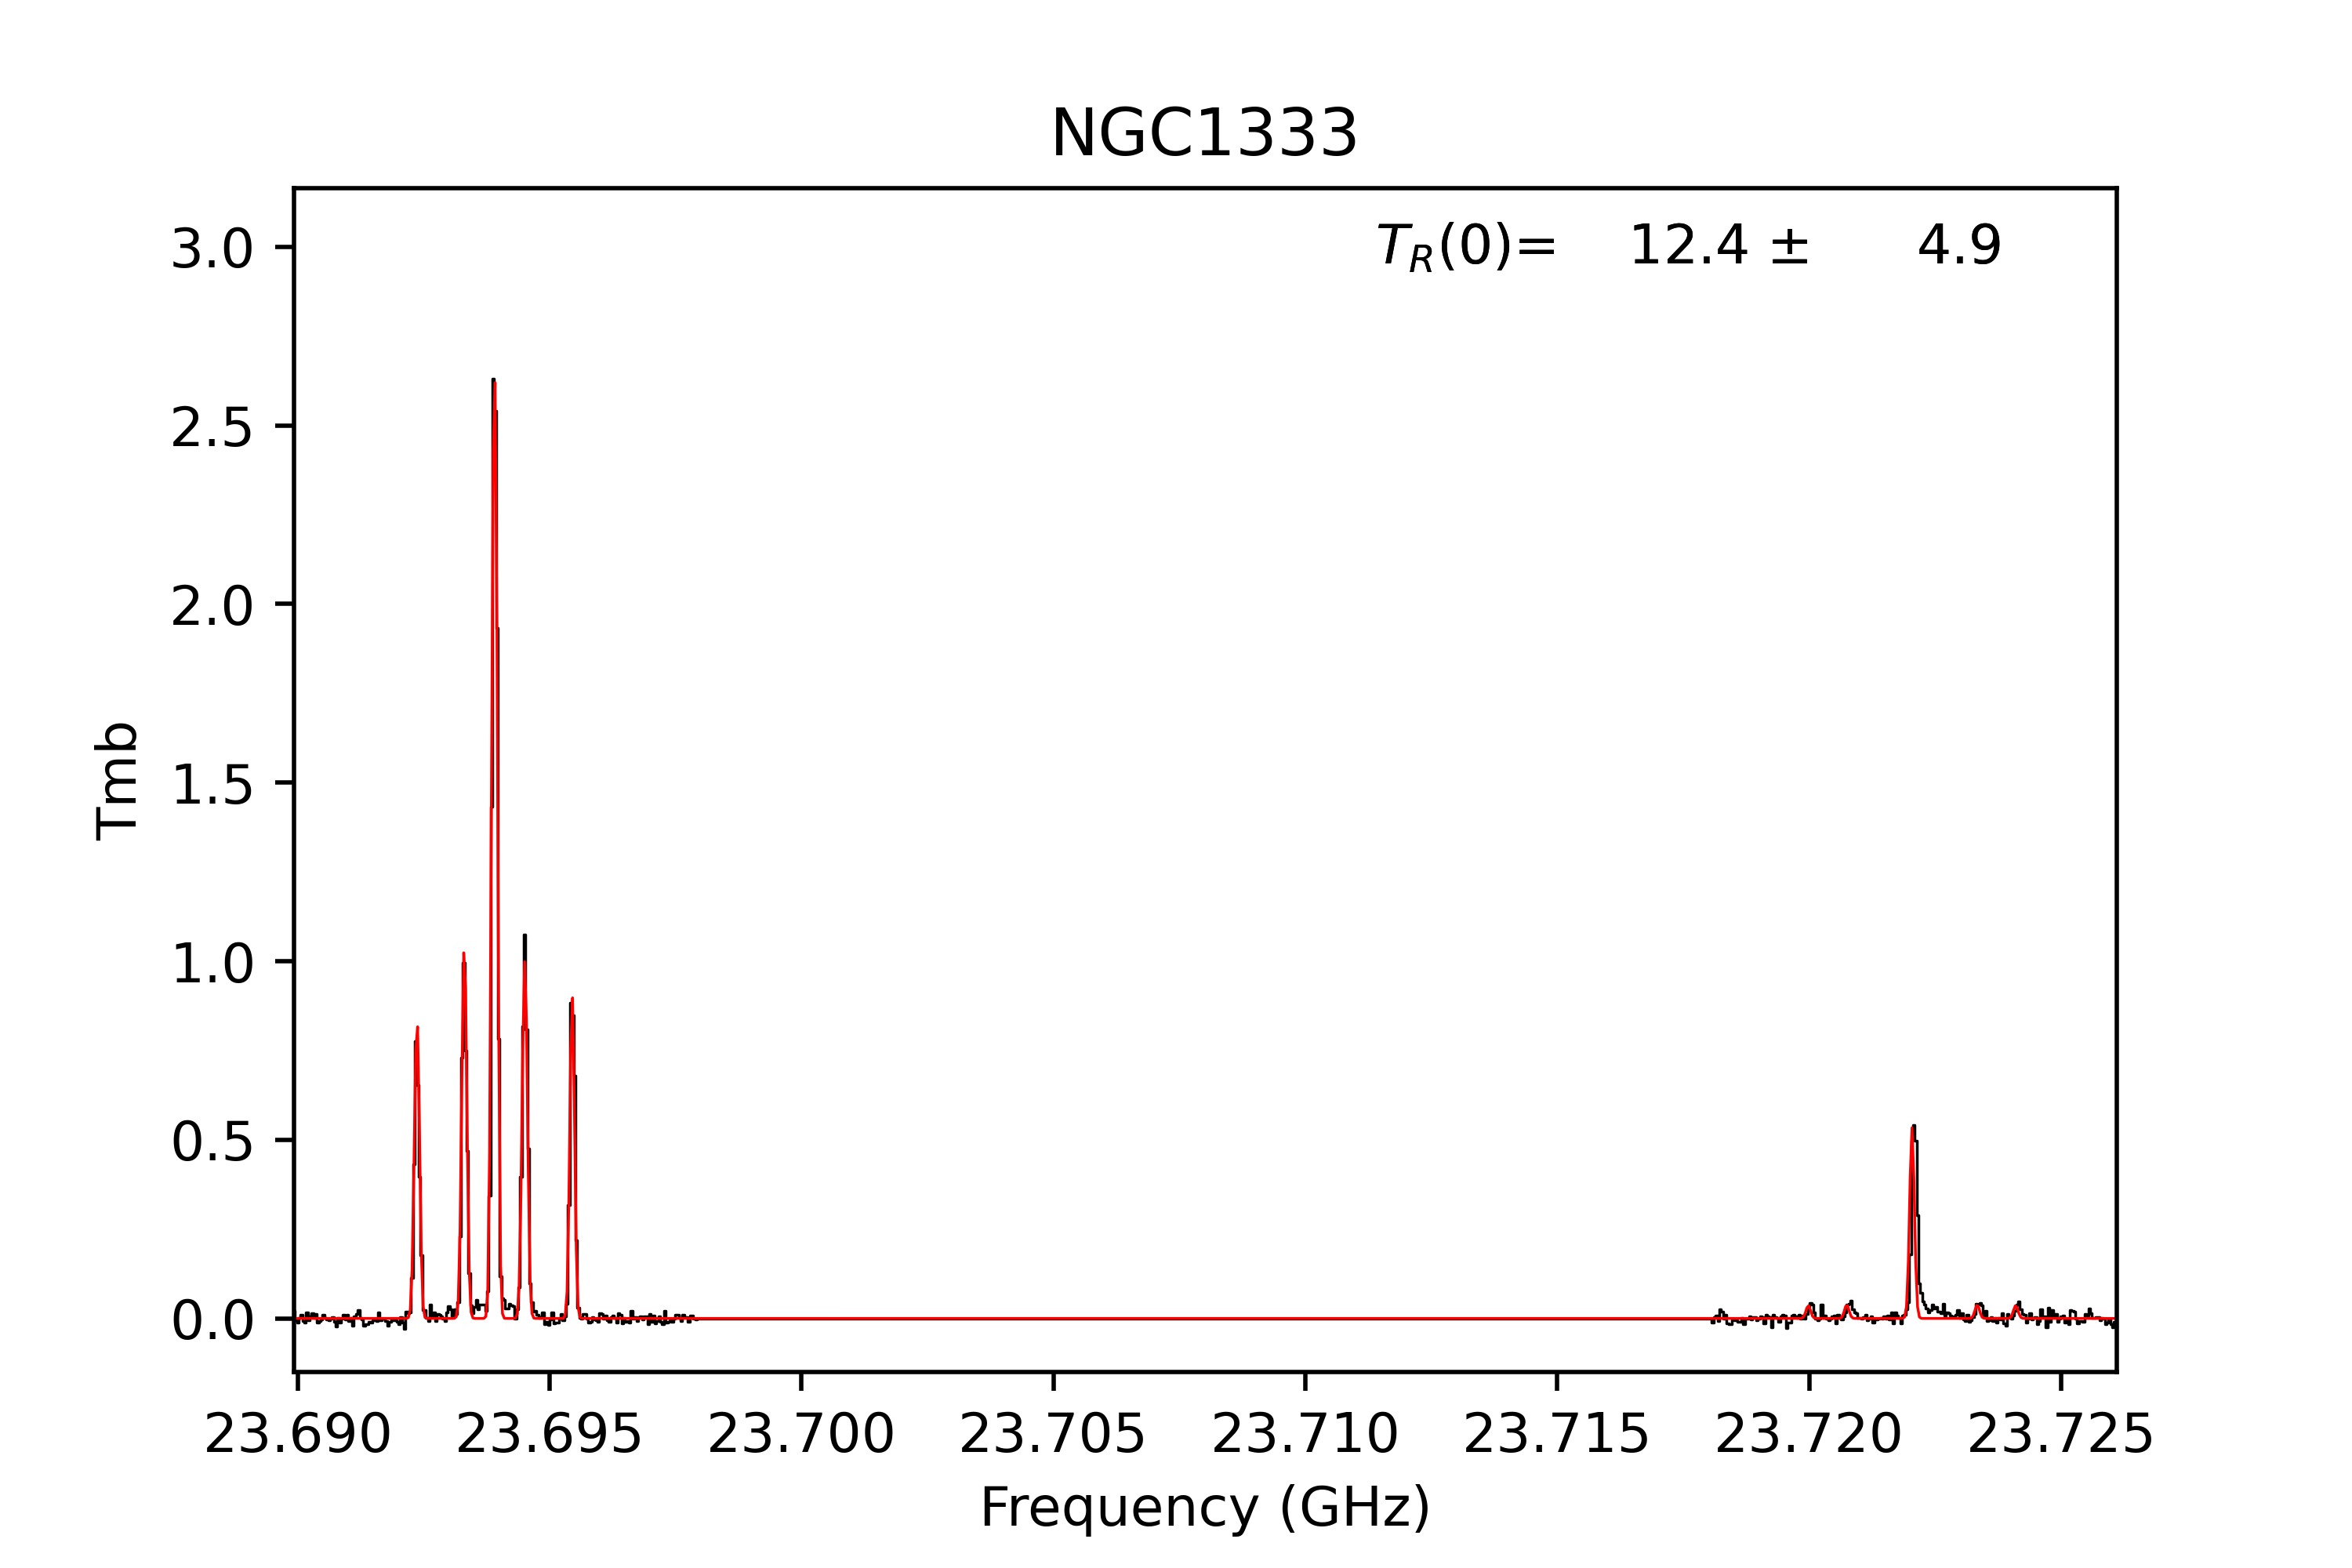
Among the 36 targets with strong 14NH3 emission (Tianma flux density >1.5 Jy), the Effelsberg-100 m telescope detected successfully the 15NH3(1, 1) lines toward 10 sources. The 15NH3(2, 2) and (3, 3) lines are also detected in three of them (W51D Orion-KL and G10.47, see Fig. 2).
Combinations of both TMRT and Effelsberg observations lead to 15 sources with detections of 15NH3 lines, including 3 sources (G081.7522, W51D and Orion-KL) with detections by both telescopes. The spectral line parameters of these 15 sources are listed in Table 2. For G30.70 with the FWHM of 15NH3(1, 1) being much smaller than that of 14NH3(1, 1), the integrated line intensity of 15NH3(1, 1) was taken assuming the ratio of integrated line intensities equals the ratio of the peak values of the main beam brightness temperature. For those sources without detection of 15NH3, the upper limit of the line was estimated from the rms value, which will be used for later analysis (see Sect. 3.3).
3.2 Line and physical parameters of sources with detections of 14NH3 and 15NH3
For those 15 sources with both 14NH3 and 15NH3 line detections, we determine the line and physical parameters here, including the optical depth, the total column density, and the rotation and kinetic temperatures.
3.2.1 Optical depth
In view of the expected large nitrogen isotope ratios, there is reason to expect that in clouds with detected 15NH3 emission, the 14NH3 lines may be optically thick, leading to a non-linear correlation between integrated intensity and molecular column density. We have therefore determined the optical depth of the 14NH3 inversion lines using two methods, the so-called intensity ratio method and the hyperfine (HF) structure line fits. Spectroscpic information on the 14NH3(1, 1) hyperfine components is listed in Table 3. \startlongtable
| Hyperfine | HFC | Frequencyb | Relative | Velocity | ||
|---|---|---|---|---|---|---|
| Group a | number | (kHz) | Intensities c | (km s-1) | ||
| osg.1 | 1 | 1/2, 1/2 | (0,1) | -1568.49 | 1/27 | -19.84 |
| 2 | 1/2, 3/2 | (0,1) | -1526.96 | 2/37 | -19.32 | |
| isg.1 | 3 | 3/2, 1/2 | (2,1) | -623.31 | 5/108 | -7.89 |
| 4 | 5/2, 3/2 | (2,1) | -590.92 | 1/12 | -7.47 | |
| 5 | 3/2, 3/2 | (2,1) | -580.92 | 1/108 | -7.35 | |
| mg | 6 | 1/2, 1/2 | (1,1) | -36.54 | 1/54 | -0.46 |
| 7 | 3/2, 1/2 | (1,1) | -25.54 | 1/108 | -0.32 | |
| 8 | 5/2, 3/2 | (2,2) | -24.39 | 1/60 | -0.31 | |
| 9 | 3/2, 3/2 | (2,2) | -14.98 | 3/20 | -0.19 | |
| 10 | 1/2, 3/2 | (1,1) | 5.85 | 1/108 | 0.07 | |
| 11 | 5/2, 5/2 | (2,2) | 10.52 | 7/30 | 0.13 | |
| 12 | 3/2, 3/2 | (1,1) | 16.85 | 5/108 | 0.21 | |
| 13 | 3/2, 5/2 | (2,2) | 19.93 | 1/60 | 0.25 | |
| isg.2 | 14 | 1/2, 3/2 | (1,2) | 571.79 | 5/108 | 7.23 |
| 15 | 3/2, 3/2 | (1,2) | 582.79 | 1/108 | 7.37 | |
| 16 | 3/2, 5/2 | (1,2) | 617.70 | 1/12 | 7.81 | |
| osg.2 | 17 | 1/2, 1/2 | (1,0) | 1534.05 | 1/27 | 19.41 |
| 18 | 3/2, 1/2 | (1,0) | 1545.05 | 2/27 | 19.55 |
Note. — (a) mg = main group of hyperfine components, isg = group of inner satellite hyperfine components, osg = group of outer satellite hyperfine components; (b) The frequencies in column (5) are given relative to 23694.5 MHz. (c) The hyperfine intensities are taken from Mangum et al. (2015) and Wang et al. (2020). The sum of these intensities is 1.0.
Intensity ratio method: Assuming the same excitation temperature and beam filling factor for all transitions under conditions of local thermodynamic equilbrium (LTE), the optical depth of the 14NH3(1, 1) line can be estimated from the measured intensity ratio between its main and satellite components (e. g., Ho & Townes, 1983; Mangum et al., 1992), respectively:
| (2) |
where is the peak value of the main beam brightness temperature; and refer to the main and satellite group components, respectively; () is the optical depth of the main group of hyperfine components, represents the expected intensity ratios of the satellite to the main group of hyperfine components, 0.278 and 0.222 for the inner and outer groups of HF features under conditions of LTE and optically thin line emission (see Ho & Townes, 1983; Mangum et al., 2015; Zhou et al., 2020). For our sample, we used formula (2) to calculate the 14NH3(1, 1) optical depth, according to the peak values of the main component and inner and outer satellite components. The mean value of the four inner and outer calculated NH3(1, 1) optical depths was taken for each source (Table 4).
For the 14NH3(2, 2) and (3, 3) transitions, there are only two sources with clearly separated satellite components (NGC 6334 I and G30.70). Here we also used the measured intensity ratio of the main and satellite components to determine their optical depth. For other sources, we could not use this method, since the hyperfine satellite components were too weak to be detected. However, the optical depth can be estimated from the intensity ratio of the main group of (2, 2) hyperfine components to that of the (1, 1) transition, assuming equal excitation temperatures and beam filling factors (Mangum et al., 1992):
| (3) |
HF fit method: The optical depth of the main hyperfine component can also be determined by the HF fit method in CLASS (”method” command). Here, the excitation temperature and Gaussian opacity profiles are assumed to be the same for all HF components. (the opacity summed over all the hyperfine components) can also be retrieved from CLASS. The relation between and () can be found in Eq. A8 by Mangum et al. (1992). Through adjusting parameters to fit the observed spectra, we derived the optical depths of the 14NH3(1, 1), (2, 2) and (3, 3) transitions for 12 sources with 15NH3 detections (see Table 4). For the other 3 sources among the sample (G10.47, Orion-KL, and W51D), the (1, 1), (2, 2) and (3, 3) optical depths could not be determined by the ”method” fits in CLASS, due to overlap of the satellite HF components with their main group of HF components (see Table 4).
Comparisons of the opacities derived from the two different methods, the intensity ratio and HF fit methods, reveal consistency with those from the HF fits in CLASS. Therefore we chose to take the optical depth from the intensity ratio method, where results could be obtained from all sources with detected 15NH3 emission for our analysis.
| Object | Telescope | Intensity ratio method | HF fitting | ||||||||
|---|---|---|---|---|---|---|---|---|---|---|---|
| (1, 1) | (2, 2) | (3, 3) | (1, 1) | (2, 2) | (3, 3) | K | K | K | K | ||
| G032.04 | TMRT | 1.73(0.06) | 0.54(0.02) | 0.21(0.01) | 1.83(0.16) | 0.2(0.4) | 0.1(0.3) | 22(10) | 11 (6) | 19(3) | 21(4) |
| G053.23 | TMRT | 1.44(0.04) | 0.21(0.01) | … | 1.05(0.06) | 0.11 (0.04) | … | 16(8) | 9 (3) | 11(5) | 12(4) |
| G081.75 | TMRT | 1.35(0.01) | 0.54(0.01) | 0.12(0.01) | 1.56(0.15) | 0.47(0.06) | 0.13(0.04) | 27(9) | 13 (5) | 19(2) | 22(3) |
| Effelsberg | 1.47(0.01) | 0.53(0.01) | 0.12(0.01) | 1.65(0.12) | 0.42(0.08) | 0.15(0.04) | 29(10) | 13 (7) | 19(3) | 22(3) | |
| G121.29 | TMRT | 1.02(0.01) | 0.33(0.01) | 0.16(0.01) | 1.1(30.01) | 0.48(0.03) | 0.12(0.12) | 20(9) | 13 (6) | 17(3) | 20(4) |
| G30.70 | TMRT | 2.23(0.03) | 1.38(0.02) | 0.43(0.01) | 3.27(0.06) | 2.23(0.11) | 0.12(0.04) | 26(8) | 14 (5) | 20(2) | 25(2) |
| NGC 6334 I | TMRT | 1.75(0.02) | 0.42(0.01) | 0.42(0.01) | 2.06(0.03) | 4.72(0.19) | 4.3(0.4) | 25(11) | 12 (6) | 14(1) | 17(1) |
| Orion-KL | TMRT | 2.4(0.4) | 4.8(0.8) | 7.4(1.0) | … | … | … | 36(17) | 42 (11) | 27(3) | 40(4) |
| Effelsberg | 2.56(0.01) | 5.52(0.02) | 8.56(0.02) | … | … | … | 35(14) | 46 (10) | 26(3) | 37(4) | |
| W51D | TMRT | 2.15(0.05) | 0.51(0.01) | 0.86(0.01) | … | … | … | 21(12) | 14 (10) | 18(4) | 22(4) |
| Effelsberg | 2.1(0.2) | 1.56(0.02) | 1.61(0.02) | … | … | … | 30(22) | 20 (16) | 24(4) | 34(5) | |
| G016.92 | Effelsberg | 1.14(0.03) | 0.41(0.01) | 0.12(0.01) | 1.27(0.07) | 1.0(0.3) | 0.1(0.3) | 27(13) | 12 (6) | 19(8) | 23(9) |
| G10.47 | Effelsberg | 2.21(0.05) | 1.35(0.03) | 1.80(0.03) | … | … | … | 29(8) | 18 (6) | 24(5) | 32(6) |
| G188.79 | Effelsberg | 0.22(0.01) | 0.16(0.01) | 0.13(0.01) | 0.23(0.05) | 0.1(0.5) | 0.10(0.03) | 21(10) | 14 (6) | 21(17) | 28(22) |
| G35.14 | Effelsberg | 1.16(0.02) | 0.51(0.01) | 0.26(0.01) | 1.42(0.02) | 1.12(0.19) | 0.2(0.8) | 29(19) | 12 (4) | 20(2) | 24(2) |
| NGC 1333 | Effelsberg | 1.01(0.02) | 0.12(0.01) | 0.15(0.01) | 1.1(0.2) | 0.7(0.2) | 0.13(0.11) | 19(7) | 10 (4) | 12(5) | 14(5) |
| G000.19 | Effelsberg | 1.12(0.10) | 0.25(0.02) | 0.11(0.02) | 1.22(0.16) | 2.6(1.1) | 0.1(0.5) | 17(5) | 11 (3) | 16(8) | 18(9) |
| Barnard-1b | Effelsberg | 2.25(0.02) | 0.22(0.01) | 0.11(0.02) | 2.82(0.02) | 0.33(0.10) | 1.16(0.10) | 14(4) | 8 (3) | 10(3) | 11(3) |
Note. — Column (1): source name; Column (2): telescope; Column (3) - (5): the peak optical depths of the (, ) = (1, 1), (2, 2) and (3, 3) main group of hyperfine components of 14NH3, from the intensity ratio method; Columns (6) – (8): peak optical depths from the HF fitting procedure provided by CLASS; Column (9): the rotational temperature , from the intensity ratio method; Column (10): from the rotation diagram method; Column (11): from the improved HF fitting method (see Sect. 3.2.2) for 11 sources, that of NGC 6334 I from RADEX calculation and that of the remaining three sources with blended spectral features ( G10.47, Orion-KL and W51D) from the HyperFine Group Ratio (HFGR) method (see details in Sect. 3.2.2); Column (12): the kinetic temperature calculated from the empirical formula displayed in Appendix B of Tafalla et al. (2004).
3.2.2 Temperature
Rotational temperature: NH3 inversion lines have been widely used as tracers of the temperature in molecular clouds (Li et al., 2003; Tafalla et al., 2004; Mangum et al., 2015; Wang et al., 2020). Three main methods, either starting from observed or modeled spectra, are used to estimate the rotational temperature, including the intensity ratio method, the rotation diagram method and the improved HF fitting method. These are outlined below:
a) Intensity ratio method: This method was described in Sect. 3.2.1 to determine the optical depth, according to the intensity ratio of main and satellite components from the observed spectra. According to the determined opacities and the measured brightness temperatures of the (1, 1) and (2, 2) main groups of hyperfine components, the rotational temperature T can be derived (Ho & Townes, 1983; Mangum et al., 1992; Ragan et al., 2011) by:
| (4) |
The results for those 15 sources with 15NH3 detections are listed in column 9 of Table 4.
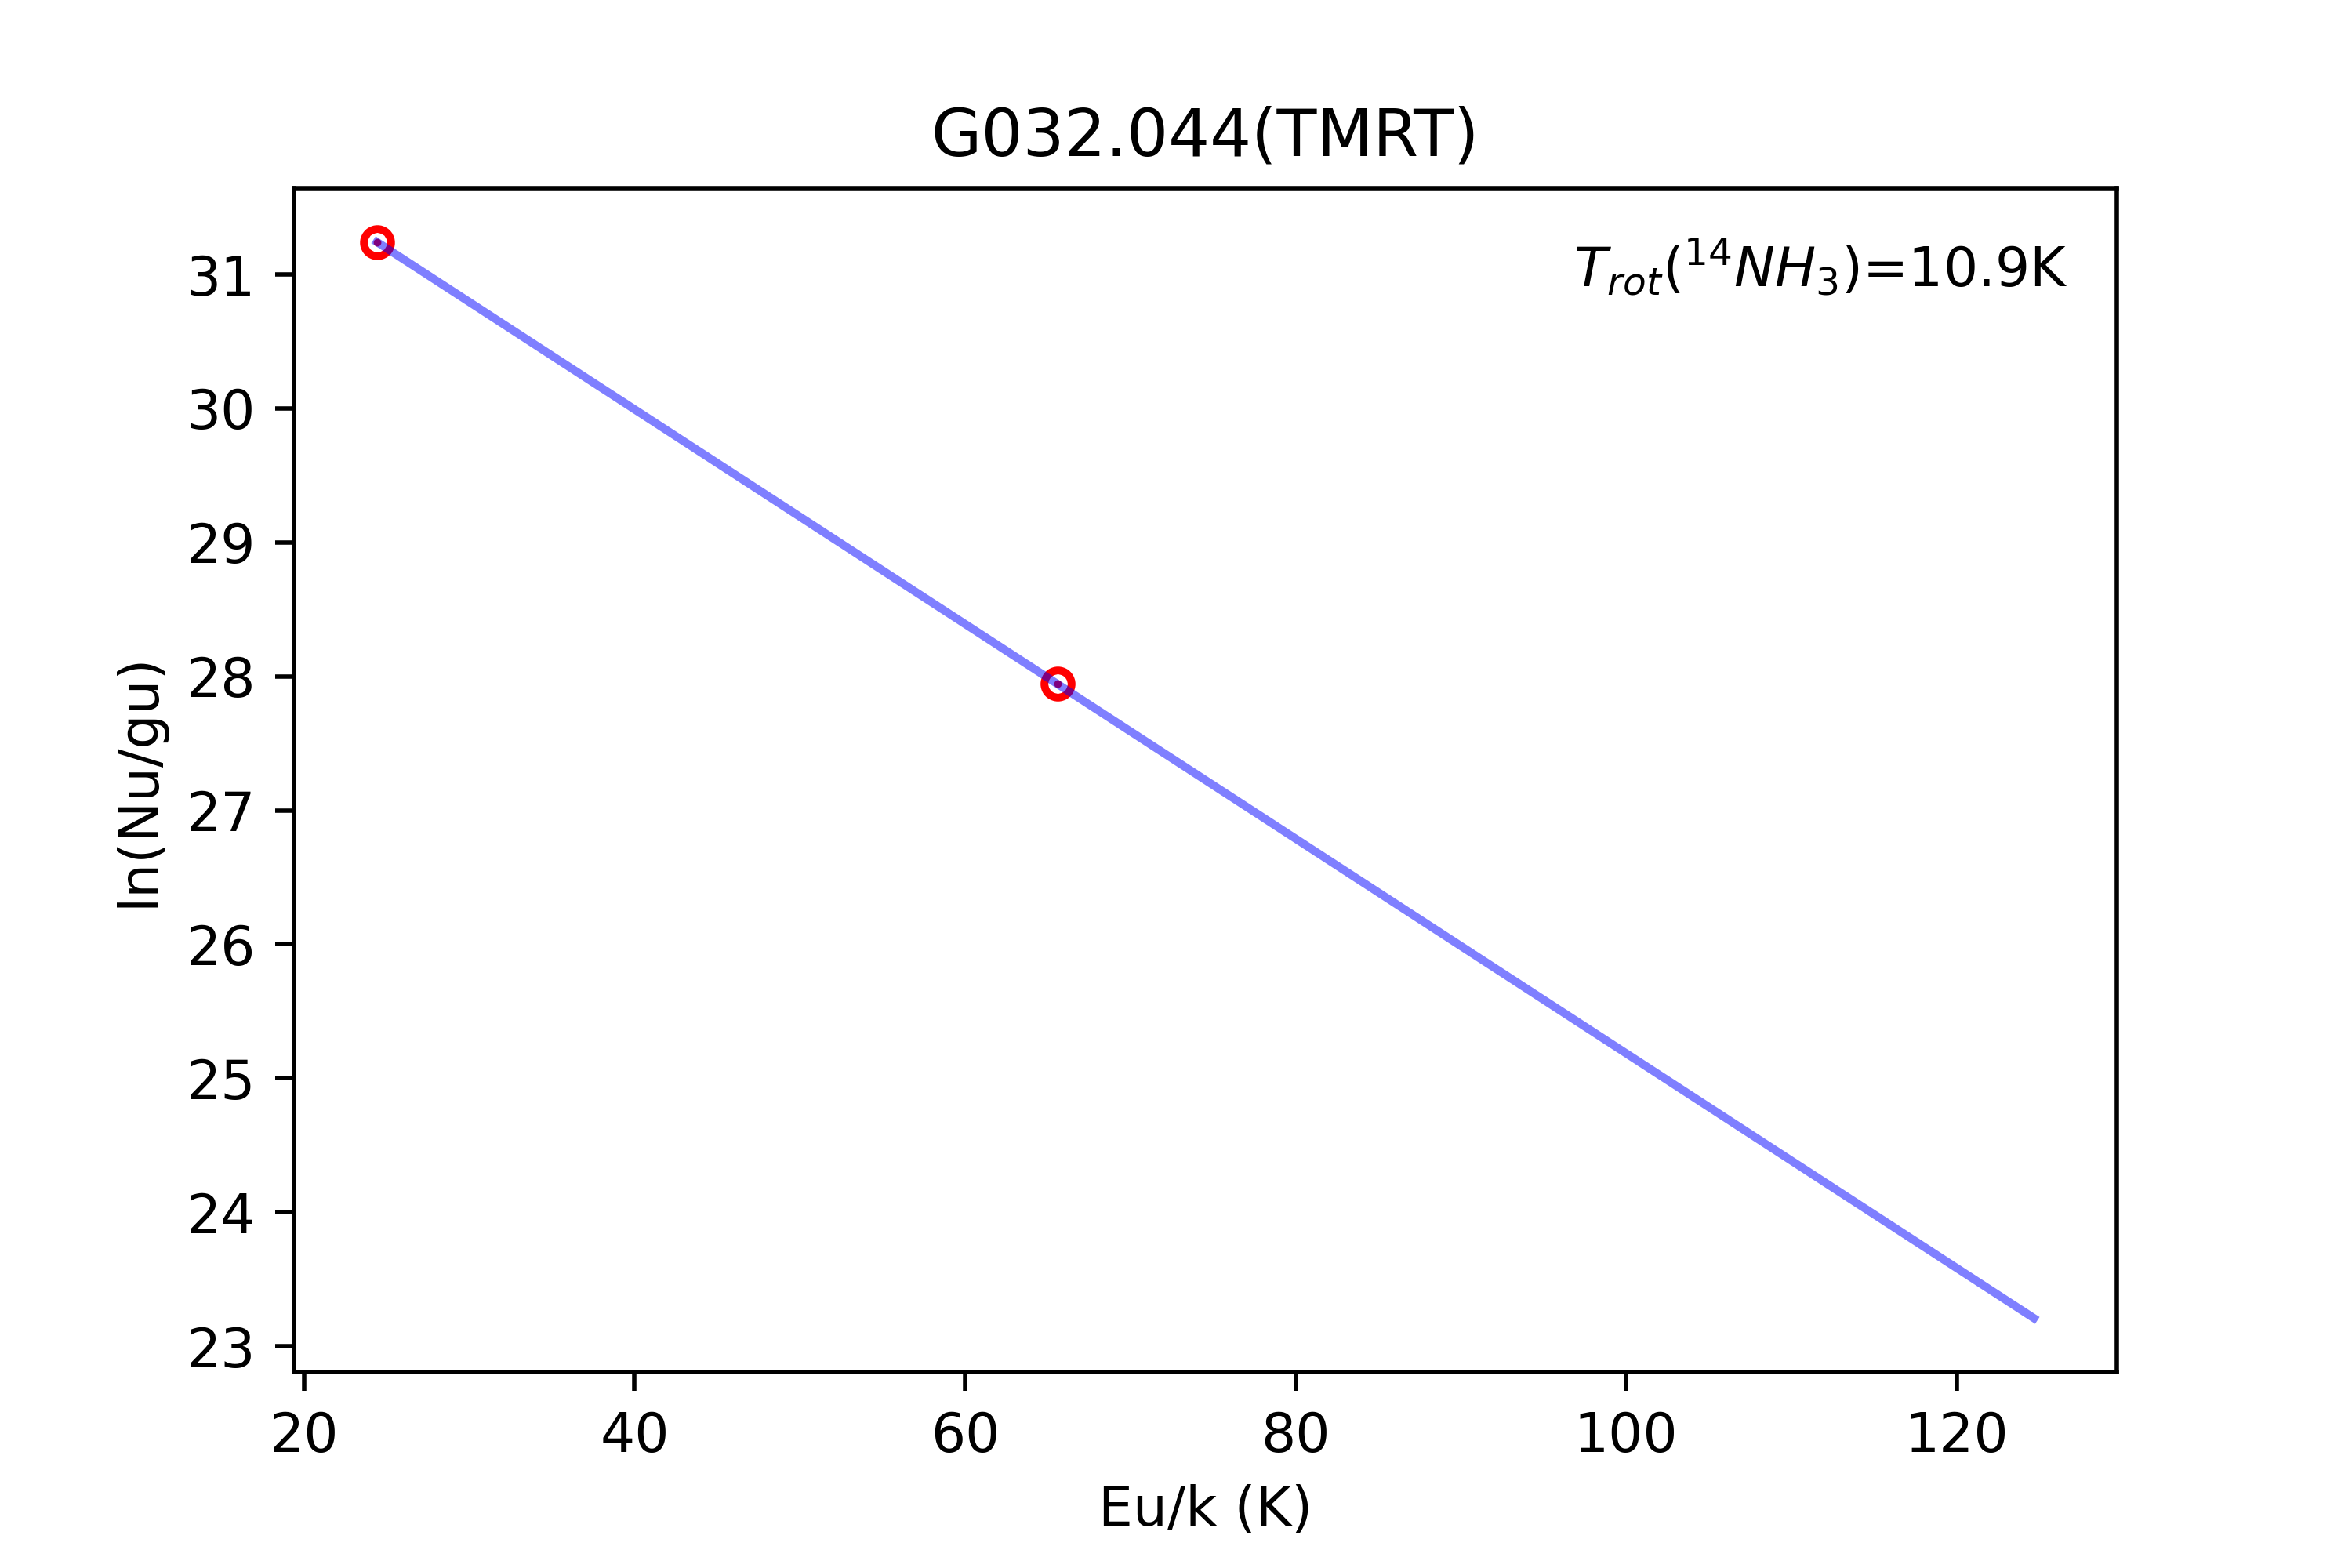
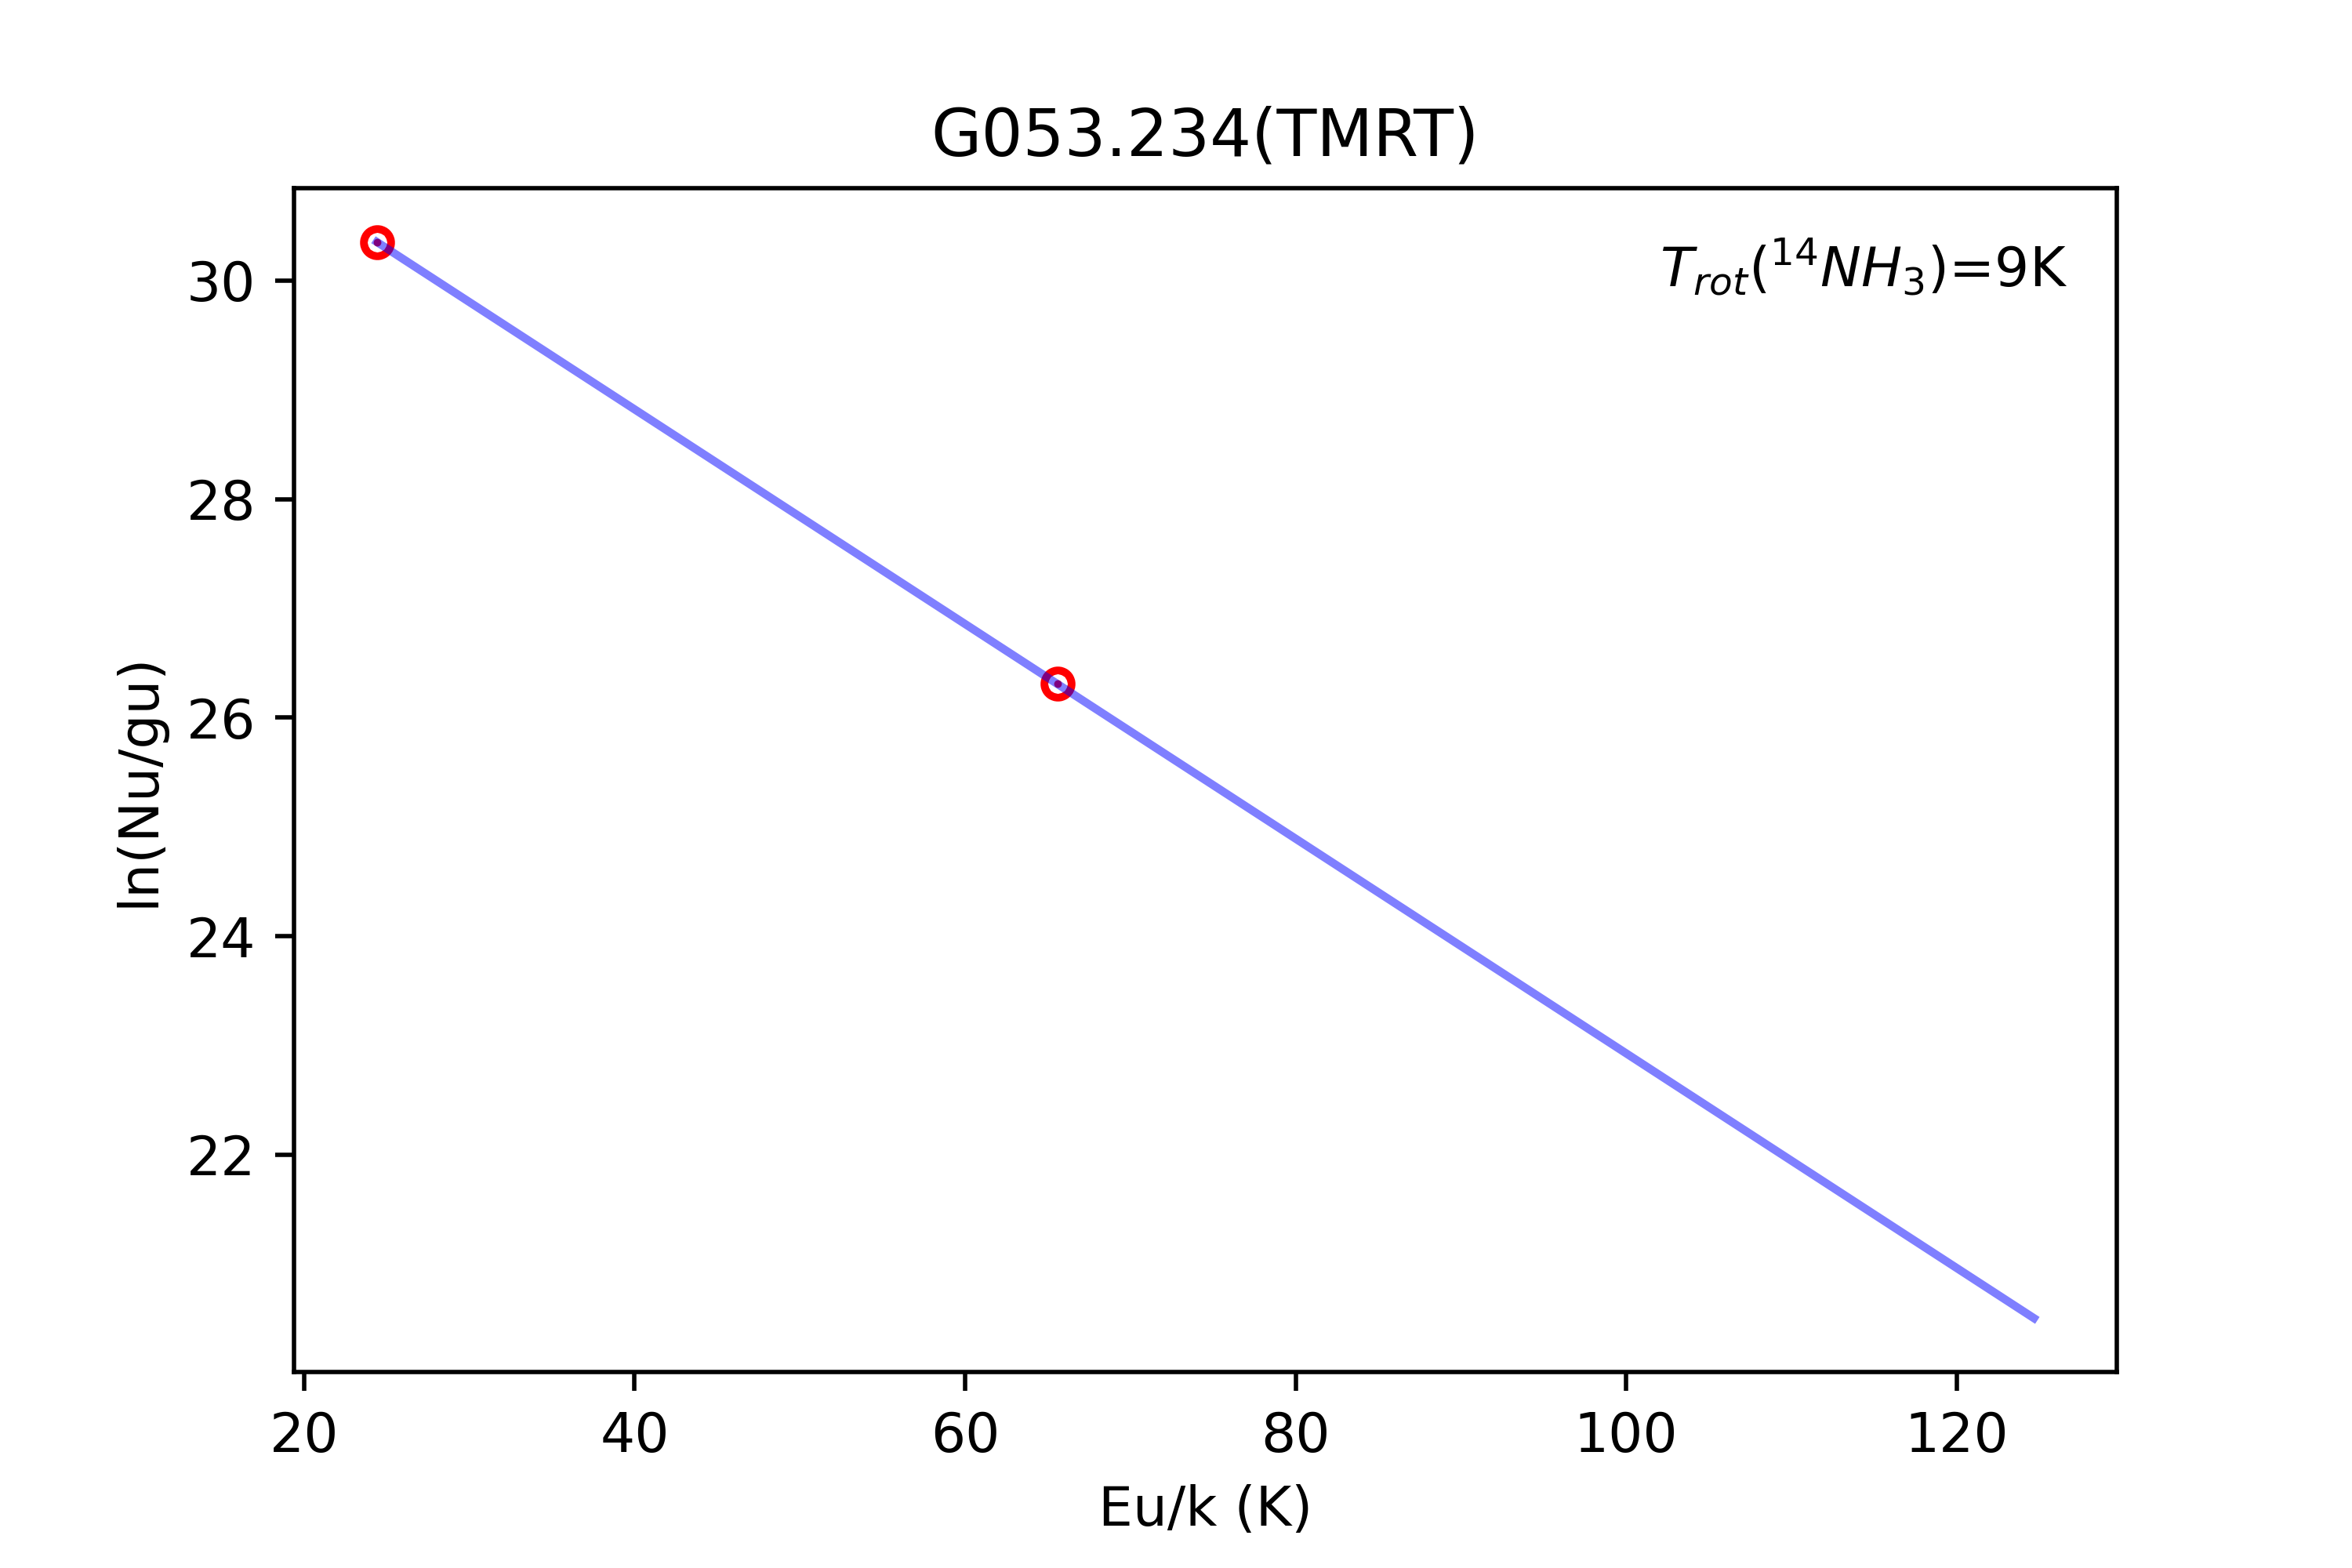
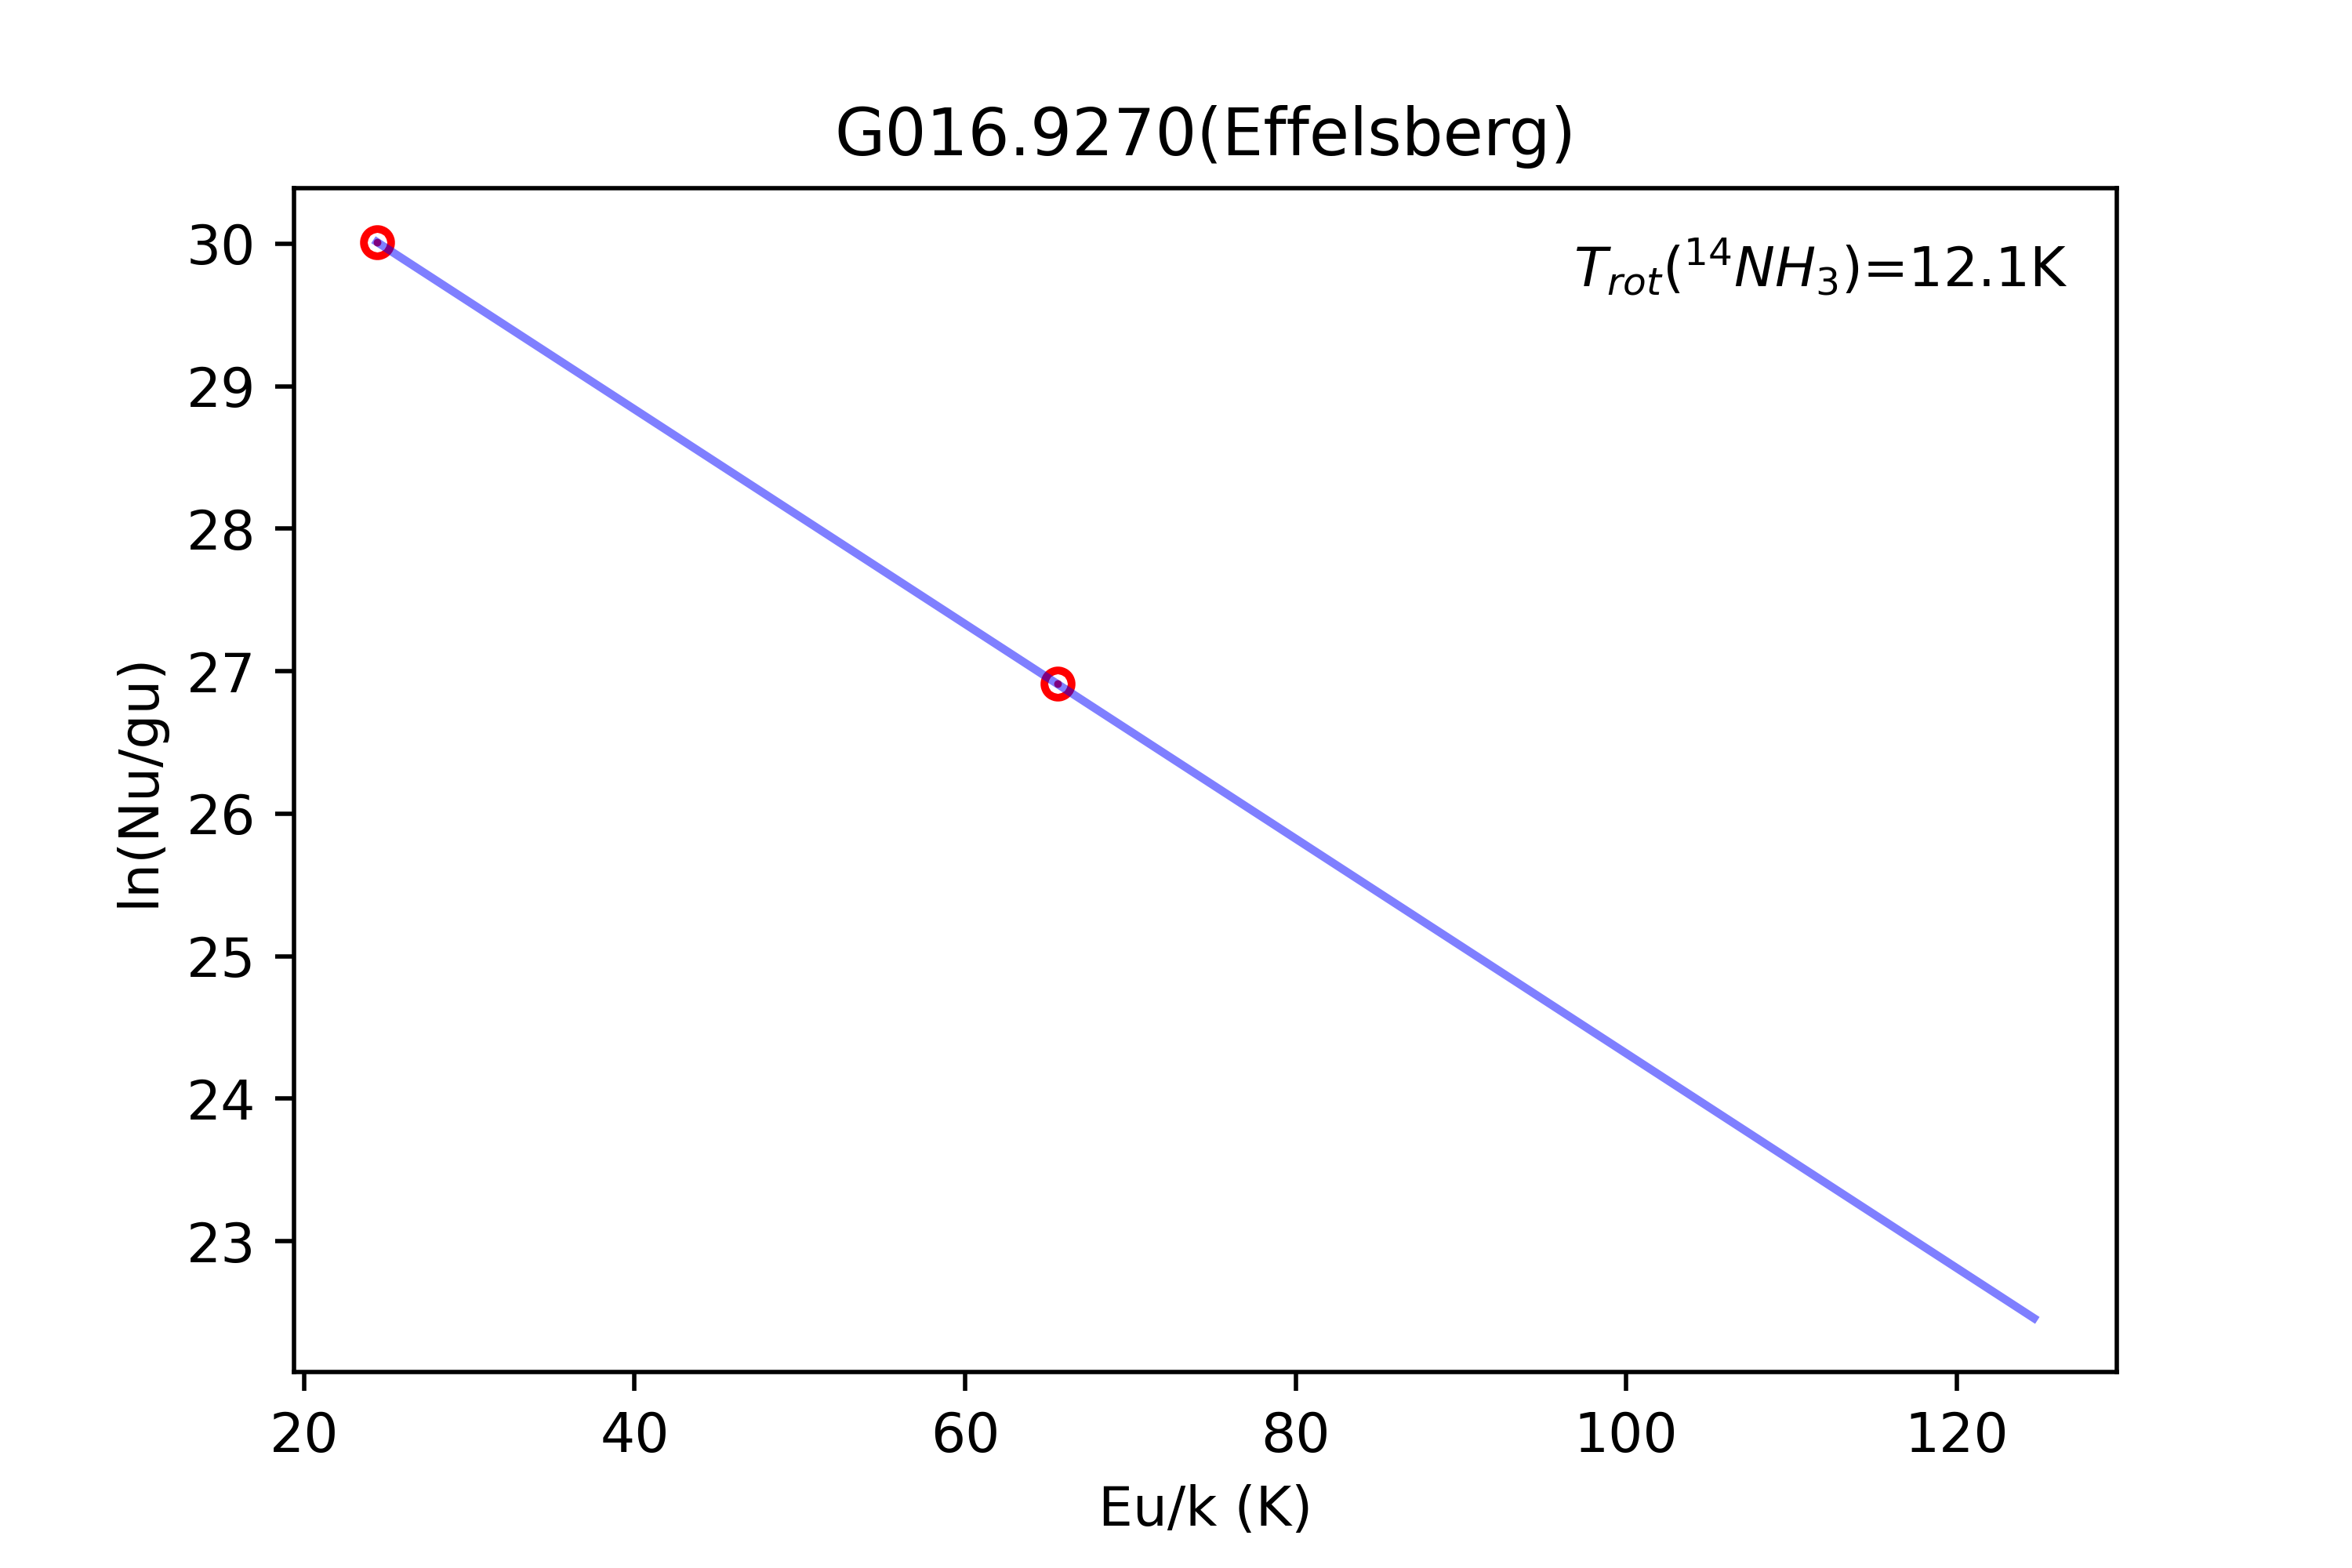
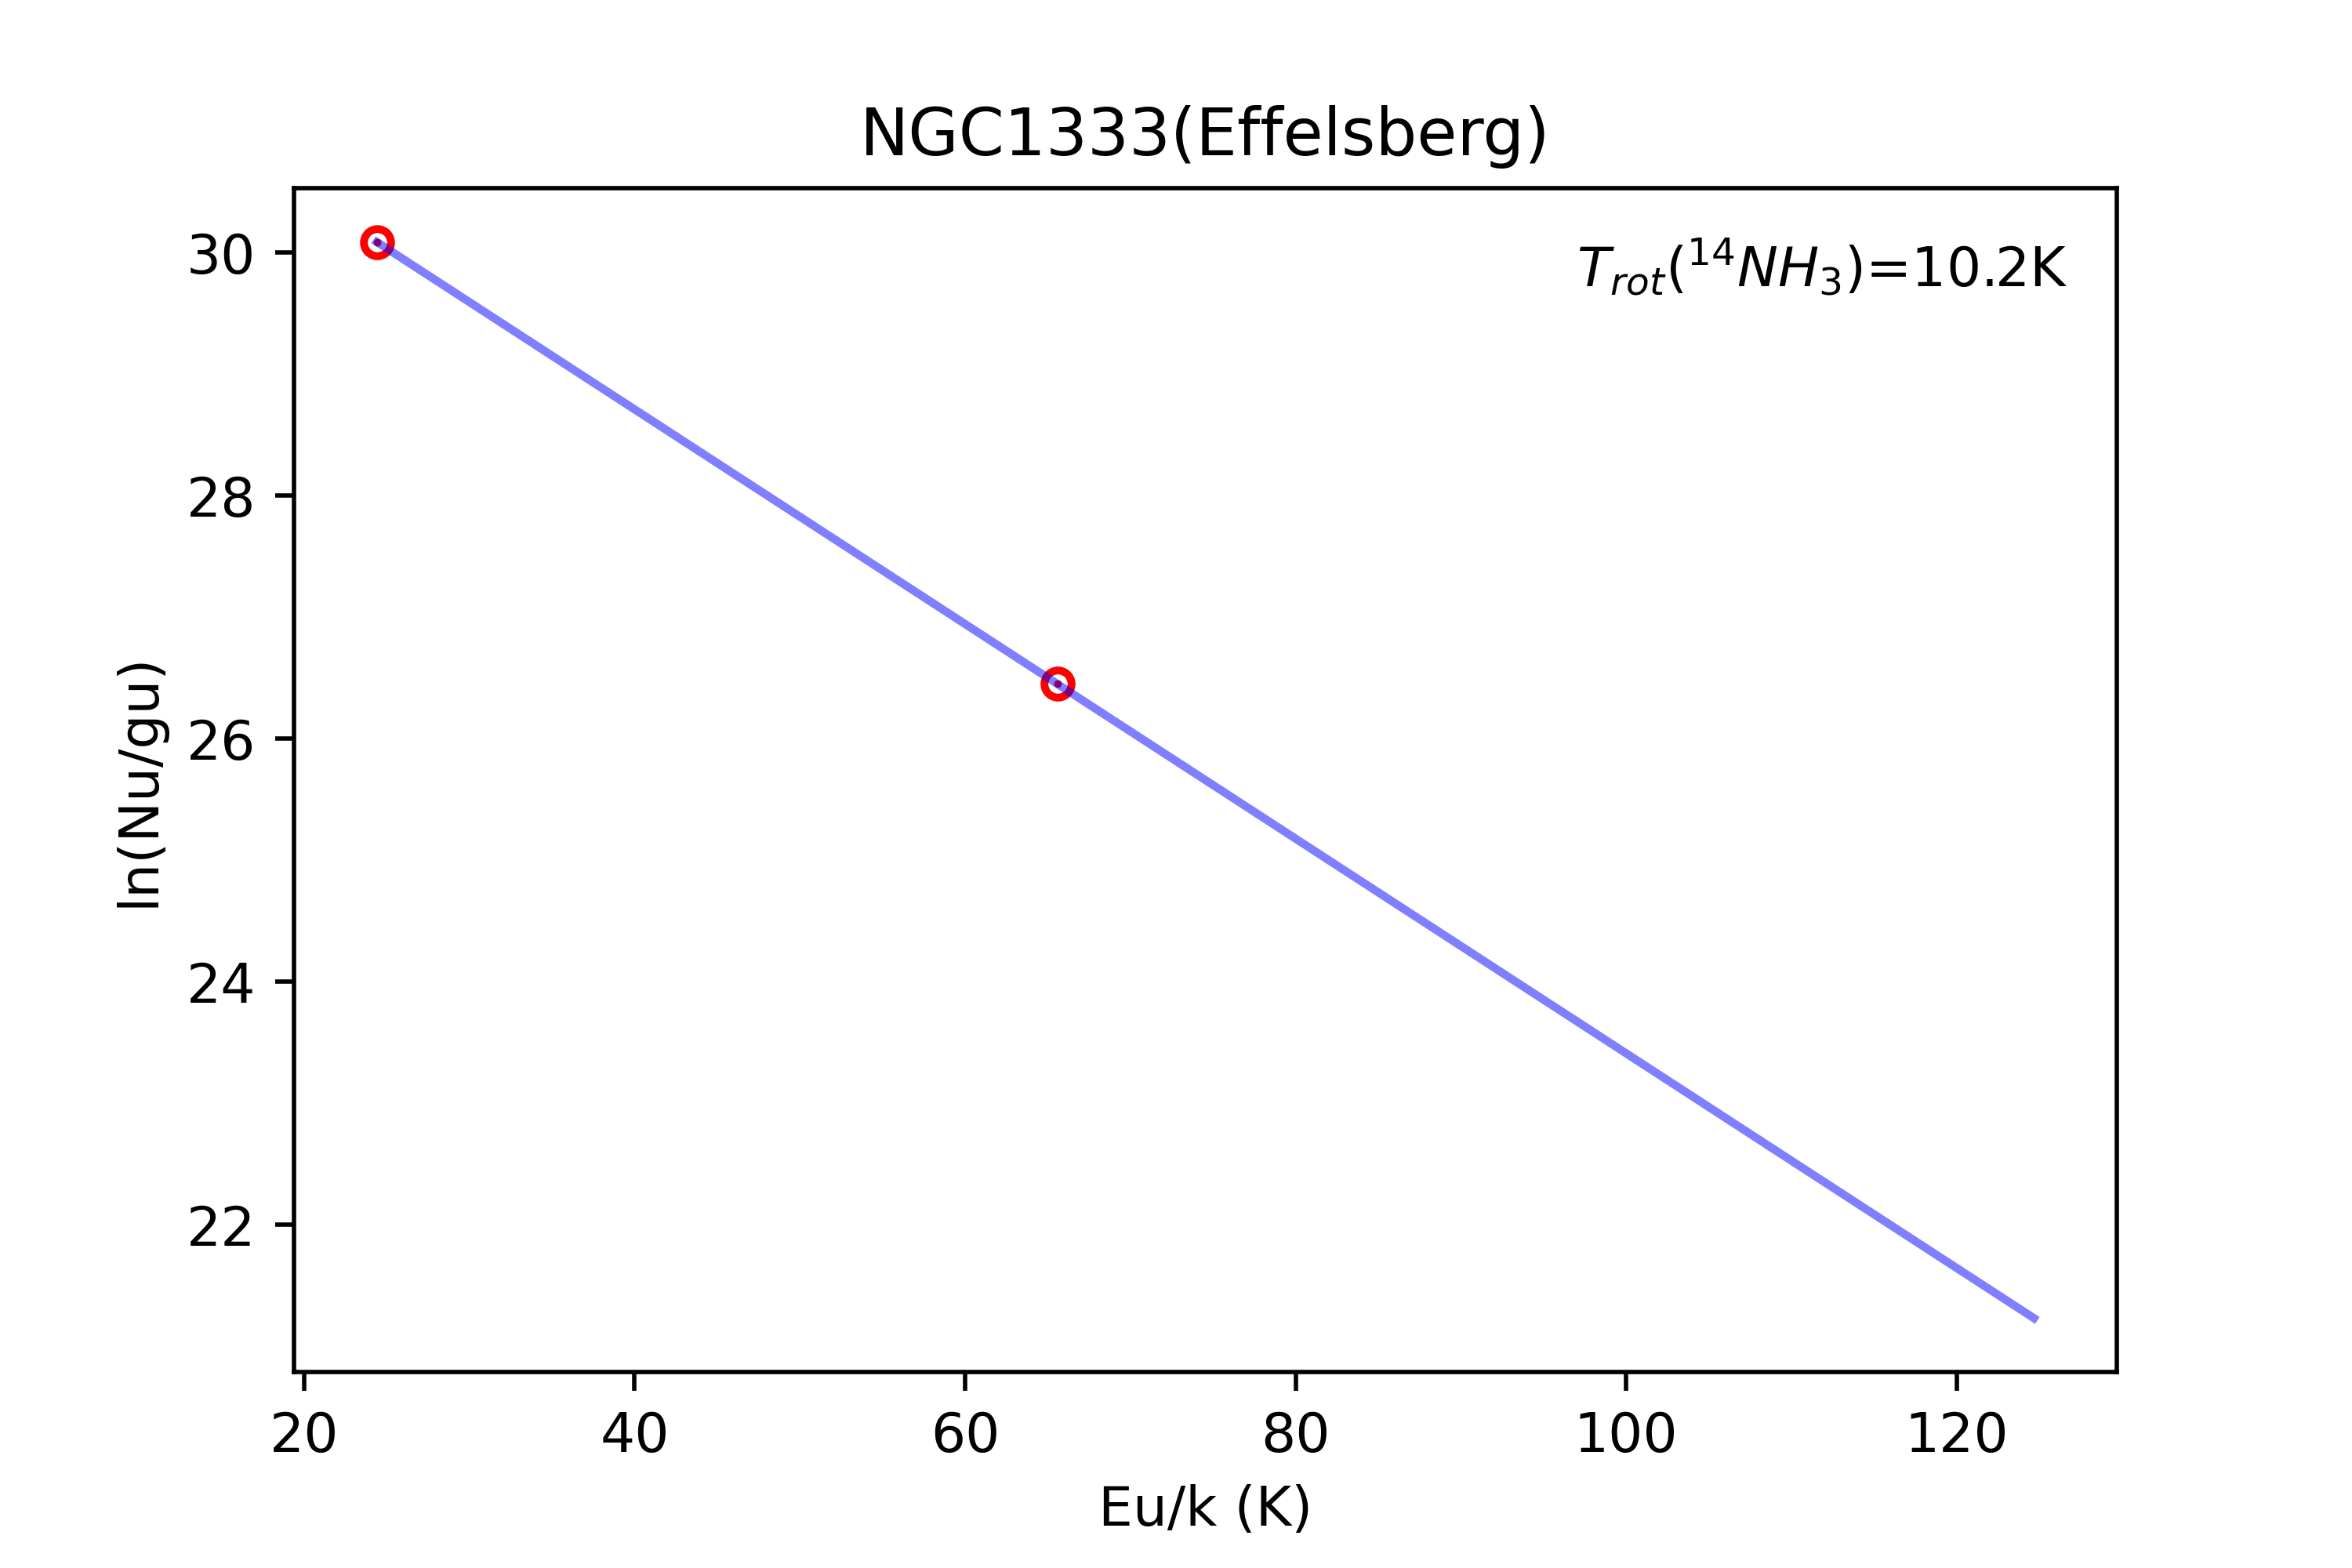
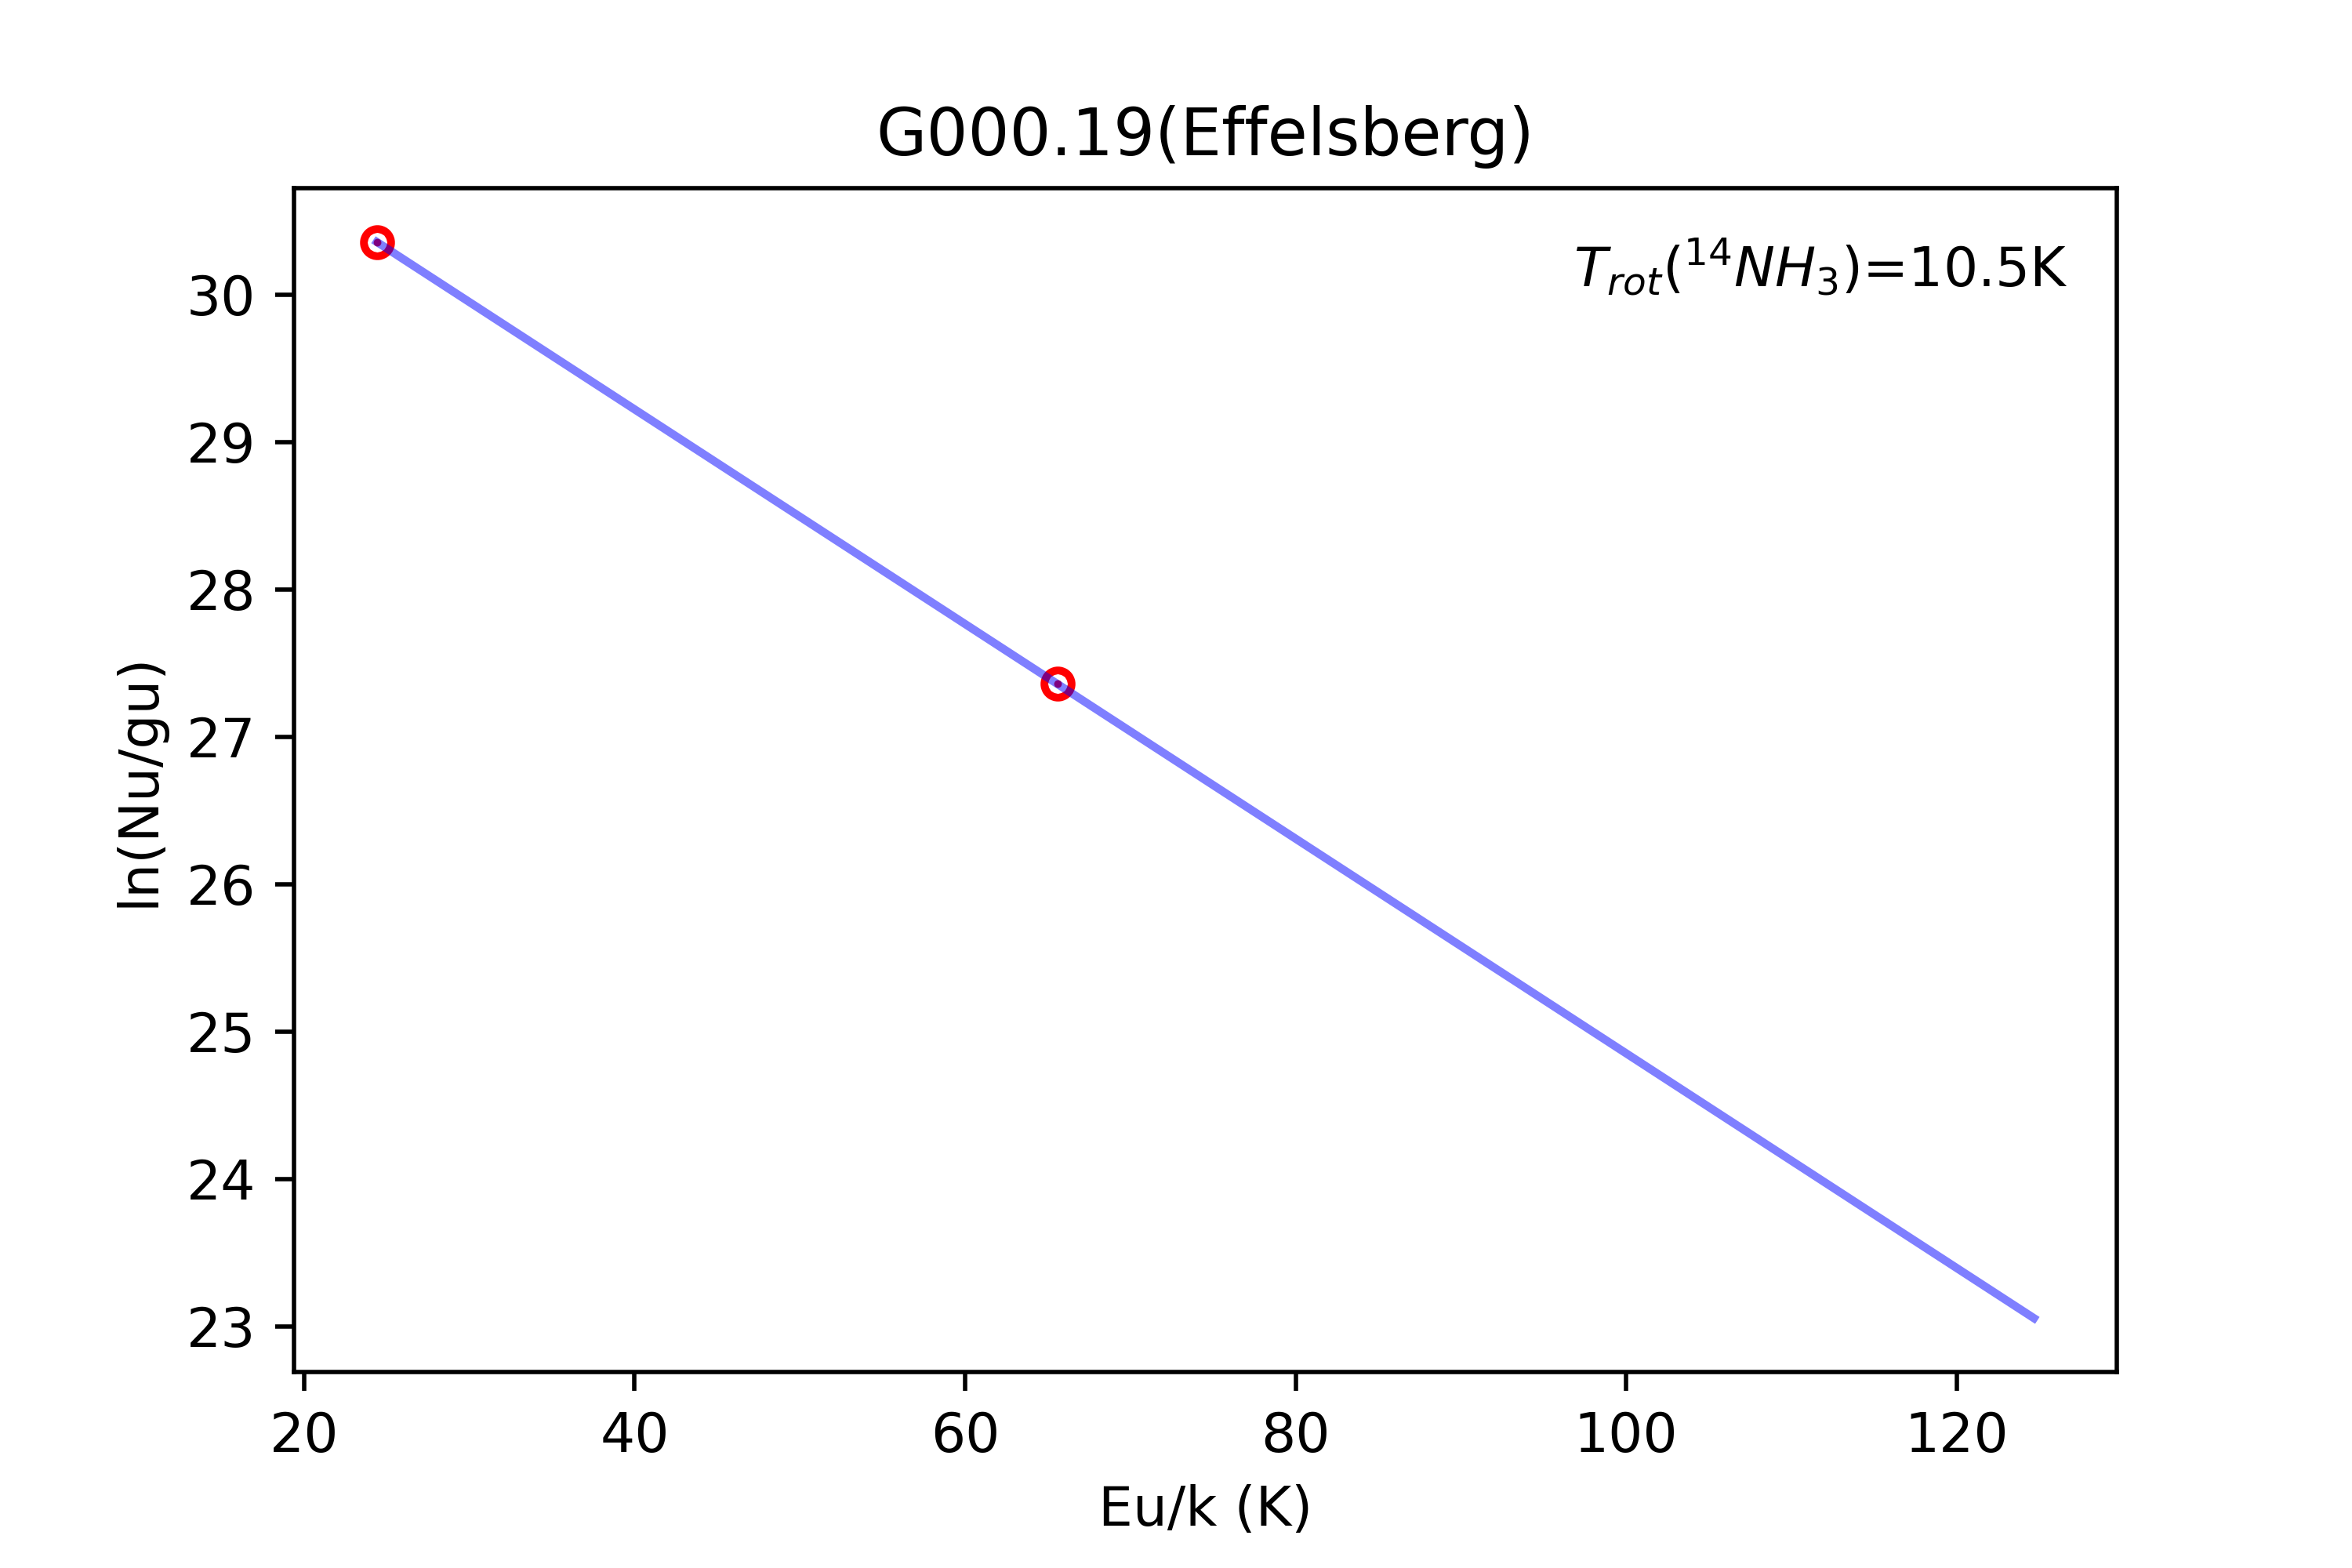
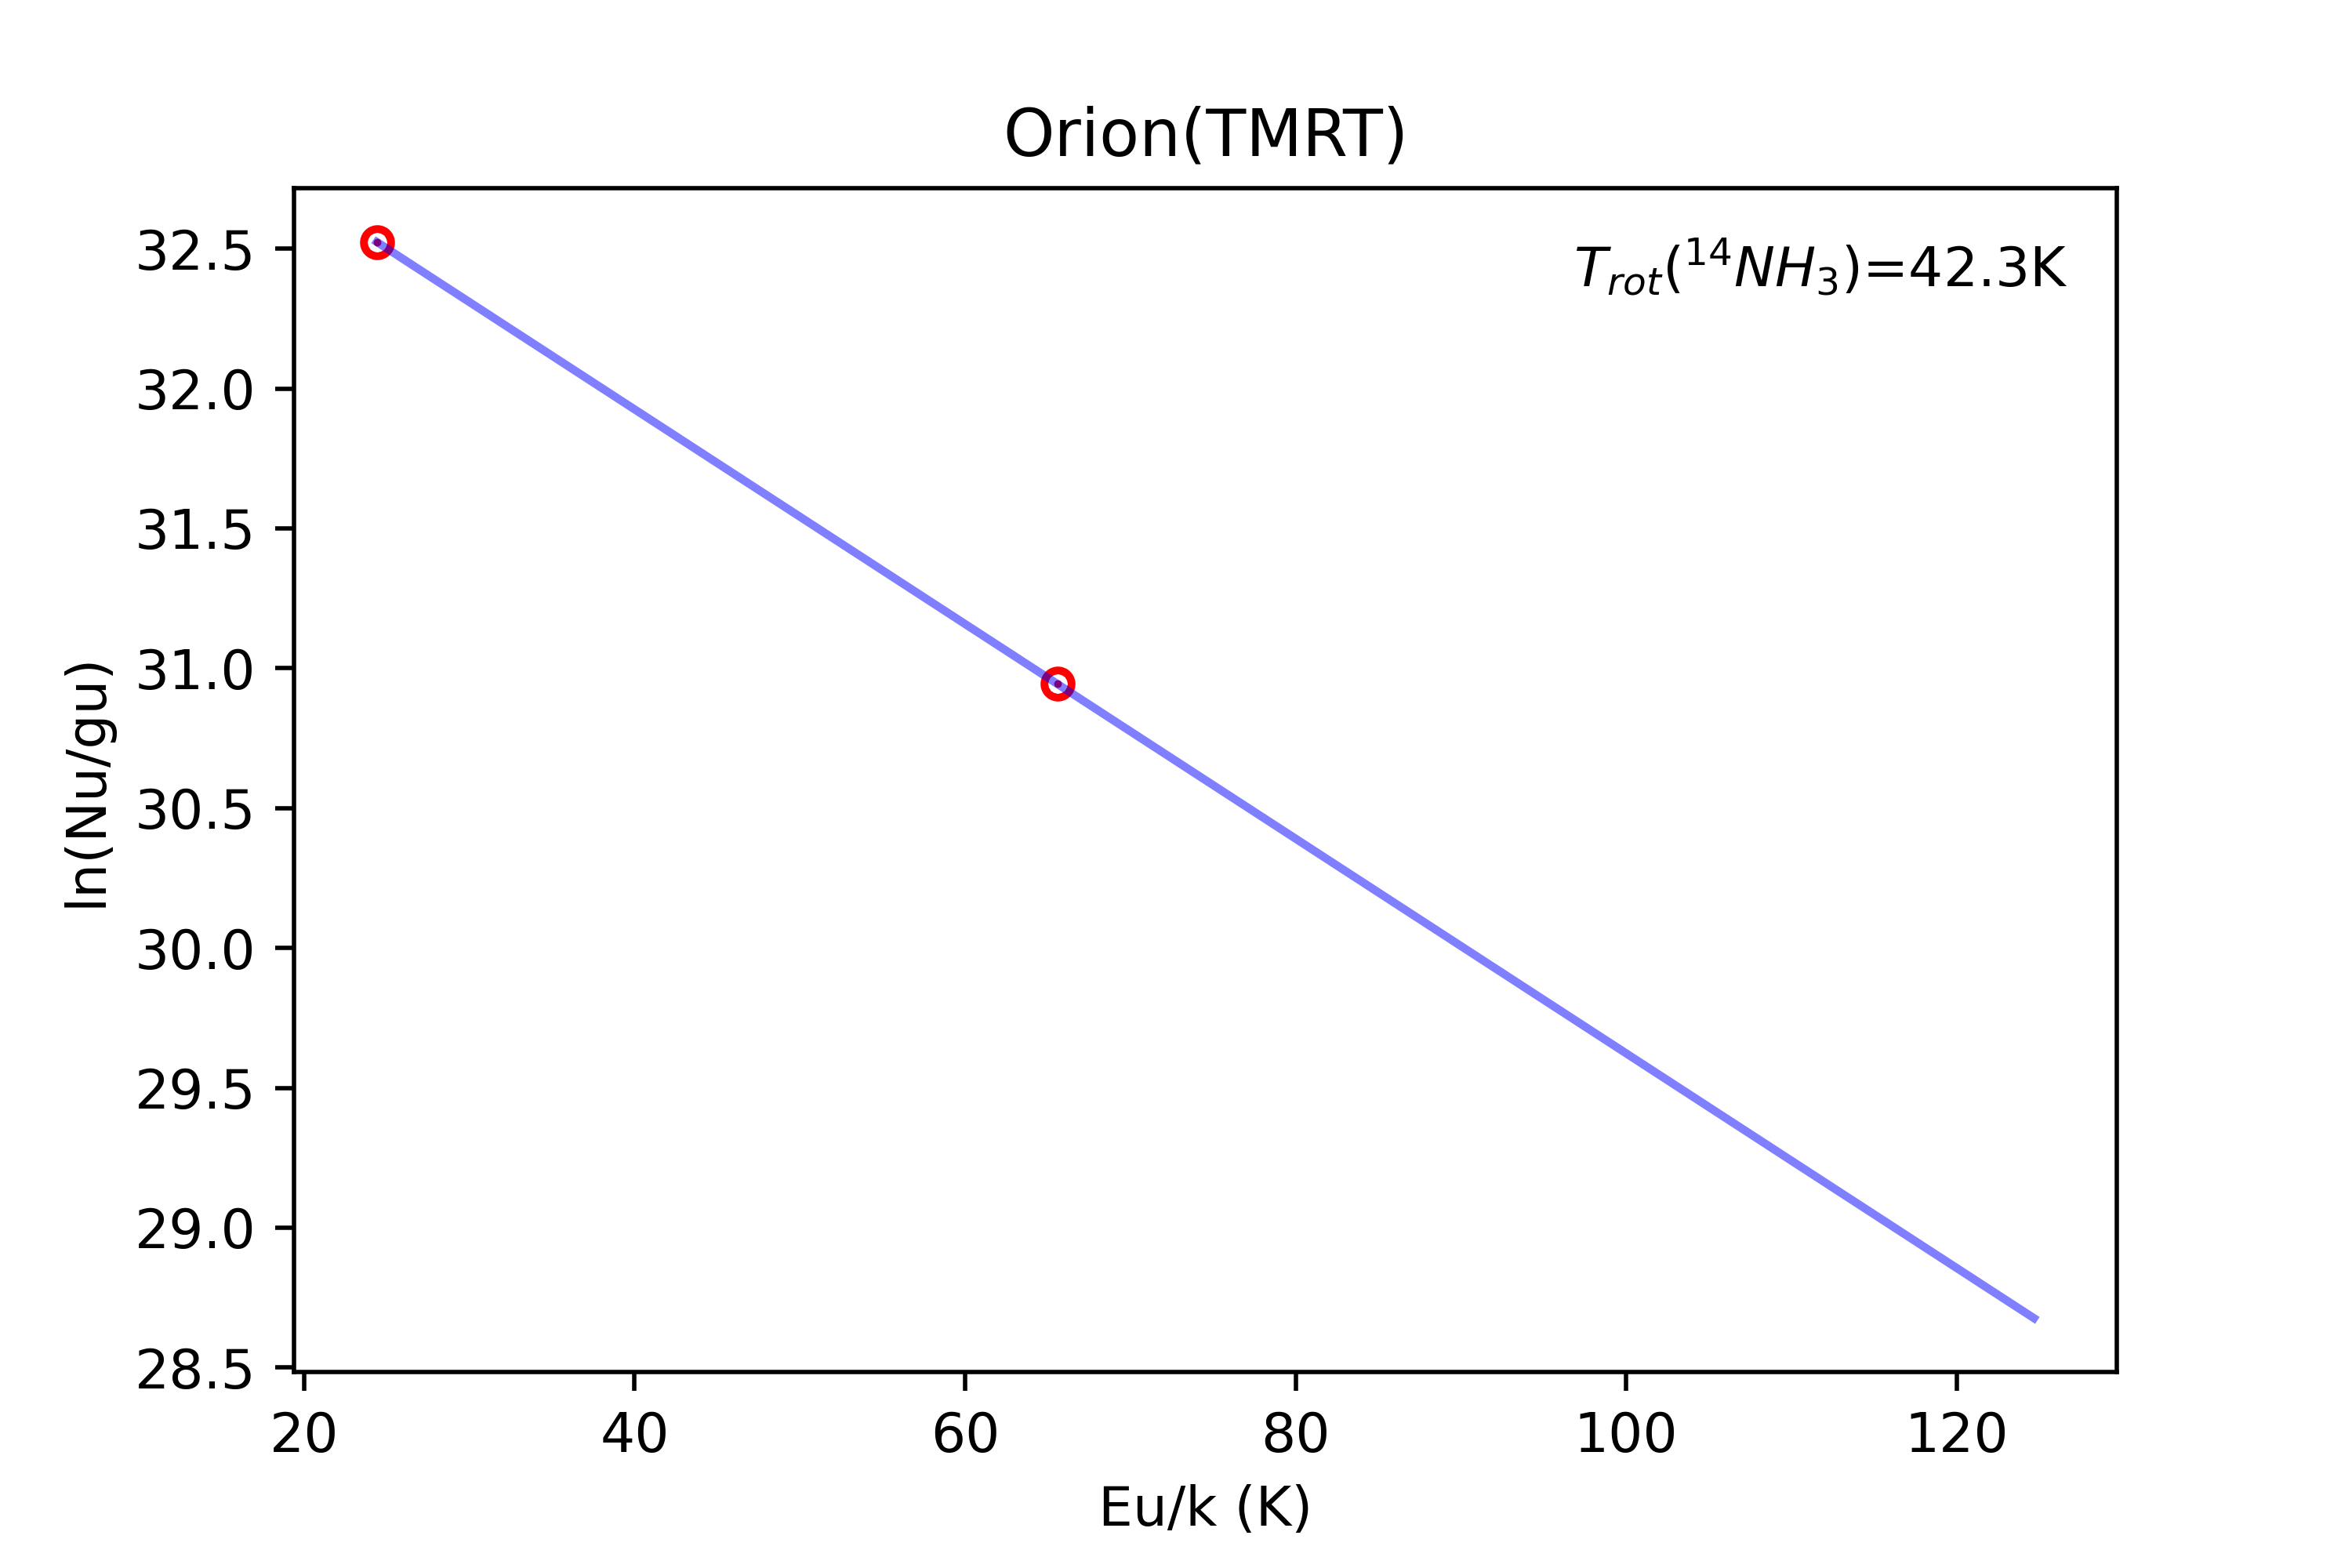
b) Rotation diagram method: For optically thin lines in LTE, the relation of the column density and energy above the ground state in the upper inversion doublet (the two states of a given inversion doublet are only about 1 K apart) with the corresponding values for the lower inversion doublet can be determined on the basis of measured line temperatures. The rotation diagram, i.e., a plot of the upper level column density per statistical weight of a number of molecular energy levels, as a function of their energy above the ground state, is frequently used to estimate the temperature and the total column density (e. g., Mangum et al., 1992; Goldsmith & Langer, 1999). For the () = (1, 1) and (2, 2) transitions of 14NH3, the column density in the upper state for both transitions can be written, assuming optically thin emission:
| (5) |
| (6) |
where (1, 1) and (2, 2) are the column density in the upper state for the () = (1, 1) and (2, 2), respectively; is the Boltzmann constant, is the speed of light and is the Planck constant. is the Einstein coefficiant for spontaneous emission, which was obtained from the JPL Molecular Spectroscopy Catalog (Pickett et al., 1998) and is listed in Table 1.
Optical depths of the 14NH3 transition lines of our sources are mostly large ( 1 for 14 out of 15 sources in NH3(1, 1), see Table 4), so that the assumption of optically thin emission only provides lower limits to the 14NH3 abundances and may underestimate the real abundance ratio 14NH3/15NH3. Thus an optical depth correction should be considered for the upper state column density (Goldsmith & Langer, 1999; Mei et al., 2020) yielding: = . For the (1, 1) and (2, 2) lines, the relation between the opacity-corrected total column density and in a Boltzmann distribution should be:
| (7) |
and
| (8) |
where and are the degeneracy and the energy of the upper state, respectively (see Table 1). () is the partition function from the JPL Molecular Spectroscopy Catalog (Pickett et al., 1998).
Thus
| (9) |
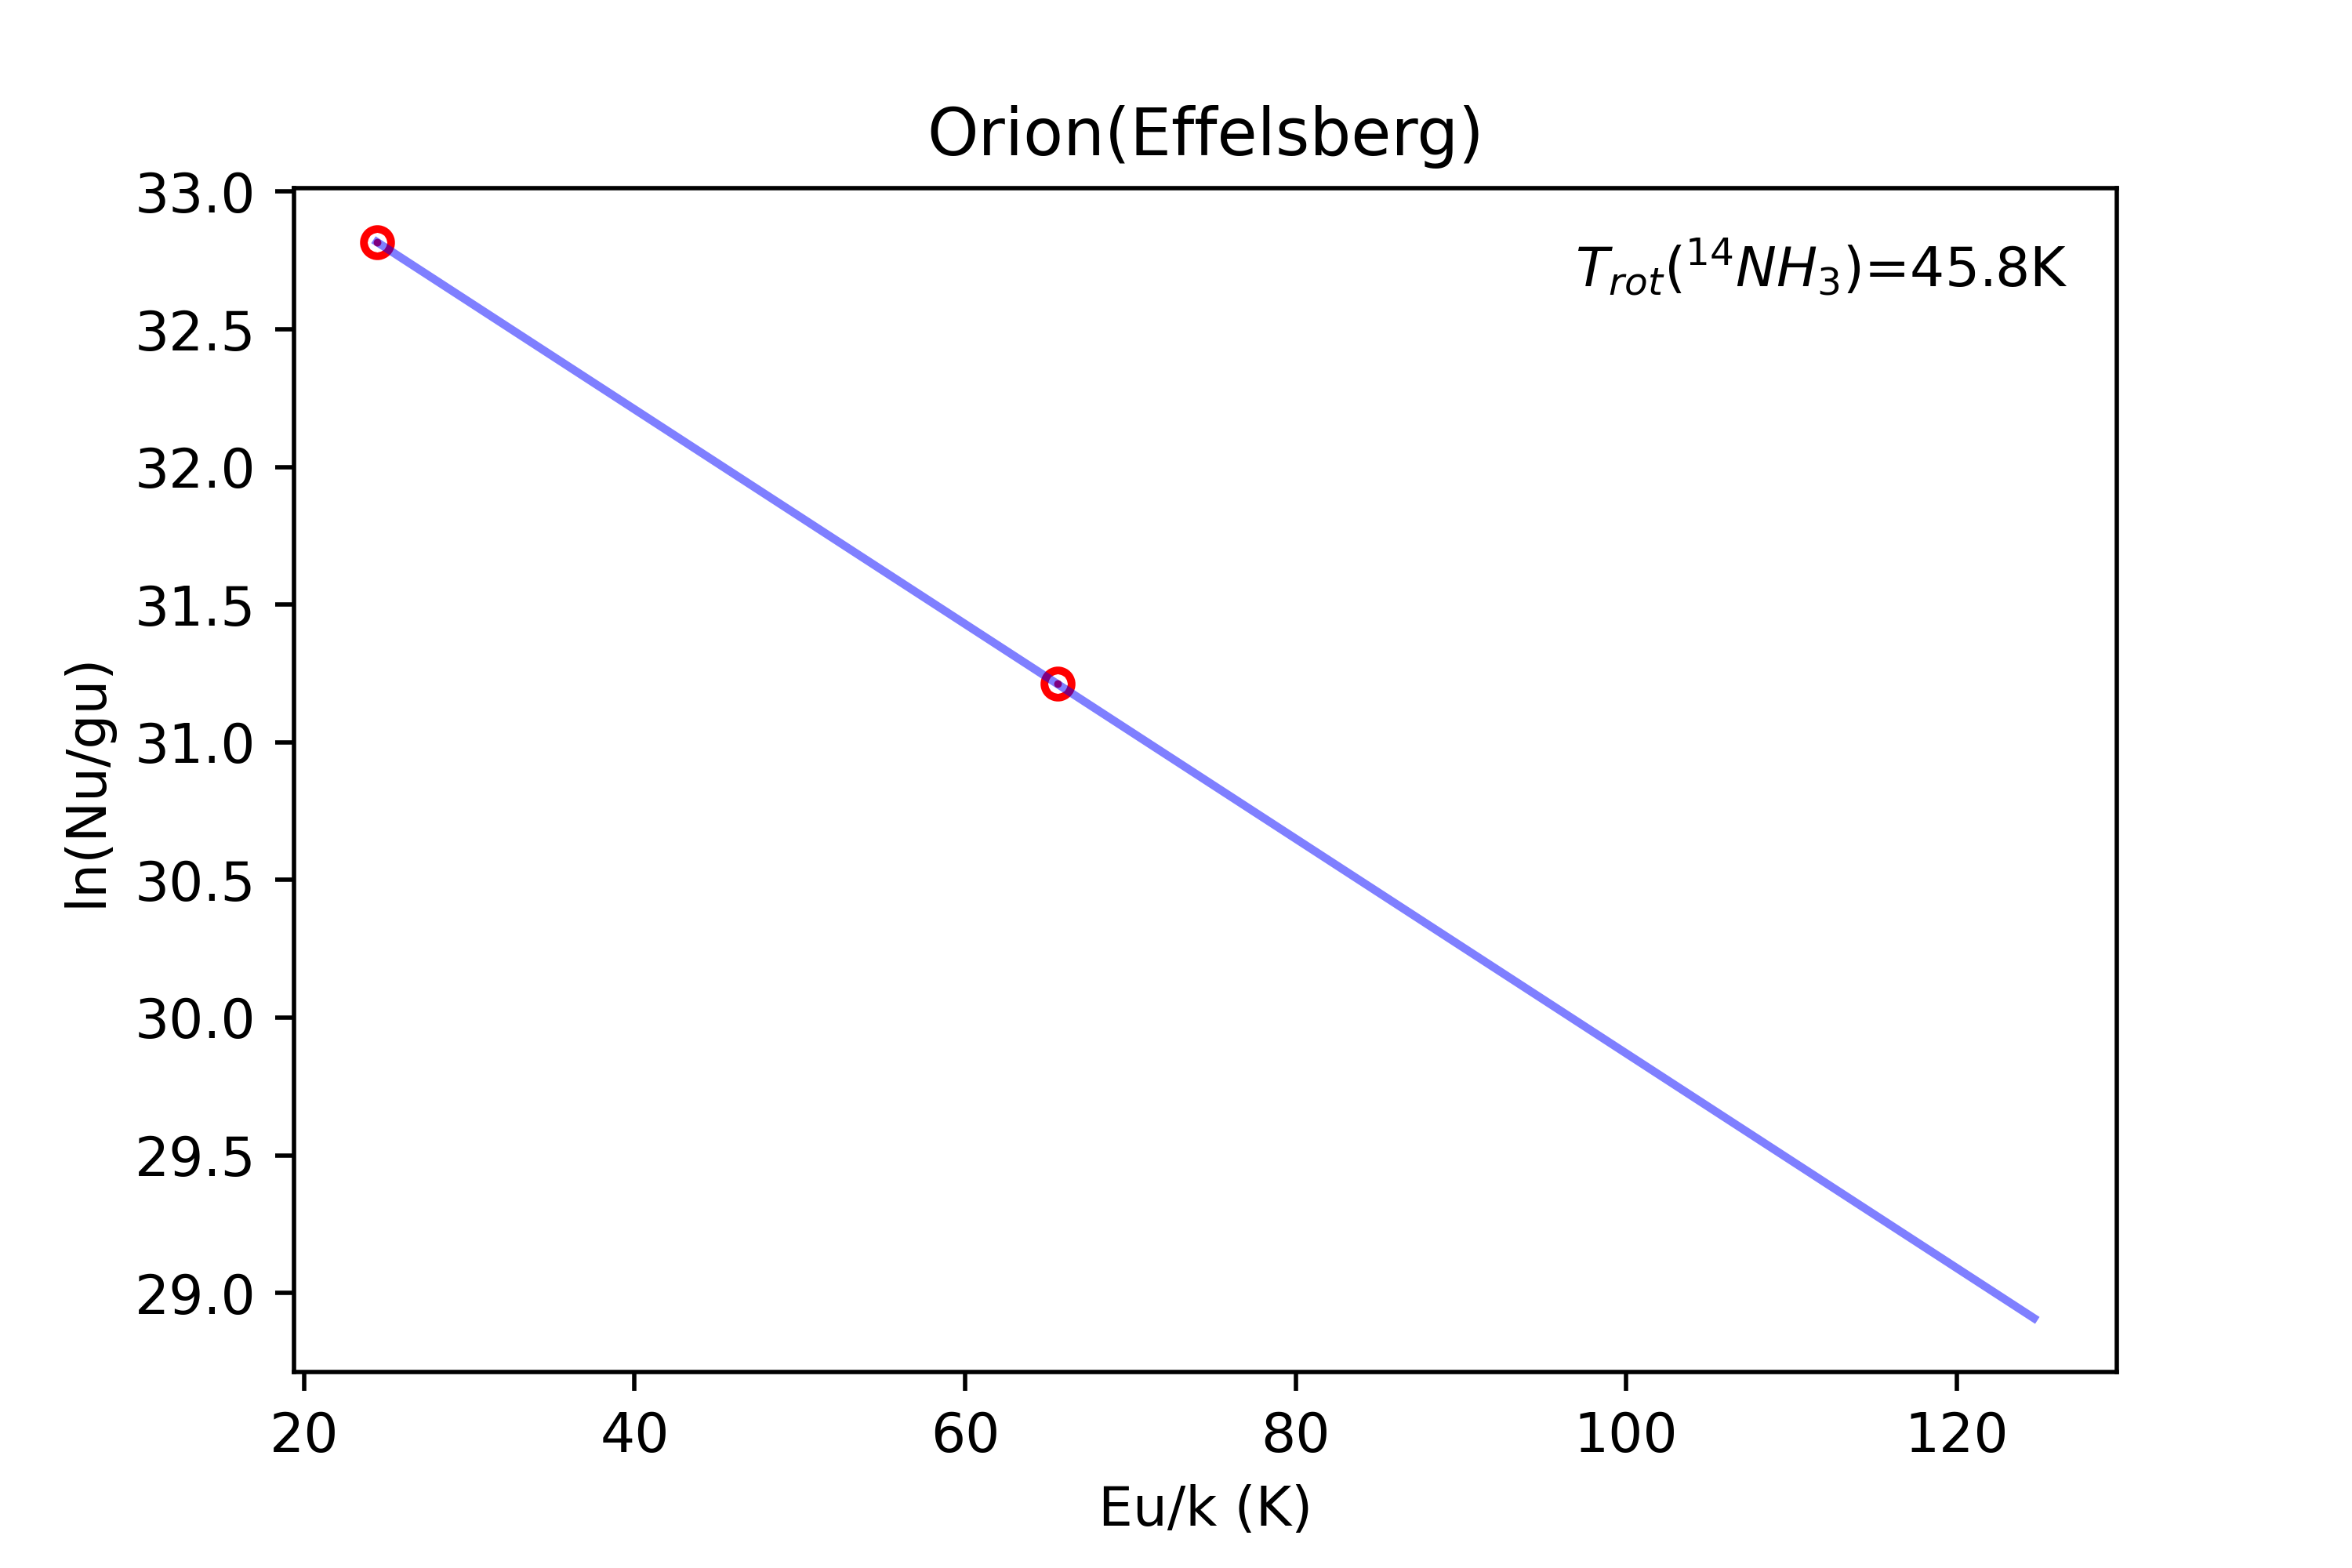
For the measured (1, 1) and (2, 2) line intensities of our sample, we plotted the rotation diagram, i.e., against . The rotational temperature depends on the reciprocal value of the slope (see Figure 3 and Equation (9)). The results from this method for our sample are listed in column 10 of Table 4. The uncertainties on the rotational temperatures were derived applying error propagation based on equation (9).


c) Improved HF fitting method: This is the updated version of Method in CLASS (Sect. 3.2.1), which can fit (1, 1) and (2, 2) lines simultaneously. It is included in the Python Package Pyspeckit (Ginsburg et al., 2011). Based on the model spectra produced by the radiative transfer function (), we can adjust model parameters (the excitation temperature, the line width, etc.) to fit the observed spectra and determine the rotational temperature (Rodgers & Charnley et al., 2008; Camacho et al., 2020; Keown et al., 2017). is the beam filling factor assumed to be unity, J and J represent the radiation field corresponding to the excitation temperature and the cosmic microwave background temperature of 2.73 K, , is the optical depth as a function of frequency. The following assumptions are adopted for the HF fitting (Ginsburg et al., 2011):
(1) Gaussian profiles for the opacity as a function of frequency;
(2) same excitation temperature for the 14NH3(1, 1) and (2, 2) transitions;
(3) the lines all have the same width;
(4) the multiplet components do not overlap;
(5) LTE is prevailing.
Fixed values for the relative opacities and the frequency shift of each HF component were taken (Mangum et al., 2015). We used the package Pyspeckit to fit the spectra of sources, excluding those three sources with overlapping hyperfine components (G10.47, W51D and Orion-KL, see Sect. 3.2.1). With the exception of NGC 6334 I, the 14NH3(1, 1) and (2, 2) groups of the spectra can be fitted well simultaneously (see Figure 4). For NGC 6334 I, the two groups of spectra could not be fitted simultaneously with the same value of the excitation temperature. To check possible non-LTE effects, we made RADEX444https://home.strw.leidenuniv.nl/~moldata/radex.html calculations for this source and got a value of 14.3 K with excitation temperatures of 17.1 and 7.3 K for the (1, 1) and (2, 2) lines. The rotation temperature is consistent with the result of 12.2 6.1 K by the rotation diagram method (LTE), which is used in our later analysis.
For those three sources with blended hyperfine components in the spectra (G10.47, Orion-KL and W51D), an improved method, the Hyperfine Group Ratio (HFGR) method, was used to calculate the rotational temperature. This was developed recently by Wang et al. (2020), which can effectively reduce the uncertainties related to spectral profiles, since only the integrated intensity ratios of groups of hyperfine components are utilized without spectral fitting. The results for these three sources by the HFGR method, NGC 6334 I by RADEX and others by the HF fitting are listed in column 11 of Table 4.
Comparing the results from the three different methods mentioned above, we find that results from the rotation diagram method are systematically lower than those from the other two methods. The results from the intensity ratio method have systematically larger uncertainties, which may be mainly caused by uncertainties of the optical depth, estimated from the ratio of the peak of the main group of hyperfine components and the HF groups giving rise to the inner and outer satellites. Based on good fitting of the observed spectra in Figure 4, thus we took the values that arise from the improved HF fitting method for later analysis. For those three sources with blended components, their values were taken from the HFGR recipe (see Table 4).
![[Uncaptioned image]](/html/2208.03977/assets/G032_.png)
![[Uncaptioned image]](/html/2208.03977/assets/G053_.png)
![[Uncaptioned image]](/html/2208.03977/assets/G081TMRT_.png)
![[Uncaptioned image]](/html/2208.03977/assets/G121_.png)
![[Uncaptioned image]](/html/2208.03977/assets/G30_.png)
![[Uncaptioned image]](/html/2208.03977/assets/G016_.png)
![[Uncaptioned image]](/html/2208.03977/assets/G188_.png)
![[Uncaptioned image]](/html/2208.03977/assets/G35_.png)
The kinetic temperature: The conversion of the rotational temperature () into the gas kinetic temperature () is a critical part of the NH3 inversion line analysis. Tafalla et al. (2004) provided a detailed analysis in their Monte Carlo models using the collision coefficients of Danby et al. (1988) and results from an NH3 line analysis and derived an expression for accurate gas temperature estimates:
| (10) |
Using this relation between - and results derived from the above analysis, we calculated the kinetic temperature values for the sample, which are given in column 12 of Table 4.
3.2.3 Column density
As shown in the rotation diagram analysis in Sec. 3.2.2, with the assumption of LTE, the values were obtained from the 14NH3(1, 1) and (2, 2) line intensities and corresponding optical depths for our sample. According to the derived values and formulae (7) or (8), we can further use the (1, 1) or (2, 2) line intensities and corresponding parameters of , Q() and to determine opacity-corrected total column densities of 14NH3.
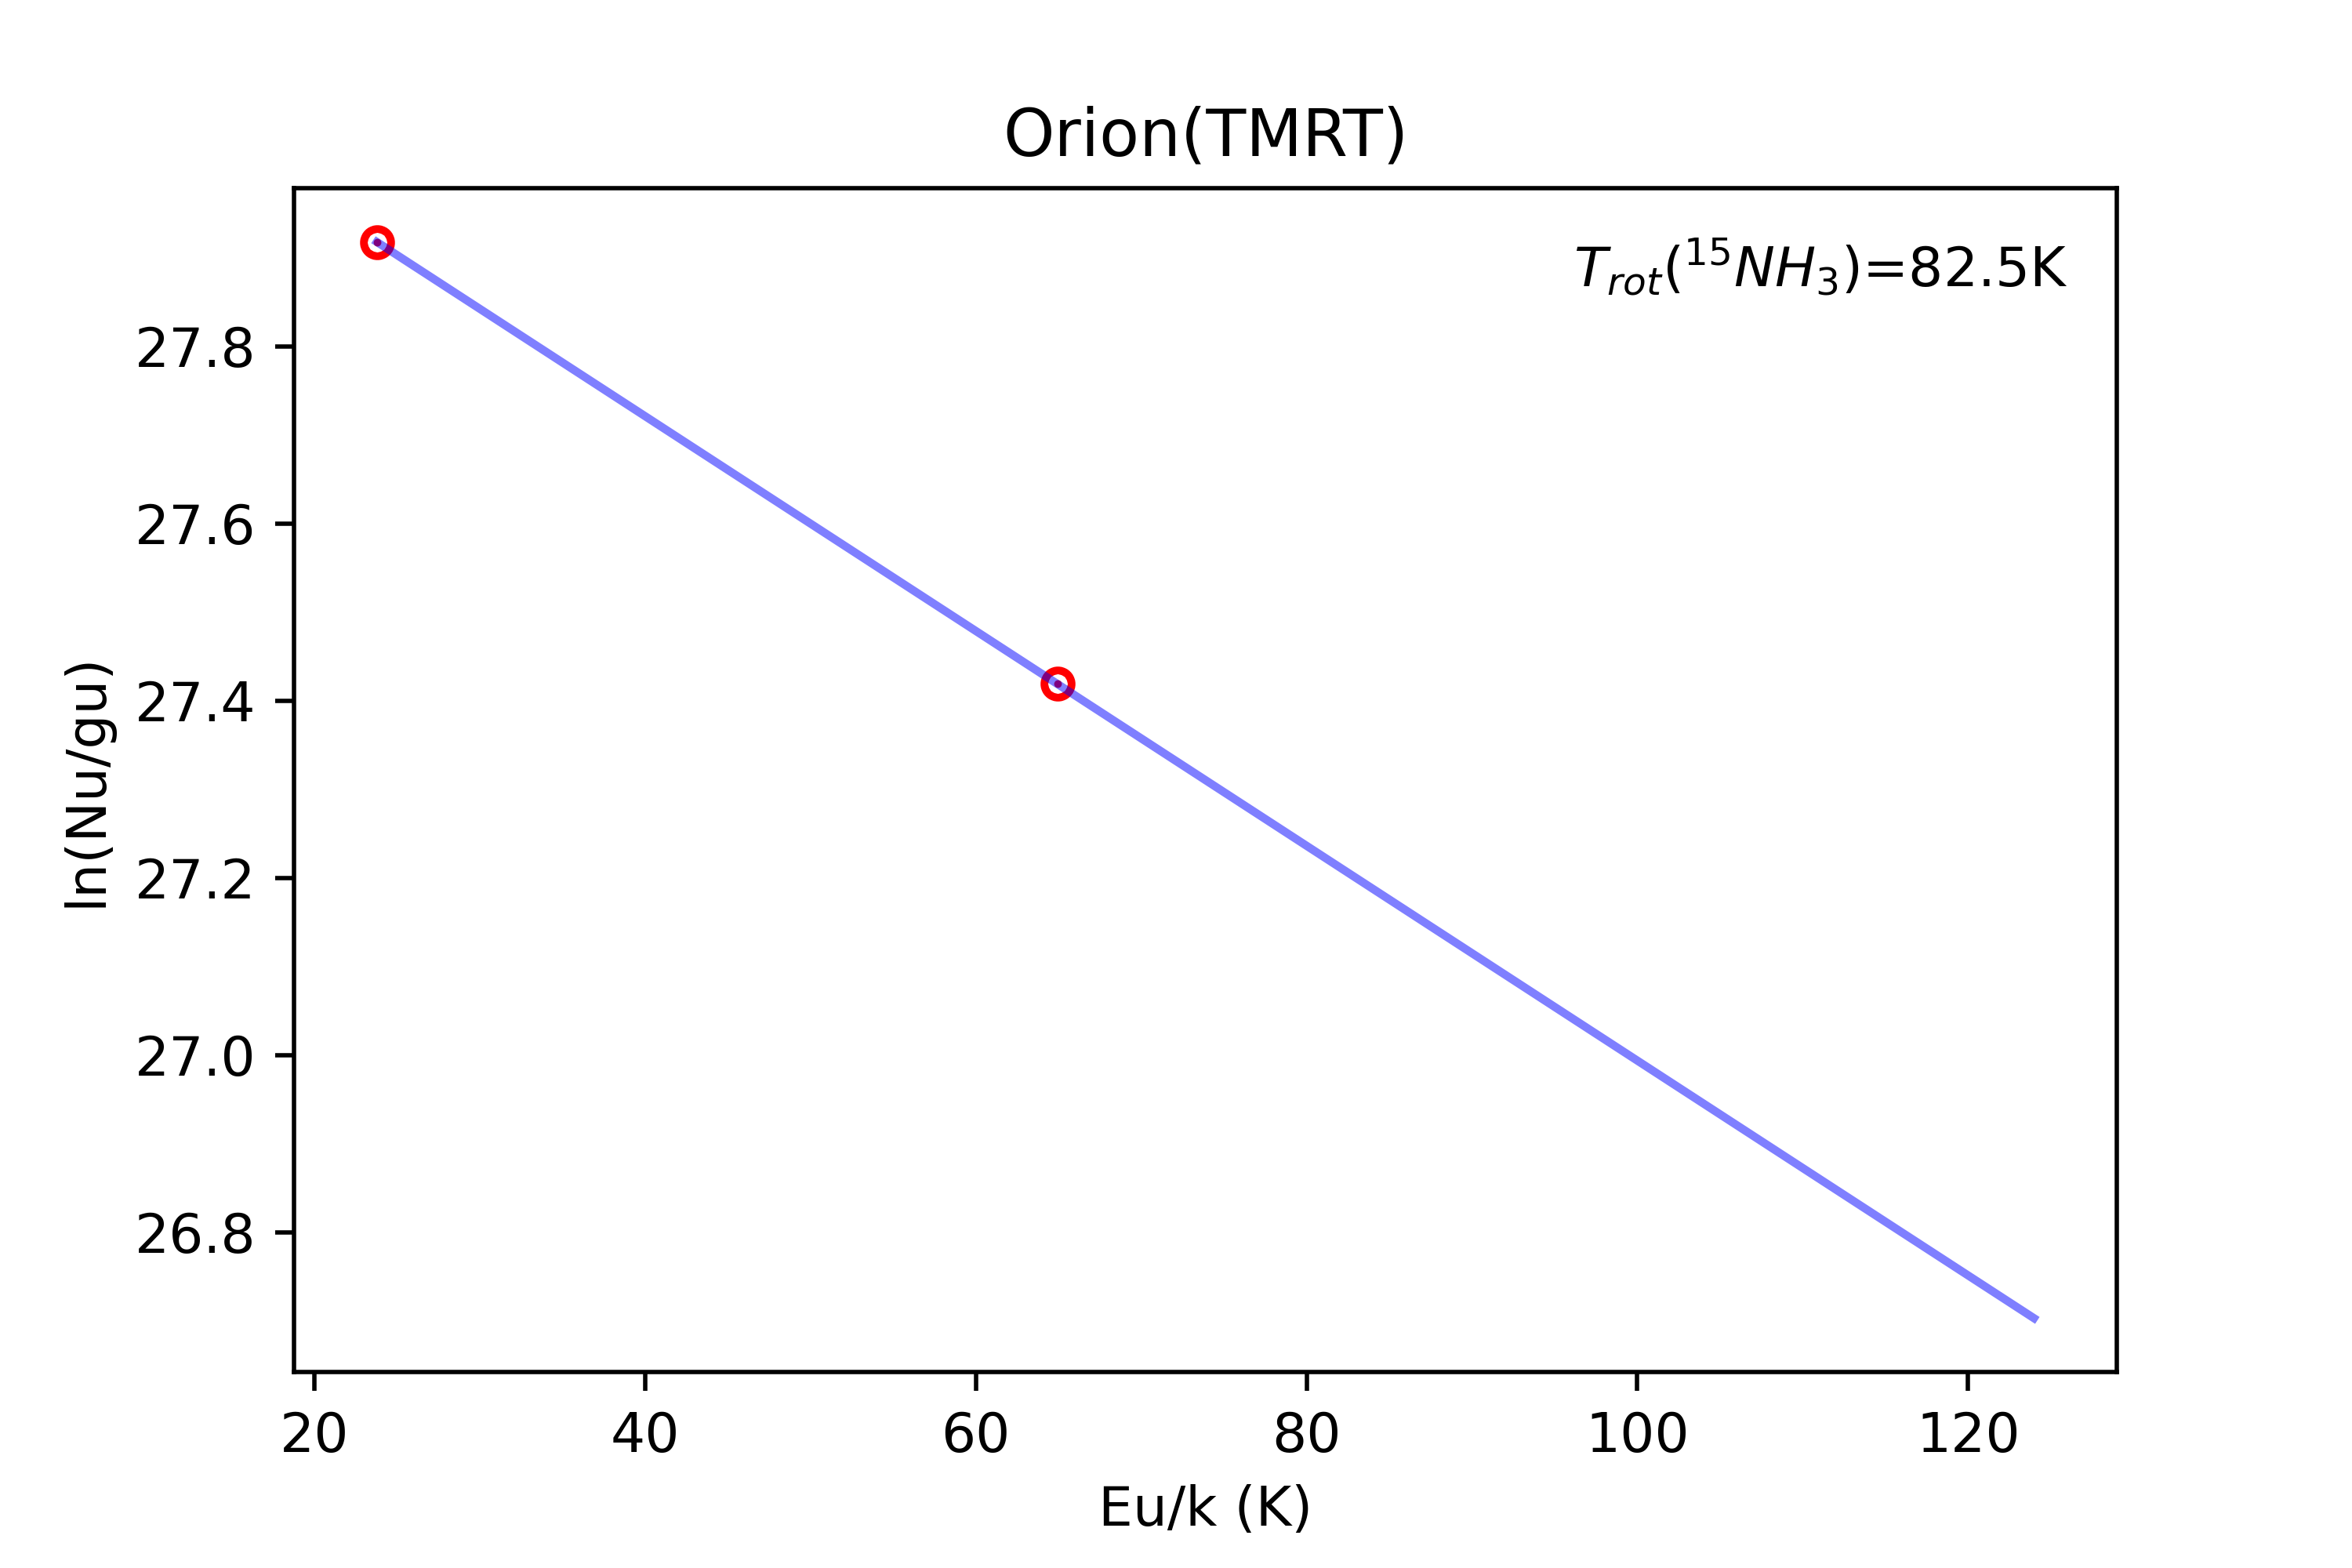
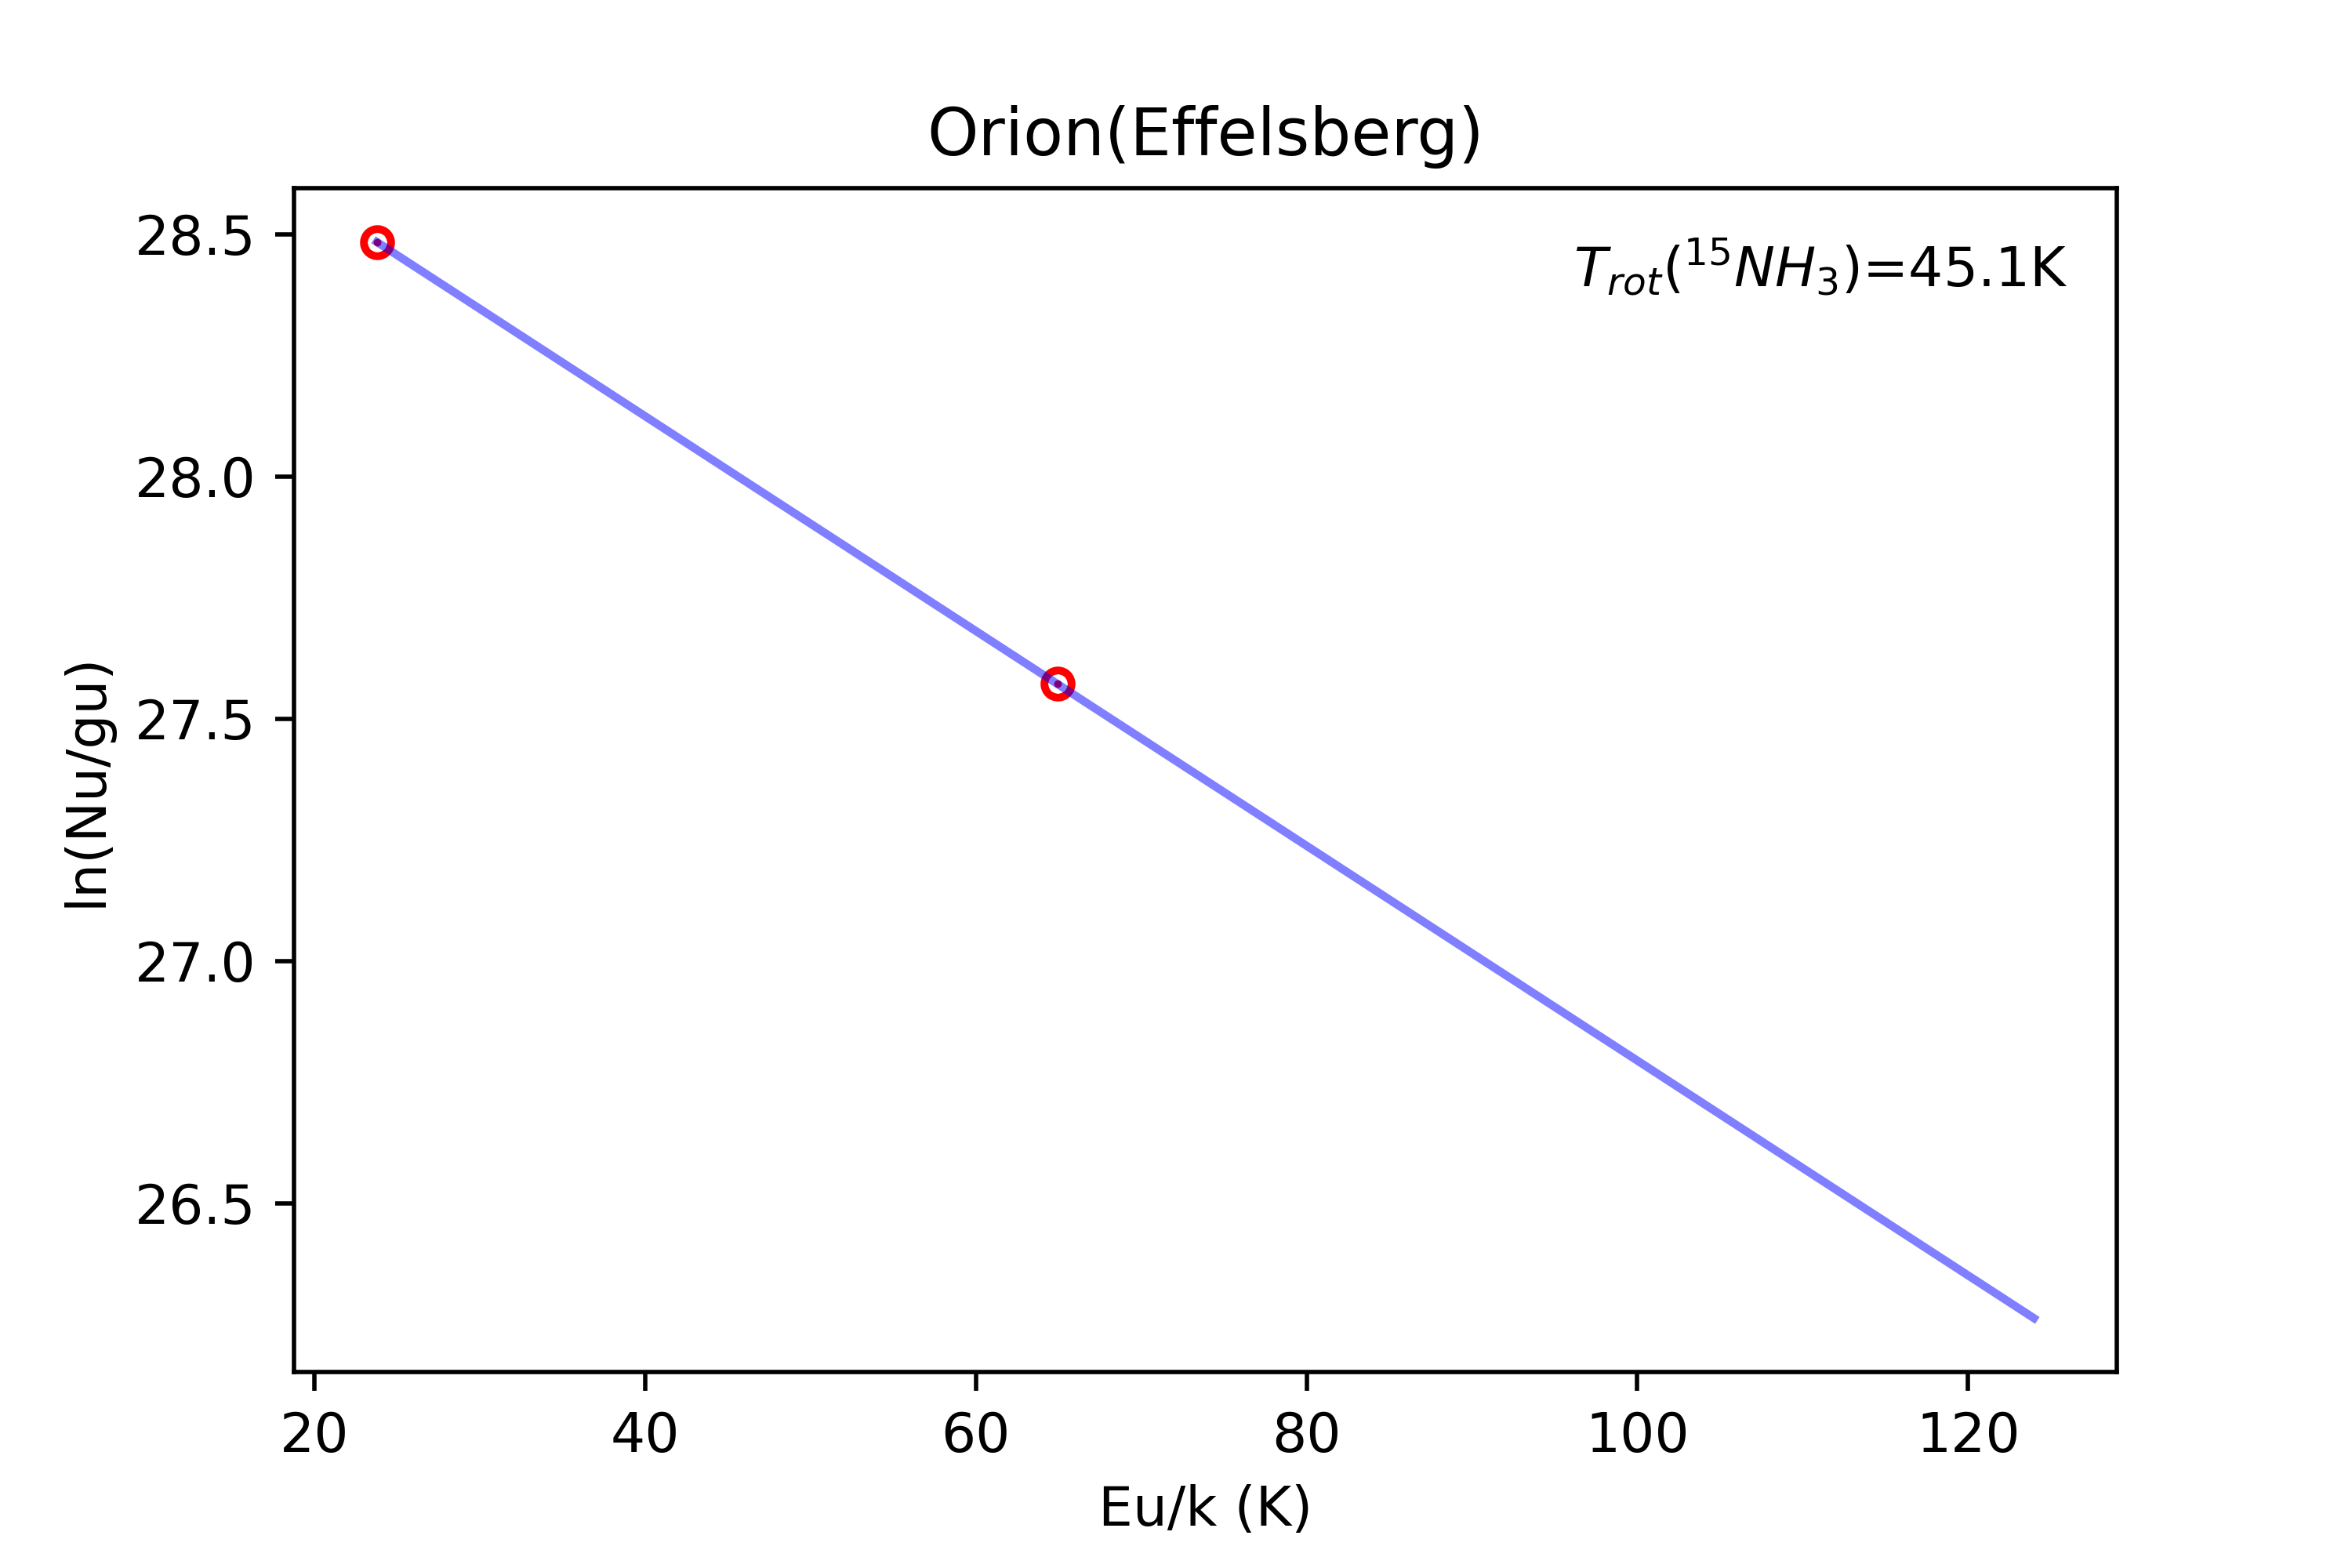
For 15NH3, we can carry out a similar analysis to determine the total column density for our sample, but in this case, with 14N/15N commonly in excess of 100, we can realistically assume that all lines are optically thin. We calculated the total column density of 15NH3 from the formulae (7) or (8), assuming the same value for 15NH3 as for 14NH3 and adopting the spectroscopic parameters of the 15NH3 molecular species (see Table 1). For those 2 sources (NGC 6334 I and G10.47) with detections in both 15NH3(1, 1) and 15NH3(2, 2), we took the 15NH3 total column density results from the 15NH3(2, 2) line for later analysis, due to the better quality of the 15NH3(2, 2) spectra with respect to those of the (1, 1) lines. For Orion-KL with high quality spectra in both transitions, we also used the rotation diagram method to determine (see Figure 3) and further determined its total column density. The results of the total column density without opacity corrections and the opacity-corrected values of both 14NH3 and 15NH3 of 15 sources are listed in Table 5.
| Object | Telescope | Nt(14NH3) | Nt(15NH3) | N(14NH3) | N(15NH3) | Classi- | Ref. | Notes | ||||
|---|---|---|---|---|---|---|---|---|---|---|---|---|
| cm-2 | cm-2 | cm-2 | cm-2 | (kpc) | (kpc) | fication | ||||||
| G000.19 | Effelsberg | 5.3E+14 | 2.2E+13 | 9.9E+14 | 2.5E+13 | 24 (10) | 40 (13) | 8.4(0.2) | 0.31(0.15) | YSO | Par18 | 1 |
| G10.47 | Effelsberg | 2.5E+15 | 3.2E+14 | 6.1E+15 | 4.5E+14 | 8 (5) | 13 (6) | 8.25(0.11) | 1.53(0.15) | UCH II | Wyr96 | 2 |
| G30.70 | TMRT | 4.3E+15 | 4.2E+13 | 1.1E+16 | 4.4E+13 | 102 (29) | 253 (60) | 5.0(0.7) | 4.6(0.4) | YSO | Urq18 | 1 |
| G032.04 | TMRT | 2.0E+15 | 4.3E+13 | 4.8E+15 | 5.0E+13 | 46 (21) | 97 (31) | 5.2(0.5) | 4.8(0.3) | YSO | Coo13 | 1 |
| W51D | TMRT | 3.9E+15 | 3.2E+13 | 1.1E+16 | 3.6E+13 | 121 (46) | 295 (81) | 5.5(0.4) | 6.2(0.3) | YSO | God15 | 1 |
| 9.5E+13 | 2.0E+14 | 41 (25) | 54 (27) | 2 | ||||||||
| Effelsberg | 1.5E+15 | 2.2E+13 | 3.7E+15 | 2.2E+13 | 69 (42) | 166 (62) | 1 | |||||
| 4.7E+13 | 5.7E+13 | 33 (56) | 64 (62) | 2 | ||||||||
| G016.92 | Effelsberg | 5.4E+14 | 2.5E+13 | 9.8E+14 | 2.7E+13 | 21 (10) | 35 (13) | 1.81(0.13) | 6.44(0.11) | H II | Urq11 | 1 |
| G35.14 | Effelsberg | 2.5E+15 | 2.9E+13 | 4.4E+15 | 3.1E+13 | 86 (39) | 143 (50) | 2.2(0.2) | 6.5(0.3) | IRDC | Den84 | 1 |
| NGC 6334 I | TMRT | 1.2E+16 | 8.4E+13 | 2.5E+16 | 8.2E+13 | 145 (45) | 301 (78) | 1.34(0.11) | 6.9(0.4) | IRDC | Wil13 | 1 |
| 3.1E+14 | 6.0E+14 | 39 (9) | 48 (11) | 2 | ||||||||
| G053.23 | TMRT | 1.0E+15 | 6.2E+12 | 2.3E+15 | 7.5E+12 | 167 (143) | 314 (172) | 8.3(0.6) | 7.3(0.5) | YSO | Urq18 | 1 |
| G081.75 | TMRT | 1.8E+15 | 6.9E+12 | 3.5E+15 | 7.5E+12 | 259 (171) | 467 (213) | 2.35(0.12) | 8.13(0.14) | YSO | Mau15 | 1 |
| Effelsberg | 1.4E+15 | 4.2E+12 | 2.8E+15 | 4.6E+12 | 321 (157) | 603 (213) | 1 | |||||
| NGC 1333 | Effelsberg | 6.9E+14 | 4.8E+12 | 1.4E+15 | 5.7E+12 | 142 (75) | 247 (96) | 0.21(0.17) | 8.3(0.4) | YSO | Lis10 | 1 |
| Barnard-1b | Effelsberg | 1.3E+15 | 1.7E+13 | 5.8E+15 | 2.5E+13 | 77 (32) | 229 (62) | 0.33(0.15) | 8.4(0.5) | IRDC | Lis10 | 1 |
| Orion-KL | TMRT | 5.9E+15 | 5.6E+13 | 2.1E+16 | 7.7E+13 | 105 (39) | 270 (72) | 0.45(0.12) | 8.5(0.6) | H II | Kim08 | 1 |
| 1.5E+14 | 1.5E+14 | 39 (10) | 136 (45) | 15NH3 | ||||||||
| Effelsberg | 7.9E+15 | 9.8E+13 | 3.1E+16 | 1.4E+14 | 80 (20) | 212 (46) | 1 | |||||
| 1.4E+14 | 1.4E+14 | 55 (12) | 215 (47) | 15NH3 | ||||||||
| G121.29 | TMRT | 1.4E+15 | 1.4E+13 | 2.4E+15 | 1.5E+13 | 100 (60) | 159 (72) | 1.7(1.3) | 9(2) | IRDC | Ryg10 | 1 |
| G188.79 | Effelsberg | 2.3E+14 | 7.6E+12 | 2.5E+14 | 7.7E+12 | 30 (17) | 33 (17) | 2.14(0.12) | 10.3(1.2) | YSO | Cut03 | 1 |
Note. — Column(1): source name; Column(2): used Telescope; Columns (3) - (4): 14NH3 and 15NH3 column densities neglecting opacity corrections; Columns (5): column densities N(14NH3) accounting for opacity effects; Columns (6): the corrected column density N(15NH3) was obtained with the assumption of the same as (14NH3), which can be derived taking into account the optical depth correction on 14NH3 in the rotation diagram method; Column (7): the ratios of the column densities neglecting opacity corrections. Errors (in parentheses) include standard deviations from the line fitting procedure; Column (8): opacity corrected values of 14NH3/15NH3; Column (9): heliocentric distance with error, from the Parallax-Based Distance Calculator; Column (10): galactocentric distance with error from the Heliocentric distance; Column (11): source classification. IRDC: InfraRed Dark Cloud; YSO: Young Stellar Object; H II: associated with an HII region; UCH II: associated with an ultra compact H II region; Column (12): references for the classification from the literature. Par18: Parsons et al. (2018); Wyr96: Wyrowski and Walmsley (1996); Urq18: Urquhart et al. (2018); Coo13: Cooper et al. (2013); God15: Goddi et al. (2015); Urq11: Urquhart et al. (2011); Wil13: Willis et al. (2013); Mau15: Maud et al. (2015); Lis10: Lis et al. (2010); Kim08: Kim et al. (2008); Ryg10: Rygl et al. (2010); Cut03: Cutri et al. (2003); Den84: Dent et al. (1984); Notes 1: the total column densities of 15NH3 were obtained from the 15NH3(1, 1) line intensity, assuming the same value for 15NH3 as for 14NH3; Notes 2: the total column densities of 15NH3 were obtained from the 15NH3(2, 2) line intensity, assuming the same value for 15NH3 as for 14NH3; Notes 15NH3: the total column densities of 15NH3 were obtained using the of 15NH3 from its 15NH3(1, 1) and (2, 2) line intensities.
3.3 Measured abundance ratios
As shown in Sect. 3.2.3, we obtained the column densities of 14NH3 and 15NH3 of 15 sources. Based on these results, we estimate the 14N/15N isotope ratios (see Table 5). For those 2 sources (NGC 6334 I and G10.47) with 15NH3 (2, 2) detection, the results from their NH3(2, 2) lines (with higher quality than their (1, 1) lines, see Sect. 3.1) are used for later analysis because signal-to-noise ratios are higher. For those sources measured by both the Effelsberg and TMRT telescope (G081.75, W51 D and Orion-KL), the mean value of their 14NH3/15NH3 ratios was taken. For those sources without detection of 15NH3, we estimate the lower limit of 14NH3/15NH3, according to the peak temperature of 14NH3 and the 3 rms value of the 15NH3 line (in grey points with arrows in Figure 5a). The lower limit is mostly around 11, with a mean value of 13, which is smaller than all ratios derived from our 15 detections. A comparison with previous studies is presented in Sect. 4.1 and possible contaminating effects affecting the abundance ratios are discussed in Sect. 4.2 and 4.3.
4 Discussion
4.1 Comparisons with previous studies
Among 15 sources with measured 14N/15N ratio, five sources (Orion-KL, Barnard-1b, NGC 1333, W51 D and G000.19 in the Galactic center region) were also measured in previous studies, which therefore provide 14N/15N abundance ratios from a variety of molecular species, namely CN, HNC, HCN, NH2D, N2H+. Comparisons show that measured ratios considering opacity effects are basically consistent with previous results within the uncertainties (see details in Table 6).
Orion-KL: This source has been observed in different species to measure the isotope ratio 14N/15N. Assuming LTE conditions, Hermsen et al. (1985) derived a 14NH3/15NH3 ratio of 170. Subsequently, Adande & Ziurys (2012) performed observations of HN13C, H15NC, CN and C15N toward this source. They obtained a 14N/15N ratio of 234 47, from the ratio of the brightness temperatures of the strongest hyperfine components of CN and C15N, weighted by the hyperfine relative intensities. From their observations of HN13C and H15NC using the double isotope method, they got a reasonably consistent ratio of 159 40. Recently, a relatively lower value of 100 51 was reported from NH3 observations but without considering optical depth corrections (Gong et al., 2015). The measurements of this source are, within the uncertainties, consistent with our result of 241 71.
Barnard-1b, NGC 1333: The 14N/15N of Barnard-1b, NGC 1333 was measured by Gerin et al. (2009) and Lis et al. (2010), from observations of NH2D and NH3, respectively. The results from these two tracers are consistent within uncertainties, with 14N/15N = 334 50 and 344 173 (from NH3, Lis et al., 2010) and 470 and 360 (from NH2D, Gerin et al., 2009) for Barnard-1b and NGC 1333. For Barnard-1b, the isotope ratio from NH2D in Gerin et al. (2009) appears to be larger than that from NH3 in Lis et al. (2010). Daniel et al. (2013) performed observations of multi-tracers (NH3, NH2D, CN, HCN, N2H+) to investigate its 15N-fractionation. Assuming non-LTE conditions, they got similar 14N/15N abundance ratios for all the tracers, independent of the chemical family. And they found a strong dependence of the column density of 15NH2D on the excitation temperature. Using the same observational data of NH2D from Gerin et al. (2009), they made a model analysis to obtain the excitation temperature of 15NH2D, instead of assuming the same excitation temperature for 15NH2D and 14NH2D (Gerin et al., 2009). Therefore they got a relative accurate 14N/15N value of 230 for this source, with respect to 470 in Gerin et al. (2009). This is consistent with our ratio of 229 62 from the rotation diagram method (LTE), which should reflect non-significant non-LTE effects in our analysis.
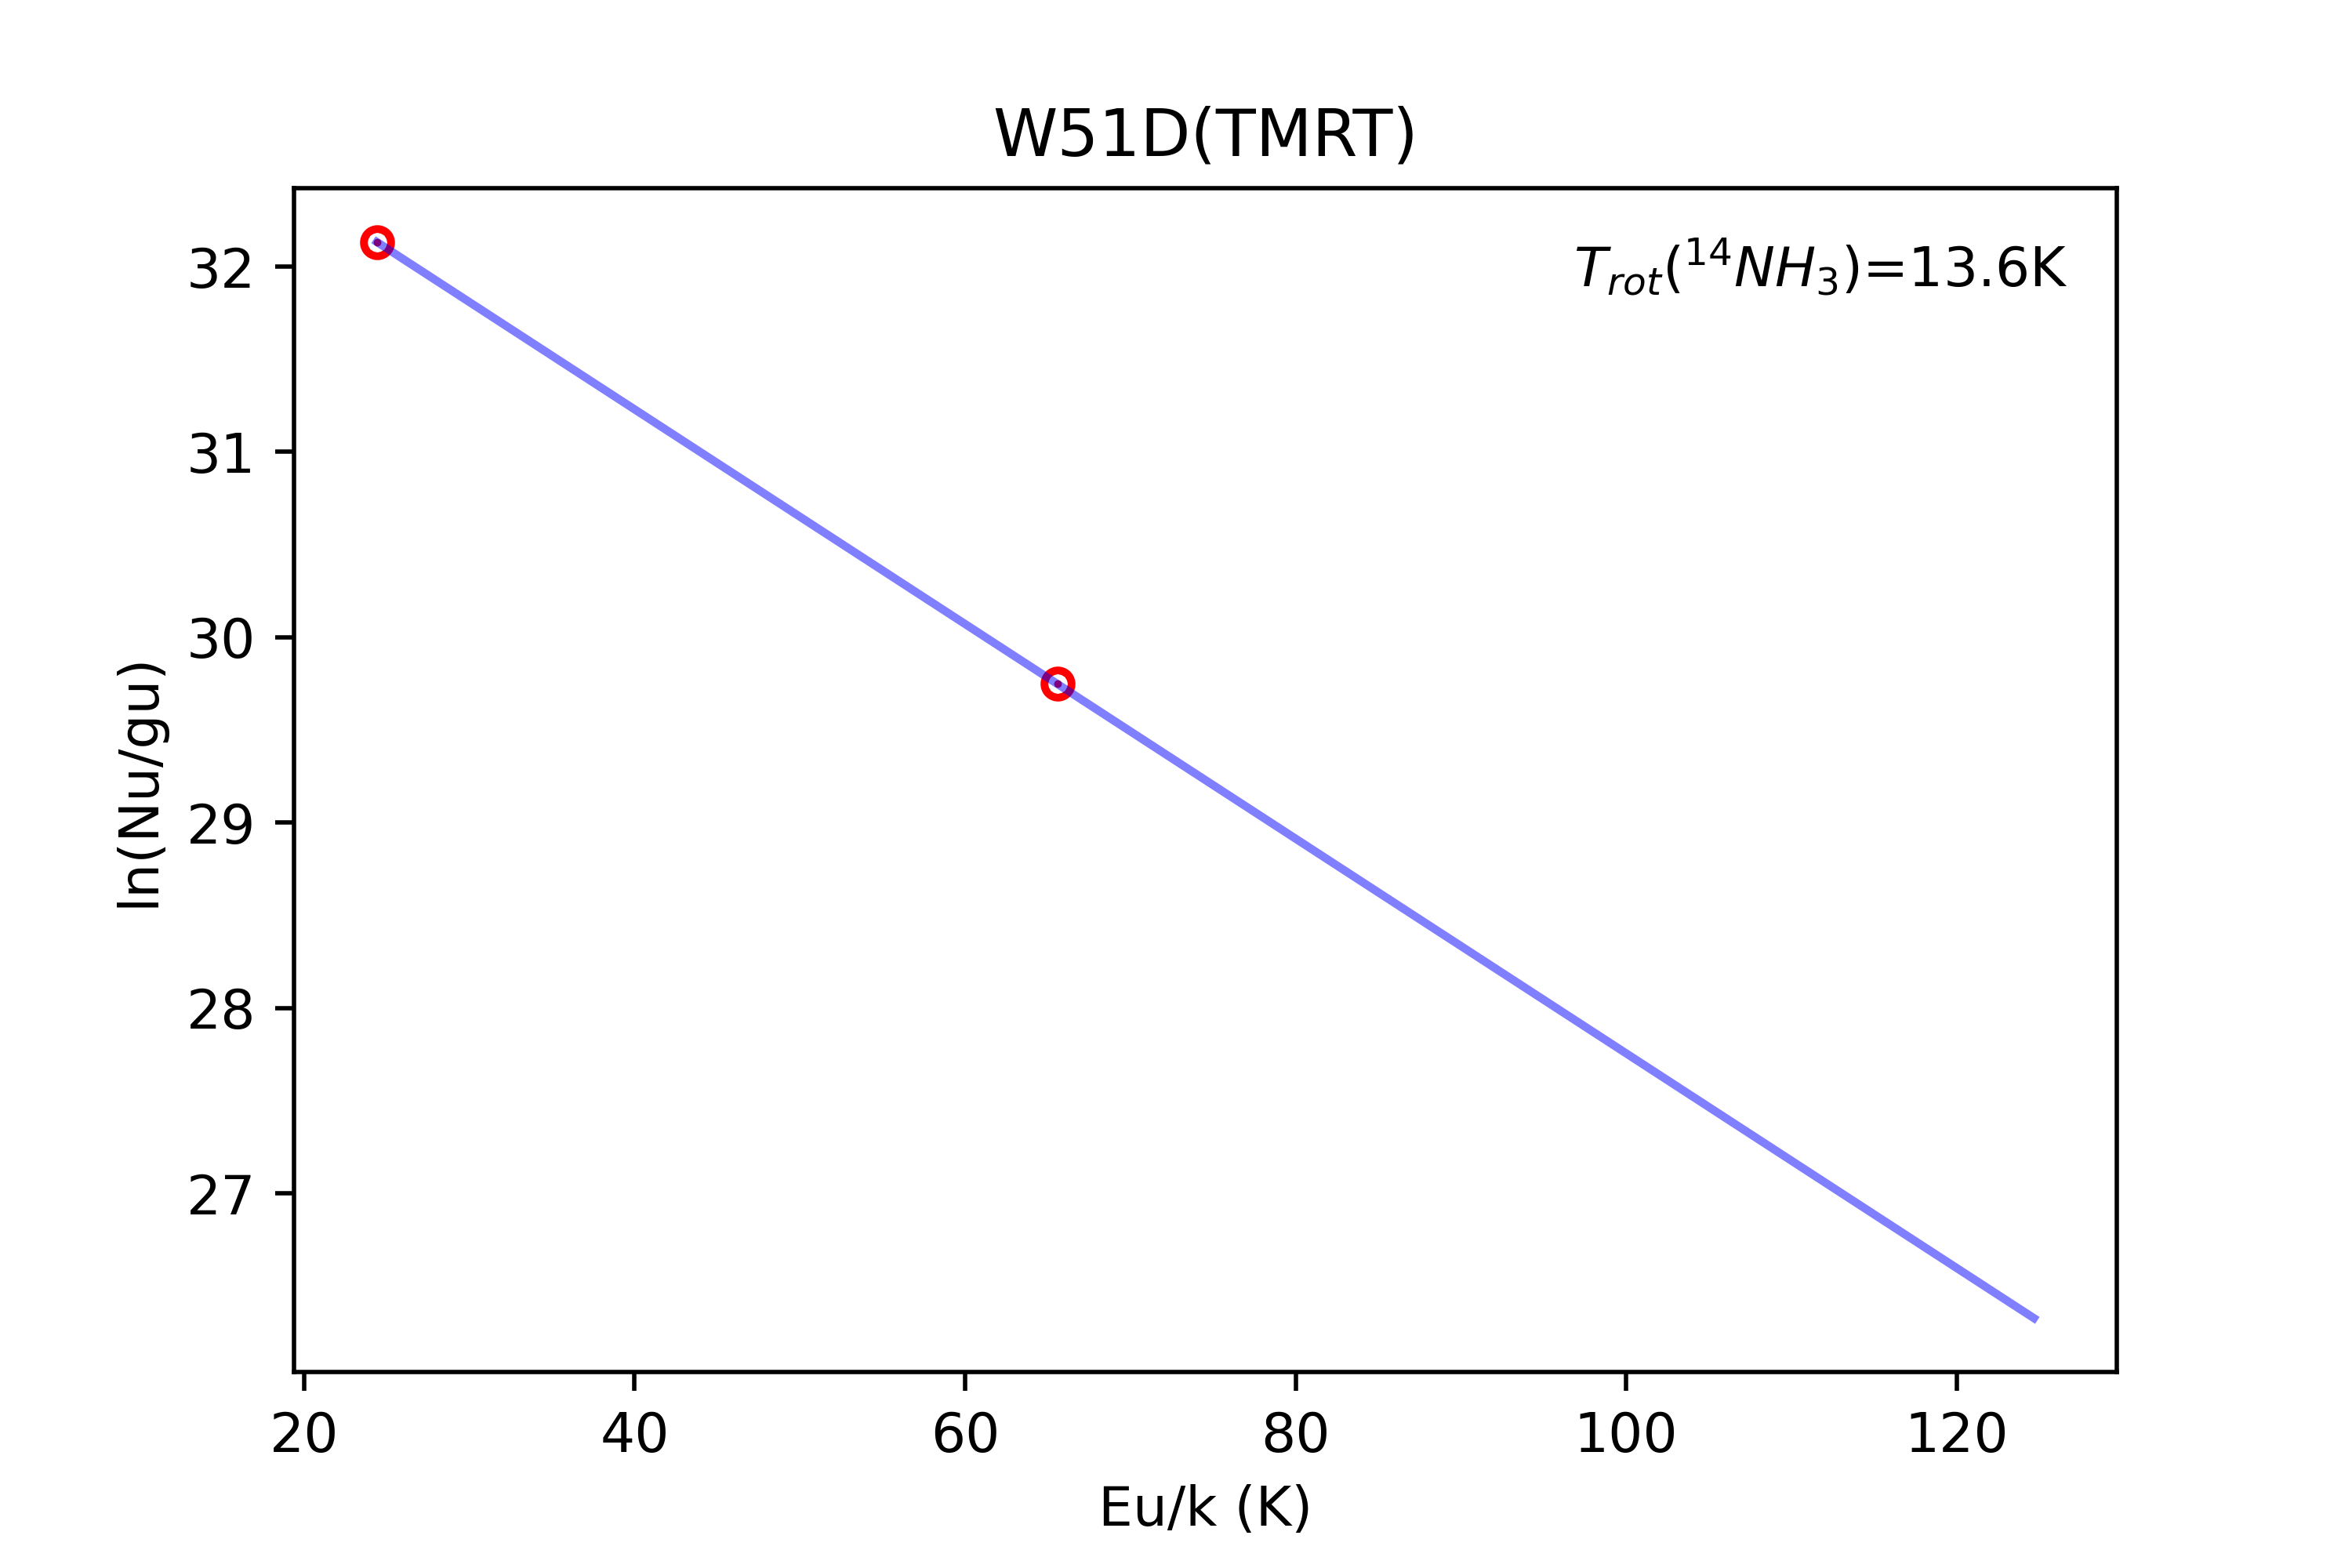
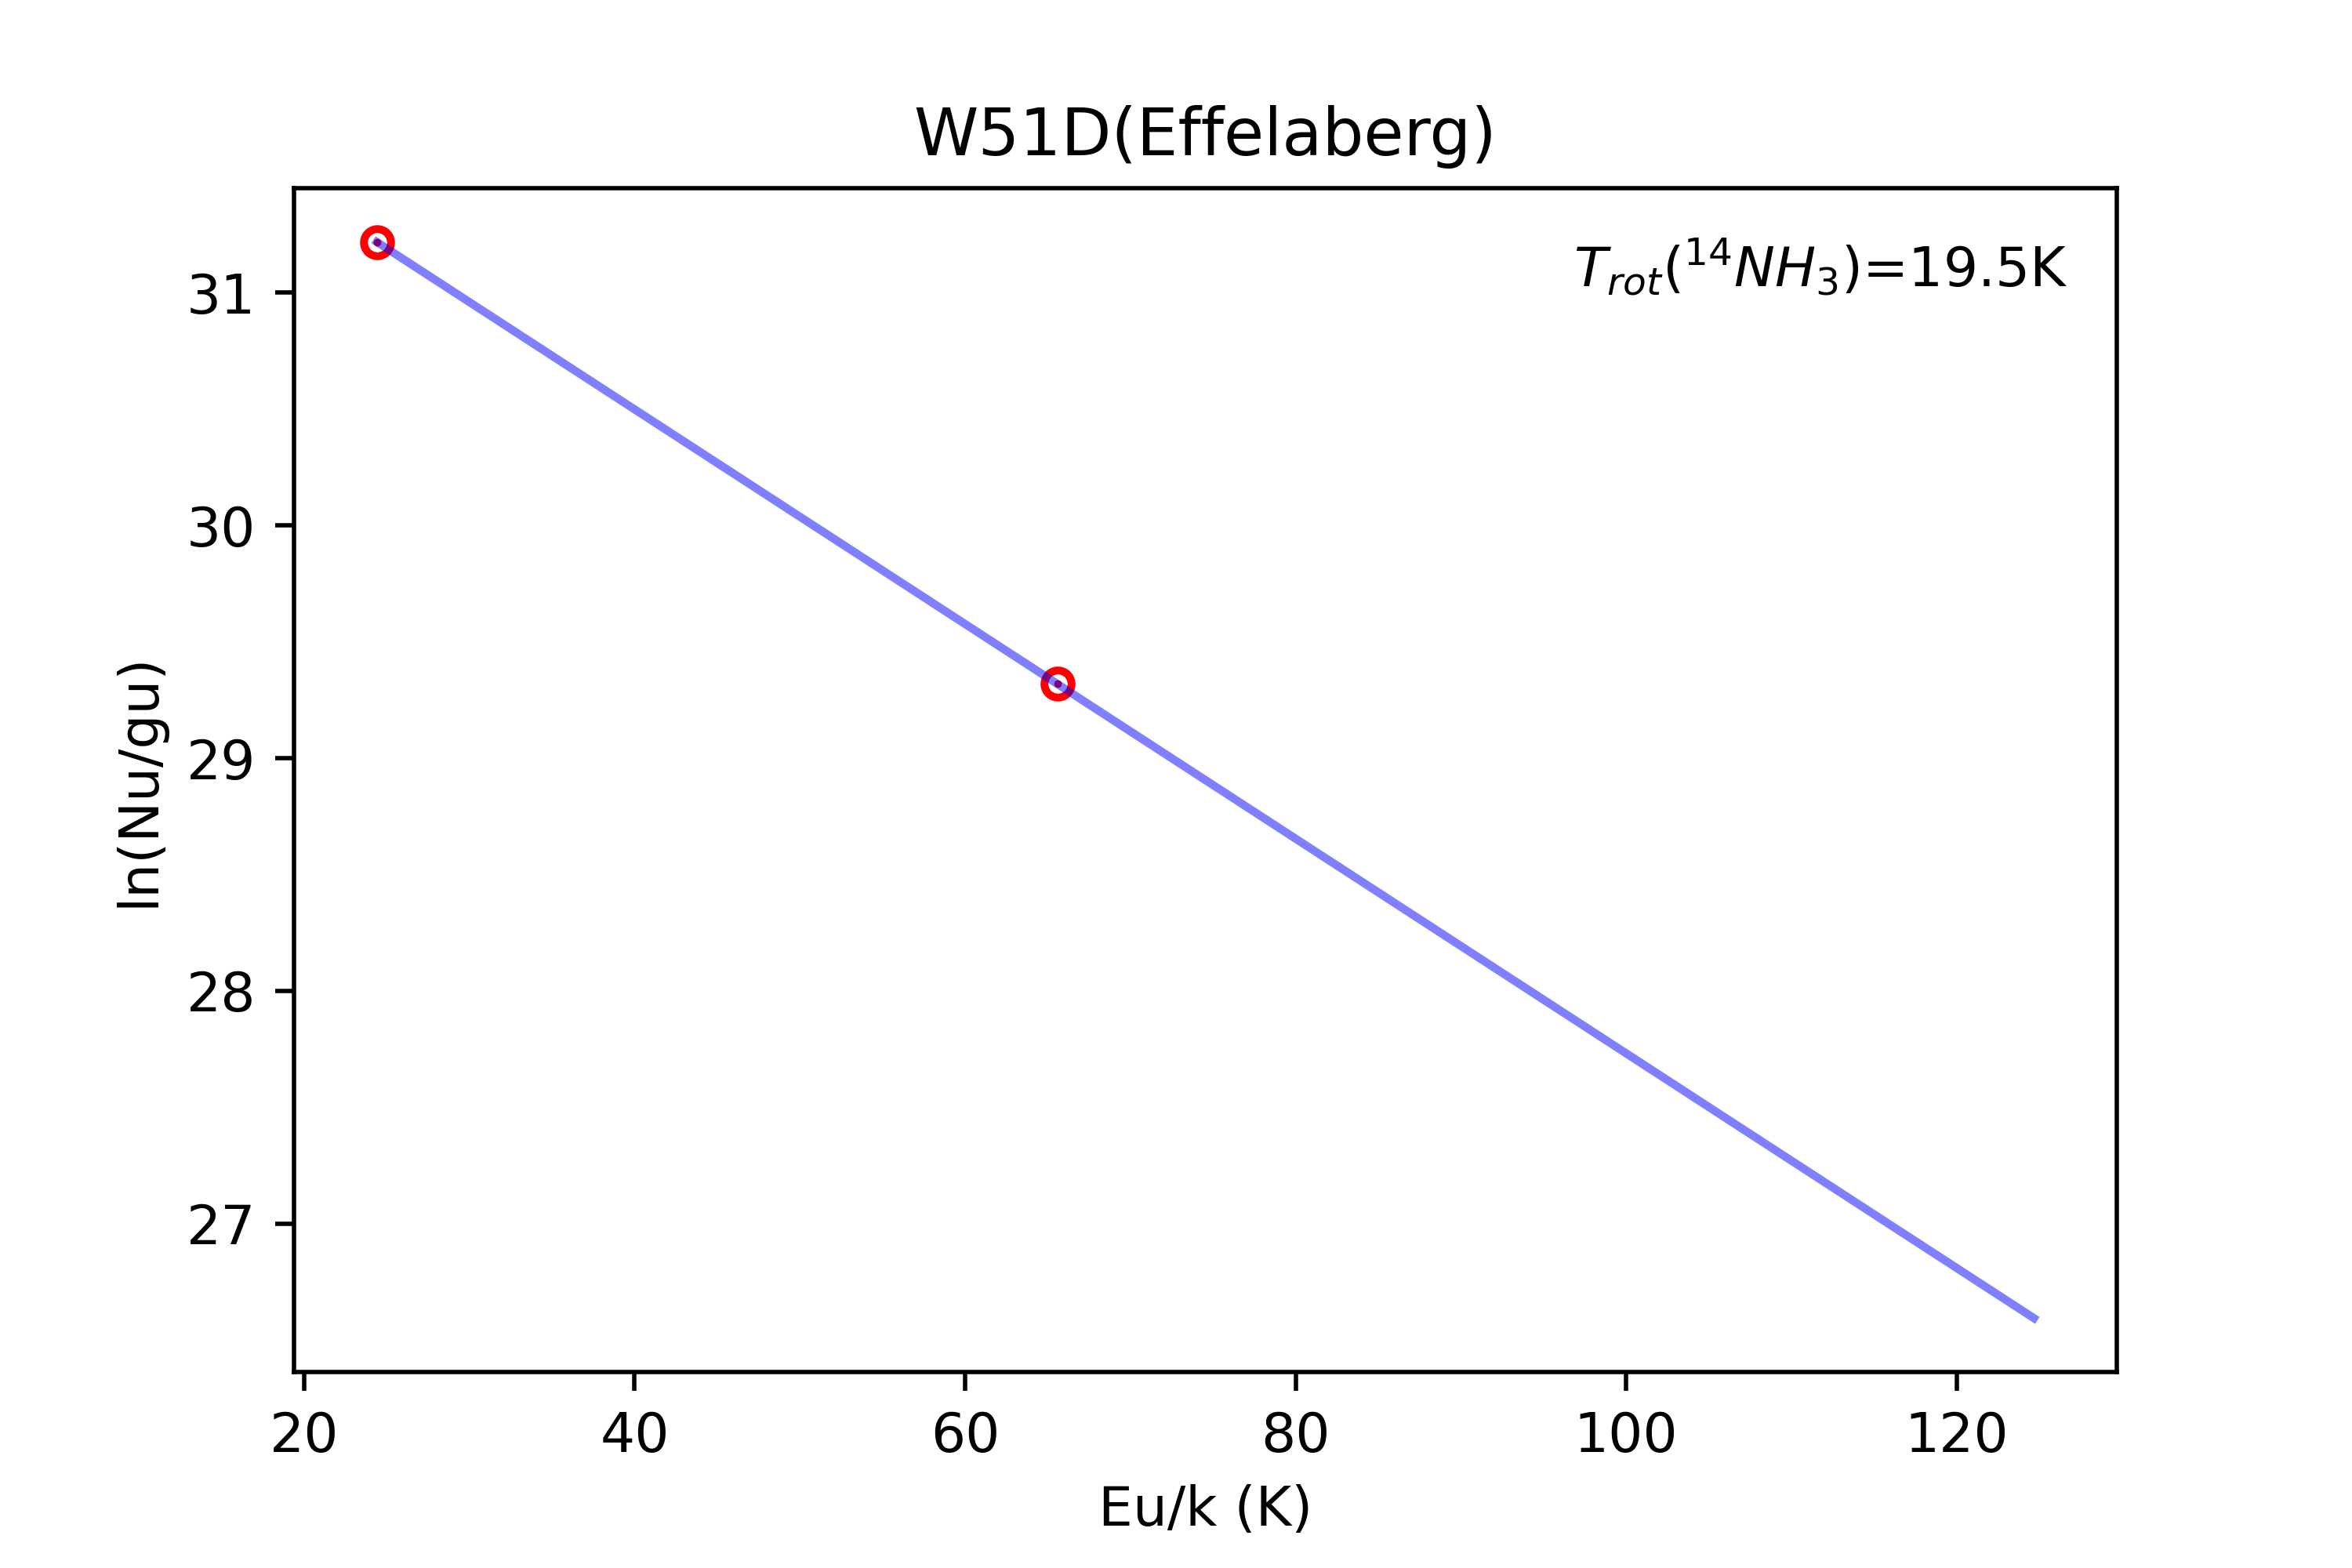
W51D: Using Effelsberg data of 13 emission lines of NH3 for a rotation diagram analysis (LTE), Mauersberger et al. (1987) derived a 14N/15N result of 660 300 toward W51D, which is larger than our result of 230 102 from both Effelsberg and TMRT data using the rotation diagram method. This large difference should be caused by the fact that many NH3 lines from levels with high energy above the ground levels were used in their analysis, instead of only the metastable (1, 1) and (2, 2) lines of NH3 as in our analysis. Using only the metastable (1, 1) and (2, 2) lines of NH3 and 15NH3 in Mauersberger et al. (1987), we performed a consistent analysis and and got smaller and 14NH3/15NH3 values of 24 4.1 and 95 36, which are consistent with our new results. In addition, the 14NH3/15NH3 ratio also depends critically on the population of the NH3 non-metastable ammonia levels (Mauersberger et al., 1987). The transition lines from high levels with different excitation conditions should trace denser regions (Goddi et al., 2015). As our other sources, the measurements from the (1, 1) and (2, 2) lines, presumably representing the bulk of the gas due to their low excitation, are taken for our later analysis.
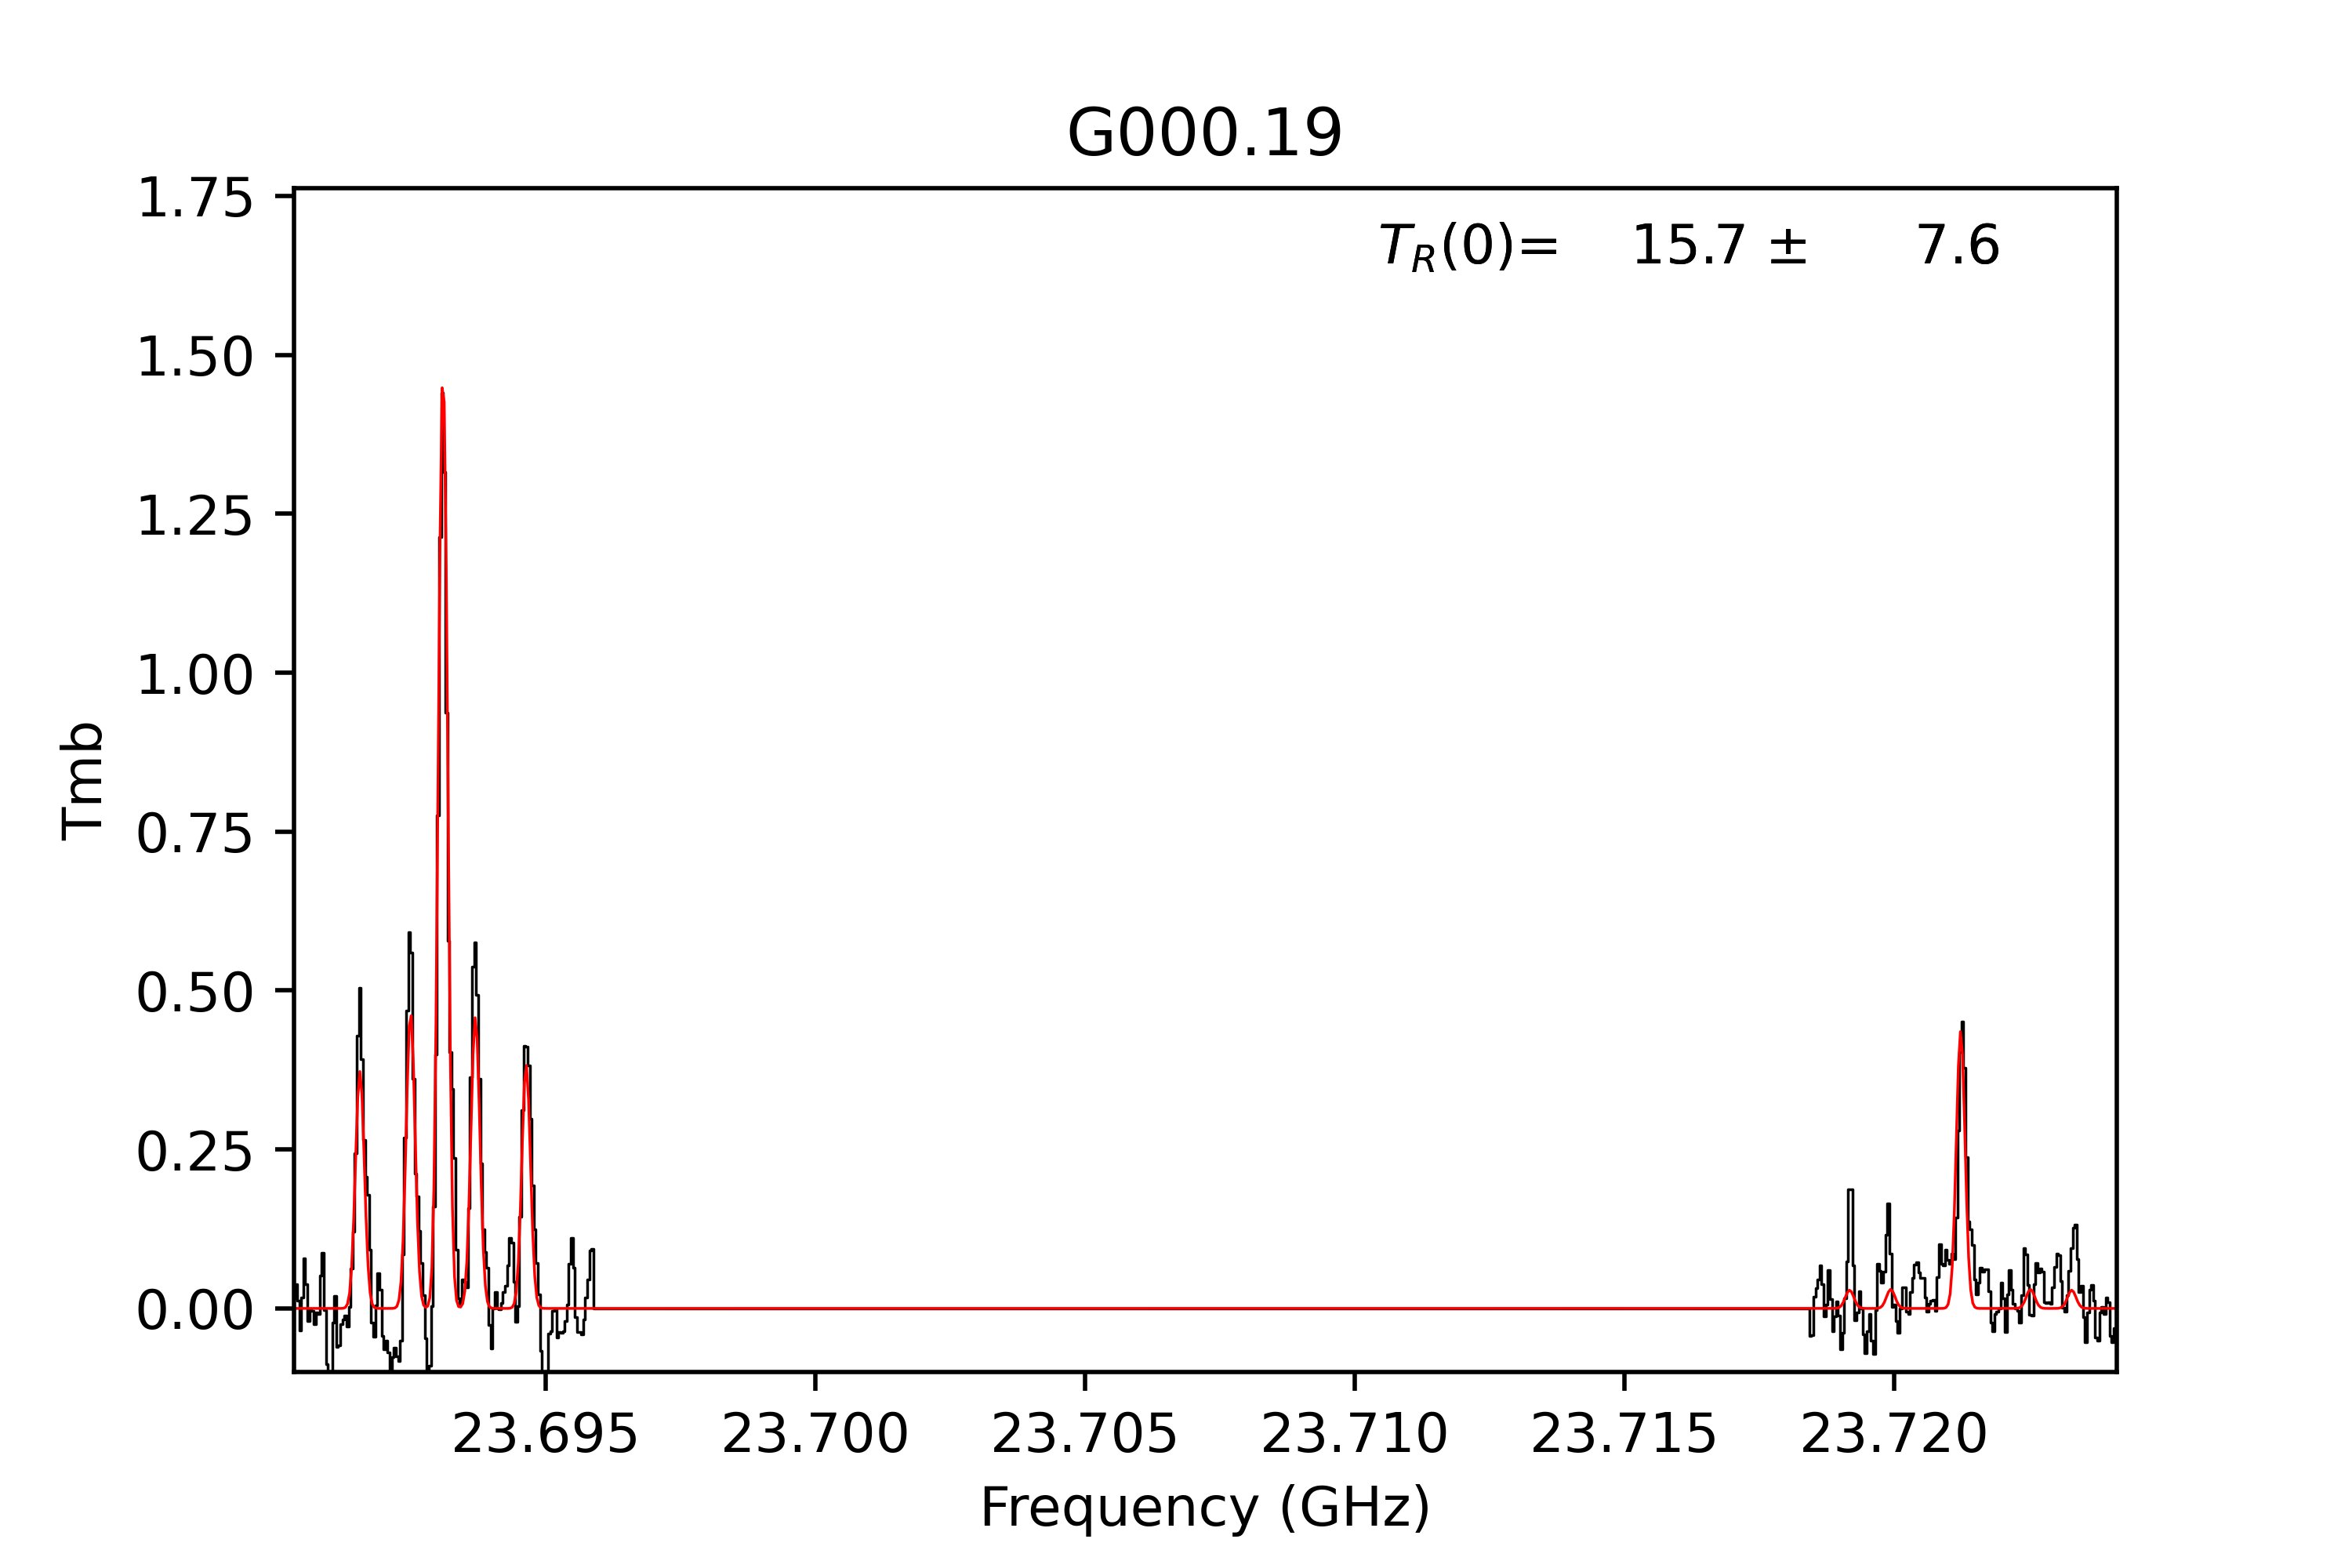
Galactic center region: As mentioned before (see Sect. 1), the only direct measurements towards the Galactic center region obtained a very large value of 14N/15N of 1000 (Güsten & Ungerechts, 1985), while extrapolations of the trend with galactocentric distances, extrapolated from the disk, indicate much lower values (Adande & Ziurys, 2012; Colzi et al., 2018a). Recently, Mills et al. (2018) performed VLA mapping on 14NH3 and 15NH3 toward Sgr B2 (N) and measured 14N/15N ratios of 450 and a lower value of 200 for the resolved two hot cores N1 and N2, respectively. Our observations toward G000.19, about 30′away from Sgr A, provide a 14N/15N value of 40, which is much lower than previous results toward the Galactic center. Actually, non-uniform ratios for other isotopes were reported toward the Galactic center region. Zhang et al. (2015) mapped typical molecular clouds (6 sources including Sgr A, Sgr B2, Sgr C and Sgr D) in the lines of C18O and C17O and obtained different ratios of 18O/17O toward those sources, while all their ratios are lower relative to molecular clouds in the Galactic disk. It indicates chemical differentiation of the region, either due to a different origin of the gas, due to different degrees of nuclear processing inside the central molecular zone or due to fractionation effects (Zhang et al., 2015; Loison et al., 2019). In addition, low isotope ratio values of 12C/13C (13) were reported recently toward Orion-KL and other star formation regions from MIR observations data, which is believed to be not biased by chemical effects. As previously mentioned, the Galactic center region is not covered in current Galactic chemical evolution models (e.g., Romano et al., 2017, 2019). Unlike other isotope ratios all reporting low (though non-uniform) ratios in the Galactic center region, both high and low 14N/15N ratios may be found in this region. This makes nitrogen ”special” in this sense: it could imply strong effects due to both nucleosynthesis and chemical fractionation, in spite of the rather large kinetic temperatures in the Galactic center region (e.g. Ginsburg et al., 2016), which needs more measurements and modeling work.
| Object | Species | (2000) | (2000) | Beam size | References | |
|---|---|---|---|---|---|---|
| Orion-KL | NH3 | 05:35:14 | -05:22:29 | 241 71 | 40″ | 2, This paper |
| NH3 | 05:35:14 | -05:22:29 | 100 51 | 40″ | 25, Gong et al. (2015) | |
| NH3 | 05:35:14 | -05:22:46 | 170 | 40″ | 5, Hermsen et al. (1985) | |
| HNC | 05:32:46 | -05:24:23 | 159 40 | 63″ | Adande & Ziurys (2012) | |
| CN | 05:32:46 | -05:24:23 | 234 47 | 63″ | Adande & Ziurys (2012) | |
| Barnard-1b | NH3 | 03:33:20 | +31:07:34 | 229 62 | 40″ | 2, This paper |
| NH3 | 03:33:20 | +31:07:34 | 334 50 | 33″ | 2, Lis et al. (2010) | |
| NH3 | 03:33:20 | +31:07:34 | 300 50 | 33″ | 2, Daniel et al. (2013) | |
| NH2D | 03:33:20 | +31:07:34 | 230 | 29″ | Daniel et al. (2013) | |
| CN | 03:33:20 | +31:07:34 | 290 | 21″ | Daniel et al. (2013) | |
| HCN | 03:33:20 | +31:07:34 | 330 | 29″ | Daniel et al. (2013) | |
| N2H+ | 03:33:20 | +31:07:34 | 400 | 27″ | Daniel et al. (2013) | |
| HNC | 03:33:20 | +31:07:34 | 225 | 28″ | Daniel et al. (2013) | |
| NH2D | 03:33:20 | +31:07:34 | 470 | 29″ | Gerin et al. (2009) | |
| NGC 1333 | NH3 | 03:29:11 | +31:13:26 | 247 95 | 40″ | 2, This paper |
| NH3 | 03:29:11 | +31:13:26 | 344 173 | 33″ | 2, Lis et al. (2010) | |
| NH2D | 03:29:12 | +31:13:25 | 360 | 240″ | Gerin et al. (2009) | |
| W51 D | NH3 | 19:23:39 | +14:31:07 | 230 102 | 40″ | 2, This paper |
| NH3 | 19:23:39 | +14:31:10 | 660 300(a) | 40″ | 6, Mauersberger et al. (1987) | |
| NH3 | 19:23:39 | +14:31:10 | 400 200(b) | 40″ | 13, Mauersberger et al. (1987) | |
| G000.19 | NH3 | 17:47:52 | -28:59:59 | 40 13 | 40″ | 2, This paper |
| Sgr A | NH3 | 17:45:52 | -28:59:59 | 1000 | 40″ | 2, Güsten & Ungerechts (1985) |
| HCN | 17:45:52 | -28:59:59 | 510 | 124″ | Wannier et al. (1981) | |
| Sgr B2 | NH3 | 17:47:19 | -28:22.08 | 210 90 | 33″ | 12, Mills et al. (2018) |
Note. — Column(1): Source name; Column(2): Species; Column(3): Right ascension (J2000); Column(4): Declination (J2000); Column(5): Resulting nitrogen isotope abundance ratio; Column (6): Applied beam size of the telescope; Column(7): References and the number of transition (in case NH3 has been used) that were considered for the determination of the column density. (a) and (b): the 14N/15N ratio from the rotation diagram method without or with the populations of non-metastable levels.
4.2 Observational effects
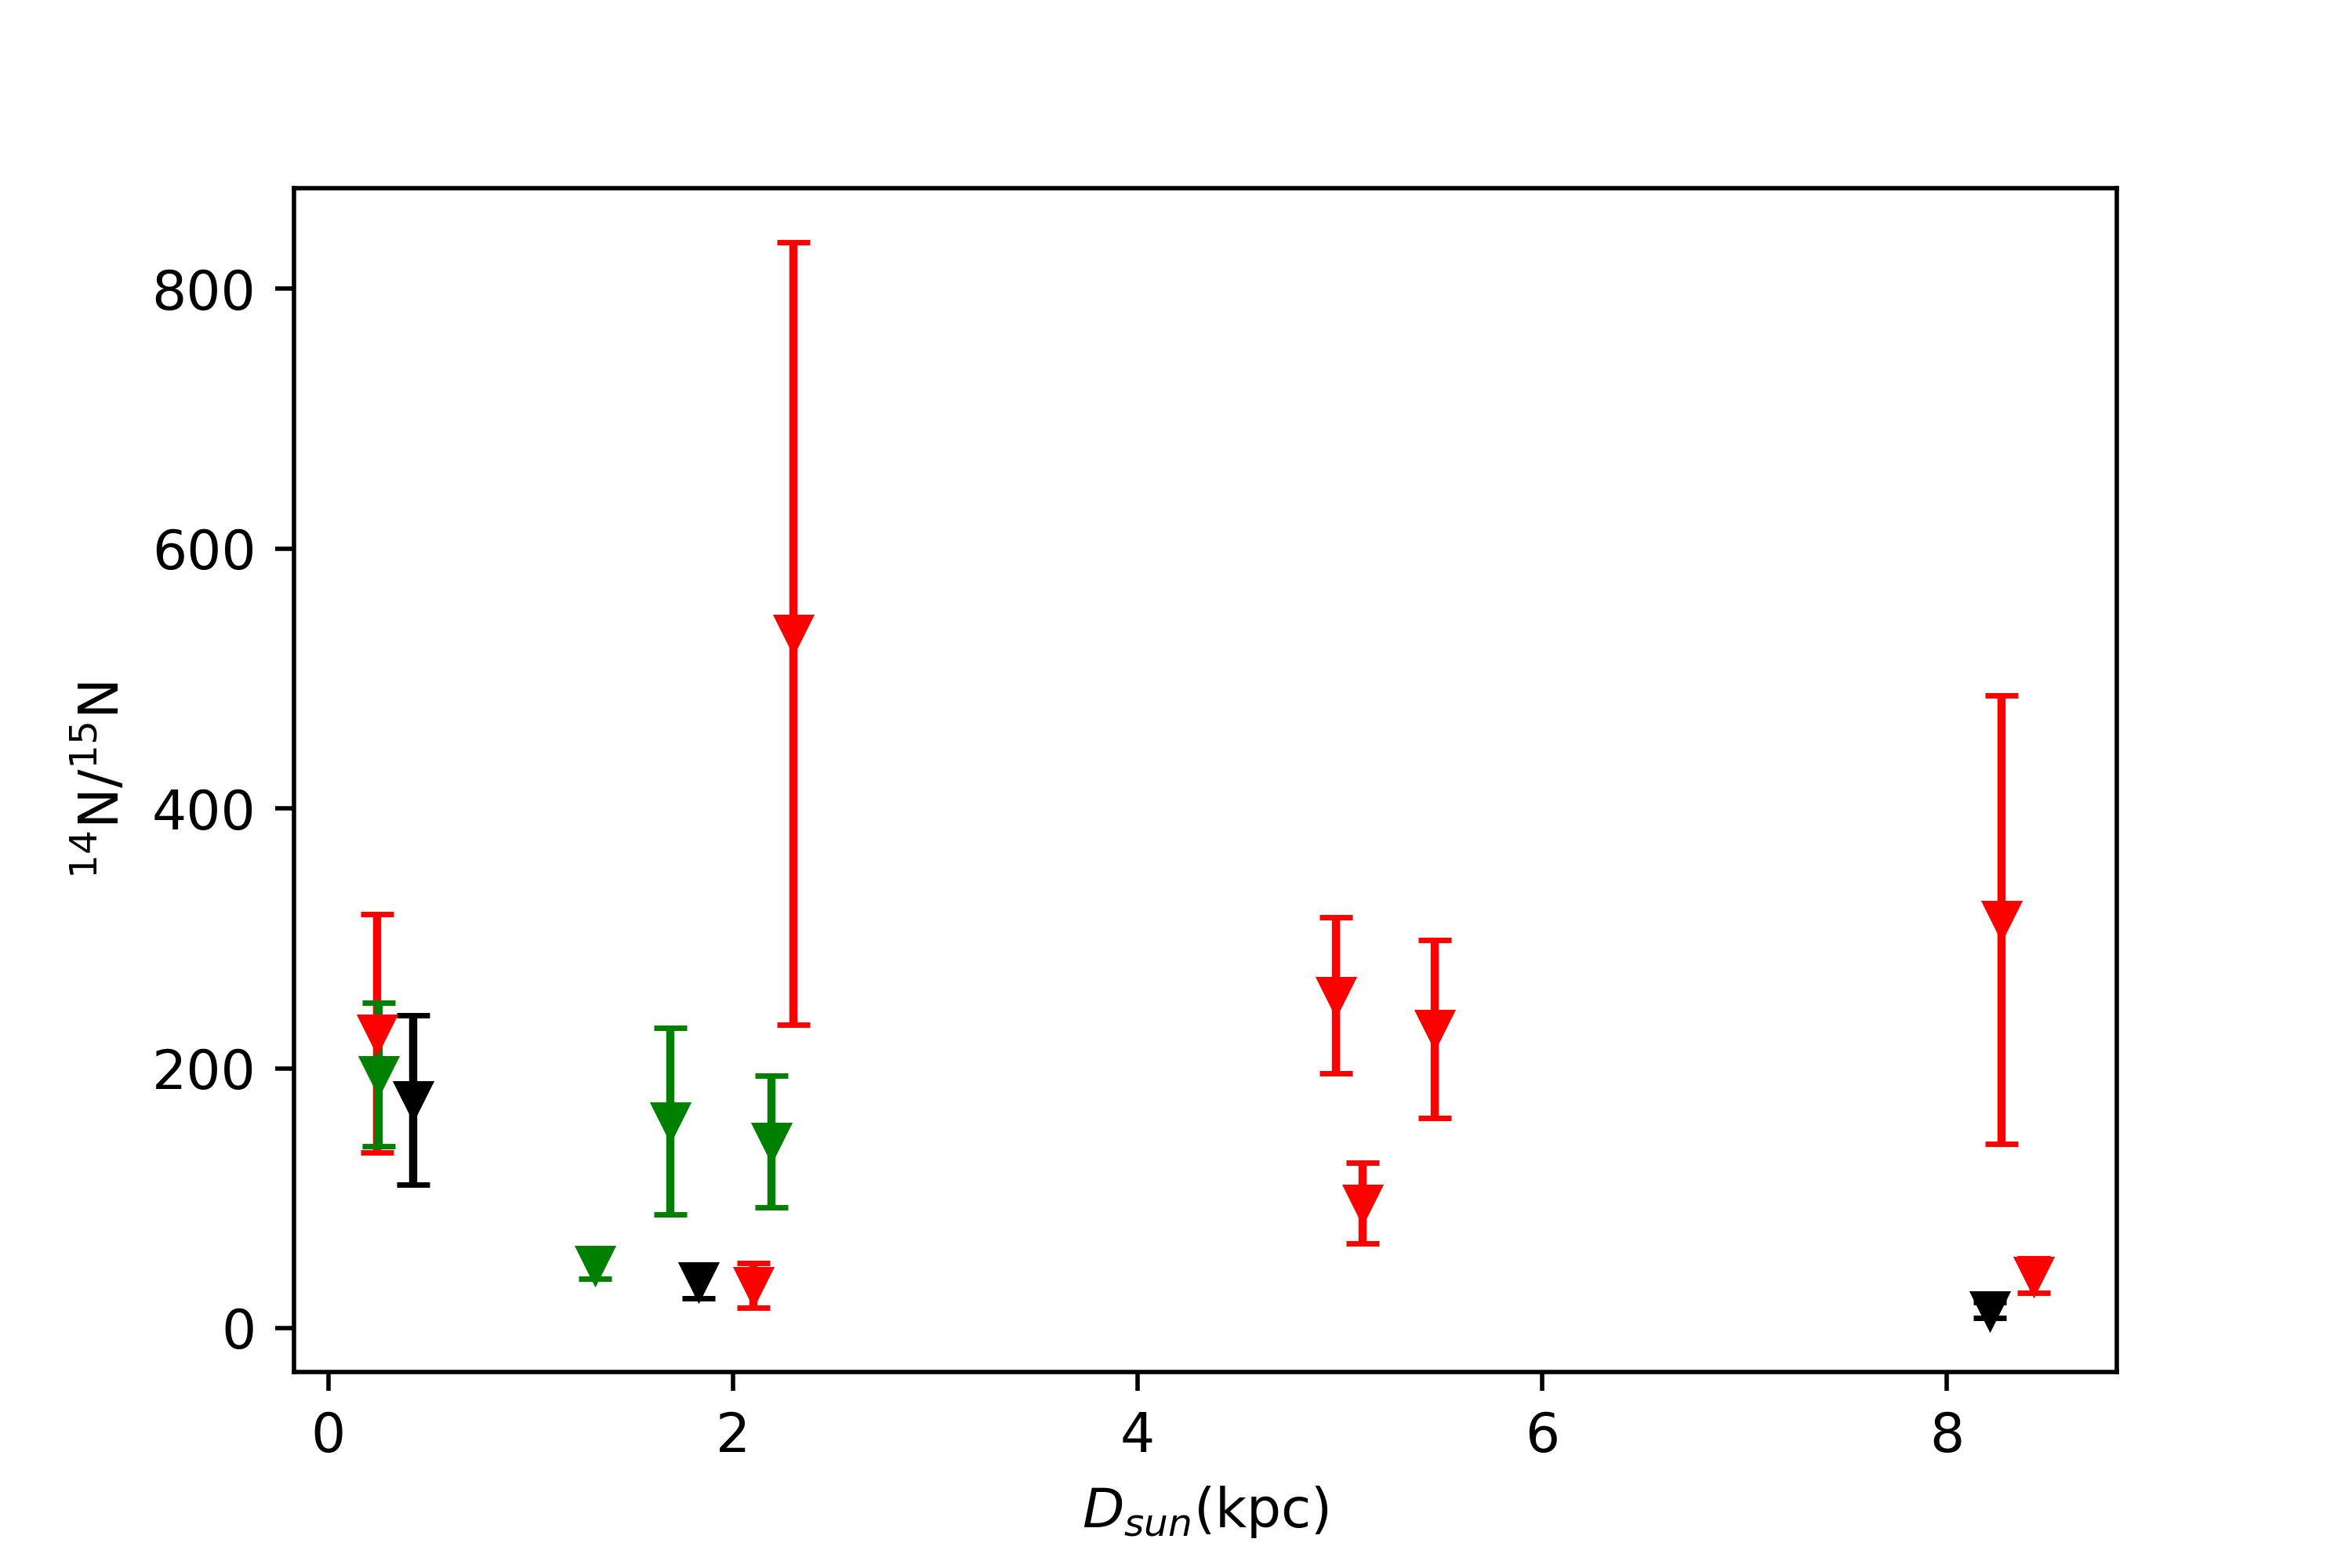
Our observations may be biased emphasizing bright sources, with possibly systematically higher 14NH3 opacities, which could lead to uncertain opacity corrections, when trying to determine 14NH3/15NH3 ratios. In addition, sources at different distance imply different linear beam sizes covered by the telescope. A larger linear size of sources at larger distances may include more relatively diffuse low-density gas of different kinetic temperature, which could affect the isotope ratio results. In order to assess possible observational effects on abundance ratios, we plot the abundance ratio against the heliocentric distance in Figure 6. It shows no systematic dependence between the ratio and the distance, which indicates that observational bias related to beam dilution is not significant. This is supported by the comparison of abundance ratios for the three sources (Orion-KL, W51D and G081.75) detected by both telescopes, which gives consistent ratio values within uncertainties (see Table 5).
4.3 Nitrogen fractionation
To determine accurate isotopic abundance ratios from observed 14NH3/15NH3 line intensities, the possibility of chemical nitrogen fractionation should also be briefly discussed. Although there is a number of dedicated papers (Rodgers & Charnley et al., 2008; Lis et al., 2010; Roueff et al., 2015; Colzi et al., 2018b; Wirström & Charnley, 2018; Viti et al., 2019; Loison et al., 2019), N-fractionation is still a matter of debate.
The main mechanism assumed to cause nitrogen fractionation are isotope-exchange reactions. N isotope exchange reactions normally occur at low temperatures, with 15N enhancement in CO-depleted dense gas at low temperatures of <10 K (Adams, 1981; Terzieva & Herbst, 2000; Charnley & Rodgers et al., 2002; Rodgers & Charnley et al., 2008; Fontani et al., 2015; Colzi et al., 2018b; Loison et al., 2019). However, such reactions at low temperature should be inhibited by an entrance barrier and thus the 14N/15N ratios do not change with time (Roueff et al., 2015; Wirström & Charnley, 2018), which has also been demonstrated observationally by Fontani et al. (2015) and Colzi et al. (2018b).
Another possible mechanism for the N-fractionation, isotope selective photo-dissociation, was proposed by Heays et al. (2014); Visser et al. (2018); Furuya & Aikawa (2018). 14N/15N fractionation is believed to be predominantly caused by isotope-selective photodissociation of N2 rather than isotope exchange reactions (Furuya & Aikawa, 2018).
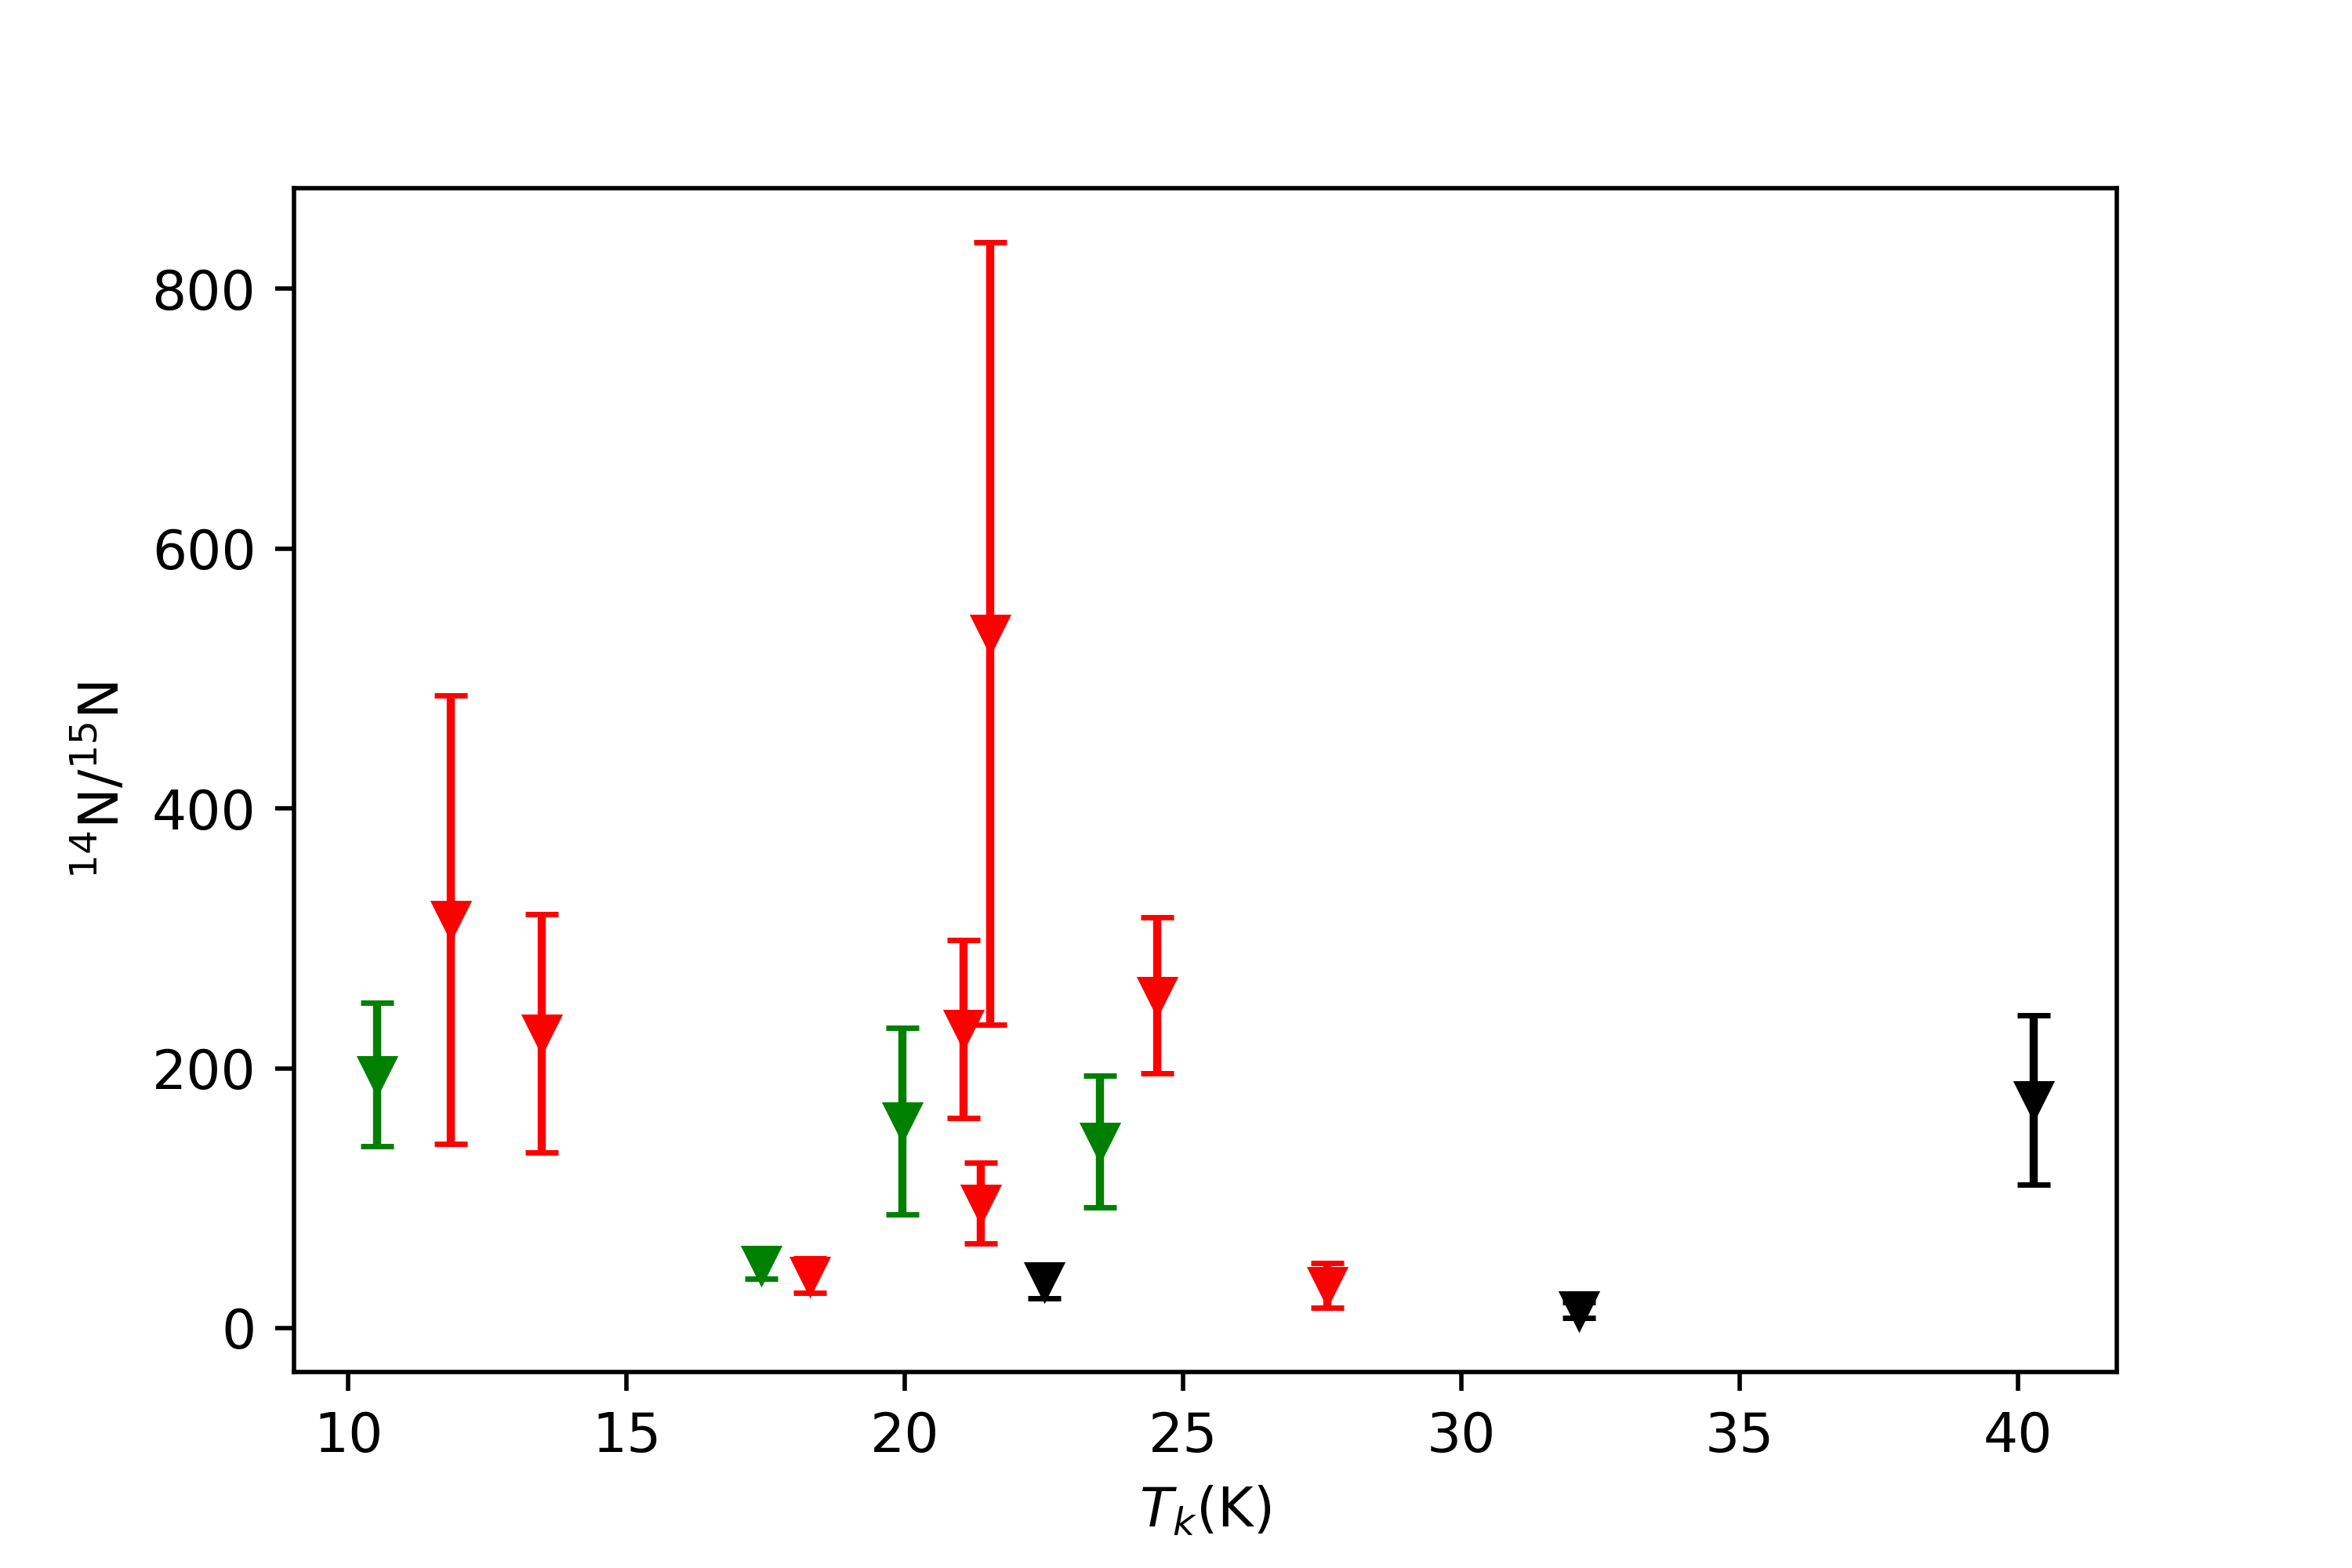
All our sources have known kinetic temperatures larger than 10 K, which may imply that 14NH3/15NH3 ratios are not seriously affected by the N-fractionation effect. The plot of 14NH3/15NH3 against the kinetic temperature of sources (Figure 7) shows no significant correlation, which may indicate that fractionation effects are not a decisive factor affecting measurements. However, nitrogen fractionation may be scale-dependent, possibly representing a local effect and observations with highly different beam sizes might provide different 14N/15N values (Colzi et al., 2019). Our measurements from single dish telescopes with a relatively larger beam size may include more relatively diffuse low-density gas, which could be affected by the interstellar radiation field. Observations with high resolution should be helpful to probe the N-fractionation effect in both the molecular cores and outskirts and to determine accurate ratio values of 14N/15N.
.
4.4 A Galactic interstellar 14N/15N gradient?
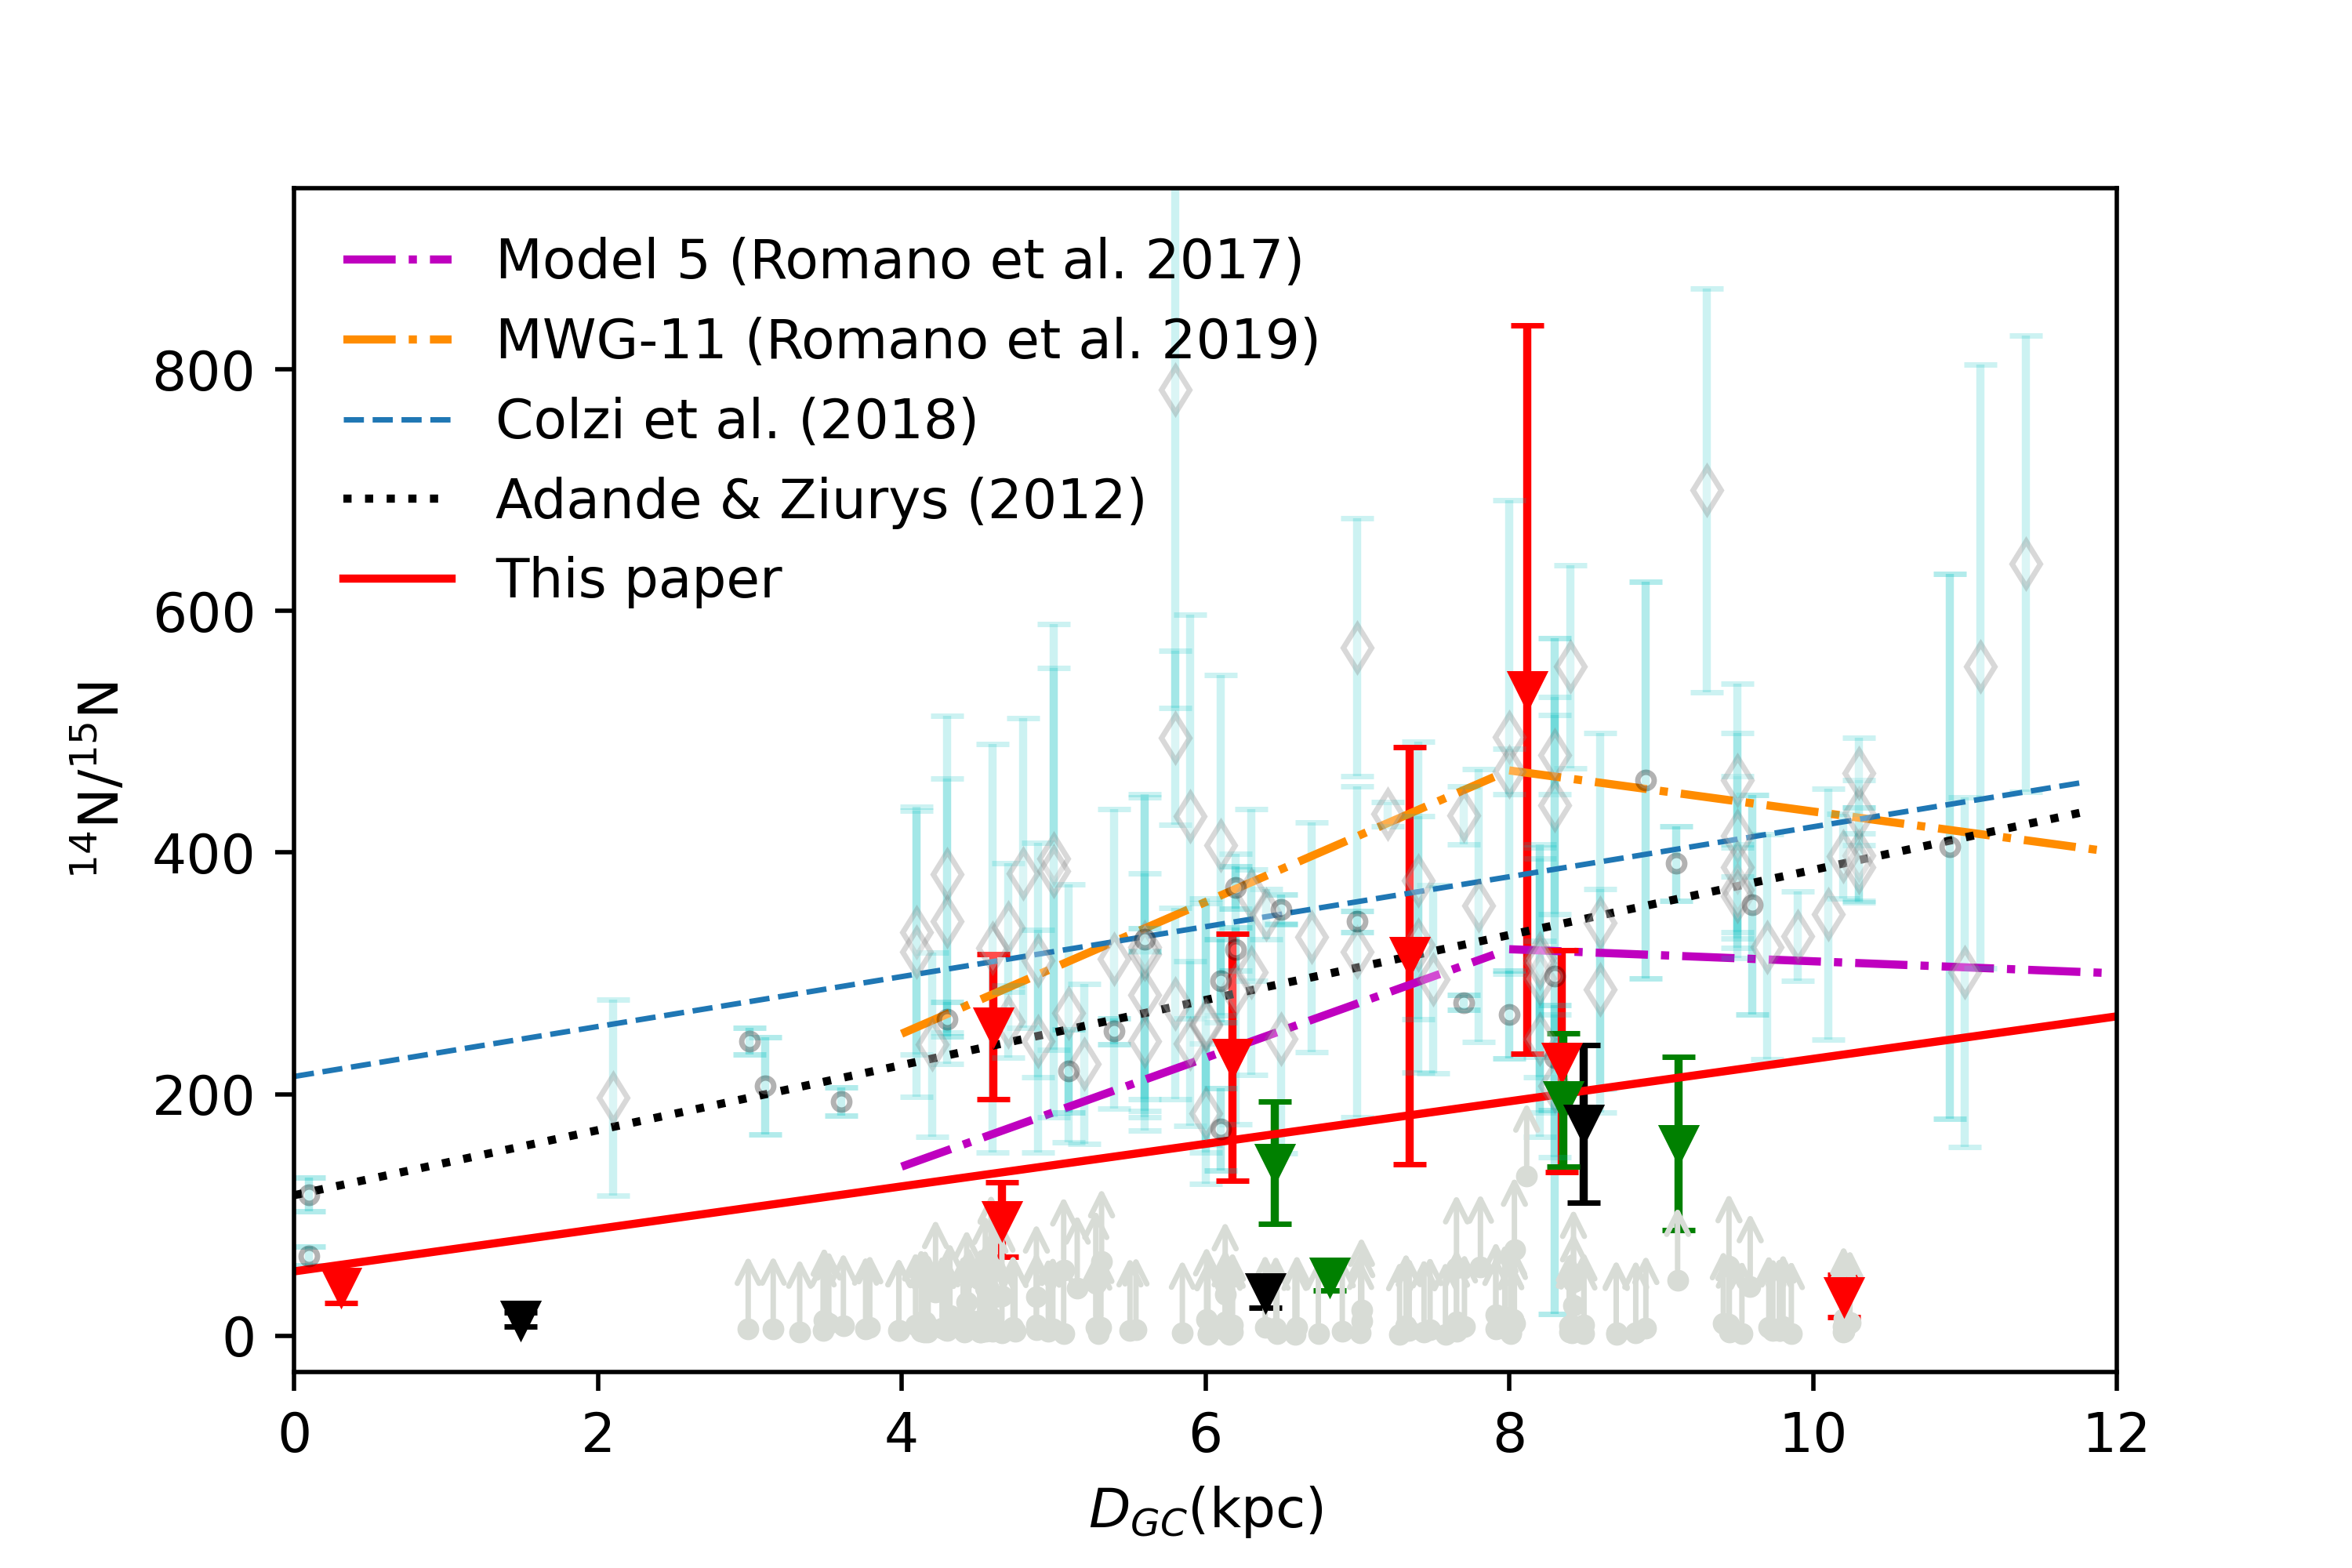
Figure 5 plots measured 14N/15N isotope ratios from 14NH3/15NH3 (inverted triangles) against galactocentric distance. Our measurement suggests that the isotope ratio increases with galactocentric distance. Our sources belong to different stages of massive star formation including 4 sources in IRDCs (green inverted triangles), 8 associated with YSOs (red inverted triangles) and 3 next to HII regions (black inverted triangles). Comparisons show that both measured ratios and the 14N/15N gradient with galactocentric radius are independent of the evolutionary stage. An unweighted linear fit was used to fit data (red solid line), in order not to bias those results toward low values with small error bars. Our data provide a weak radial gradient of , with a Pearson’s rank correlation coefficient of R = 0.35555Pearson’s rank correlation coefficient is defined in statistics as the measurement of the strength of the relationship between two variables and their association with each other. It indicates a weak correlation between 0.3 and 0.8..
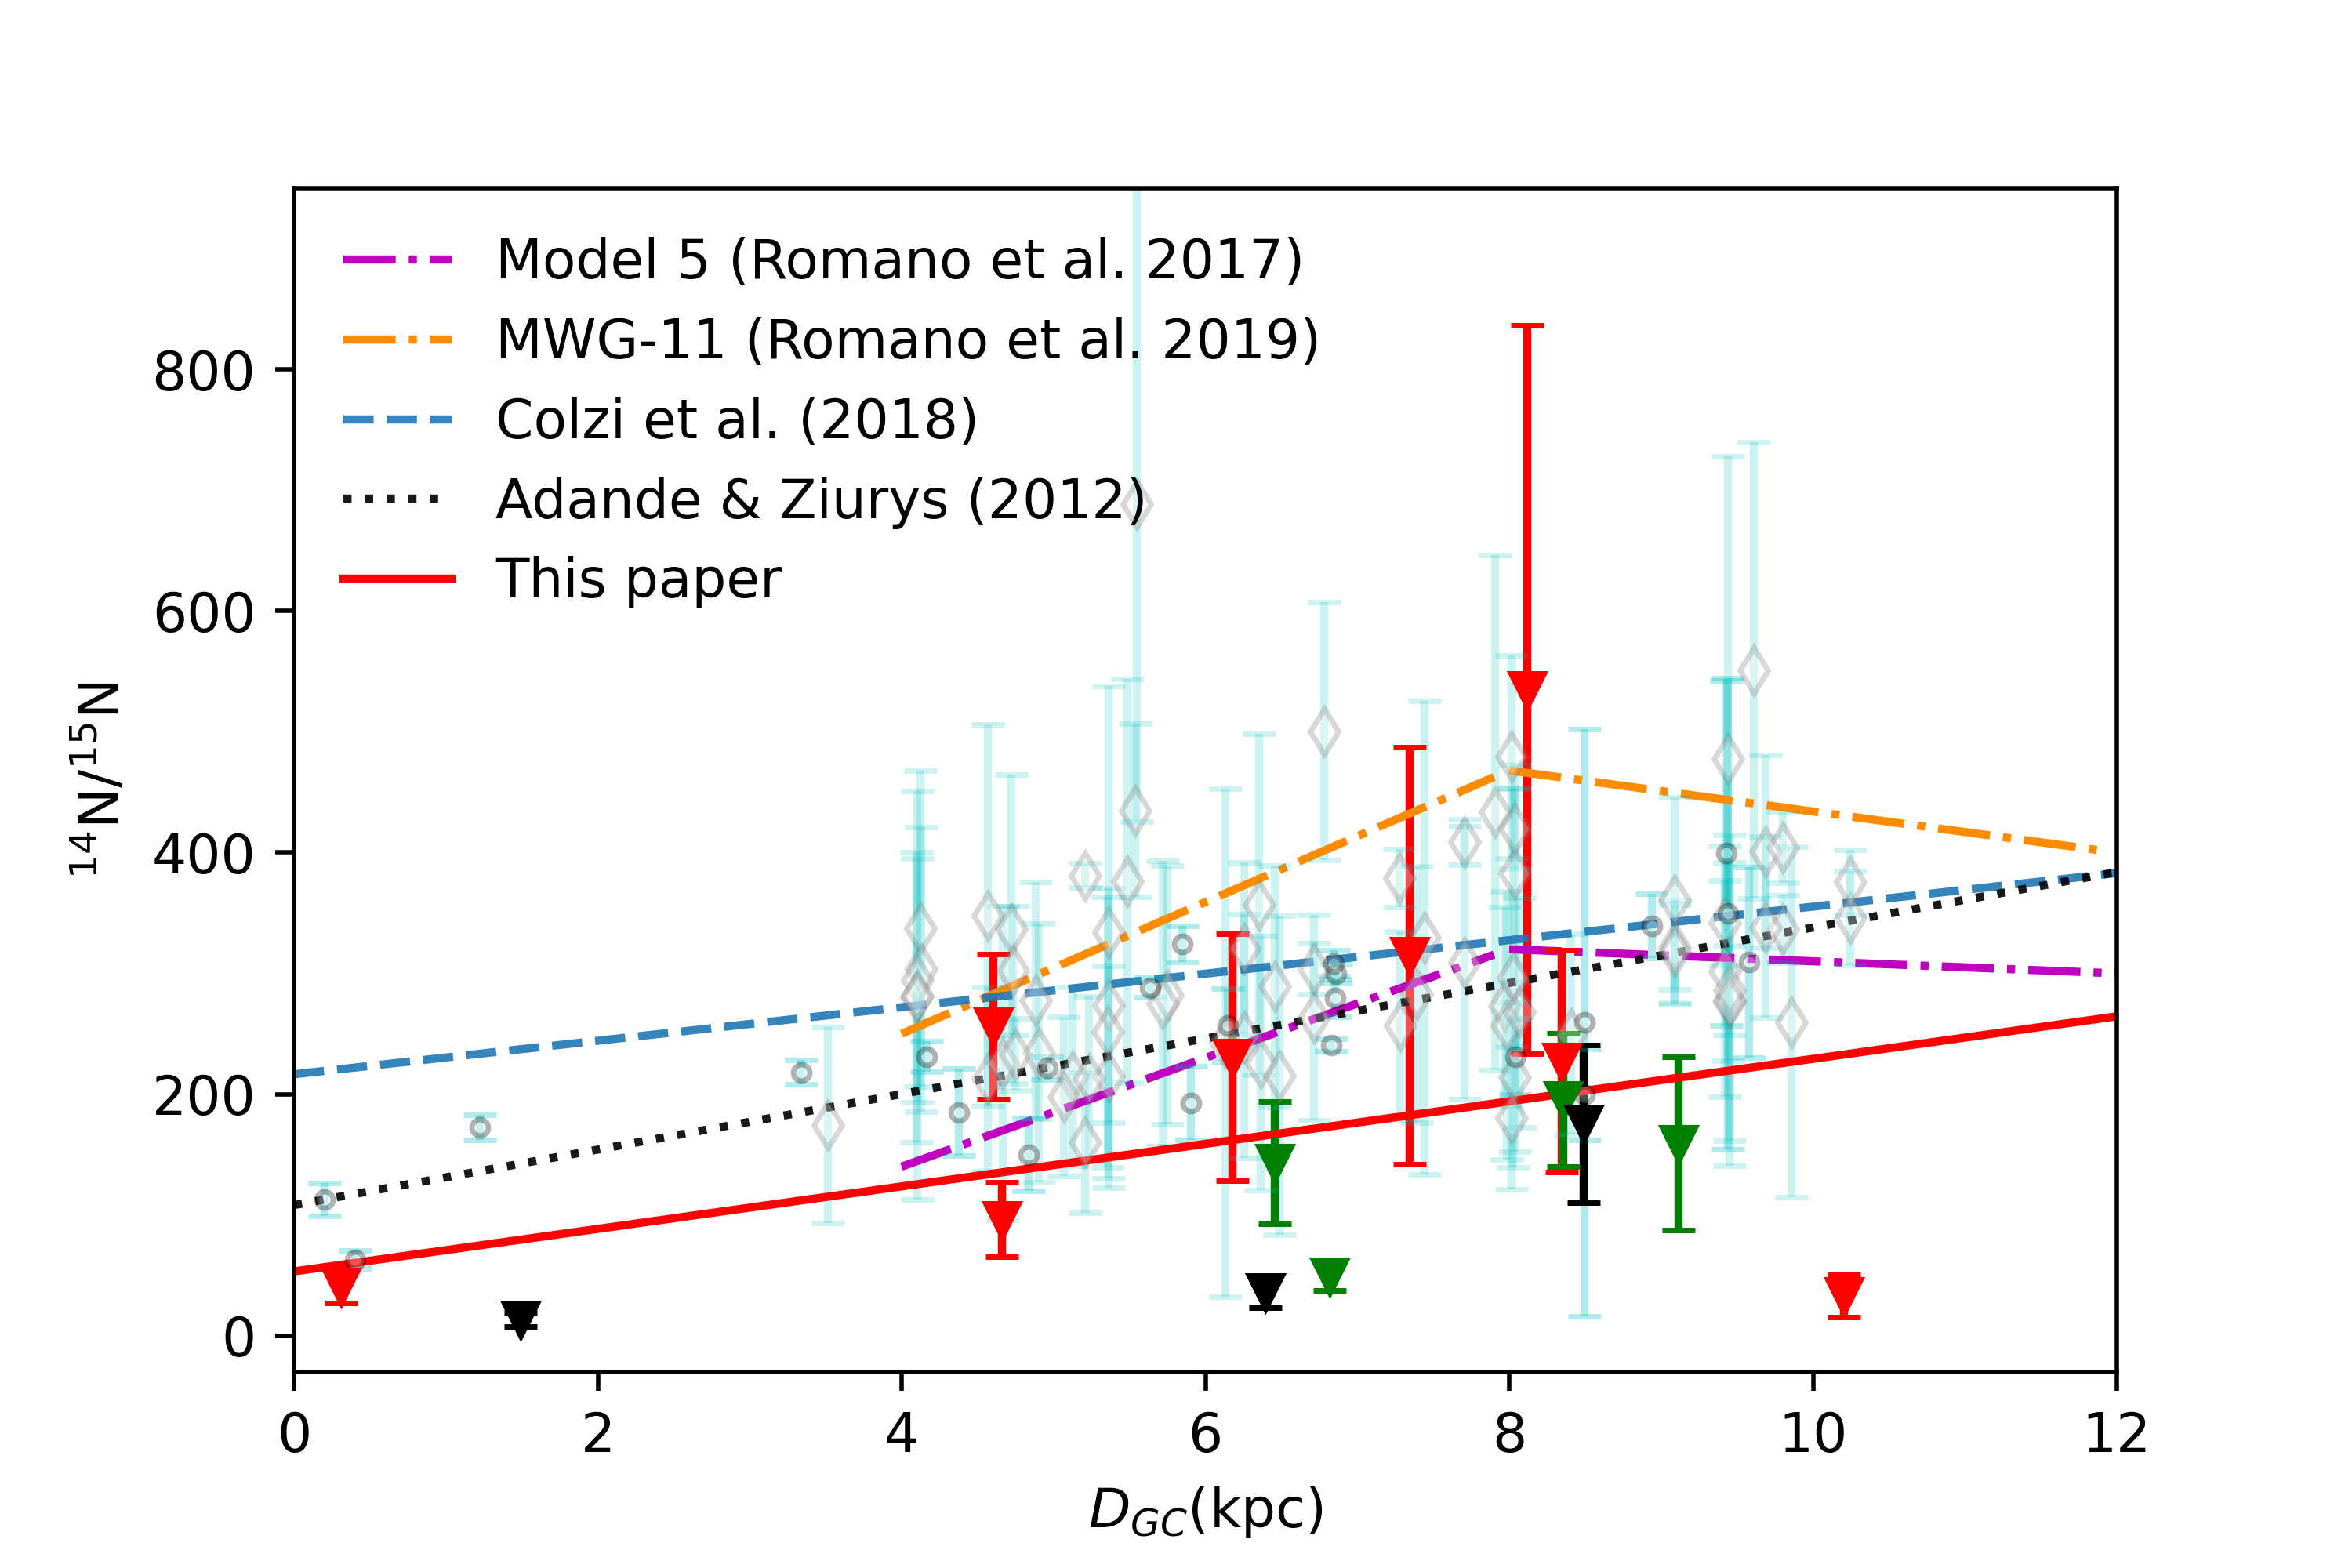
For comparison, previous measurements from HCN and/or HNC in Adande & Ziurys (2012) and Colzi et al. (2018a) are added as grey empty circles and diamonds, respectively. Fits to both data sets are shown as dashed and dotted lines in Fig. 5, respectively . We find that our ratios tend to be slightly smaller than those previous results, though a similar trend can be found. However, those results may suffer from uncertainties, using relatively early measurements of 12C/13C (Milam et al., 2005). The most recent results related to carbon isotope ratios, the only ones leading to a self-consistent interpretation of sulfur isotope ratios through the use of double isotope ratios involving 12C/13C (Yu et al., 2020), is reported by Yan et al. (2019). They presented observations of the K-doublet lines of H2CO and HCO at the C (5 GHz) and Ku (15 GHz) bands toward a large sample of Galactic molecular clouds. Thus we modify those previous results (Adande & Ziurys, 2012; Colzi et al., 2018a), taking the most recent 12C/13C ratios (Yan et al., 2019) and distance values from trigonometric parallax measurements (Reid et al., 2014, 2019). The modified previous results are plotted together with our results shown in Figure 5b. We find that their ratios decrease by about 12 - 15% and the difference between their and our results becomes smaller. This is visualized by the smaller gap between the two fitted (red solid and blue-dashed) lines. However, the difference does not vanish. This may suggest that (1) our approach using exclusively the lowest metastable inversion lines of ammonia leads to too small ratios, (2) that fractionation plays a role and/or (3) that the use of double isotope ratios adds uncertainties in the determination of nitrogen isotope ratios.
Theoretical models for Galactic chemical evolution (GCE) are important tools in understanding the isotopic ratio evolution in the Galaxy. Recently, new GCE models were developed to track the cosmic evolution of the CNO isotopes in the interstellar medium (ISM) of galaxies, yielding powerful constraints on their stellar initial mass function (IMF) (Romano et al., 2017; Zhang et al., 2018; Romano et al., 2019). The theoretical 14N/15N gradient across the Milky Way disk is shown in the magenta dash-dotted curves (Model-5 in Figure 5 in Romano et al., 2017) and the yellow dash-dotted curves (Model-11 in Figure 6 in Romano et al., 2019) in Figure 5. Nucleosynthesis prescriptions in Model 5 (Romano et al., 2017) adopted the yields for low- and intermediate-mass stars, massive stars, super-AGB stars and nova, while different initial rotation velocities for low metallicity massive stars were also considered in Model-11 (Romano et al., 2019). The trend of measured 14N/15N isotope ratios increasing with galactocentric distance is consistent with predictions of both models. And it is interesting that measurements show a ”tentative indication” of the trend to decrease from 8 up to 10 kpc (but based on only 3 sources), which is similar to predictions from both models. More data from the Galactic center and the sources with large distance (>8kpc) as well as more Galactic disk values with smaller uncertainty would still be highly desirable to better constrain this gradient.
5 Summary
To investigate the nitrogen abundance ratio varying across the Galaxy, we performed systematic observations of the (, ) = (1, 1), (2, 2) and (3, 3) transitions of 14NH3 and 15NH3 toward a large sample of 210 sources in the Galactic disk with the TMRT - 65 m and Effelsberg - 100 m telescopes. Through TMRT observations, a total of 141 objects were detected in the 14NH3 lines. 8 out of them were detected in 15NH3. In order to detect 15NH3 lines in more sources, 36 sources with strong 14NH3 signals were selected to be observed by the Effelsberg-100 m telescope. The 15NH3(1, 1) line was detected in 10 sources, including 3 sources (NGC 6334 I, Orion-KL and W51D) also detected by the TMRT. Thus, 15 sources were detected in the 15NH3(1, 1) line and 4 among them were also detected in 15NH3(2, 2) and 15NH3(3, 3). Our results include:
1) Physical parameters of the gas emitting ammonia lines for these 15 sources with detections of NH3 and 15NH3 are determined from their spectral data, including optical depths, rotation and kinetic temperatures and total column densities. The opacity-corrected total column densities of 14NH3 and 15NH3 are used to estimate their 14N/15N ratio.
2) An observational bias due to bright sources and/or effects related to different linear beam sizes is not found for our measured ratios of 14N/15N. This is supported by the fact that no systematic variations appear between the isotopic ratios and heliocentric distances and consistent ratios of the three sources detected by both the TMRT - 65 m and the Effelsberg-100 m telescopes. Fractionation remains insignificant for isotope ratios, as indicated by the correlation between abundance ratios and the kinetic temperature . This indicates that fractionation as a temperature dependent effect does not play a dominant role for our results. Other chemical processes could include the presence of a notable UV-field and related isotope selective fractionation (e.g. Weiß et al., 2001).
3) Our measured 14N/15N isotope ratios increase with galactocentric distance, which confirms the Galactic radial gradient proposed by previous studies. An unweighted linear fit gives , with a Pearson’s rank correlation coefficient of R = 0.35, which matches the trend predicted by Galactic chemical evolution models. More data from the Galactic center and the sources with large galactocentric distance (>8kpc) as well as more Galactic disk values with smaller uncertainty would still be desirable to better confirm and quantify this gradient.
References
- Adande & Ziurys (2012) Adande G. R., Ziurys L. M. 2012, ApJ, 744, 194
- Adams (1981) Adams S. 1981, ApJ, 247, L123
- Audouze et al. (1975) Audouze J., Lequeux J., & Vigroux L. 1975, A&A, 43, 71
- Camacho et al. (2020) Camacho V., Vázquez-Semadeni E., Palau A., Busquet, G., Zamora-Avilés, M. 2020, ApJ, 903, 46
- Charnley & Rodgers et al. (2002) Charnley S. B. & Rodgers S. D. 2002, ApJ, 569, 137
- Clayton (2003) Clayton D. D. 2003, Handbook of Isotopes in the Cosmos: Hydrogen to Gallium. Cambridge Univ. Press, Cambridge
- Colzi et al. (2018a) Colzi L., Fontani F., Rivilla V. M., et al. 2018a, MNRAS, 478, 3693
- Colzi et al. (2018b) Colzi, L., Fontani, F., Caselli, P., et al. 2018b, A&A, 609, A129
- Colzi et al. (2019) Colzi L., Fontani F., Caselli P. et al. 2019, MNRAS, 485,5543
- Cooper et al. (2013) Cooper H. D. B., Lumsden S. L., Oudmaijer R. D. et al. 2013, MNRAS, 1125, 1157
- Cutri et al. (2003) Cutri R. M., Skrutskie M. F., van Dyk S. et al. VizieR, 2003, 246, 2246
- Cyganowski et al. (2013) Cyganowski C. J., Koda J., Rosolowsky E., et al. 2013, ApJ, 764, 61
- Dahmen et al. (1995) Dahmen G., Wilson T. L., & Matteucci F. 1995, A&A, 295, 194
- Danby et al. (1988) Danby G., Flower D. R., Valiron P., Schilke P., & Walmsley C. M. 1988, MNRAS, 235, 229
- Daniel et al. (2013) Daniel1 F., Gérin M., Roueff E. et al. 2013, A&A, 560, A3
- Dent et al. (1984) Dent W. R. F., Little L. T., White G. J. MNRAS, 210, 173
- Fontani et al. (2015) Fontani F., Caselli P., Palau A. et al. 2015, ApJ, 808, L46
- Furuya & Aikawa (2018) Furuya, K. & Aikawa, Y. 2018, ApJ, 857, 105
- Gerin et al. (2009) Gerin M., Marcelino N., Biver N. et al. 2009, A&A, 498, L9
- Ginsburg et al. (2011) Ginsburg A., & Mirocha J. 2011, PySpecKit: Python Spectroscopic Toolkit, Astrophysics Source Code Library, ascl:1109.001
- Ginsburg et al. (2016) Ginsburg, A., Henkel, C., Ao, Y., et al. 2016, A&A, 586, A50
- Goddi et al. (2015) Goddi C., Henkel C., Zhang Q., et al. 2015, A&A, 573, 109
- Goldsmith & Langer (1999) Goldsmith P. F., & Langer W. D. 1999, ApJ, 517, 209
- Gong et al. (2015) Gong Y., Henkel C., Thorwirth S. et al. 2015, A&A, 581, A48
- Gravity Collaboration et al. (2018) Gravity Collaboration, Abuter R., Amorim A. et al. 2018, A&A, 615, L15
- Güsten & Ungerechts (1985) Güsten R., & Ungerechts H. 1985, A&A, 145, 241
- Heays et al. (2014) Heays A. N., Visser R., Gredel R. et al 2014, A&A, 562, 61
- Hermsen et al. (1985) Hermsen W., Wilson T. L., Walmsley C. M., and Batrla W. 1985, ApJ, 146, 134
- Ho & Townes (1983) Ho P. T. P., & Townes C. H. 1983a, ARA&A, 21, 239
- Izzard et al. (2004) Izzard R. G., Tout C. A., Karakas A. I., Pols O. R. 2004, MNRAS, 350, 407
- Keown et al. (2017) Keown J., Di Francesco J., Kirk, H. et al. 2017, ApJ, 850, 3
- Kim et al. (2008) Kim M. K., Hirota T., Honma M. et al. 2008, PASJ, 60, 991
- Li et al. (2003) Li D., Goldsmith P. F., & Menten K. 2003, ApJ, 587, 262
- Li et al. (2016) Li J., Shen Z.-Q., Wang J. Z. et al. 2016, ApJ, 824, 136
- Lis et al. (2010) Lis D. C., Wootten A., Gerin M., Roueff E. 2010, A&A, 52, L26
- Loison et al. (2019) Loison J. C., Wakelam V., Gratier P., et al. 2019, MNRAS, 484, 2747
- Loison et al. (2020) Loison J. C., Wakelam V., Gratier P. et al. 2020, MNRAS, 498, 4663
- Longmore et al. (2007) Longmore S. N., Burton M. G., Barnes P. J. et al. 2007, MNRAS, 379, 535
- Mangum et al. (1992) Mangum J. G., Wootten A., & Mundy L. G. 1992, ApJ, 388, 467
- Mangum et al. (2015) Mangum J. G., Shirley Y. L. 2015, PASP, 127,266
- Maud et al. (2015) Maud L. T., Moore T. J. T., Lumsden S. L. et al. 2015, MNRAS, 645, 665
- Mauersberger et al. (1987) Mauersberger R., Henkel C., Wilson T. L., 1987, A&A, 173, 352
- Mei et al. (2020) Mei Y., Chen X., Shen Z. Q., Li B. 2020, ApJ, 898, 157
- Milam et al. (2005) Milam S. N., Savage C., Brewster M. A., Ziurys L. M., & Wyckoff S. 2005, ApJ, 634, 1126
- Mills et al. (2018) Mills E. A. C., Corby J., Clements A.R. 2018, ApJ, 869, 121
- Ott et al. (1994) Ott M., Witzel A., Quirrenbach A., et al. 1994, A&A, 284, 331
- Parsons et al. (2018) Parsons H., Dempsey J. T., Thomas H. S. et al. 2018, ApJS, 234, 22
- Pickett et al. (1998) Pickett H. M., Poynter R. L., Cohen E. A. et al. 1998, JQSRT, 60, 883
- Ragan et al. (2011) Ragan S. E., Bergin E. A., & Wilner D. 2011, ApJ, 736, 163
- Reid et al. (2014) Reid M. J., Menten K. M., Brunthaler A., et al. 2014, ApJ, 783, 130
- Reid et al. (2019) Reid M. J., Menten K. M., Brunthaler A. et al. 2019, ApJ, 885, 131
- Rodgers & Charnley et al. (2008) Rodgers S. D., & Charnley S. B. 2008, MNRAS, 385, L48
- Roman-Duval et al. (2009) Roman-Duval J., Jackson J. M., Heyer M. et al. 2009, ApJ, 699, 1153
- Romano & Matteucci (2003) Romano D., Matteucci F. 2003, MNRAS, 342, 185
- Romano et al. (2017) Romano D., Matteucci F., Zhang Z. -Y., Papadopoulos P. P., Ivison R. J. 2017, MNRAS, 470, 401
- Romano et al. (2019) Romano D., Matteucci F., Zhang Z. -Y. et al. 2019, MNRAS, 490, 2838
- Rosolowsky et al. (2009) Rosolowsky E., Dunham M. K. et al. 2009, ApJS, 188: 123
- Roueff et al. (2015) Roueff E., Loison J. C., Hickson K. M. 2015, A&A, 576, A99
- Rygl et al. (2010) Rygl K. L. J., Brunthaler A., Reid M. J., et al. 2010, A&A, 511, 2
- Tafalla et al. (2004) Tafalla M., Myers P. C., Caselli P., & Walmsley C. M. 2004, A&A, 416, 191
- Terzieva & Herbst (2000) Terzieva R., & Herbst. E. 2000, MNRAS, 317, 563
- Urquhart et al. (2018) Urquhart J. S., König C., Giannetti A. et al. 2018, MNRAS, 1059, 1102
- Urquhart et al. (2011) Urquhart J. S., Morgan L. K., Figura C. C. et al. 2011, MNRAS, 418, 1689
- Visser et al. (2018) Visser R., Bruderer S., Cazzoletti P. et al 2018, A&A, 615, 75
- Viti et al. (2019) Viti S., Fontani F., Jiménez-Serra I., Holdship J. 2019, MNRAS, 486, 4805
- Wang et al. (2020) Wang S., Ren Z. Y., Li D. et al. 2020 MNRAS, 1, 19
- Wannier et al. (1981) Wannier P. G., Linke R. A., & Penzias A. A. 1981, ApJ, 247, 522
- Weiß et al. (2001) Weiß, A., Neininger, N., Henkel, C., et al. 2001, ApJ, 554, L143. doi:10.1086/321711
- Wiescher et al. (2010) Wiescher M., Görres J., Uberseder E., Imbriani G., Pignatari M. 2010, ARNPS, 60, 381
- Willis et al. (2013) Willis S., Marengo M., Allen L. et al. 2013, ApJ, 96, 20
- Wilson & Rood (1994) Wilson T. L., & Rood R. T. 1994, ARA&A, 32, 191
- Wilson (1999) Wilson T. L. 1999, RPPh, 62, 143
- Wirström & Charnley (2018) Wirström E. S., & Charnley S. B., 2018, MNRAS, 474,3720
- Wyrowski and Walmsley (1996) Wyrowski F. and Walmsley C. M. 1996, ApJ, 314,265
- Yan et al. (2019) Yan Y. T., Zhang J. S., Henkel C., Mufakharov T., 2019, ApJ, 877, 154
- Yu et al. (2020) Yu H. Z., Zhang J. S., Henke C., et al. 2020, ApJ, 899, 145
- Zhang et al. (2015) Zhang J. S., Sun L. L., Riquelme D. et al. 2015, ApJS, 219, 28
- Zhang et al. (2018) Zhang Z. Y., Romano D., Ivison R. J., Papadopoulos Padelis P., Matteucci F. 2018, Natur, 558, 260
- Zhou et al. (2020) Zhou D. D., Wu G., Esimbek J., Henkel C., Zhou J.J. 2020, A&A, 640, 114
| Object | Telescope | (2000) (2000) | time | Molecule | r.m.s. | Object | Telescope | (2000) (2000) | time | Molecule | r.m.s. |
|---|---|---|---|---|---|---|---|---|---|---|---|
| () () | (min) | (mK) | () () | (min) | (mK) | ||||||
| G032.04 | TMRT | 18:49:36 -00:45:37.1 | 11 | 14NH3(1,1) | 47 | G192.60 | TMRT | 06:12:54.02 +17:59:23.3 | 30 | 14NH3(1,1) | 85 |
| 14NH3(2,2) | 66 | 14NH3(2,2) | 68 | ||||||||
| 14NH3(3,3) | 62 | 14NH3(3,3) | 75 | ||||||||
| 15NH3(1,1) | 78 | 15NH3(1,1) | 95 | ||||||||
| 15NH3(2,2) | 77 | 15NH3(2,2) | 85 | ||||||||
| 15NH3(3,3) | 78 | 15NH3(3,3) | 71 | ||||||||
| G053.23 | TMRT | 19:29:33 +18:01:00.6 | 65 | 14NH3(1,1) | 26 | G192.60 | TMRT | 06:12:53.99 17:59:23.70 | 9 | 14NH3(1,1) | 71 |
| 14NH3(2,2) | 29 | 14NH3(2,2) | 74 | ||||||||
| 14NH3(3,3) | 29 | 14NH3(3,3) | 70 | ||||||||
| 15NH3(1,1) | 73 | 15NH3(1,1) | 78 | ||||||||
| 15NH3(2,2) | 38 | 15NH3(2,2) | 78 | ||||||||
| 15NH3(3,3) | 135 | 15NH3(3,3) | 71 | ||||||||
| G081.75 | TMRT | 20:39:02 +42:24:58.6 | 360 | 14NH3(1,1) | 19 | G206.54 | TMRT | 05:41:44.14 -01:54:45.90 | 9 | 14NH3(1,1) | 79 |
| 14NH3(2,2) | 19 | 14NH3(2,2) | 83 | ||||||||
| 14NH3(3,3) | 14 | 14NH3(3,3) | 80 | ||||||||
| 15NH3(1,1) | 26 | 15NH3(1,1) | 85 | ||||||||
| 15NH3(2,2) | 19 | 15NH3(2,2) | 75 | ||||||||
| 15NH3(3,3) | 16 | 15NH3(3,3) | 69 | ||||||||
| G121.29 | TMRT | 00:36:47 +63:29:02.2 | 331 | 14NH3(1,1) | 15 | G209.00 | TMRT | 05:35:15.80 -05:23:14.1 | 9 | 14NH3(1,1) | 146 |
| 14NH3(2,2) | 16 | 14NH3(2,2) | 142 | ||||||||
| 14NH3(3,3) | 13 | 14NH3(3,3) | 149 | ||||||||
| 15NH3(1,1) | 37 | 15NH3(1,1) | 298 | ||||||||
| 15NH3(2,2) | 29 | 15NH3(2,2) | 229 | ||||||||
| 15NH3(3,3) | 35 | 15NH3(3,3) | 102 | ||||||||
| G30.70 | TMRT | 18:47:36 -02:00:58.2 | 15 | 14NH3(1,1) | 70 | G209.01 | TMRT | 05:35:13.95 -05:24:09.40 | 9 | 14NH3(1,1) | 97 |
| 14NH3(2,2) | 74 | 14NH3(2,2) | 123 | ||||||||
| 14NH3(3,3) | 68 | 14NH3(3,3) | 11 | ||||||||
| 15NH3(1,1) | 57 | 15NH3(1,1) | 98 | ||||||||
| 15NH3(2,2) | 54 | 15NH3(2,2) | 94 | ||||||||
| 15NH3(3,3) | 59 | 15NH3(3,3) | 81 | ||||||||
| NGC 6334 I | TMRT | 17:20:53 -35:47:01.2 | 33 | 14NH3(1,1) | 114 | G21.39 | TMRT | 18:31:03.79 -10:22:44.77 | 9 | 14NH3(1,1) | 59 |
| 14NH3(2,2) | 49 | 14NH3(2,2) | 57 | ||||||||
| 14NH3(3,3) | 36 | 14NH3(3,3) | 85 | ||||||||
| 15NH3(1,1) | 47 | 15NH3(1,1) | 79 | ||||||||
| 15NH3(2,2) | 47 | 15NH3(2,2) | 55 | ||||||||
| 15NH3(3,3) | 42 | 15NH3(3,3) | 86 | ||||||||
| Orion-KL | TMRT | 05:35:14.4 -05:22:29.6 | 94 | 14NH3(1,1) | 37 | G213.70 | TMRT | 06:07:47.85 -06:22:55.20 | 15 | 14NH3(1,1) | 88 |
| 14NH3(2,2) | 42 | 14NH3(2,2) | 84 | ||||||||
| 14NH3(3,3) | 33 | 14NH3(3,3) | 139 | ||||||||
| 15NH3(1,1) | 54 | 15NH3(1,1) | 98 | ||||||||
| 15NH3(2,2) | 29 | 15NH3(2,2) | 93 | ||||||||
| 15NH3(3,3) | 26 | 15NH3(3,3) | 101 | ||||||||
| W51D | TMRT | 19:23:40.1 14:31:07.1 | 72 | 14NH3(1,1) | 93 | G22.35 | TMRT | 18:31:42.86 -09:22:26.45 | 6 | 14NH3(1,1) | 64 |
| 14NH3(2,2) | 24 | 14NH3(2,2) | 55 | ||||||||
| 14NH3(3,3) | 30 | 14NH3(3,3) | 91 | ||||||||
| 15NH3(1,1) | 16 | 15NH3(1,1) | 84 | ||||||||
| 15NH3(2,2) | 17 | 15NH3(2,2) | 52 | ||||||||
| 15NH3(3,3) | 11 | 15NH3(3,3) | 77 | ||||||||
| G016.92 | Eff | 18:18:08.5 -13:45:05.7 | 60 | 14NH3(1,1) | 20 | G22.55 | TMRT | 18:34:12.7 -09:28:21.4 | 20 | 14NH3(1,1) | 60 |
| 14NH3(2,2) | 16 | 14NH3(2,2) | 58 | ||||||||
| 14NH3(3,3) | 40 | 14NH3(3,3) | 51 | ||||||||
| 15NH3(1,1) | 17 | 15NH3(1,1) | 48 | ||||||||
| 15NH3(2,2) | 20 | 15NH3(2,2) | 52 | ||||||||
| 15NH3(3,3) | 19 | 15NH3(3,3) | 61 | ||||||||
| G10.47 | Eff | 18:08:38.2 -19:51:49.6 | 60 | 14NH3(1,1) | 30 | G23.01 | TMRT | 18:34:39.73 -09:00:43.50 | 33 | 14NH3(1,1) | 48 |
| 14NH3(2,2) | 34 | 14NH3(2,2) | 36 | ||||||||
| 14NH3(3,3) | 39 | 14NH3(3,3) | 42 | ||||||||
| 15NH3(1,1) | 36 | 15NH3(1,1) | 42 | ||||||||
| 15NH3(2,2) | 61 | 15NH3(1,1) | 42 | ||||||||
| 15NH3(3,3) | 34 | 15NH3(3,3) | 42 | ||||||||
| G188.79 | Eff | 06:09:06.9 +21:50:41.4 | 180 | 14NH3(1,1) | 6 | G23.27 | TMRT | 18:34:36.08 -08:42:39.71 | 9 | 14NH3(1,1) | 109 |
| 14NH3(2,2) | 8 | 14NH3(2,2) | 98 | ||||||||
| 14NH3(3,3) | 7 | 14NH3(3,3) | 104 | ||||||||
| 15NH3(1,1) | 8 | 15NH3(1,1) | 171 | ||||||||
| 15NH3(2,2) | 8 | 15NH3(2,2) | 206 | ||||||||
| 15NH3(3,3) | 7 | 15NH3(3,3) | 104 | ||||||||
| G35.14 | Eff | 18:58:07.0 01:37:11.9 | 24 | 14NH3(1,1) | 63 | G23.36 | TMRT | 18:34:53.57 -08:38:21.62 | 6 | 14NH3(1,1) | 109 |
| 14NH3(2,2) | 52 | 14NH3(2,2) | 108 | ||||||||
| 14NH3(3,3) | 67 | 14NH3(3,3) | 11 | ||||||||
| 15NH3(1,1) | 60 | 15NH3(1,1) | 101 | ||||||||
| 15NH3(2,2) | 53 | 15NH3(2,2) | 126 | ||||||||
| 15NH3(3,3) | 53 | 15NH3(3,3) | 91 | ||||||||
| NGC 1333 | Eff | 03:29:11.6 31:13:26.0 | 176 | 14NH3(1,1) | 10 | G232.62 | TMRT | 07:32:09.78 -16:58:12.8 | 30 | 14NH3(1,1) | 92 |
| 14NH3(2,2) | 12 | 14NH3(2,2) | 90 | ||||||||
| 14NH3(3,3) | 12 | 14NH3(3,3) | 84 | ||||||||
| 15NH3(1,1) | 11 | 15NH3(1,1) | 83 | ||||||||
| 15NH3(2,2) | 10 | 15NH3(2,2) | 79 | ||||||||
| 15NH3(3,3) | 12 | 15NH3(3,3) | 70 | ||||||||
| G000.19 | Eff | 17:47:52.7 -28:59:59.9 | 60 | 14NH3(1,1) | 31 | G232.62 | TMRT | 07:32:09.79 -16:58:12.40 | 16 | 14NH3(1,1) | 57 |
| 14NH3(2,2) | 30 | 14NH3(2,2) | 74 | ||||||||
| 14NH3(3,3) | 25 | 14NH3(3,3) | 53 | ||||||||
| 15NH3(1,1) | 42 | 15NH3(1,1) | 97 | ||||||||
| 15NH3(2,2) | 29 | 15NH3(2,2) | 92 | ||||||||
| 15NH3(3,3) | 49 | 15NH3(3,3) | 104 | ||||||||
| Barnard-1b | Eff | 03:33:20.8 +31:07:34.0 | 184 | 14NH3(1,1) | 18 | G24.54 | TMRT | 18:36:56.02 -07:34:23.62 | 6 | 14NH3(1,1) | 135 |
| 14NH3(2,2) | 17 | 14NH3(2,2) | 13 | ||||||||
| 14NH3(3,3) | 10 | 14NH3(3,3) | 126 | ||||||||
| 15NH3(1,1) | 11 | 15NH3(1,1) | 133 | ||||||||
| 15NH3(2,2) | 10 | 15NH3(2,2) | 125 | ||||||||
| 15NH3(3,3) | 11 | 15NH3(3,3) | 147 | ||||||||
| G032.41 | TMRT | 18:47:33.2 -01:12:45.8 | 4.5 | 14NH3(1,1) | 73 | G24.79 | TMRT | 18:36:12.67 -07:12:10.64 | 9 | 14NH3(1,1) | 91 |
| 14NH3(2,2) | 61 | 14NH3(2,2) | 87 | ||||||||
| 14NH3(3,3) | 57 | 14NH3(3,3) | 89 | ||||||||
| 15NH3(1,1) | 52 | 15NH3(1,1) | 93 | ||||||||
| 15NH3(2,2) | 46 | 15NH3(2,2) | 88 | ||||||||
| 15NH3(3,3) | 34 | 15NH3(3,3) | 77 | ||||||||
| G111.54 | TMRT | 23:13:45.36 +61:28:10.6 | 37 | 14NH3(1,1) | 28 | G26.33 | TMRT | 18:38:51.95 -05:48:55.87 | 9 | 14NH3(1,1) | 129 |
| 14NH3(2,2) | 39 | 14NH3(2,2) | 139 | ||||||||
| 14NH3(3,3) | 41 | 14NH3(3,3) | 2600 | ||||||||
| 15NH3(1,1) | 36 | 15NH3(1,1) | 126 | ||||||||
| 15NH3(2,2) | 43 | 15NH3(2,2) | 137 | ||||||||
| 15NH3(3,3) | 44 | 15NH3(3,3) | 13 | ||||||||
| G007.89 | TMRT | 18:03:23.7 -22:07:45.9 | 9 | 14NH3(1,1) | 55 | G26.50 | TMRT | 18:37:07.14 -05:23:59.38 | 9 | 14NH3(1,1) | 236 |
| 14NH3(2,2) | 58 | 14NH3(2,2) | 134 | ||||||||
| 14NH3(3,3) | 81 | 14NH3(3,3) | 151 | ||||||||
| 15NH3(1,1) | 95 | 15NH3(1,1) | 127 | ||||||||
| 15NH3(2,2) | 55 | 15NH3(2,2) | 137 | ||||||||
| 15NH3(3,3) | 54 | 15NH3(3,3) | 194 | ||||||||
| G007.99 | TMRT | 18:04:33.5 -22:10:24.3 | 6 | 14NH3(1,1) | 163 | G27.37 | TMRT | 18:41:51.15 -05:01:42.51 | 9 | 14NH3(1,1) | 61 |
| 14NH3(2,2) | 105 | 14NH3(2,2) | 83 | ||||||||
| 14NH3(3,3) | 12 | 14NH3(3,3) | 70 | ||||||||
| 15NH3(1,1) | 113 | 15NH3(1,1) | 75 | ||||||||
| 15NH3(2,2) | 21 | 15NH3(2,2) | 65 | ||||||||
| 15NH3(3,3) | 152 | 15NH3(3,3) | 66 | ||||||||
| G008.40 | TMRT | 18:05:30.1 -21:49:42.1 | 4.5 | 14NH3(1,1) | 66 | G28.20 | TMRT | 18:43:02.68 -04:14:52.49 | 9 | 14NH3(1,1) | 122 |
| 14NH3(2,2) | 68 | 14NH3(2,2) | 125 | ||||||||
| 14NH3(3,3) | 95 | 14NH3(3,3) | 133 | ||||||||
| 15NH3(1,1) | 132 | 15NH3(1,1) | 132 | ||||||||
| 15NH3(2,2) | 56 | 15NH3(2,2) | 116 | ||||||||
| 15NH3(3,3) | 58 | 15NH3(3,3) | 177 | ||||||||
| G008.67 | TMRT | 18:06:19.0 -21:37:30.5 | 7.5 | 14NH3(1,1) | 116 | G29.60 | TMRT | 18:47:32.9 -03:15:00.9 | 24 | 14NH3(1,1) | 45 |
| 14NH3(2,2) | 113 | 14NH3(2,2) | 37 | ||||||||
| 14NH3(3,3) | 112 | 14NH3(3,3) | 37 | ||||||||
| 15NH3(1,1) | 181 | 15NH3(1,1) | 37 | ||||||||
| 15NH3(2,2) | 128 | 15NH3(2,2) | 40 | ||||||||
| 15NH3(3,3) | 128 | 15NH3(3,3) | 38 | ||||||||
| G008.83 | TMRT | 18:05:25.9 -21:19:25.4 | 9 | 14NH3(1,1) | 12 | G29.91 | TMRT | 18:46:05.48 -02:42:26.99 | 9 | 14NH3(1,1) | 69 |
| 14NH3(2,2) | 133 | 14NH3(2,2) | 70 | ||||||||
| 14NH3(3,3) | 99 | 14NH3(3,3) | 65 | ||||||||
| 15NH3(1,1) | 124 | 15NH3(1,1) | 66 | ||||||||
| 15NH3(2,2) | 147 | 15NH3(2,2) | 68 | ||||||||
| 15NH3(3,3) | 247 | 15NH3(3,3) | 66 | ||||||||
| G008.87 | TMRT | 18:07:15.9 -21:30:51.1 | 6 | 14NH3(1,1) | 76 | G30.42 | TMRT | 18:47:40.27 -02:20:29.02 | 9 | 14NH3(1,1) | 81 |
| 14NH3(2,2) | 67 | 14NH3(2,2) | 77 | ||||||||
| 14NH3(3,3) | 105 | 14NH3(3,3) | 82 | ||||||||
| 15NH3(1,1) | 12 | 15NH3(1,1) | 75 | ||||||||
| 15NH3(2,2) | 131 | 15NH3(2,2) | 67 | ||||||||
| 15NH3(3,3) | 119 | 15NH3(3,3) | 72 | ||||||||
| G009.03 | TMRT | 18:07:42.9 -21:23:14.2 | 3 | 14NH3(1,1) | 242 | G30.71 | TMRT | 18:47:41.42 -02:00:41.63 | 9 | 14NH3(1,1) | 472 |
| 14NH3(2,2) | 167 | 14NH3(2,2) | 506 | ||||||||
| 14NH3(3,3) | 178 | 14NH3(3,3) | 292 | ||||||||
| 15NH3(1,1) | 14 | 15NH3(1,1) | 136 | ||||||||
| 15NH3(2,2) | 142 | 15NH3(2,2) | 978 | ||||||||
| 15NH3(3,3) | 309 | 15NH3(3,3) | 592 | ||||||||
| G009.21 | TMRT | 18:06:52.6 -21:04:36.9 | 3 | 14NH3(1,1) | 368 | G30.72 | TMRT | 18:47:41.14 -02:00:26.94 | 9 | 14NH3(1,1) | 108 |
| 14NH3(2,2) | 428 | 14NH3(2,2) | 132 | ||||||||
| 14NH3(3,3) | 102 | 14NH3(3,3) | 2810 | ||||||||
| 15NH3(1,1) | 511 | 15NH3(1,1) | 142 | ||||||||
| 15NH3(2,2) | 461 | 15NH3(2,2) | 151 | ||||||||
| 15NH3(3,3) | 445 | 15NH3(3,3) | 132 | ||||||||
| G009.28 | TMRT | 18:06:49.2 -20:59:22.4 | 9 | 14NH3(1,1) | 14 | G30.83 | TMRT | 18:47:48.87 -01:54:00.57 | 9 | 14NH3(1,1) | 24 |
| 14NH3(2,2) | 144 | 14NH3(2,2) | 134 | ||||||||
| 14NH3(3,3) | 717 | 14NH3(3,3) | 5570 | ||||||||
| 15NH3(1,1) | 144 | 15NH3(1,1) | 159 | ||||||||
| 15NH3(2,2) | 141 | 15NH3(2,2) | 149 | ||||||||
| 15NH3(3,3) | 147 | 15NH3(3,3) | 137 | ||||||||
| G009.620 | TMRT | 18:06:14.9 -20:31:40.6 | 6 | 14NH3(1,1) | 77 | G34.24 | TMRT | 18:53:21.72 01:13:37.10 | 9 | 14NH3(1,1) | 92 |
| 14NH3(2,2) | 94 | 14NH3(2,2) | 115 | ||||||||
| 14NH3(3,3) | 148 | 14NH3(3,3) | 93 | ||||||||
| 15NH3(1,1) | 135 | 15NH3(1,1) | 83 | ||||||||
| 15NH3(2,2) | 82 | 15NH3(2,2) | 108 | ||||||||
| 15NH3(3,3) | 132 | 15NH3(3,3) | 11 | ||||||||
| G010.50 | TMRT | 18:00:34.584 -18:45:17.64 | 3 | 14NH3(1,1) | 124 | G35.19 | TMRT | 18:58:11.96 01:40:23.87 | 6 | 14NH3(1,1) | 149 |
| 14NH3(2,2) | 121 | 14NH3(2,2) | 125 | ||||||||
| 14NH3(3,3) | 107 | 14NH3(3,3) | 117 | ||||||||
| 15NH3(1,1) | 131 | 15NH3(1,1) | 331 | ||||||||
| 15NH3(2,2) | 119 | 15NH3(2,2) | 18 | ||||||||
| 15NH3(3,3) | 122 | 15NH3(3,3) | 175 | ||||||||
| G010.62 | TMRT | 18:10:19.32 -19:54:12.96 | 9 | 14NH3(1,1) | 215 | G38.36 | TMRT | 19:04:45.46 04:23:16.91 | 27 | 14NH3(1,1) | 13 |
| 14NH3(2,2) | 64 | 14NH3(2,2) | 121 | ||||||||
| 14NH3(3,3) | 75 | 14NH3(3,3) | 118 | ||||||||
| 15NH3(1,1) | 86 | 15NH3(1,1) | 142 | ||||||||
| 15NH3(2,2) | 84 | 15NH3(2,2) | 139 | ||||||||
| 15NH3(3,3) | 77 | 15NH3(3,3) | 134 | ||||||||
| G011.42 | TMRT | 18:16:56.856 -19:51:07.2 | 3 | 14NH3(1,1) | 109 | G38.91 | TMRT | 19:03:38.66 05:09:42.5 | 6 | 14NH3(1,1) | 265 |
| 14NH3(2,2) | 115 | 14NH3(2,2) | 251 | ||||||||
| 14NH3(3,3) | 107 | 14NH3(3,3) | 246 | ||||||||
| 15NH3(1,1) | 108 | 15NH3(1,1) | 292 | ||||||||
| 15NH3(2,2) | 124 | 15NH3(2,2) | 29 | ||||||||
| 15NH3(3,3) | 109 | 15NH3(3,3) | 24 | ||||||||
| G012.90 | TMRT | 18:14:39.7 -17:51:59.0 | 60 | 14NH3(1,1) | 19 | G48.99 | TMRT | 19:22:26.19 14:06:38.76 | 9 | 14NH3(1,1) | 159 |
| 14NH3(2,2) | 17 | 14NH3(2,2) | 127 | ||||||||
| 14NH3(3,3) | 22 | 14NH3(3,3) | 2690 | ||||||||
| 15NH3(1,1) | 30 | 15NH3(1,1) | 153 | ||||||||
| 15NH3(2,2) | 27 | 15NH3(2,2) | 151 | ||||||||
| 15NH3(3,3) | 28 | 15NH3(3,3) | 123 | ||||||||
| G012.95 | TMRT | 18:14:35.40 -17:48:03.50 | 9 | 14NH3(1,1) | 148 | G49.27 | TMRT | 19:23:06.99 14:20:15.94 | 8 | 14NH3(1,1) | 14 |
| 14NH3(2,2) | 162 | 14NH3(2,2) | 104 | ||||||||
| 14NH3(3,3) | 111 | 14NH3(3,3) | 106 | ||||||||
| 15NH3(1,1) | 166 | 15NH3(1,1) | 352 | ||||||||
| 15NH3(2,2) | 162 | 15NH3(2,2) | 209 | ||||||||
| 15NH3(3,3) | 15 | 15NH3(3,3) | 17 | ||||||||
| G013.33 | TMRT | 18:14:41.7 -17:23:26.1 | 55 | 14NH3(1,1) | 33 | J005224.20 | TMRT | 00:52:24.20 56:33:43.17 | 9 | 14NH3(1,1) | 119 |
| 14NH3(2,2) | 36 | 14NH3(2,2) | 135 | ||||||||
| 14NH3(3,3) | 24 | 14NH3(3,3) | 125 | ||||||||
| 15NH3(1,1) | 26 | 15NH3(1,1) | 113 | ||||||||
| 15NH3(2,2) | 23 | 15NH3(2,2) | 152 | ||||||||
| 15NH3(3,3) | 30 | 15NH3(3,3) | 122 | ||||||||
| G016.86 | TMRT | 18:29:24.264 -15:15:42.12 | 9 | 14NH3(1,1) | 134 | J053048.02 | TMRT | 05:30:48.02 33:47:54.61 | 9 | 14NH3(1,1) | 71 |
| 14NH3(2,2) | 139 | 14NH3(2,2) | 68 | ||||||||
| 14NH3(3,3) | 153 | 14NH3(3,3) | 67 | ||||||||
| 15NH3(1,1) | 155 | 15NH3(1,1) | 78 | ||||||||
| 15NH3(2,2) | 153 | 15NH3(2,2) | 76 | ||||||||
| 15NH3(3,3) | 148 | 15NH3(3,3) | 65 | ||||||||
| G016.92 | TMRT | 18:18:08.592 -13:45:05.76 | 6 | 14NH3(1,1) | 143 | J053913.06 | TMRT | 05:39:13.06 35:45:51.29 | 9 | 14NH3(1,1) | 93 |
| 14NH3(2,2) | 154 | 14NH3(2,2) | 96 | ||||||||
| 14NH3(3,3) | 146 | 14NH3(3,3) | 98 | ||||||||
| 15NH3(1,1) | 123 | 15NH3(1,1) | 102 | ||||||||
| 15NH3(2,2) | 121 | 15NH3(2,2) | 92 | ||||||||
| 15NH3(3,3) | 283 | 15NH3(3,3) | 92 | ||||||||
| G018.30 | TMRT | 18:25:42.4 -13:10:20.2 | 118 | 14NH3(1,1) | 15 | J055111.10 | TMRT | 05:51:11.10 25:46:16.50 | 9 | 14NH3(1,1) | 50 |
| 14NH3(2,2) | 15 | 14NH3(2,2) | 66 | ||||||||
| 14NH3(3,3) | 16 | 14NH3(3,3) | 62 | ||||||||
| 15NH3(1,1) | 18 | 15NH3(1,1) | 73 | ||||||||
| 15NH3(2,2) | 16 | 15NH3(2,2) | 73 | ||||||||
| 15NH3(3,3) | 16 | 15NH3(3,3) | 68 | ||||||||
| G018.82 | TMRT | 18:26:59.016 -12:44:47.04 | 9 | 14NH3(1,1) | 113 | J213958.26 | TMRT | 21:39:58.26 50:14:20.96 | 9 | 14NH3(1,1) | 81 |
| 14NH3(2,2) | 136 | 14NH3(2,2) | 85 | ||||||||
| 14NH3(3,3) | 164 | 14NH3(3,3) | 91 | ||||||||
| 15NH3(1,1) | 10 | 15NH3(1,1) | 107 | ||||||||
| 15NH3(2,2) | 123 | 15NH3(2,2) | 106 | ||||||||
| 15NH3(3,3) | 263 | 15NH3(3,3) | 90 | ||||||||
| G018.83 | TMRT | 18:27:02.352 -12:44:43.08 | 9 | 14NH3(1,1) | 178 | J221918.30 | TMRT | 22:19:18.30 63:18:48.00 | 9 | 14NH3(1,1) | 101 |
| 14NH3(2,2) | 167 | 14NH3(2,2) | 101 | ||||||||
| 14NH3(3,3) | 158 | 14NH3(3,3) | 88 | ||||||||
| 15NH3(1,1) | 21 | 15NH3(1,1) | 106 | ||||||||
| 15NH3(2,2) | 217 | 15NH3(2,2) | 96 | ||||||||
| 15NH3(3,3) | 204 | 15NH3(3,3) | 85 | ||||||||
| G019.88 | TMRT | 18:29:14.6 -11:50:23.8 | 14 | 14NH3(1,1) | 106 | J225617.90 | TMRT | 22:56:17.90 62:01:49.65 | 71 | 14NH3(1,1) | 34 |
| 14NH3(2,2) | 96 | 14NH3(2,2) | 27 | ||||||||
| 14NH3(3,3) | 96 | 14NH3(3,3) | 49 | ||||||||
| 15NH3(1,1) | 13 | 15NH3(1,1) | 26 | ||||||||
| 15NH3(2,2) | 106 | 15NH3(2,2) | 23 | ||||||||
| 15NH3(3,3) | 109 | 15NH3(3,3) | 113 | ||||||||
| G019.92 | TMRT | 18:28:18.84 -11:40:37.56 | 9 | 14NH3(1,1) | 97 | J225847.50 | TMRT | 22:58:47.50 58:45:01.40 | 9 | 14NH3(1,1) | 94 |
| 14NH3(2,2) | 96 | 14NH3(2,2) | 87 | ||||||||
| 14NH3(3,3) | 106 | 14NH3(3,3) | 81 | ||||||||
| 15NH3(1,1) | 272 | 15NH3(1,1) | 92 | ||||||||
| 15NH3(2,2) | 16 | 15NH3(2,2) | 9 | ||||||||
| 15NH3(3,3) | 99 | 15NH3(3,3) | 82 | ||||||||
| G019.92 | TMRT | 18:28:18.9 -11:40:36.6 | 6 | 14NH3(1,1) | 15 | J231610.00 | TMRT | 23:16:10.00 59:55:31.30 | 9 | 14NH3(1,1) | 84 |
| 14NH3(2,2) | 131 | 14NH3(2,2) | 79 | ||||||||
| 14NH3(3,3) | 134 | 14NH3(3,3) | 81 | ||||||||
| 15NH3(1,1) | 281 | 15NH3(1,1) | 83 | ||||||||
| 15NH3(2,2) | 173 | 15NH3(2,2) | 88 | ||||||||
| 15NH3(3,3) | 162 | 15NH3(3,3) | 78 | ||||||||
| G020.23 | TMRT | 18:27:44.8 -11:14:52.2 | 9 | 14NH3(1,1) | 45 | G121.29 | TMRT | 00:36:47.3 +63:29:02.2 | 60 | 14NH3(1,1) | 21 |
| 14NH3(2,2) | 55 | 14NH3(2,2) | 21 | ||||||||
| 14NH3(3,3) | 87 | 14NH3(3,3) | 27 | ||||||||
| 15NH3(1,1) | 51 | 15NH3(1,1) | 27 | ||||||||
| 15NH3(2,2) | 53 | 15NH3(2,2) | 18 | ||||||||
| 15NH3(3,3) | 47 | 15NH3(3,3) | 23 | ||||||||
| G022.41 | TMRT | 18:30:57.5 -09:12:04.4 | 9 | 14NH3(1,1) | 51 | G31.41 | TMRT | 18:47:34.5 -01:12:43.0 | 12 | 14NH3(1,1) | 39 |
| 14NH3(2,2) | 54 | 14NH3(2,2) | 42 | ||||||||
| 14NH3(3,3) | 75 | 14NH3(3,3) | 35 | ||||||||
| 15NH3(1,1) | 51 | 15NH3(1,1) | 45 | ||||||||
| 15NH3(2,2) | 55 | 15NH3(2,2) | 48 | ||||||||
| 15NH3(3,3) | 54 | 15NH3(3,3) | 48 | ||||||||
| G024.18 | TMRT | 18:34:57.24 -07:43:26.76 | 9 | 14NH3(1,1) | 80 | SGR B | TMRT | 17:47:20.8 -28:23:32.1 | 106 | 14NH3(1,1) | 54 |
| 14NH3(2,2) | 78 | 14NH3(2,2) | 38 | ||||||||
| 14NH3(3,3) | 77 | 14NH3(3,3) | 33 | ||||||||
| 15NH3(1,1) | 91 | 15NH3(1,1) | 365 | ||||||||
| 15NH3(2,2) | 83 | 15NH3(2,2) | 426 | ||||||||
| 15NH3(3,3) | 80 | 15NH3(3,3) | 372 | ||||||||
| G025.46 | TMRT | 18:38:30.072 -06:44:29.4 | 9 | 14NH3(1,1) | 68 | G043.16 | TMRT | 19:10:13.41 +09:06:12.8 | 9 | 14NH3(1,1) | 78 |
| 14NH3(2,2) | 65 | 14NH3(2,2) | 64 | ||||||||
| 14NH3(3,3) | 69 | 14NH3(3,3) | 69 | ||||||||
| 15NH3(1,1) | 72 | 15NH3(1,1) | 91 | ||||||||
| 15NH3(2,2) | 73 | 15NH3(2,2) | 68 | ||||||||
| 15NH3(3,3) | 64 | 15NH3(3,3) | 63 | ||||||||
| G028.20 | TMRT | 18:42:58.176 -04:13:56.28 | 9 | 14NH3(1,1) | 91 | G000.86 | TMRT | 17:47:54.70 -28:14:09.93 | 9 | 14NH3(1,1) | 55 |
| 14NH3(2,2) | 113 | 14NH3(2,2) | 47 | ||||||||
| 14NH3(3,3) | 99 | 14NH3(3,3) | 47 | ||||||||
| 15NH3(1,1) | 121 | 15NH3(1,1) | 46 | ||||||||
| 15NH3(2,2) | 111 | 15NH3(2,2) | 40 | ||||||||
| 15NH3(3,3) | 11 | 15NH3(3,3) | 38 | ||||||||
| G028.33 | TMRT | 18:42:37.176 -04:02:01.68 | 9 | 14NH3(1,1) | 136 | G019.54 | TMRT | 18:28:18.8 -12:06:22.7 | 9 | 14NH3(1,1) | 68 |
| 14NH3(2,2) | 147 | 14NH3(2,2) | 78 | ||||||||
| 14NH3(3,3) | 551 | 14NH3(3,3) | 69 | ||||||||
| 15NH3(1,1) | 163 | 15NH3(1,1) | 64 | ||||||||
| 15NH3(2,2) | 194 | 15NH3(2,2) | 87 | ||||||||
| 15NH3(3,3) | 143 | 15NH3(3,3) | 71 | ||||||||
| G028.64 | TMRT | 18:30:01.4 -02:03:42.8 | 24 | 14NH3(1,1) | 40 | G020.23 | TMRT | 18:27:39.6 -11:14:28.7 | 9 | 14NH3(1,1) | 85 |
| 14NH3(2,2) | 41 | 14NH3(2,2) | 62 | ||||||||
| 14NH3(3,3) | 51 | 14NH3(3,3) | 87 | ||||||||
| 15NH3(1,1) | 54 | 15NH3(1,1) | 68 | ||||||||
| 15NH3(2,2) | 50 | 15NH3(2,2) | 67 | ||||||||
| 15NH3(3,3) | 46 | 15NH3(3,3) | 85 | ||||||||
| G029.59 | TMRT | 18:47:31.704 -03:15:14.04 | 9 | 14NH3(1,1) | 162 | G023.98 | TMRT | 18:33:14.8 -07:43:34.3 | 9 | 14NH3(1,1) | 89 |
| 14NH3(2,2) | 146 | 14NH3(2,2) | 61 | ||||||||
| 14NH3(3,3) | 328 | 14NH3(3,3) | 74 | ||||||||
| 15NH3(1,1) | 166 | 15NH3(1,1) | 61 | ||||||||
| 15NH3(2,2) | 147 | 15NH3(2,2) | 73 | ||||||||
| 15NH3(3,3) | 132 | 15NH3(3,3) | 81 | ||||||||
| G031.94 | TMRT | 18:49:22.2 -00:50:29.6 | 9 | 14NH3(1,1) | 46 | G043.79 | TMRT | 19:11:53.99 +09:35:50.3 | 9 | 14NH3(1,1) | 68 |
| 14NH3(2,2) | 50 | 14NH3(2,2) | 89 | ||||||||
| 14NH3(3,3) | 73 | 14NH3(3,3) | 81 | ||||||||
| 15NH3(1,1) | 47 | 15NH3(1,1) | 83 | ||||||||
| 15NH3(2,2) | 45 | 15NH3(2,2) | 89 | ||||||||
| 15NH3(3,3) | 50 | 15NH3(3,3) | 74 | ||||||||
| G032.02 | TMRT | 18:49:32.7 -00:46:55.4 | 9 | 14NH3(1,1) | 56 | G045.07 | TMRT | 19:13:22.04 +10:50:53.3 | 9 | 14NH3(1,1) | 64 |
| 14NH3(2,2) | 54 | 14NH3(2,2) | 65 | ||||||||
| 14NH3(3,3) | 81 | 14NH3(3,3) | 63 | ||||||||
| 15NH3(1,1) | 48 | 15NH3(1,1) | 79 | ||||||||
| 15NH3(2,2) | 48 | 15NH3(2,2) | 83 | ||||||||
| 15NH3(3,3) | 48 | 15NH3(3,3) | 70 | ||||||||
| G032.04 | TMRT | 18:49:36.3 -00:45:37.1 | 24 | 14NH3(1,1) | 43 | G048.60 | TMRT | 19:20:31.18 +13:55:25.2 | 9 | 14NH3(1,1) | 79 |
| 14NH3(2,2) | 25 | 14NH3(2,2) | 89 | ||||||||
| 14NH3(3,3) | 60 | 14NH3(3,3) | 87 | ||||||||
| 15NH3(1,1) | 44 | 15NH3(1,1) | 63 | ||||||||
| 15NH3(2,2) | 53 | 15NH3(2,2) | 88 | ||||||||
| 15NH3(3,3) | 43 | 15NH3(3,3) | 71 | ||||||||
| G033.91 | TMRT | 18:52:50.52 +00:55:28.92 | 30 | 14NH3(1,1) | 55 | G049.19 | TMRT | 19:22:57.77 +14:16:10.0 | 9 | 14NH3(1,1) | 71 |
| 14NH3(2,2) | 43 | 14NH3(2,2) | 84 | ||||||||
| 14NH3(3,3) | 71 | 14NH3(3,3) | 89 | ||||||||
| 15NH3(1,1) | 98 | 15NH3(1,1) | 73 | ||||||||
| 15NH3(2,2) | 45 | 15NH3(2,2) | 66 | ||||||||
| 15NH3(3,3) | 89 | 15NH3(3,3) | 85 | ||||||||
| G033.91 | TMRT | 18:52:50.52 +00:55:28.92 | 12 | 14NH3(1,1) | 113 | G059.47 | TMRT | 19:43:26.04 23:20:28.2 | 9 | 14NH3(1,1) | 62 |
| 14NH3(2,2) | 116 | 14NH3(2,2) | 61 | ||||||||
| 14NH3(3,3) | 107 | 14NH3(3,3) | 80 | ||||||||
| 15NH3(1,1) | 116 | 15NH3(1,1) | 79 | ||||||||
| 15NH3(2,2) | 118 | 15NH3(2,2) | 76 | ||||||||
| 15NH3(3,3) | 117 | 15NH3(3,3) | 80 | ||||||||
| G034.40 | TMRT | 18:53:18.6 +01:24:49.68 | 4.5 | 14NH3(1,1) | 194 | G059.78 | TMRT | 19:43:09.648 +23:44:27.96 | 9 | 14NH3(1,1) | 85 |
| 14NH3(2,2) | 215 | 14NH3(2,2) | 90 | ||||||||
| 14NH3(3,3) | 162 | 14NH3(3,3) | 71 | ||||||||
| 15NH3(1,1) | 188 | 15NH3(1,1) | 74 | ||||||||
| 15NH3(2,2) | 198 | 15NH3(2,2) | 82 | ||||||||
| 15NH3(3,3) | 234 | 15NH3(3,3) | 61 | ||||||||
| G035.19 | TMRT | 18:58:13.08 +01:40:39.36 | 9 | 14NH3(1,1) | 93 | G071.52 | TMRT | 20:12:56.34 33:30:31.4 | 9 | 14NH3(1,1) | 83 |
| 14NH3(2,2) | 112 | 14NH3(2,2) | 86 | ||||||||
| 14NH3(3,3) | 109 | 14NH3(3,3) | 66 | ||||||||
| 15NH3(1,1) | 179 | 15NH3(1,1) | 70 | ||||||||
| 15NH3(2,2) | 148 | 15NH3(2,2) | 77 | ||||||||
| 15NH3(3,3) | 131 | 15NH3(3,3) | 70 | ||||||||
| G035.46 | TMRT | 18:55:34.368 +02:19:09.48 | 6 | 14NH3(1,1) | 125 | G075.29 | TMRT | 20:16:16.01 +37:35:45.8 | 9 | 14NH3(1,1) | 77 |
| 14NH3(2,2) | 143 | 14NH3(2,2) | 61 | ||||||||
| 14NH3(3,3) | 134 | 14NH3(3,3) | 83 | ||||||||
| 15NH3(1,1) | 159 | 15NH3(1,1) | 75 | ||||||||
| 15NH3(2,2) | 155 | 15NH3(2,2) | 78 | ||||||||
| 15NH3(3,3) | 173 | 15NH3(3,3) | 73 | ||||||||
| G038.35 | TMRT | 19:04:44.8 04:23:17.8 | 60 | 14NH3(1,1) | 15 | G076.38 | TMRT | 20:27:25.48 +37:22:48.5 | 9 | 14NH3(1,1) | 73 |
| 14NH3(2,2) | 22 | 14NH3(2,2) | 69 | ||||||||
| 14NH3(3,3) | 18 | 14NH3(3,3) | 60 | ||||||||
| 15NH3(1,1) | 18 | 15NH3(1,1) | 86 | ||||||||
| 15NH3(2,2) | 20 | 15NH3(2,2) | 88 | ||||||||
| 15NH3(3,3) | 19 | 15NH3(3,3) | 63 | ||||||||
| G043.30 | TMRT | 19:11:16.944 +09:07:30 | 9 | 14NH3(1,1) | 209 | G090.21 | TMRT | 21:02:22.70 +50:03:08.3 | 9 | 14NH3(1,1) | 85 |
| 14NH3(2,2) | 217 | 14NH3(2,2) | 72 | ||||||||
| 14NH3(3,3) | 847 | 14NH3(3,3) | 84 | ||||||||
| 15NH3(1,1) | 239 | 15NH3(1,1) | 79 | ||||||||
| 15NH3(2,2) | 241 | 15NH3(2,2) | 88 | ||||||||
| 15NH3(3,3) | 222 | 15NH3(3,3) | 78 | ||||||||
| G043.89 | TMRT | 19:14:26.39 +09:22:36.5 | 9 | 14NH3(1,1) | 107 | G108.20 | TMRT | 22:49:31.48 +59:55:42.0 | 9 | 14NH3(1,1) | 82 |
| 14NH3(2,2) | 103 | 14NH3(2,2) | 84 | ||||||||
| 14NH3(3,3) | 102 | 14NH3(3,3) | 81 | ||||||||
| 15NH3(1,1) | 156 | 15NH3(1,1) | 74 | ||||||||
| 15NH3(2,2) | 152 | 15NH3(2,2) | 81 | ||||||||
| 15NH3(3,3) | 109 | 15NH3(3,3) | 76 | ||||||||
| G045.45 | TMRT | 19:14:21.27 +11:09:15.9 | 9 | 14NH3(1,1) | 156 | G108.47 | TMRT | 23:02:32.08 +56:57:51.4 | 9 | 14NH3(1,1) | 75 |
| 14NH3(2,2) | 308 | 14NH3(2,2) | 83 | ||||||||
| 14NH3(3,3) | 190 | 14NH3(3,3) | 69 | ||||||||
| 15NH3(1,1) | 126 | 15NH3(1,1) | 90 | ||||||||
| 15NH3(2,2) | 136 | 15NH3(2,2) | 80 | ||||||||
| 15NH3(3,3) | 158 | 15NH3(3,3) | 70 | ||||||||
| G045.46 | TMRT | 19:14:25.608 +11:09:27 | 3 | 14NH3(1,1) | 206 | G111.23 | TMRT | 23:17:20.79 +59:28:47.0 | 9 | 14NH3(1,1) | 89 |
| 14NH3(2,2) | 223 | 14NH3(2,2) | 69 | ||||||||
| 14NH3(3,3) | 7460 | 14NH3(3,3) | 72 | ||||||||
| 15NH3(1,1) | 28 | 15NH3(1,1) | 87 | ||||||||
| 15NH3(2,2) | 261 | 15NH3(2,2) | 67 | ||||||||
| 15NH3(3,3) | 223 | 15NH3(3,3) | 77 | ||||||||
| G048.98 | TMRT | 19:22:26.2 +14:06:37.8 | 43 | 14NH3(1,1) | 24 | G111.25 | TMRT | 23:16:10.36 +59:55:28.5 | 9 | 14NH3(1,1) | 90 |
| 14NH3(2,2) | 12 | 14NH3(2,2) | 84 | ||||||||
| 14NH3(3,3) | 24 | 14NH3(3,3) | 76 | ||||||||
| 15NH3(1,1) | 23 | 15NH3(1,1) | 72 | ||||||||
| 15NH3(2,2) | 24 | 15NH3(2,2) | 61 | ||||||||
| 15NH3(3,3) | 29 | 15NH3(3,3) | 71 | ||||||||
| G049.48 | TMRT | 19:23:39.82 +14:31:05.0 | 9 | 14NH3(1,1) | 10 | G122.01 | TMRT | 00:44:58.40 +55:46:47.6 | 9 | 14NH3(1,1) | 76 |
| 14NH3(2,2) | 92 | 14NH3(2,2) | 62 | ||||||||
| 14NH3(3,3) | 79 | 14NH3(3,3) | 83 | ||||||||
| 15NH3(1,1) | 95 | 15NH3(1,1) | 75 | ||||||||
| 15NH3(2,2) | 106 | 15NH3(2,2) | 82 | ||||||||
| 15NH3(3,3) | 74 | 15NH3(3,3) | 63 | ||||||||
| G049.4883 | TMRT | 19:23:36.576 +14:31:26.04 | 9 | 14NH3(1,1) | 88 | G123.06 | TMRT | 00:52:24.70 +56:33:50.5 | 8 | 14NH3(1,1) | 67 |
| 14NH3(2,2) | 95 | 14NH3(2,2) | 61 | ||||||||
| 14NH3(3,3) | 78 | 14NH3(3,3) | 72 | ||||||||
| 15NH3(1,1) | 91 | 15NH3(1,1) | 62 | ||||||||
| 15NH3(2,2) | 86 | 15NH3(2,2) | 79 | ||||||||
| 15NH3(3,3) | 78 | 15NH3(3,3) | 76 | ||||||||
| G053.259 | TMRT | 19:29:39.2 +18:01:34.5 | 6 | 14NH3(1,1) | 99 | G134.62 | TMRT | 02:22:51.71 +58:35:11.4 | 9 | 14NH3(1,1) | 71 |
| 14NH3(2,2) | 115 | 14NH3(2,2) | 77 | ||||||||
| 14NH3(3,3) | 86 | 14NH3(3,3) | 62 | ||||||||
| 15NH3(1,1) | 104 | 15NH3(1,1) | 93 | ||||||||
| 15NH3(2,2) | 17 | 15NH3(2,2) | 73 | ||||||||
| 15NH3(3,3) | 11 | 15NH3(3,3) | 63 | ||||||||
| G053.81 | TMRT | 19:30:55.1 +18:30:00.8 | 9 | 14NH3(1,1) | 104 | G135.27 | TMRT | 02:43:28.57 +62:57:08.4 | 9 | 14NH3(1,1) | 70 |
| 14NH3(2,2) | 134 | 14NH3(2,2) | 70 | ||||||||
| 14NH3(3,3) | 118 | 14NH3(3,3) | 82 | ||||||||
| 15NH3(1,1) | 139 | 15NH3(1,1) | 87 | ||||||||
| 15NH3(2,2) | 135 | 15NH3(2,2) | 62 | ||||||||
| 15NH3(3,3) | 135 | 15NH3(3,3) | 64 | ||||||||
| G054.10 | TMRT | 19:31:47.34 18:42:28.1 | 18 | 14NH3(1,1) | 65 | G150.52 | TMRT | 04:03:01.5 51:22:31.7 | 8 | 14NH3(1,1) | 69 |
| 14NH3(2,2) | 62 | 14NH3(2,2) | 82 | ||||||||
| 14NH3(3,3) | 64 | 14NH3(3,3) | 62 | ||||||||
| 15NH3(1,1) | 65 | 15NH3(1,1) | 83 | ||||||||
| 15NH3(2,2) | 66 | 15NH3(2,2) | 99 | ||||||||
| 15NH3(3,3) | 59 | 15NH3(3,3) | 91 | ||||||||
| G058.77 | TMRT | 19:38:49.47 23:08:17.8 | 18 | 14NH3(1,1) | 124 | G160.14 | TMRT | 05:01:40.24 +47:07:19.0 | 12 | 14NH3(1,1) | 99 |
| 14NH3(2,2) | 101 | 14NH3(2,2) | 68 | ||||||||
| 14NH3(3,3) | 99 | 14NH3(3,3) | 86 | ||||||||
| 15NH3(1,1) | 10 | 15NH3(1,1) | 92 | ||||||||
| 15NH3(2,2) | 173 | 15NH3(2,2) | 65 | ||||||||
| 15NH3(3,3) | 61 | 15NH3(3,3) | 72 | ||||||||
| G059.78 | TMRT | 19:43:11.25 +23:44:03.3 | 9 | 14NH3(1,1) | 327 | G168.06 | TMRT | 05:17:13.74 +39:22:19.9 | 9 | 14NH3(1,1) | 96 |
| 14NH3(2,2) | 262 | 14NH3(2,2) | 70 | ||||||||
| 14NH3(3,3) | 242 | 14NH3(3,3) | 74 | ||||||||
| 15NH3(1,1) | 463 | 15NH3(1,1) | 94 | ||||||||
| 15NH3(2,2) | 41 | 15NH3(2,2) | 87 | ||||||||
| 15NH3(3,3) | 391 | 15NH3(3,3) | 71 | ||||||||
| G059.83 | TMRT | 19:40:59.41 24:04:31.6 | 18 | 14NH3(1,1) | 68 | G18.91 | TMRT | 18:27:43.24 -12:44:54.34 | 9 | 14NH3(1,1) | 79 |
| 14NH3(2,2) | 68 | 14NH3(2,2) | 92 | ||||||||
| 14NH3(3,3) | 57 | 14NH3(3,3) | 95 | ||||||||
| 15NH3(1,1) | 65 | 15NH3(1,1) | 91 | ||||||||
| 15NH3(2,2) | 69 | 15NH3(2,2) | 99 | ||||||||
| 15NH3(3,3) | 70 | 15NH3(3,3) | 94 | ||||||||
| G069.54 | TMRT | 20:10:09.07 +31:31:36.0 | 9 | 14NH3(1,1) | 148 | G182.67 | TMRT | 05:39:28.42 +24:56:32.1 | 9 | 14NH3(1,1) | 86 |
| 14NH3(2,2) | 177 | 14NH3(2,2) | 82 | ||||||||
| 14NH3(3,3) | 2380 | 14NH3(3,3) | 83 | ||||||||
| 15NH3(1,1) | 123 | 15NH3(1,1) | 91 | ||||||||
| 15NH3(2,2) | 125 | 15NH3(2,2) | 71 | ||||||||
| 15NH3(3,3) | 13 | 15NH3(3,3) | 77 | ||||||||
| G074.03 | TMRT | 20:25:07.11 +34:49:57.6 | 26 | 14NH3(1,1) | 63 | G19.01 | TMRT | 18:25:44.48 -12:22:42.20 | 8 | 14NH3(1,1) | 70 |
| 14NH3(2,2) | 88 | 14NH3(2,2) | 62 | ||||||||
| 14NH3(3,3) | 90 | 14NH3(3,3) | 89 | ||||||||
| 15NH3(1,1) | 97 | 15NH3(1,1) | 70 | ||||||||
| 15NH3(2,2) | 97 | 15NH3(2,2) | 87 | ||||||||
| 15NH3(3,3) | 98 | 15NH3(3,3) | 81 | ||||||||
| G074.03 | TMRT | 20:25:07.3 +34:50:05.6 | 60 | 14NH3(1,1) | 13 | G192.16 | TMRT | 05:58:13.53 +16:31:58.9 | 9 | 14NH3(1,1) | 71 |
| 14NH3(2,2) | 12 | 14NH3(2,2) | 91 | ||||||||
| 14NH3(3,3) | 15 | 14NH3(3,3) | 86 | ||||||||
| 15NH3(1,1) | 17 | 15NH3(1,1) | 80 | ||||||||
| 15NH3(2,2) | 18 | 15NH3(2,2) | 70 | ||||||||
| 15NH3(3,3) | 18 | 15NH3(3,3) | 87 | ||||||||
| G075.76 | TMRT | 20:21:41.09 +37:25:29.3 | 9 | 14NH3(1,1) | 124 | G196.45 | TMRT | 06:14:37.08 +13:49:36.7 | 9 | 14NH3(1,1) | 78 |
| 14NH3(2,2) | 131 | 14NH3(2,2) | 83 | ||||||||
| 14NH3(3,3) | 5830 | 14NH3(3,3) | 68 | ||||||||
| 15NH3(1,1) | 133 | 15NH3(1,1) | 68 | ||||||||
| 15NH3(2,2) | 143 | 15NH3(2,2) | 92 | ||||||||
| 15NH3(3,3) | 13 | 15NH3(3,3) | 74 | ||||||||
| G075.78 | TMRT | 20:21:44.01 +37:26:37.5 | 9 | 14NH3(1,1) | 141 | G196.45 | TMRT | 06:14:37.03 13:49:36.60 | 9 | 14NH3(1,1) | 80 |
| 14NH3(2,2) | 13 | 14NH3(2,2) | 92 | ||||||||
| 14NH3(3,3) | 154 | 14NH3(3,3) | 95 | ||||||||
| 15NH3(1,1) | 142 | 15NH3(1,1) | 85 | ||||||||
| 15NH3(2,2) | 134 | 15NH3(2,2) | 81 | ||||||||
| 15NH3(3,3) | 136 | 15NH3(3,3) | 66 | ||||||||
| G077.92 | TMRT | 20:25:49.1 +39:30:14.7 | 176 | 14NH3(1,1) | 97 | G202.92 | TMRT | 06:38:24.90 09:32:28.00 | 6 | 14NH3(1,1) | 83 |
| 14NH3(2,2) | 15 | 14NH3(2,2) | 71 | ||||||||
| 14NH3(3,3) | 85 | 14NH3(3,3) | 86 | ||||||||
| 15NH3(1,1) | 12 | 15NH3(1,1) | 78 | ||||||||
| 15NH3(2,2) | 11 | 15NH3(2,2) | 88 | ||||||||
| 15NH3(3,3) | 12 | 15NH3(3,3) | 73 | ||||||||
| G078.12 | TMRT | 20:14:26.07 +41:13:32.7 | 18 | 14NH3(1,1) | 47 | G208.79 | TMRT | 05:35:24.2 -05:08:30.7 | 9 | 14NH3(1,1) | 64 |
| 14NH3(2,2) | 59 | 14NH3(2,2) | 85 | ||||||||
| 14NH3(3,3) | 58 | 14NH3(3,3) | 100 | ||||||||
| 15NH3(1,1) | 72 | 15NH3(1,1) | 64 | ||||||||
| 15NH3(2,2) | 93 | 15NH3(2,2) | 99 | ||||||||
| 15NH3(3,3) | 47 | 15NH3(3,3) | 84 | ||||||||
| G078.12 | TMRT | 20:14:26.304 +41:13:31.44 | 18 | 14NH3(1,1) | 73 | G211.59 | TMRT | 06:52:45.32 +01:40:23.1 | 9 | 14NH3(1,1) | 63 |
| 14NH3(2,2) | 73 | 14NH3(2,2) | 91 | ||||||||
| 14NH3(3,3) | 63 | 14NH3(3,3) | 79 | ||||||||
| 15NH3(1,1) | 71 | 15NH3(1,1) | 80 | ||||||||
| 15NH3(2,2) | 68 | 15NH3(2,2) | 95 | ||||||||
| 15NH3(3,3) | 46 | 15NH3(3,3) | 87 | ||||||||
| G081.72 | TMRT | 20:39:01.392 +42:22:47.28 | 15 | 14NH3(1,1) | 73 | G212.06 | TMRT | 06:47:12.90 00:26:07.00 | 9 | 14NH3(1,1) | 89 |
| 14NH3(2,2) | 90 | 14NH3(2,2) | 78 | ||||||||
| 14NH3(3,3) | 92 | 14NH3(3,3) | 65 | ||||||||
| 15NH3(1,1) | 10 | 15NH3(1,1) | 87 | ||||||||
| 15NH3(2,2) | 90 | 15NH3(2,2) | 93 | ||||||||
| 15NH3(3,3) | 78 | 15NH3(3,3) | 79 | ||||||||
| G105.41 | TMRT | 21:43:06.48 +66:06:55.3 | 72 | 14NH3(1,1) | 56 | G213.75 | TMRT | 06:07:48.7 -06:25:55.3 | 12 | 14NH3(1,1) | 73 |
| 14NH3(2,2) | 78 | 14NH3(2,2) | 99 | ||||||||
| 14NH3(3,3) | 68 | 14NH3(3,3) | 68 | ||||||||
| 15NH3(1,1) | 89 | 15NH3(1,1) | 61 | ||||||||
| 15NH3(2,2) | 94 | 15NH3(2,2) | 82 | ||||||||
| 15NH3(3,3) | 37 | 15NH3(3,3) | 73 | ||||||||
| G107.29 | TMRT | 22:21:26.73 +63:51:37.9 | 74 | 14NH3(1,1) | 34 | G22.41 | TMRT | 18:30:56.60 -09:12:16.11 | 9 | 14NH3(1,1) | 97 |
| 14NH3(2,2) | 75 | 14NH3(2,2) | 97 | ||||||||
| 14NH3(3,3) | 91 | 14NH3(3,3) | 81 | ||||||||
| 15NH3(1,1) | 53 | 15NH3(1,1) | 83 | ||||||||
| 15NH3(2,2) | 49 | 15NH3(2,2) | 74 | ||||||||
| 15NH3(3,3) | 35 | 15NH3(3,3) | 99 | ||||||||
| G108.18 | TMRT | 22:28:51.41 +64:13:41.3 | 36 | 14NH3(1,1) | 78 | G229.57 | TMRT | 07:23:01.84 -14:41:32.8 | 9 | 14NH3(1,1) | 90 |
| 14NH3(2,2) | 75 | 14NH3(2,2) | 71 | ||||||||
| 14NH3(3,3) | 83 | 14NH3(3,3) | 96 | ||||||||
| 15NH3(1,1) | 115 | 15NH3(1,1) | 85 | ||||||||
| 15NH3(2,2) | 97 | 15NH3(2,2) | 76 | ||||||||
| 15NH3(3,3) | 42 | 15NH3(3,3) | 74 | ||||||||
| G108.59 | TMRT | 22:52:38.30 +60:00:52.0 | 9 | 14NH3(1,1) | 87 | G23.21 | TMRT | 18:34:54.90 -08:49:18.68 | 9 | 14NH3(1,1) | 88 |
| 14NH3(2,2) | 84 | 14NH3(2,2) | 93 | ||||||||
| 14NH3(3,3) | 79 | 14NH3(3,3) | 80 | ||||||||
| 15NH3(1,1) | 89 | 15NH3(1,1) | 64 | ||||||||
| 15NH3(2,2) | 94 | 15NH3(2,2) | 72 | ||||||||
| 15NH3(3,3) | 50 | 15NH3(3,3) | 81 | ||||||||
| G109.87 | TMRT | 22:56:18.10 +62:01:49.5 | 35 | 14NH3(1,1) | 40 | G236.81 | TMRT | 07:44:28.24 -20:08:30.2 | 6 | 14NH3(1,1) | 65 |
| 14NH3(2,2) | 38 | 14NH3(2,2) | 68 | ||||||||
| 14NH3(3,3) | 41 | 14NH3(3,3) | 74 | ||||||||
| 15NH3(1,1) | 37 | 15NH3(1,1) | 94 | ||||||||
| 15NH3(2,2) | 39 | 15NH3(2,2) | 79 | ||||||||
| 15NH3(3,3) | 42 | 15NH3(3,3) | 89 | ||||||||
| G111.532 | TMRT | 23:13:43.896 +61:26:58.2 | 9 | 14NH3(1,1) | 79 | G239.35 | TMRT | 07:22:58.33 -25:46:03.1 | 9 | 14NH3(1,1) | 87 |
| 14NH3(2,2) | 87 | 14NH3(2,2) | 80 | ||||||||
| 14NH3(3,3) | 89 | 14NH3(3,3) | 77 | ||||||||
| 15NH3(1,1) | 94 | 15NH3(1,1) | 70 | ||||||||
| 15NH3(2,2) | 85 | 15NH3(2,2) | 88 | ||||||||
| 15NH3(3,3) | 78 | 15NH3(3,3) | 64 | ||||||||
| G111.53 | TMRT | 23:13:43.8 +61:26:58.2 | 118 | 14NH3(1,1) | 97 | G24.67 | TMRT | 18:36:50.27 -07:24:50.05 | 8 | 14NH3(1,1) | 95 |
| 14NH3(2,2) | 14 | 14NH3(2,2) | 66 | ||||||||
| 14NH3(3,3) | 14 | 14NH3(3,3) | 68 | ||||||||
| 15NH3(1,1) | 11 | 15NH3(1,1) | 92 | ||||||||
| 15NH3(2,2) | 11 | 15NH3(2,2) | 92 | ||||||||
| 15NH3(3,3) | 11 | 15NH3(3,3) | 65 | ||||||||
| G133.94 | TMRT | 02:27:03.82 +61:52:25.2 | 18 | 14NH3(1,1) | 112 | G240.31 | TMRT | 07:44:51.92 -24:07:41.5 | 9 | 14NH3(1,1) | 85 |
| 14NH3(2,2) | 101 | 14NH3(2,2) | 83 | ||||||||
| 14NH3(3,3) | 124 | 14NH3(3,3) | 97 | ||||||||
| 15NH3(1,1) | 14 | 15NH3(1,1) | 69 | ||||||||
| 15NH3(2,2) | 109 | 15NH3(2,2) | 96 | ||||||||
| 15NH3(3,3) | 75 | 15NH3(3,3) | 84 | ||||||||
| G176.51 | TMRT | 05:37:52.14 +32:00:03.9 | 57 | 14NH3(1,1) | 32 | G25.920 | TMRT | 18:39:06.0 -06:18:04.7 | 15 | 14NH3(1,1) | 85 |
| 14NH3(2,2) | 51 | 14NH3(2,2) | 94 | ||||||||
| 14NH3(3,3) | 27 | 14NH3(3,3) | 98 | ||||||||
| 15NH3(1,1) | 37 | 15NH3(1,1) | 91 | ||||||||
| 15NH3(2,2) | 36 | 15NH3(2,2) | 87 | ||||||||
| 15NH3(3,3) | 35 | 15NH3(3,3) | 80 | ||||||||
| G18.21 | TMRT | 18:25:21.5 -13:13:39.5 | 4 | 14NH3(1,1) | 75 | G27.221 | TMRT | 18:40:30.5 -05:01:05.4 | 9 | 14NH3(1,1) | 98 |
| 14NH3(2,2) | 72 | 14NH3(2,2) | 61 | ||||||||
| 14NH3(3,3) | 61 | 14NH3(3,3) | 62 | ||||||||
| 15NH3(1,1) | 71 | 15NH3(1,1) | 70 | ||||||||
| 15NH3(2,2) | 87 | 15NH3(2,2) | 69 | ||||||||
| 15NH3(3,3) | 77 | 15NH3(3,3) | 75 | ||||||||
| G18.26 | TMRT | 18:25:05.5 -13:08:19.8 | 60 | 14NH3(1,1) | 36 | G28.83 | TMRT | 18:44:51.00 -03:45:53.53 | 9 | 14NH3(1,1) | 93 |
| 14NH3(2,2) | 21 | 14NH3(2,2) | 69 | ||||||||
| 14NH3(3,3) | 20 | 14NH3(3,3) | 75 | ||||||||
| 15NH3(1,1) | 29 | 15NH3(1,1) | 66 | ||||||||
| 15NH3(2,2) | 27 | 15NH3(2,2) | 69 | ||||||||
| 15NH3(3,3) | 25 | 15NH3(3,3) | 74 | ||||||||
| G18.28 | TMRT | 18:25:11.25 -13:08:04.44 | 8 | 14NH3(1,1) | 121 | G30.90 | TMRT | 18:47:08.66 -01:44:14.36 | 15 | 14NH3(1,1) | 98 |
| 14NH3(2,2) | 92 | 14NH3(2,2) | 100 | ||||||||
| 14NH3(3,3) | 92 | 14NH3(3,3) | 79 | ||||||||
| 15NH3(1,1) | 189 | 15NH3(1,1) | 77 | ||||||||
| 15NH3(2,2) | 147 | 15NH3(2,2) | 98 | ||||||||
| 15NH3(3,3) | 138 | 15NH3(3,3) | 61 | ||||||||
| G18.79 | TMRT | 18:26:15.14 -12:41:36.44 | 9 | 14NH3(1,1) | 113 | G33.486 | TMRT | 18:52:18.3 00:30:40.2 | 9 | 14NH3(1,1) | 79 |
| 14NH3(2,2) | 107 | 14NH3(2,2) | 74 | ||||||||
| 14NH3(3,3) | 88 | 14NH3(3,3) | 68 | ||||||||
| 15NH3(1,1) | 169 | 15NH3(1,1) | 83 | ||||||||
| 15NH3(2,2) | 136 | 15NH3(2,2) | 82 | ||||||||
| 15NH3(3,3) | 105 | 15NH3(3,3) | 98 | ||||||||
| G18.83 | TMRT | 18:26:23.47 -12:39:42.22 | 9 | 14NH3(1,1) | 153 | G84.638 | TMRT | 20:56:18.8 43:34:25.1 | 9 | 14NH3(1,1) | 72 |
| 14NH3(2,2) | 169 | 14NH3(2,2) | 67 | ||||||||
| 14NH3(3,3) | 167 | 14NH3(3,3) | 76 | ||||||||
| 15NH3(1,1) | 197 | 15NH3(1,1) | 61 | ||||||||
| 15NH3(2,2) | 188 | 15NH3(2,2) | 78 | ||||||||
| 15NH3(3,3) | 161 | 15NH3(3,3) | 62 | ||||||||
| G18.89 | TMRT | 18:27:07.49 -12:41:41.68 | 21 | 14NH3(1,1) | 53 | J010055.42 | TMRT | 01:00:55.42 62:49:29.50 | 9 | 14NH3(1,1) | 67 |
| 14NH3(2,2) | 52 | 14NH3(2,2) | 85 | ||||||||
| 14NH3(3,3) | 52 | 14NH3(3,3) | 70 | ||||||||
| 15NH3(1,1) | 56 | 15NH3(1,1) | 66 | ||||||||
| 15NH3(2,2) | 54 | 15NH3(2,2) | 98 | ||||||||
| 15NH3(3,3) | 54 | 15NH3(3,3) | 70 | ||||||||
| G183.72 | TMRT | 05:40:24.23 +23:50:54.7 | 39 | 14NH3(1,1) | 68 | J024929.80 | TMRT | 02:49:29.80 60:47:29.50 | 8 | 14NH3(1,1) | 79 |
| 14NH3(2,2) | 88 | 14NH3(2,2) | 98 | ||||||||
| 14NH3(3,3) | 80 | 14NH3(3,3) | 83 | ||||||||
| 15NH3(1,1) | 104 | 15NH3(1,1) | 82 | ||||||||
| 15NH3(2,2) | 99 | 15NH3(2,2) | 85 | ||||||||
| 15NH3(3,3) | 100 | 15NH3(3,3) | 77 | ||||||||
| G188.79 | TMRT | 06:09:06.97 +21:50:41.4 | 30 | 14NH3(1,1) | 63 | J040136.49 | TMRT | 04:01:36.49 53:19:41.40 | 9 | 14NH3(1,1) | 60 |
| 14NH3(2,2) | 63 | 14NH3(2,2) | 73 | ||||||||
| 14NH3(3,3) | 62 | 14NH3(3,3) | 66 | ||||||||
| 15NH3(1,1) | 85 | 15NH3(1,1) | 81 | ||||||||
| 15NH3(2,2) | 75 | 15NH3(2,2) | 77 | ||||||||
| 15NH3(3,3) | 74 | 15NH3(3,3) | 69 | ||||||||
| G188.79 | TMRT | 06:09:06.96 21:50:41.30 | 9 | 14NH3(1,1) | 76 | J051713.30 | TMRT | 05:17:13.30 39:22:14.00 | 9 | 14NH3(1,1) | 85 |
| 14NH3(2,2) | 65 | 14NH3(2,2) | 85 | ||||||||
| 14NH3(3,3) | 88 | 14NH3(3,3) | 100 | ||||||||
| 15NH3(1,1) | 82 | 15NH3(1,1) | 73 | ||||||||
| 15NH3(2,2) | 81 | 15NH3(2,2) | 98 | ||||||||
| 15NH3(3,3) | 78 | 15NH3(3,3) | 98 | ||||||||
| G188.94 | TMRT | 06:08:53.3 +21:38:28.7 | 176 | 14NH3(1,1) | 84 | J053927.60 | TMRT | 05:39:27.60 35:30:58.00 | 9 | 14NH3(1,1) | 68 |
| 14NH3(2,2) | 12 | 14NH3(2,2) | 88 | ||||||||
| 14NH3(3,3) | 11 | 14NH3(3,3) | 69 | ||||||||
| 15NH3(1,1) | 97 | 15NH3(1,1) | 62 | ||||||||
| 15NH3(2,2) | 12 | 15NH3(2,2) | 91 | ||||||||
| 15NH3(3,3) | 12 | 15NH3(3,3) | 90 | ||||||||
| G188.94 | TMRT | 06:08:53.32 21:38:29.10 | 9 | 14NH3(1,1) | 75 | J054137.40 | TMRT | 05:41:37.40 35:48:49.00 | 9 | 14NH3(1,1) | 70 |
| 14NH3(2,2) | 76 | 14NH3(2,2) | 83 | ||||||||
| 14NH3(3,3) | 74 | 14NH3(3,3) | 97 | ||||||||
| 15NH3(1,1) | 67 | 15NH3(1,1) | 80 | ||||||||
| 15NH3(2,2) | 75 | 15NH3(2,2) | 99 | ||||||||
| 15NH3(3,3) | 67 | 15NH3(3,3) | 70 | ||||||||
| G189.03 | TMRT | 06:08:40.65 21:31:07.00 | 9 | 14NH3(1,1) | 64 | J213213.00 | TMRT | 21:32:13.00 55:52:56.00 | 9 | 14NH3(1,1) | 88 |
| 14NH3(2,2) | 65 | 14NH3(2,2) | 85 | ||||||||
| 14NH3(3,3) | 64 | 14NH3(3,3) | 84 | ||||||||
| 15NH3(1,1) | 70 | 15NH3(1,1) | 90 | ||||||||
| 15NH3(2,2) | 70 | 15NH3(2,2) | 77 | ||||||||
| 15NH3(3,3) | 66 | 15NH3(3,3) | 73 | ||||||||
| G189.47 | TMRT | 06:02:08.37 20:09:20.10 | 9 | 14NH3(1,1) | 56 | J214301.50 | TMRT | 21:43:01.50 54:56:18.50 | 9 | 14NH3(1,1) | 67 |
| 14NH3(2,2) | 70 | 14NH3(2,2) | 73 | ||||||||
| 14NH3(3,3) | 66 | 14NH3(3,3) | 88 | ||||||||
| 15NH3(1,1) | 74 | 15NH3(1,1) | 73 | ||||||||
| 15NH3(2,2) | 65 | 15NH3(2,2) | 77 | ||||||||
| 15NH3(3,3) | 73 | 15NH3(3,3) | 71 | ||||||||
| G189.77 | TMRT | 06:08:35.28 20:39:06.70 | 9 | 14NH3(1,1) | 68 | J214940.65 | TMRT | 21:49:40.65 55:24:51.80 | 9 | 14NH3(1,1) | 62 |
| 14NH3(2,2) | 65 | 14NH3(2,2) | 91 | ||||||||
| 14NH3(3,3) | 69 | 14NH3(3,3) | 77 | ||||||||
| 15NH3(1,1) | 74 | 15NH3(1,1) | 96 | ||||||||
| 15NH3(2,2) | 75 | 15NH3(2,2) | 94 | ||||||||
| 15NH3(3,3) | 72 | 15NH3(3,3) | 95 | ||||||||
| G19.88 | TMRT | 18:29:14.25 -11:50:25.55 | 9 | 14NH3(1,1) | 273 | J222122.50 | TMRT | 22:21:22.50 63:51:13.00 | 9 | 14NH3(1,1) | 98 |
| 14NH3(2,2) | 292 | 14NH3(2,2) | 88 | ||||||||
| 14NH3(3,3) | 4090 | 14NH3(3,3) | 84 | ||||||||
| 15NH3(1,1) | 405 | 15NH3(1,1) | 71 | ||||||||
| 15NH3(2,2) | 356 | 15NH3(2,2) | 68 | ||||||||
| 15NH3(3,3) | 264 | 15NH3(3,3) | 85 | ||||||||
| G19.92 | TMRT | 18:28:19.17 -11:40:36.38 | 9 | 14NH3(1,1) | 70 | J222851.41 | TMRT | 22:28:51.41 64:13:41.31 | 9 | 14NH3(1,1) | 68 |
| 14NH3(2,2) | 74 | 14NH3(2,2) | 63 | ||||||||
| 14NH3(3,3) | 71 | 14NH3(3,3) | 98 | ||||||||
| 15NH3(1,1) | 70 | 15NH3(1,1) | 79 | ||||||||
| 15NH3(2,2) | 77 | 15NH3(2,2) | 78 | ||||||||
| 15NH3(3,3) | 60 | 15NH3(3,3) | 95 |