The chemical abundance pattern of the extremely metal-poor thin disk star 2MASS J18085104 and its origins††thanks: This paper includes data gathered with the 6.5 m Magellan Telescopes located at Las Campanas Observatory, Chile.
Abstract
We present a high-resolution (), high signal-to-noise () Magellan/MIKE spectrum of the bright extremely metal-poor star 2MASS J18085104. We find [Fe/H] = 4.01 (spectroscopic LTE stellar parameters), [Fe/H] = 3.8 (photometric stellar parameters), [Fe/H] = 3.7 (spectroscopic NLTE stellar parameters). We measured a carbon-to-iron ratio of from the CH G-band. J18085104 is thus not carbon-enhanced, contrary to many other stars with similarly low iron abundances. We also determine, for the first time, a barium abundance (), and obtain a significantly reduced upper limit for the nitrogen abundance ([N/Fe]). J18085104 has low ratio of , which is consistent with that of stars in ultra-faint dwarf galaxies. We also fit the abundance pattern of J18085104 with nucleosynthesis yields from a grid of Population III supernova models. There is a good fit to the abundance pattern which suggests J18085104 originated from gas enriched by a single massive supernova with a high explosion energy of E erg and a progenitor stellar mass of M M⊙. Interestingly, J18085104 is a member of the Galactic thin disk, as confirmed by our detailed kinematic analysis and calculated stellar actions and velocities. Finally, we also established the orbital history of J18085104 using our time-dependent Galactic potential the ORIENT. J18085104 appears to have a stable quasi-circular orbit and been largely confined to the thin disk. This unique orbital history, the star’s very old age ( Gyr), and the low [C/Fe] and [Sr/Ba] ratios suggest that J18085104 may have formed at the earliest epoch of the hierarchical assembly of the Milky Way, and it is most likely associated with the primordial thin disk.
keywords:
Early universe — Galaxy: disk — stars: abundances — stars: Population II — stars: individual (2MASS J180820025104378)1 Introduction
The chemical abundances of the most metal-poor stars trace the earliest nucleosynthesis events of elements heavier than H and He, which took place within the first billion years after the Big Bang (Alvarez et al., 2006; Becker et al., 2012). Stars with and less (also known as Ultra Metal-Poor - UMP) are best suited for this, as they are likely second-generation stars, thus enabling the study of their massive and short-lived progenitor Population III (Pop III) stars (Frebel & Norris, 2015). Measuring as many chemical elements as possible in these stars thus helps to constrain models of Pop III nucleosynthesis. Carbon, in particular, has played an important role in learning about progenitor properties. Large observed carbon abundances have been interpreted as a signature of mixing and fallback supernovae (e.g., Umeda & Nomoto, 2003; Heger & Woosley, 2010a; Cooke & Madau, 2014). On the contrary, other types of supernovae must have been responsible for the abundance patterns observed in ultra-metal-poor stars that are not carbon enhanced (e.g., Caffau et al., 2011a; Placco et al., 2021b; Skúladóttir et al., 2021). Their formation mechanism might also have been entirely different, and e.g., not driven by carbon and oxygen-cooled gas (Bromm & Loeb, 2003; Frebel et al., 2007a) but through dust cooling (Chiaki et al., 2015; de Bennassuti et al., 2014; Ji et al., 2014).
Indeed, for the metallicity regime, about 81% of the stars observed to date are carbon enhanced, i.e., have [C/Fe] (Placco et al., 2014b; Arentsen et al., 2022). Restricting stars to have halo kinematics increases the carbon fraction to . This difference can be attributed to a handful of stars being in fact associated with the metal-poor Atari disk population (for more details, see Mardini et al., 2022). Interestingly, these stars are all non-carbon-enhanced. One star is associated with the thin disk, which is the subject of this paper – it is also not carbon-enhanced (see Section 3.2).
Meléndez et al. (2016) reported the discovery of 2MASS J180820025104378 (hereafter J18085104), with and upper limits on the carbon abundance of and the barium abundance , based on an ESO/UVES high-resolution spectrum. Their upper limit on the carbon abundance indicated this star might fall into the category of stars without carbon-enhancement, but firm conclusions could not be drawn. More recently, Spite et al. (2019) confirmed a mild enhancement of J18085104 of and also reported oxygen and beryllium measurements. Both studies were able to detect strontium (Sr II, Z=38), but no other neutron-capture elements were reported.
Here, we report on results of our new high-resolution, high signal-to-noise spectroscopic observations with the Magellan telescope, which confirmed the mild carbon enhancement and enabled a barium (Ba II, Z=56) detection for the first time. A low upper limit of zinc (Zn I, Z=30) is also found which is unusual at this low metallicity. J18085104 has a low barium abundance and is thus not a neutron-capture element enhanced star. Our observations also produced upper limits on additional neutron-capture elements yttrium (Y II, Z=39) and europium (Eu II, Z=63), as well as nitrogen which all help constrain the main characteristics of the Pop III stellar progenitors (Placco et al., 2016b).
Dynamically, and based on Zmax values, Schlaufman et al. (2018) speculated that J18085104 is confined within the thin disk. The disk-like kinematics were later confirmed by Sestito et al. (2019). Also, Schlaufman et al. (2018) confirmed the binarity of J18085104 by investigating its radial velocity using 14 Magellan/MIKE, the three VLT/UVES spectra observed by Meléndez et al. (2016), and 31 GMOS/Gemini South spectra. Spite et al. (2019) provided additional radial velocity measurements for the UVES R760 spectrum, and confirm velocity variations for J18085104. Chronologically, Schlaufman et al. (2018) used isochrones to estimate an age of 13.5 Gyr for J18085104.
In this paper, we report on a further abundance analysis. Details of our spectroscopic observations are provided in Section 2, stellar parameters and chemical abundances are described in Sections 3 and 4, respectively, and our conclusion that J18085104 is an extremely-metal-poor star showing an abundance signature typical for metal-poor stars formed from well-mixed gas and belong to the thin disk is presented in Section 5.
2 Observations and Radial Velocity Measurements
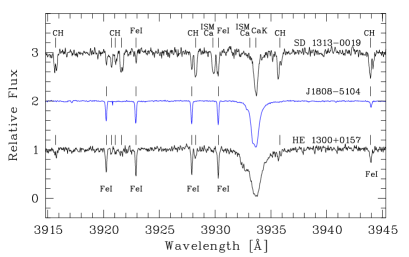
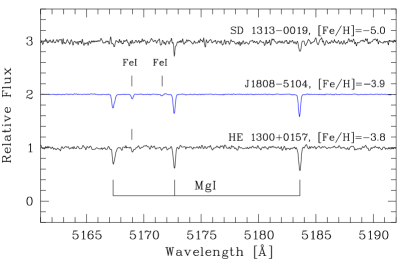
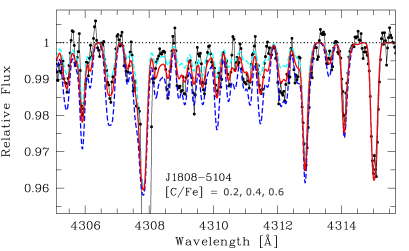
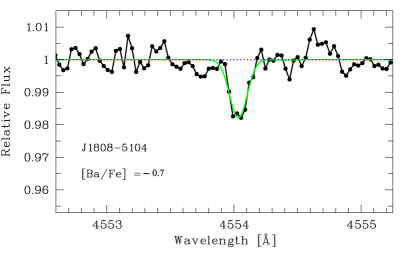
We observed J18085104 (R.A. = 18:08:20.02, Dec. = 51:04:37.8, ) with the MIKE spectrograph on the Magellan-Clay telescope at Las Campanas Observatory on April 15, 16, and 17, 2016, for a total of 2 h during clear weather and seeing conditions varying from 05 to 07. The employed slit yields a high spectral resolution of in the red and in the blue wavelength regime of our spectrum, covering 3300 Å to 9400 Å. Data reductions were carried out with the MIKE Carnegie Python pipeline (Kelson, 2003)111Available at http://obs.carnegiescience.edu/Code/python. The resulting per pixel is at Å, at Å, at Å, at Å, and at Å. In Figure 1 we show several representative portions of the J18085104 spectrum, around the Ca II K line at 3933 Å, the Mg b lines at 5170 Å, the G-bandhead at 4313 Å, and the Ba line at 4554 Å, compared with the spectra of SD 13130019 (Frebel et al., 2015) and HE 13000157 (Frebel et al., 2007b).
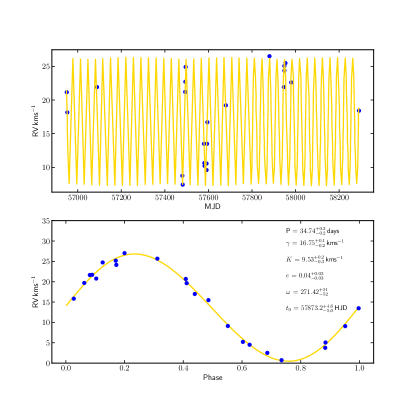
We measured the radial velocity in our three individual spectra taken on consecutive nights, and confirm velocity variations reported by Schlaufman et al. (2018) and Spite et al. (2019). Our heliocentric values are 21.2 km s-1 (2016 April 15), 22.7 km s-1 (2016 April 16), and 24.9 km s-1 (2016 April 17). We furthermore obtained followup observations to make additional radial velocity measurements. We find 26.5 km s-1 (2017 May 7) and 22.6 km s-1 (2017 Aug 15). We fit a Keplerian orbit to all available radial velocities measurements from the literature, based on high resolution spectra (see table 2 in Schlaufman et al. 2018 and Spite et al. 2019) using the program BinaryStarSolver (Milson et al., 2020). Figure 2 shows the fitted Keplerian orbit overplotted with all the data.
We find an orbital period of days, a system velocity km s-1, a velocity semi-amplitude km s-1, an eccentricity , a longitude of periastron deg, and a time of periastron HJD. We also calculated the projected semimajor axis R⊙ and the mass function M⊙. In general, these orbital parameters are in good agreement with the ones reported by Schlaufman et al. (2018) and Spite et al. (2019). Thus, J18085104 the oldest thin-disk confirmed binary at the lowest metallicities. Overall, the number of binaries among metal-poor stars with is close to 20% (Hansen et al., 2016).
3 Chemical abundance analysis
3.1 Stellar parameters
We measured equivalent widths to obtain atmospheric chemical abundances, by fitting Gaussian profiles to absorption features. Results are listed in Table 1. To perform the abundance determination, we used a 1D plane-parallel model atmosphere with -enhancement (Castelli & Kurucz, 2004) and the latest version of MOOG222http://www.as.utexas.edu/~chris/moog.html (Sneden, 1973; Sobeck et al., 2011). Abundances of blended features were determined with spectrum synthesis, using the Spectroscopy Made Hard (SMH) software package (Casey, 2014). The line lists for the atomic and molecular features were generated by the linemake333https://github.com/vmplacco/linemake code (Placco et al., 2021a). The isochrone fitting done by Schlaufman et al. (2018) suggested a slightly warmer and more metal-rich [Fe/H] star than what was reported by Meléndez et al. (2016). Spite et al. (2019) also estimated their stellar parameters using Gaia DR2 photometry (Gaia Collaboration et al., 2018) and 3D maps of interstellar reddening (Lallement et al., 2018) to be warmer and more metal-rich. We then employed three different methods to obtain stellar parameters from Fe I and Fe II lines: (1) The commonly used technique of calculating line formation under the assumption of local thermodynamic equilibrium (LTE). (2) The quantum fitting method (QFM) that invokes non-local thermodynamic equilibrium (NLTE). (3) The procedure outlined in Roederer et al. (2018).
| Species | EW | (X) | |||
|---|---|---|---|---|---|
| (Å) | (eV) | (dex) | (mÅ) | (dex) | |
| Li I | 6707.7 | 0.00 | 0.170 | syn | 1.35 |
| CH | 4313 | … | … | syn | 5.00 |
| CH | 4323 | … | … | syn | 4.95 |
| NH | 3360 | … | … | syn | 3.67 |
| O I | 7771.94 | 9.15 | 0.37 | syn | 6.00: |
| O I | 7774.17 | 9.15 | 0.22 | syn | 6.20: |
| Na I | 5889.95 | 0.00 | 0.11 | 39.73 | 2.12 |
| Na I | 5895.92 | 0.00 | 0.19 | 21.15 | 2.04 |
| Mg I | 4057.51 | 4.35 | 0.90 | 2.45 | 4.09 |
| Mg I | 4167.27 | 4.35 | 0.74 | 3.71 | 4.10 |
| Mg I | 4702.99 | 4.33 | 0.44 | 6.89 | 4.04 |
| Mg I | 5172.68 | 2.71 | 0.36 | 81.18 | 4.14 |
| Mg I | 5183.60 | 2.72 | 0.17 | 89.43 | 4.10 |
| Mg I | 5528.40 | 4.35 | 0.55 | 6.26 | 4.10 |
| Mg I | 8806.76 | 4.35 | 0.14 | 18.88 | 4.10 |
| Al I | 3944.00 | 0.00 | 0.64 | 18.32 | 1.62 |
| Al I | 3961.52 | 0.01 | 0.33 | 28.60 | 1.58 |
| Si I | 3905.52 | 1.91 | 1.04 | syn | 3.72 |
| Si I | 4102.94 | 1.91 | 3.34 | 0.9 | 3.89 |
This table is published in its entirety in the electronic edition of the paper. A portion is shown here for guidance regarding its form and content.
3.1.1 LTE Stellar Parameters
We initially derived the stellar parameters ( = 5070 K, = 2.40 dex, [Fe/H] = dex, and = 1.30 km s-1) by (1) minimizing the trend between the reduced equivalent width and excitation potential for the Fe I lines, and (2) forcing agreement between Fe I and Fe II abundances. The initial was then adjusted following the photometric correction presented in Frebel et al. (2013). The rest of the stellar parameters were adjusted to produce no trend of Fe I abundances with reduced equivalent width. We also adjusted the Fe II abundance to match again the Fe I abundance. This yields = 5233 K, = 2.80 dex, [Fe/H] = dex, and = 1.35 km s-1.
3.1.2 NLTE Stellar Parameters
We use the QFM method developed by Ezzeddine et al. (2016) for the iron abundance to spectroscopically determine a second set of stellar parameters. The Fe I/Fe II/Fe III model atom used in Ezzeddine et al. (2016) is compiled from a large number of energy levels taken from the NIST444http://www.nist.gov/ database (846 Fe I, 1027 Fe II and the Fe III continuum) and theoretical levels from Peterson & Kurucz (2015), and reduced into a super-atom of 424 total levels. Levels are coupled radiatively via a large number of bound-bound transitions (25,000 lines from the VALD3 database555http://vald.astro.uu.se/) and photoionization tables. Additionally, all levels are coupled collisionally via inelastic electron and hydrogen collisions. Hydrogen collisional rates are estimated using the new semi-empirical QFM. It includes the dominating ion-pair production process, which avoids the large uncertainties usually obtained when using the classical Drawin (1968, 1969a, 1969b) approximation. We refer the interested reader to Ezzeddine et al. (2016) for a more detailed description of the atom.
Departures from LTE for each individual Fe I and Fe II line were calculated to iteratively determine the stellar parameters spectroscopically, just as in the LTE case. We follow the procedure described in Ezzeddine et al. (2017) who applied it to the 20 most iron-poor stars. As for these stars, the scatter among line abundances of J18085104 is reduced compared to the LTE analysis. The standard deviation of Fe I line abundances is 0.05 dex for the NLTE analysis, compared to the already low dex LTE result. This further supports applying quantum mechanically based NLTE corrections to individual lines, as it leads to improved overall results, independent of the data quality.
Based on the NLTE Fe I line analysis, we spectroscopically obtain T K. This yields an Fe I abundance of , and for Fe II. The NLTE Fe I abundance is higher by 0.46 dex compared to the Fe I LTE case. Fe II lines are hardly affected by NLTE, at the level of 0.02 dex which we neglect. This difference (i.e., ) is in line with what can be obtained from the relation of developed by Ezzeddine et al. (2016), . It illustrates the strong metallicity dependence of departures from LTE. As a consequence of the differential NLTE effect for Fe I and Fe II, the surface gravity is somewhat higher, since our spectroscopic analysis aims for an ionization balance of Fe I and II in NLTE. The microturbulence is somewhat higher also, km s-1.
3.1.3 Photometric Stellar Parameters
Photometric stellar parameters were also obtained for J18085104 based on a procedure described in detail by Roederer et al. (2018). In summary, the effective temperature () was calculated with the color–[Fe/H]– relations of Casagrande et al. (2010), using the magnitudes from 2MASS (Cutri et al., 2003), the Johnson magnitudes from APASS DR9 (Henden & Munari, 2014), and the corrected [Fe/H] value from Section 3.1.1 as a first-pass estimate. The was calculated from the fundamental relation described in Roederer et al. (2018), using the 3D reddening values, , from the bayestar2017 version of the dustmaps application (Green, 2018). The distance was taken from Bailer-Jones et al. (2021) and the bolometric correction in the band (BCV) from Casagrande & VandenBerg (2014). These initial and values are used to derive the [Fe/H] and microturbulent velocity (). Then, the first-pass [Fe/H] estimate is updated and and are recalculated. This yields = 5665 K, = 3.34 dex, [Fe/H] = dex, and = 1.52 km s-1. Since the and are determined independently from the model atmospheres, we have decided to adopt the parameters above for the remainder of the analysis presented in this paper.
We estimate random uncertainties for the stellar parameters by varying only one parameter at a time until scatter in the previous procedure is achieved. In general, our stellar parameters agree well with those of Spite et al. (2019), who derive K , km s-1, and .
3.2 Chemical abundances
We determined chemical abundances of 19 elements and five upper limits for J18085104. The final abundance ratios [X/Fe] are calculated using the photometric stellar parameters and solar abundances of Asplund et al. (2009), and listed in Table 2. They are also shown in Figure 3 where we compare them with literature data. In the following, we comment on the various observed element abundances and measurement details.

J18085104 is a warm metal-poor star. In accordance with its stellar evolutionary status at the bottom of the giant branch, we find a lower-than-Spite Plateau (Spite & Spite, 1982) abundance of A(Li) = 1.38, as measured from the lithium doublet at 6707 Å. For comparison, A(Li) = 1.5 and 1.78 were found by Meléndez et al. (2016) and Spite et al. (2019), respectively.
Since our spectrum has a very high S/N ratio, a carbon abundance could be clearly measured from the CH G-bandhead at 4313 Å, yielding . Our [C/Fe] is in agreement with the one reported by Spite et al. (2019) of . The detection is shown in Figure 1, together with the best-fit synthetic spectrum. To achieve the best possible detection, we note that we co-added the 2016 spectrum with the two radial-velocity spectra taken in 2017. Adding the extra data somewhat increased the S/N and aided the measurement. Given the relatively unevolved nature of J18085104, there is no need to correct the carbon abundance for the star’s evolutionary status (Placco et al., 2014b) to obtain its true birth carbon abundance. As already noted in Spite et al. (2019), 1D LTE abundances of molecular species, such as CH, potentially suffer from strong effects from not employing 3D model atmospheres. We thus note here as well that the 3D LTE abundance would be even lower. From Table 2 in Gallagher et al. (2016), we estimate a potential correction of dex (by coarsely extrapolating their 5900 K/4.0 model to our values). However, it remains to be seen what any 3D-NLTE abundances derived from CH might be, if available.
We obtained an upper limit for nitrogen from the non-detection of the NH band at 3360 Å. The still reasonable yields a subsolar limit of [N/Fe] which shows J18085104 to be deficient in N. We also obtain a tentative oxygen abundance of from the two stronger of the near infrared O triplet lines at 7771 and 7774 Å, as they are very weakly detected only. This [O/Fe] value is in principally agreement with the one reported by Spite et al. (2019) of based on UV-OH line. However, we caution that 3D corrections would affect the OH abundance whereas NLTE significantly affects the triplet lines. While we do not further assess these corrections, we conservatively conclude that J18085104 is at least mildly oxygen enhanced, very similar to other metal-poor stars (García Pérez et al., 2006).
There is some interstellar absorption by Na and Ca, as seen in the spectrum of J18085104. Both stellar Na D lines are very close to the strong interstellar lines but their equivalent widths could still be measured. Figure 1 shows that the Ca II K line appears somewhat distorted by an interstellar component. However, we measure the Ca abundance from seven Ca I lines, so the blending of the Ca II K line is a purely cosmetic effect. As for abundances of other light elements, lines are generally weak but measurable given the good . Seven Mg lines across the spectrum could be used to determine the Mg abundance. Given the low C abundance, the Al line at 3944 Å, which is blended with a CH feature, could be easily used in addition to the 3961 Å line. For our star, the derived Al abundances for both lines are in good agreement.
The Si abundance was obtained from the Si I lines at 3905 Å and 4102 Å. Five Sc lines, six Ti I lines and 25 Ti II lines were employed to derive the respective abundances with good precision. Ti I and II agree within dex. Three Cr I lines, three weak Mn I lines, 15 Co I lines, and 14 Ni I lines were also detected. Finally, we estimated a surprisingly low upper limit for the Zn abundance from the Zn I line at 4810 Å of . This places J18085104 at the very bottom end of halo star Zn abundance range (see Figure 3) at its [Fe/H] abundance.
Abundances of neutron-capture elements were determined for Sr and Ba from two Sr II lines and one weak Ba II line at 4554 Å. They are both significantly below solar ratios, very similar to values found for other halo and dwarf galaxy stars at these metallicities. Upper limits for Y, Zr and Eu were obtained from the lines at 4900 Å, 4149 Å and 4129 Å, respectively. The Y upper limit of indicates a low abundances; the Zr and Eu upper limits are too high to be very meaningful. However, even mild -process enhancement can be excluded given the low Sr and Ba abundances.
Standard deviations of individual line measurements for each element are taken as random abundance uncertainties. We assign a nominal minimum uncertainty value of 0.05 dex for all species that have a standard deviations of dex. Further, we assign a nominal minimum uncertainty of 0.1 dex in two cases: (i) abundances of elements with just one line measured; and (ii) standard deviations that are less than 0.1 dex and the number of measured lines is three or less. The uncertainties are given in Table 2. Systematic uncertainties can be assessed from varying each stellar parameter by its uncertainty and re-determining the abundances. Typical final uncertainties () are about 0.15-0.25 dex.
| Species | [X/H] | [X/Fe] | |||
|---|---|---|---|---|---|
| (dex) | (dex) | (dex) | |||
| Li I (syn) | 1 | +1.38 | 0.10 | … | … |
| C (syn) | 2 | +4.91 | 0.20 | 3.52 | 0.38 |
| N (syn) | 1 | 3.47 | … | 4.36 | 0.20 |
| O (syn) | 2 | +6.10: | 0.20 | 2.59: | 1.25: |
| Na I | 2 | +2.08 | 0.10 | 4.16 | 0.32 |
| Mg I | 7 | +4.09 | 0.05 | 3.51 | 0.34 |
| Al I | 2 | +1.60 | 0.10 | 4.85 | 1.01 |
| Si I | 2 | +3.81 | 0.10 | 3.70 | 0.14 |
| Ca I | 7 | +2.49 | 0.05 | 3.85 | 0.00 |
| Sc I | 5 | 1.02 | 0.05 | 4.17 | 0.32 |
| Ti I | 6 | +1.20 | 0.05 | 3.75 | 0.09 |
| T II | 25 | +1.12 | 0.05 | 3.83 | 0.02 |
| Cr I | 3 | +1.08 | 0.10 | 4.56 | 0.71 |
| Cr II | 1 | +1.89 | 0.10 | 4.01 | 0.09 |
| Mn I | 3 | +0.26 | 0.10 | 5.17 | 1.33 |
| Fe I | 96 | +3.66 | 0.05 | 3.84 | 0.00 |
| Fe II | 4 | +3.55 | 0.05 | 3.95 | 0.11 |
| Co I | 15 | +1.33 | 0.05 | 3.66 | 0.18 |
| Ni I | 14 | +2.12 | 0.05 | 4.10 | 0.26 |
| Zn I | 1 | 0.94 | … | 3.62 | 0.23 |
| Sr II (syn) | 2 | 1.85 | 0.10 | 4.72 | 0.87 |
| Y II (syn) | 1 | 1.75 | … | 3.96 | 0.07 |
| Zr II (syn) | 1 | 0.60 | … | 3.18 | 0.66 |
| Ba II (syn) | 1 | 2.36 | 0.10 | 4.54 | 0.70 |
| Eu II (syn) | 1 | 2.20 | … | 2.72 | 1.12 |
4 Constraints on the progenitor star of J18085104 and its birth environment
The abundance signature of light elements produced in fusion processes observed in J18085104 generally agrees extremely well with established abundance trends by other metal-poor stars down to about . This agreement can be seen in Figure 3. Overall, these abundance trends are thought to reflect chemical enrichment by early core-collapse supernova(e) that exploded prior to the births of J18085104 and other, similar metal-poor stars. Moreover, as can be seen from Figure 3, the gas from which these objects formed must have been very well mixed to help erase any local abundance anomalies or potential variations of the supernova yields that would have enriched these birth gas clouds (Cayrel et al., 2004).
Interestingly, the same trends are found for metal-poor stars in dwarf galaxies, both in the ultra-faint dwarfs and classical dwarfs (e.g., Cohen & Huang, 2009; Frebel, 2010; Gilmore et al., 2013; Simon, 2019). For those stars, we know that they formed in distinct places, namely their respective host galaxies. For halo stars, we do not know their origins, but considering hierarchical assembly and the formation process of the Galactic halo, as well as their chemically primitive nature, we can assume that these stars also formed in accreted systems a long time ago. This would imply that all these metal-poor stars represent a large number of birth places of which each was chemically enriched by local supernovae. Yet, all these stars show near-identical abundance patterns. This points to a universal enrichment history, well mixed gas with mixing driven by robust processes, and/or similar supernova yields across all these environments (Frebel, 2010; Chan & Heger, 2017).
There are several exceptions to these well-behaved abundance trends of light elements. Na shows much more scatter than other elements but reasons for that remain unclear. Carbon is known to display extreme variations, particularly at the lowest metallicities (Yoon et al., 2016). Nitrogen also varies significantly. About 60% of metal-poor stars with exhibit strong overabundances of carbon of (Placco et al., 2014b). The carbon enhanced stars have been suggested to point to a specific birth environment, e.g. to minihalos (Cooke & Madau, 2014) enriched by individual faint supernovae undergoing a mixing and fallback episode that would lead to large carbon and low iron yields (Umeda & Nomoto, 2003). On the contrary, metal-poor stars with abundances closer to the solar ratio, such as J18085104, more likely formed from well-mixed gas, perhaps in somewhat larger systems that hosted more than one progenitor supernova. The low N abundance would principally support this scenario also. Similarly, most stars in dwarf galaxies are not carbon enhanced. In particular, the larger classical dwarf galaxies show little evidence for a significant population of carbon rich stars (Tafelmeyer et al., 2010; Simon et al., 2015; Chiti et al., 2020) perhaps because they formed from larger building blocks or accreted gas quickly to grow to large enough for efficient mixing to take effect. The ultra-faint dwarfs contain a small fraction of carbon-rich stars (e.g., Norris et al. 2010a) but contain primarily stars with abundances signatures very similar to that of J18085104 (Norris et al., 2010b). These systems might have already formed from multiple building blocks, which could represent a mix of progenitor systems that produced some (or even no) carbon enhanced stars.
Assuming then that J18085104 formed in one of the earliest systems in the early universe, the progenitor supernova must thus have either not undergone a mixing and fallback mechanism, or there were not enough fallback supernovae to dominate the resulting chemical composition of the gas over the enrichment by ordinary core-collapse supernovae. After all, metal mixing processes were likely very efficient following the energy injection by supernovae and subsequent recovery time of the system, before forming the next generation of stars (Greif et al., 2010).
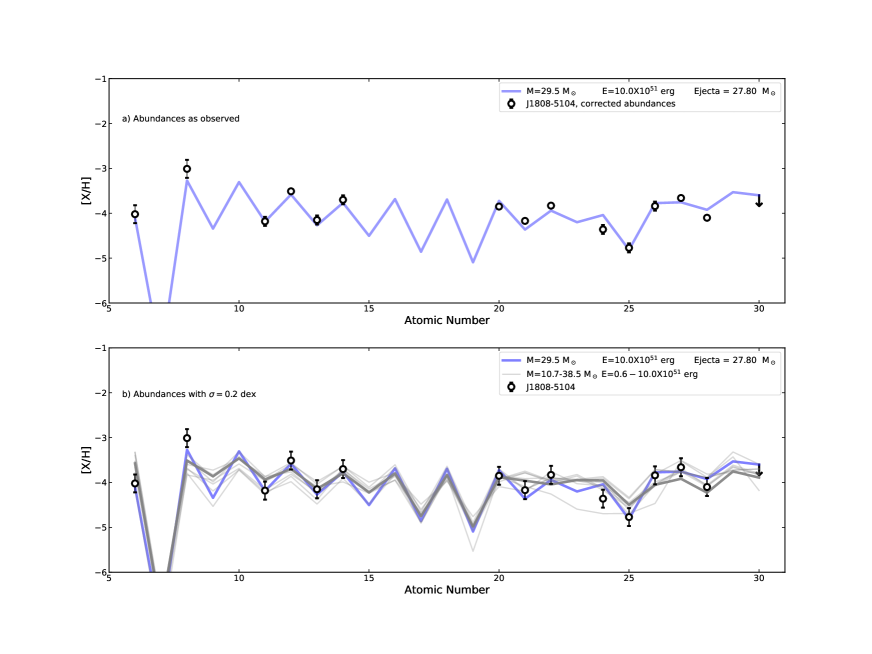
To test this idea, we attempted to model the light element abundance signature of J18085104 with theoretical Pop III supernova nucleosynthesis yields from Heger & Woosley (2010a). Employing their matching algorithm666http://starfit.org provides insights into the putative progenitor(s) (e.g., stellar mass and supernova explosion energy) of metal-poor stars with [Fe/H] . This approach has been applied to a variety of metal-poor stars in the literature (e..g., Placco et al., 2015; Placco et al., 2016a; Placco et al., 2016b; Roederer et al., 2016; Placco et al., 2020). We note that the nucleosynthesis models are all (S4) fallback models with masses from 10 to 100 M⊙, and explosion energies from erg to erg. However, the mass ejected during the explosion is also given and not all models have significant amounts of fallback.
Running the starfit algorithm for J18085104 using the chemical abundances from Table 2, suggest a series best-fit models (all with ) with a progenitor stellar mass of M = 29.5 M⊙, high explosion energy of E = erg and little mixing with a range of to . With the estimated ejecta of 27.8 M⊙, essentially no fallback appears to occur. We note that we used a 3D-corrected carbon abundance of , based on the (Gallagher et al., 2016) estimate made in Section 3. For comparison, Spite et al. (2019) suggested a dex correction. Similarly, for O, we utilized a 3D-corrected value. Since our abundance is uncertain, we opted adopt the correction , which includes a 0.6 dex correction of the [O/H] reported in Spite et al. (2019), for our fitting procedure. Other abundances were also corrected before fitting the abundance pattern. We applied a Na correction of 0.04 dex, using our measured EW and the online calculator INSPECT777http://www.inspect-stars.com (Lind et al., 2011), an Al correction of +0.7 dex (Nordlander & Lind, 2017; Roederer & Lawler, 2021), a Cr correction of 0.2 dex (Bergemann & Cescutti, 2010; Cowan et al., 2020), and Mn correction of 0.4 dex (Bergemann & Gehren, 2008; Sneden et al., 2016). Finally, Zn generally constrains the explosion energy of the progenitor but that we only have an upper limit. Given the low upper limit, and considering the bulk of halo stars at , it could be argued that the true Zn abundance is not much below the numerical value of our upper limit determination. As such, for the fitting purposes, we treat our upper limit as a measured abundance albeit with a larger error bar of 0.3 dex. The top panel in Figure 4 shows our abundances overlaid with the nucleosynthesis yields of the 29.5 M⊙ and erg model.
Next, we statistically checked on the robustness of the fitting results by generating 10,000 abundance patterns for J18085104, by re-sampling the values from Table 2 with fixed uncertainties of dex for all species except for those that have larger uncertainties already (i.e., C, O, Zn). Running the starfit code for each re-sampled pattern (and determining its respective best-fit model) results in 20 best-fitting models with a range of parameters. For simplicity, we chose to ignore any best fit models if only 1-10 realizations favored those. Overall, 62% of the 10,000 patterns are matched best by the model with 29.5 M⊙ and erg (i.e. the same no-fallback model as found for the original abundance pattern above). The remaining realizations () are best fit by a variety of different models, with stellar masses ranging from M= 10.2 to 38 M⊙ and explosion energies of E =0.6 to erg. The results are shown in the bottom panel of Figure 4, where we show the abundances with the dex uncertainties overlaid with the 20 best fitting models, many of which yield very similar patterns.
We conclude that J18085104 most likely formed in an environment that experienced the enrichment by a massive Population III hypernova with a high explosion energy and little to no fallback. This is a similar result as what has been found from many the analysis of other other similar metal-poor stars, adding to the body of evidence that the first stars were predominantly massive in nature.
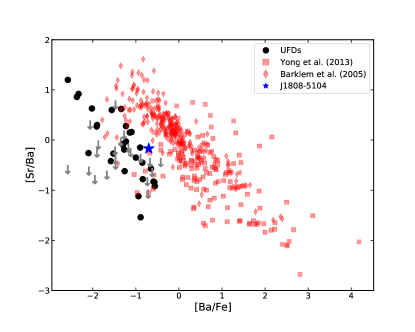
This origin scenario is supported by two additional lines of evidence. First, the Sr and Ba abundances of J18085104 are extremely low, and . These low values are typical for stars found in ultra-faint dwarf galaxies and also some of the classical dwarfs. Furthermore, the star has . This value is not far removed from what is typical for the (main) -process, . A limited -process, with (Frebel, 2018), can clearly be ruled out, so can the -process ().
Figure 5 shows [Sr/Ba] as a function of [Ba/Fe] for ultra-faint dwarf galaxies stars overplotted with halo metal-poor stars (red squares and diamons) adopted from Yong et al. (2013) and Barklem et al. (2005), respectively888Literature data collection of ultra-faint dwarf galaxy stars taken from https://github.com/alexji/alexmods. Black points represent ultra-faint dwarf galaxy stars with Sr and Ba measurement, downward arrows represent stars with upper limits on Sr and/or Ba abundances. Plotting [Sr/Ba] against [Ba/Fe], J18085104 is found below the main trend set by metal-poor halo stars, in a region that is characteristically populated by stars in the dwarf galaxies. This all suggests J18085104’s neutron-capture elements to possibly be provided by one supernova or explosive event only. Following arguments laid out in Ji et al. (2016), a level of is reached by the yields of one supernova if the gas mass into which the yield is diluted into is 106 M⊙. This adds confidence to the scenario that the star formed in a sparse system with only one or few SNe progenitors. This is also already indicated by the low [Fe/H] of the star, which is suggestive of a 106 M⊙ birth cloud (and assuming a canonical Fe yield of 0.1 M⊙). It is thus indicative that stars with and [C/Fe] all formed in similar environments that already experienced some degree of chemical homogeneity, while also showing clear signs in the form of low neutron-capture abundances of only one, or at most a small number of progenitor stars.
4.1 Kinematic Signature
Investigating the long-term orbital history of J18085104 can add a new dimension to comprehensively probe its origin. Detailed space motion for J18085104 can be derived by combining astrometric information obtained by Gaia DR3 (Gaia Collaboration, 2022) and the systemic radial velocity (RV = 14.8 km s-1 at phase = 0; see Figure 2). To perform this investigation in a statistical way, we generate 10,000 realizations of the celestial positions (, ), proper motions (, ), and the systemic RV value using a normal distribution and associated uncertainties.
We then assume that the Sun is located at R kpc from the Galactic center (Gravity Collaboration et al., 2019), pc above the Galactic plane, and has peculiar motion km s-1 (Bennett & Bovy, 2019), km s-1, and km s-1 (Schönrich et al., 2010). We take VLSR = km s-1 (Kerr & Lynden-Bell, 1986). For each realization, we calculate Galactocentric coordinates (), rectangular Galactic (), and cylindrical Galactocentric coordinates (), as described in Mardini et al. (2022). We also compute orbital parameters (Zmax, rapo, rperi, eccentricity), for the past 8 Gyr using our time-varying galactic potentials, ORIENT999https://github.com/Mohammad-Mardini/The-ORIENT (for more details, we refer the readers to Mardini et al., 2020).
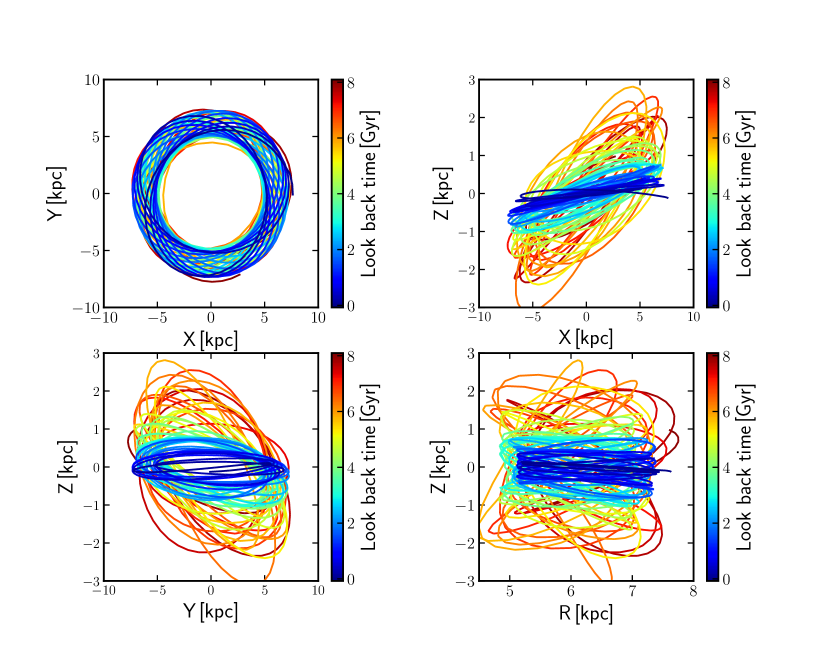
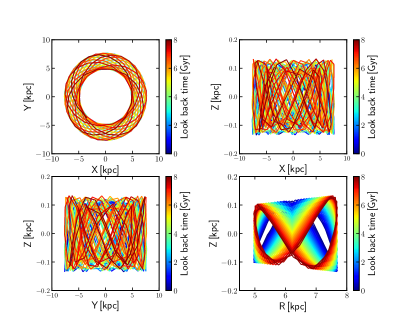
Figure 6 shows the projections of the long term orbital evolution of J18085104 in various planes, for one of the 10,000 realizations, using the ORIENT potential . The X-Y plane suggests that J18085104 is on a quasi-circular orbit (e = ). Furthermore, the R- plane suggests that J18085104 currently (cycles where the colour tends toward blue, that is short look back time) resides in the Galactic thin disk, orbiting with a radius of kpc from the Galactic center. While at a long look back time, the star might travel 3 kpc above and below the plane of the present-day Galactic disk (cycles where the colour tends toward red).
The Galactic model used to evolve the orbit has time-varying potential derived from best-fitting a subhalo in a large scale cosmological simulation that is similar in some metrics to the present-day Milky-Way (Mardini et al., 2020). While the model is a composition of an NFW sphere and a Miyamoto-Nagai disk at every given time, the seven free parameters are time-varying. That includes the orientation of the disk, which has two free angles and is oriented such that it coincides with the X-Y plane at the present-day. The particular ORIENT model has a disk that is inclined by up to relative to present day, this largest inclination occurs at a look back time of 6 Gyr or at redshift of . The large -values seen in Figure 6 around that time therefore reflect mostly the inclination of the disk itself: even if the star were on a perfectly planar orbit, its ordinate would reach values as large as 3 kpc (as this is the approximate Galactocentric distance of 8 kpc times the sine of the maximum inclination angle)101010A right triangle with one point at the centre of the Galaxy, another point at the star at its apocentre, and the third point in the present-day Galactic plane under the star. In this convention, the rapo and Zmax are the sides of the triangle across from the disk’s inclination (), so = Zmax/rapo by definition..
In addition, and for comparison purposes, we performed another backward orbital integration for J18085104 using galpy111111https://docs.galpy.org/en/v1.8.0/ and its invariable Galactic potential MWpotential2014 (Bovy, 2015). It is important to recall here that the size and the mass of the Milky Way components in MWpotential2014 are assumed to remain constant with time. Using such an idealized potential would not mimic the realistic formation and evolution history of the Milky Way which itself was built from smaller accreted satellites (e.g., White & Rees, 1978; Bullock & Johnston, 2005; Pillepich et al., 2018). Figure 7 shows the same projections as in Figure 6. Apparently, the static orbits do not change significantly with redshift and the phase-space coordinates of J18085104 at high redshifts do not extend to higher Galactocentric distances either.
The main difference between Figures 6 and 7, or the integration in time-varying and time-static potential respectively, is that no conserved quantities exist in the former case. In addition to the variation in the model’s disk orientation mentioned above, other quantities vary as well, some quite significantly over the integration period. For example, the disk’s mass increases at approximately constant rate from at a look back time of 8 Gyr to at a look back time of 1.5 Gyr (after which it does not vary significantly). Orbits integrated with ORIENT models may therefore demonstrate irregular behaviour compared to those integrated with galpy, depending on the model’s specific cosmic history.
Finally, we probe the thin disk membership of J18085104 using the diagnostic tool developed in Mardini et al. (2022), based on stellar actions and velocities, to qualitatively assign individual stars to one of the traditional Galactic components. All of the J18085104 10,000 realizations suggest that the star to be well confined to the thin disk.
To learn about the overall origin scenario of J18085104, two possible pathways can be considered that are based on the fact that the star has been located in the thin disk for billions of years. (1) J18085104 could have originated in a satellite galaxy that was accreted into the disk and fully disrupted at early times in the formation history of the Milky Way. (2) J18085104 could have been one of the earliest in-situ stellar births as part of the formation of the primordial thin disk which came together from small building blocks. The fact that the star has a very old age of Gyr (Schlaufman et al., 2018) needs to be taken into account when addressing these scenarios.
Regarding scenario (1), some theoretical models of the formation of the Galactic disk predict an old thin disk population to be built up from satellite(s) debris (for example, see figure 8 in Abadi et al., 2003). However, the contribution of the satellite heavily depends on its orbit and the level of the dynamical friction (Statler, 1988). In this picture, the core of the satellite should be dense enough to survive tidal disruption up to the time that it circularized its orbit within the disk (i.e. interacts strongly with the disk and deposit significant fraction of its stars). The still only low fraction of the discovered metal-poor ([Fe/H] ) stars with thin disk-like kinematics (e.g., Bensby et al., 2014; Sestito et al., 2019; Carter et al., 2021; Cordoni et al., 2020; Di Matteo et al., 2020; Venn et al., 2020; Mardini et al., 2022) furthermore suggests that this scenario likely does not explain the origin of J18085104.
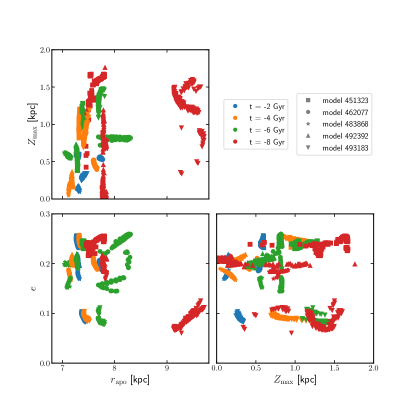
The second scenario then requires the absence of dynamical interactions with the spiral arms and/or merging satellite(s) to not heat up the orbit of J18085104 (i.e. increase e and Z as a function of time). We investigated this scenario by tracing back the orbital history of each one of the 10,000 realizations obtained with ORIENT, to check whether J18085104 can maintain its thin disk kinematics during the past 8 Gyr. Figure 8 shows e, rapo, and Zmax for 200 realizations (each data point represents one realization)121212Our version containing results of the entire 10,000 realizations is very crowed. Therefore, we show the results for 200 randomly selected realizations., of five different ORIENT potentials (each symbol represents one model), at four different cosmic times (each color represents one cosmic time). Notice that Zmax is calculated with respect to the model’s disk orientation at a given cosmic time. All of these data points holds thin disk kinematics. Thus, it appears physically quite possible for J18085104 to survive these dynamical interactions and maintain its thin disk kinematics over billions of years.
In summary, our chemical abundances and kinematics results suggest, paired with the old age of the system ( Gyr Schlaufman et al., 2018), that J18085104 is the most primitive thin disk star known. It likely formed at the earliest epoch of the hierarchical assembly of the Milky Way, and would thus be an ancient member of the primordial thin disk.
5 Conclusions
In this paper, we present a comprehensive chemo-dynamical analysis of the most metal-poor thin disk star 2MASS J180820025104378. We provide further five radial-velocity (RV) measurements based on Magellan/MIKE high resolution spectra. These RV measurements suggest that J18085104 is in a binary system. The system has an orbital period of days and line-of-sight velocity of RV = 14.8 km s-1.
We report on the first detection of the Ba II line at 4554 Å for J18085104. The observed chemical pattern suggest that J18085104 exhibits mild enhancements in the -elements, and no enhancements in either carbon ( ) or neutron-capture elements ([Sr/Fe]= and [Ba/Fe]= ); indicating that J18085104 was formed in chemically primitive cloud that experienced relatively few enrichment events. We compare the light elements abundance pattern to theoretical yields of Population III adopted from Heger & Woosley (2010b). The best fit model suggest a progenitor with stellar mass of 29.5 M⊙ and explosion energies 10 erg. In general, the comparison suggest a fallback with no mixing supernovae to be responsible for the chemical enrichment of J18085104.
We also perform a comprehensive study of the possible orbital evolution of 10,000 J18085104-like stars using our time-dependent galactic potential the ORIENT and the diagnostic tool developed in Mardini et al. (2022). The results show that all of the J18085104-like stars maintain a quasi-circular orbits, Z and still bound to the Galaxy. In general, these orbits exclude the possibility that J18085104 has an accretion origin, and suggest it being member of the primordial thin disk.
Acknowledgements
This work is supported by Basic Research Grant (Super AI) of Institute for AI and Beyond of the University of Tokyo. M.k.M. acknowledges partial support from NSF grant OISE 1927130 (International Research Network for Nuclear Astrophysics/IReNA). A.F. acknowledges support from NSF CAREER grant AST-1255160 and NSF grant AST-1716251. A.C. is supported by a Brinson Prize Fellowship at the University of Chicago/KICP. The work of V.M.P. is supported by NOIRLab, which is managed by the Association of Universities for Research in Astronomy (AURA) under a cooperative agreement with the National Science Foundation. I.U.R. acknowledges support from NSF grant AST 1815403/1815767 and the NASA Astrophysics Data Analysis Program, grant 80NSSC21K0627. This work made use of the NASA’s Astrophysics Data System Bibliographic Services.
This work has made use of data from the European Space Agency (ESA) mission Gaia (https://www.cosmos.esa.int/gaia), processed by the Gaia Data Processing and Analysis Consortium (DPAC, https://www.cosmos.esa.int/web/gaia/dpac/consortium). Funding for the DPAC has been provided by national institutions, in particular the institutions participating in the Gaia Multilateral Agreement.
References
- Abadi et al. (2003) Abadi M. G., Navarro J. F., Steinmetz M., Eke V. R., 2003, ApJ, 597, 21
- Abohalima & Frebel (2018) Abohalima A., Frebel A., 2018, ApJS, 238, 36
- Aguado et al. (2017a) Aguado D. S., Allende Prieto C., González Hernández J. I., Rebolo R., Caffau E., 2017a, A&A, 604, A9
- Aguado et al. (2017b) Aguado D. S., González Hernández J. I., Allende Prieto C., Rebolo R., 2017b, A&A, 605, A40
- Aguado et al. (2018) Aguado D. S., Allende Prieto C., González Hernández J. I., Rebolo R., 2018, ApJ, 854, L34
- Aguado et al. (2021) Aguado D. S., et al., 2021, MNRAS, 500, 889
- Almusleh et al. (2021) Almusleh N. A., Taani A., Özdemir S., Rah M., Al-Wardat M. A., Zhao G., Mardini M. K., 2021, Astronomische Nachrichten, 342, 625
- Alvarez et al. (2006) Alvarez M. A., Bromm V., Shapiro P. R., 2006, ApJ, 639, 621
- Aoki et al. (2007) Aoki W., Beers T. C., Christlieb N., Norris J. E., Ryan S. G., Tsangarides S., 2007, ApJ, 655, 492
- Aoki et al. (2013) Aoki W., et al., 2013, AJ, 145, 13
- Arentsen et al. (2022) Arentsen A., Placco V. M., Lee Y. S., Aguado D. S., Martin N. F., Starkenburg E., Yoon J., 2022, arXiv e-prints, p. arXiv:2206.04081
- Asplund et al. (2009) Asplund M., Grevesse N., Sauval A. J., Scott P., 2009, ARA&A, 47, 481
- Bailer-Jones et al. (2021) Bailer-Jones C. A. L., Rybizki J., Fouesneau M., Demleitner M., Andrae R., 2021, AJ, 161, 147
- Barklem et al. (2005) Barklem P. S., et al., 2005, A&A, 439, 129
- Becker et al. (2012) Becker G. D., Sargent W. L. W., Rauch M., Carswell R. F., 2012, ApJ, 744, 91
- Behara et al. (2010) Behara N. T., Bonifacio P., Ludwig H. G., Sbordone L., González Hernández J. I., Caffau E., 2010, A&A, 513, A72
- Bennett & Bovy (2019) Bennett M., Bovy J., 2019, MNRAS, 482, 1417
- Bensby et al. (2014) Bensby T., Feltzing S., Oey M. S., 2014, A&A, 562, A71
- Bergemann & Cescutti (2010) Bergemann M., Cescutti G., 2010, A&A, 522, A9
- Bergemann & Gehren (2008) Bergemann M., Gehren T., 2008, A&A, 492, 823
- Bonifacio et al. (2012) Bonifacio P., Sbordone L., Caffau E., Ludwig H. G., Spite M., González Hernández J. I., Behara N. T., 2012, A&A, 542, A87
- Bovy (2015) Bovy J., 2015, ApJS, 216, 29
- Bromm & Loeb (2003) Bromm V., Loeb A., 2003, Nature, 425, 812
- Bullock & Johnston (2005) Bullock J. S., Johnston K. V., 2005, ApJ, 635, 931
- Caffau et al. (2011a) Caffau E., et al., 2011a, Nature, 477, 67
- Caffau et al. (2011b) Caffau E., et al., 2011b, A&A, 534, A4
- Caffau et al. (2013) Caffau E., et al., 2013, A&A, 560, A15
- Carretta et al. (2002) Carretta E., Gratton R., Cohen J. G., Beers T. C., Christlieb N., 2002, AJ, 124, 481
- Carter et al. (2021) Carter C., et al., 2021, ApJ, 908, 208
- Casagrande & VandenBerg (2014) Casagrande L., VandenBerg D. A., 2014, MNRAS, 444, 392
- Casagrande et al. (2010) Casagrande L., Ramírez I., Meléndez J., Bessell M., Asplund M., 2010, A&A, 512, A54
- Casey (2014) Casey A. R., 2014, PhD thesis, Australian National University, Canberra
- Casey & Schlaufman (2015) Casey A. R., Schlaufman K. C., 2015, ApJ, 809, 110
- Castelli & Kurucz (2004) Castelli F., Kurucz R. L., 2004, ArXiv Astrophysics e-prints
- Cayrel et al. (2004) Cayrel R., et al., 2004, A&A, 416, 1117
- Chan & Heger (2017) Chan C., Heger A., 2017, in Kubono S., Kajino T., Nishimura S., Isobe T., Nagataki S., Shima T., Takeda Y., eds, 14th International Symposium on Nuclei in the Cosmos (NIC2016). p. 020209 (arXiv:1610.06339), doi:10.7566/JPSCP.14.020209
- Chiaki et al. (2015) Chiaki G., Marassi S., Nozawa T., Yoshida N., Schneider R., Omukai K., Limongi M., Chieffi A., 2015, MNRAS, 446, 2659
- Chiti et al. (2020) Chiti A., Hansen K. Y., Frebel A., 2020, ApJ, 901, 164
- Chiti et al. (2022) Chiti A., et al., 2022, arXiv e-prints, p. arXiv:2205.01740
- Christlieb et al. (2002) Christlieb N., et al., 2002, Nature, 419, 904
- Cohen & Huang (2009) Cohen J. G., Huang W., 2009, ApJ, 701, 1053
- Cohen et al. (2004) Cohen J. G., et al., 2004, ApJ, 612, 1107
- Cohen et al. (2013) Cohen J. G., Christlieb N., Thompson I., McWilliam A., Shectman S., Reimers D., Wisotzki L., Kirby E., 2013, ApJ, 778, 56
- Cooke & Madau (2014) Cooke R. J., Madau P., 2014, ApJ, 791, 116
- Cordoni et al. (2020) Cordoni G., et al., 2020, MNRAS,
- Cowan et al. (2020) Cowan J. J., Sneden C., Roederer I. U., Lawler J. E., Hartog E. A. D., Sobeck J. S., Boesgaard A. M., 2020, ApJ, 890, 119
- Cutri et al. (2003) Cutri R. M., et al., 2003, VizieR Online Data Catalog, p. II/246
- Depagne et al. (2000) Depagne E., Hill V., Christlieb N., Primas F., 2000, A&A, 364, L6
- Di Matteo et al. (2020) Di Matteo P., Spite M., Haywood M., Bonifacio P., Gómez A., Spite F., Caffau E., 2020, A&A, 636, A115
- Drawin (1968) Drawin H.-W., 1968, Zeitschrift für Physik, 211, 404
- Drawin (1969a) Drawin H. W., 1969a, Zeitschrift für Physik, 225, 470
- Drawin (1969b) Drawin H. W., 1969b, Zeitschrift für Physik, 225, 483
- Ezzeddine et al. (2016) Ezzeddine R., Merle T., Plez B., Gebran M., Thévenin F., Van der Swaelmen M., 2016, arXiv e-prints, p. arXiv:1612.09302
- Ezzeddine et al. (2017) Ezzeddine R., Frebel A., Plez B., 2017, ApJ, 847, 142
- Ezzeddine et al. (2019) Ezzeddine R., et al., 2019, ApJ, 876, 97
- For & Sneden (2010) For B.-Q., Sneden C., 2010, AJ, 140, 1694
- Frebel (2010) Frebel A., 2010, Astronomische Nachrichten, 331, 474
- Frebel (2018) Frebel A., 2018, Annual Review of Nuclear and Particle Science, 68, 237
- Frebel & Norris (2015) Frebel A., Norris J. E., 2015, ARA&A, 53, 631
- Frebel et al. (2005) Frebel A., et al., 2005, Nature, 434, 871
- Frebel et al. (2007a) Frebel A., Johnson J. L., Bromm V., 2007a, MNRAS, 380, L40
- Frebel et al. (2007b) Frebel A., Norris J. E., Aoki W., Honda S., Bessell M. S., Takada-Hidai M., Beers T. C., Christlieb N., 2007b, ApJ, 658, 534
- Frebel et al. (2008) Frebel A., Collet R., Eriksson K., Christlieb N., Aoki W., 2008, ApJ, 684, 588
- Frebel et al. (2010) Frebel A., Simon J. D., Geha M., Willman B., 2010, ApJ, 708, 560
- Frebel et al. (2013) Frebel A., Casey A. R., Jacobson H. R., Yu Q., 2013, ApJ, 769, 57
- Frebel et al. (2015) Frebel A., Chiti A., Ji A., Jacobson H. R., Placco V., 2015, ApJL, 810, L27
- Frebel et al. (2019) Frebel A., Ji A. P., Ezzeddine R., Hansen T. T., Chiti A., Thompson I. B., Merle T., 2019, ApJ, 871, 146
- Gaia Collaboration (2022) Gaia Collaboration 2022, Astronomy and Astrophysics
- Gaia Collaboration et al. (2018) Gaia Collaboration et al., 2018, A&A, 616, A1
- Gallagher et al. (2016) Gallagher A. J., Caffau E., Bonifacio P., Ludwig H.-G., Steffen M., Spite M., 2016, A&A, 593, A48
- García Pérez et al. (2006) García Pérez A. E., Asplund M., Primas F., Nissen P. E., Gustafsson B., 2006, A&A, 451, 621
- Gilmore et al. (2013) Gilmore G., Norris J. E., Monaco L., Yong D., Wyse R. F. G., Geisler D., 2013, ApJ, 763, 61
- Gravity Collaboration et al. (2019) Gravity Collaboration et al., 2019, A&A, 625, L10
- Green (2018) Green G. M., 2018, The Journal of Open Source Software, 3, 695
- Greif et al. (2010) Greif T. H., Glover S. C. O., Bromm V., Klessen R. S., 2010, ApJ, 716, 510
- Hansen et al. (2015) Hansen T., et al., 2015, ApJ, 807, 173
- Hansen et al. (2016) Hansen T. T., Andersen J., Nordström B., Beers T. C., Placco V. M., Yoon J., Buchhave L. A., 2016, A&A, 586, A160
- Heger & Woosley (2010a) Heger A., Woosley S. E., 2010a, ApJ, 724, 341
- Heger & Woosley (2010b) Heger A., Woosley S. E., 2010b, ApJ, 724, 341
- Henden & Munari (2014) Henden A., Munari U., 2014, Contributions of the Astronomical Observatory Skalnate Pleso, 43, 518
- Hollek et al. (2011) Hollek J. K., Frebel A., Roederer I. U., Sneden C., Shetrone M., Beers T. C., Kang S.-j., Thom C., 2011, ApJ, 742, 54
- Honda et al. (2011) Honda S., Aoki W., Beers T. C., Takada-Hidai M., 2011, ApJ, 730, 77
- Jacobson et al. (2015) Jacobson H. R., et al., 2015, ApJ, 807, 171
- Ji et al. (2014) Ji A. P., Frebel A., Bromm V., 2014, ApJ, 782, 95
- Ji et al. (2016) Ji A. P., Frebel A., Chiti A., Simon J. D., 2016, Nature, 531, 610
- Keller et al. (2014) Keller S. C., et al., 2014, Nature, 506, 463
- Kelson (2003) Kelson D. D., 2003, PASP, 115, 688
- Kerr & Lynden-Bell (1986) Kerr F. J., Lynden-Bell D., 1986, MNRAS, 221, 1023
- Lai et al. (2004) Lai D. K., Bolte M., Johnson J. A., Lucatello S., 2004, AJ, 128, 2402
- Lai et al. (2008) Lai D. K., Bolte M., Johnson J. A., Lucatello S., Heger A., Woosley S. E., 2008, ApJ, 681, 1524
- Lallement et al. (2018) Lallement R., et al., 2018, A&A, 616, A132
- Li et al. (2015a) Li H.-N., Aoki W., Honda S., Zhao G., Christlieb N., Suda T., 2015a, Research in Astronomy and Astrophysics, 15, 1264
- Li et al. (2015b) Li H., Aoki W., Zhao G., Honda S., Christlieb N., Suda T., 2015b, PASJ, 67, 84
- Li et al. (2015c) Li H.-N., Zhao G., Christlieb N., Wang L., Wang W., Zhang Y., Hou Y., Yuan H., 2015c, ApJ, 798, 110
- Lind et al. (2011) Lind K., Asplund M., Barklem P. S., Belyaev A. K., 2011, A&A, 528, A103
- Mardini et al. (2019a) Mardini M. K., et al., 2019a, The Astrophysical Journal, 875, 89
- Mardini et al. (2019b) Mardini M. K., Placco V. M., Taani A., Li H., Zhao G., 2019b, The Astrophysical Journal, 882, 27
- Mardini et al. (2019c) Mardini M. K., Ershiadat N., Al-Wardat M. A., Taani A. A., Özdemir S., Al-Naimiy H., Khasawneh A., 2019c, in Journal of Physics Conference Series. p. 012024 (arXiv:1904.09608), doi:10.1088/1742-6596/1258/1/012024
- Mardini et al. (2020) Mardini M. K., et al., 2020, The Astrophysical Journal, 903, 88
- Mardini et al. (2022) Mardini M. K., Frebel A., Chiti A., Meiron Y., Brauer K. V., Ou X., 2022, arXiv e-prints, p. arXiv:2206.08459
- Masseron et al. (2006) Masseron T., et al., 2006, A&A, 455, 1059
- Meléndez et al. (2016) Meléndez J., Placco V. M., Tucci-Maia M., Ramírez I., Li T. S., Perez G., 2016, A&A, 585, L5
- Milson et al. (2020) Milson N., Barton C., Bennett P. D., 2020, arXiv e-prints, p. arXiv:2011.13914
- Nordlander & Lind (2017) Nordlander T., Lind K., 2017, A&A, 607, A75
- Norris et al. (2001) Norris J. E., Ryan S. G., Beers T. C., 2001, ApJ, 561, 1034
- Norris et al. (2007) Norris J. E., Christlieb N., Korn A. J., Eriksson K., Bessell M. S., Beers T. C., Wisotzki L., Reimers D., 2007, ApJ, 670, 774
- Norris et al. (2010a) Norris J. E., Gilmore G., Wyse R. F. G., Yong D., Frebel A., 2010a, ApJ, 722, L104
- Norris et al. (2010b) Norris J. E., Wyse R. F. G., Gilmore G., Yong D., Frebel A., Wilkinson M. I., Belokurov V., Zucker D. B., 2010b, ApJ, 723, 1632
- Peterson & Kurucz (2015) Peterson R. C., Kurucz R. L., 2015, ApJs, 216, 1
- Pillepich et al. (2018) Pillepich A., et al., 2018, MNRAS, 473, 4077
- Placco et al. (2014a) Placco V. M., Frebel A., Beers T. C., Christlieb N., Lee Y. S., Kennedy C. R., Rossi S., Santucci R. M., 2014a, ApJ, 781, 40
- Placco et al. (2014b) Placco V. M., Frebel A., Beers T. C., Stancliffe R. J., 2014b, ApJ, 797, 21
- Placco et al. (2015) Placco V. M., et al., 2015, ApJ, 812, 109
- Placco et al. (2016a) Placco V. M., Beers T. C., Reggiani H., Meléndez J., 2016a, ApJ, 829, L24
- Placco et al. (2016b) Placco V. M., et al., 2016b, ApJ, 833, 21
- Placco et al. (2020) Placco V. M., et al., 2020, ApJ, 897, 78
- Placco et al. (2021a) Placco V. M., Sneden C., Roederer I. U., Lawler J. E., Den Hartog E. A., Hejazi N., Maas Z., Bernath P., 2021a, Research Notes of the American Astronomical Society, 5, 92
- Placco et al. (2021b) Placco V. M., et al., 2021b, ApJ, 912, L32
- Plez & Cohen (2005) Plez B., Cohen J. G., 2005, A&A, 434, 1117
- Rich & Boesgaard (2009) Rich J. A., Boesgaard A. M., 2009, ApJ, 701, 1519
- Roederer & Lawler (2021) Roederer I. U., Lawler J. E., 2021, ApJ, 912, 119
- Roederer et al. (2014) Roederer I. U., Preston G. W., Thompson I. B., Shectman S. A., Sneden C., Burley G. S., Kelson D. D., 2014, AJ, 147, 136
- Roederer et al. (2016) Roederer I. U., Placco V. M., Beers T. C., 2016, ApJ, 824, L19
- Roederer et al. (2018) Roederer I. U., Sneden C., Lawler J. E., Sobeck J. S., Cowan J. J., Boesgaard A. M., 2018, ApJ, 860, 125
- Ryan et al. (1991) Ryan S. G., Norris J. E., Bessell M. S., 1991, AJ, 102, 303
- Ryan et al. (1996) Ryan S. G., Norris J. E., Beers T. C., 1996, ApJ, 471, 254
- Ryan et al. (1999) Ryan S. G., Norris J. E., Beers T. C., 1999, ApJ, 523, 654
- Schlaufman et al. (2018) Schlaufman K. C., Thompson I. B., Casey A. R., 2018, ApJ, 867, 98
- Schönrich et al. (2010) Schönrich R., Binney J., Dehnen W., 2010, MNRAS, 403, 1829
- Sestito et al. (2019) Sestito F., et al., 2019, MNRAS, 484, 2166
- Simon (2019) Simon J. D., 2019, ARA&A, 57, 375
- Simon et al. (2015) Simon J. D., Jacobson H. R., Frebel A., Thompson I. B., Adams J. J., Shectman S. A., 2015, ApJ, 802, 93
- Sivarani et al. (2006) Sivarani T., et al., 2006, A&A, 459, 125
- Skúladóttir et al. (2021) Skúladóttir Á., et al., 2021, ApJ, 915, L30
- Sneden (1973) Sneden C. A., 1973, PhD thesis, The University of Texas at Austin
- Sneden et al. (2016) Sneden C., Cowan J. J., Kobayashi C., Pignatari M., Lawler J. E., Den Hartog E. A., Wood M. P., 2016, ApJ, 817, 53
- Sobeck et al. (2011) Sobeck J. S., et al., 2011, AJ, 141, 175
- Spite & Spite (1982) Spite F., Spite M., 1982, A&A, 115, 357
- Spite et al. (1999) Spite M., Spite F., Cayrel R., Hill V., Nordström B., Barbuy B., Beers T., Nissen P. E., 1999, Ap&SS, 265, 141
- Spite et al. (2000) Spite M., Depagne E., Nordström B., Hill V., Cayrel R., Spite F., Beers T. C., 2000, A&A, 360, 1077
- Spite et al. (2014) Spite M., Spite F., Bonifacio P., Caffau E., François P., Sbordone L., 2014, A&A, 571, A40
- Spite et al. (2019) Spite M., Bonifacio P., Spite F., Caffau E., Sbordone L., Gallagher A. J., 2019, A&A, 624, A44
- Statler (1988) Statler T. S., 1988, ApJ, 331, 71
- Susmitha Rani et al. (2016) Susmitha Rani A., Sivarani T., Beers T. C., Fleming S., Mahadevan S., Ge J., 2016, MNRAS, 458, 2648
- Taani (2016) Taani A., 2016, Research in Astronomy and Astrophysics, 16, 101
- Taani et al. (2019a) Taani A., Karino S., Song L., Al-Wardat M., Khasawneh A., Mardini M. K., 2019a, Research in Astronomy and Astrophysics, 19, 012
- Taani et al. (2019b) Taani A., Abushattal A., Mardini M. K., 2019b, Astronomische Nachrichten, 340, 847
- Taani et al. (2020) Taani A., Khasawneh A., Mardini M., Abushattal A., Al-Wardat M., 2020, arXiv e-prints, p. arXiv:2002.03011
- Taani et al. (2022) Taani A., Vallejo J. C., Abu-Saleem M., 2022, Journal of High Energy Astrophysics, 35, 83
- Tafelmeyer et al. (2010) Tafelmeyer M., et al., 2010, A&A, 524, A58
- Umeda & Nomoto (2003) Umeda H., Nomoto K., 2003, Nature, 422, 871
- Venn et al. (2020) Venn K. A., et al., 2020, MNRAS, 492, 3241
- White & Rees (1978) White S. D. M., Rees M. J., 1978, MNRAS, 183, 341
- Yong et al. (2013) Yong D., et al., 2013, ApJ, 762, 26
- Yoon et al. (2016) Yoon J., et al., 2016, ApJ, 833, 20
- de Bennassuti et al. (2014) de Bennassuti M., Schneider R., Valiante R., Salvadori S., 2014, MNRAS, 445, 3039