Bubble nuclei: single-particle versus Coulomb interaction effects
Abstract
The detailed investigation of microscopic mechanisms leading to the formation of bubble structures in the nuclei has been performed in the framework of covariant density functional theory. The main emphasis of this study is on the role of single-particle degrees of freedom and Coulomb interaction. In general, the formation of bubbles lowers the Coulomb energy. However, in nuclei this trend is counteracted by the quantum nature of the single-particle states: only specific single-particle states with specific density profiles can be occupied with increasing proton and neutron numbers. A significant role of central classically forbidden region at the bottom of the wine bottle potentials in the formation of nuclear bubbles (via primarily the reduction of the densities of the states at ) has been revealed for the first time. Their formation also depends on the availability of low- single-particle states for occupation since single-particle densities represent the basic building blocks of total densities. Nucleonic potentials disfavor the occupation of such states in hyperheavy nuclei and this contributes to the formation of bubbles in such nuclei. Existing bubble indicators are strongly affected by single-particle properties and thus they cannot be reliable measures of bulk properties (such as the Coulomb interaction). Additivity rule for densities has been proposed for the first time. It was shown that the differences in the densities of bubble and flat density nuclei follow this rule in the mass region and in superheavy nuclei with comparable accuracy. This strongly suggests the same mechanism of the formation of central depression in bubble nuclei of these two mass regions. Nuclear saturation mechanisms and self-consistency effects also affect the formation of bubble structures. The detailed analysis of different aspects of bubble physics strongly suggests that the formation of bubble structures in superheavy nuclei is dominated by single-particle effects. The role of the Coulomb interaction increases in hyperheavy nuclei but even for such systems we do not find strong arguments that the formation of bubble structures is dominated by it.
I Introduction
The basic approximation which appears in many nuclear models is that the nuclear density is constant in subsurface region. The simplest example is the Fermi function which is frequently used for the description of the density of the nuclei in phenomenological models (see, for example, Sec. 2 of Ref. Nilsson and Ragnarsson ). However, theoretical investigations reveal that there is a density depletion in the central region in a number of the nuclei. Such nuclei are typically called as bubble nuclei.
The physics of bubble nuclei has first been studied by Wilson in 1946 Wilson (1946) and the number of investigations of such nuclei in different theoretical frameworks have been carried out later. The energies of spherical bubble nuclei have been studied using liquid drop model in Ref. Siemens and Bethe (1967). The investigation of bubble structures in 36Ar and 200Hg has been performed in non-relativistic Hartree-Fock approach in Ref. Davies et al. (1972); Campi and D.W.L.Sprung (1973). Additional nuclei (such as 68Se, 68Se, 100Sn, 138Ce) and the details of bubble formation mechanism have been studied using the same formalism in Ref. Davies et al. (1973). The detailed investigation of spherical bubble nuclei in the liquid drop and spherical shell models has been performed in Ref. Wong (1973). However, this approach is too simplistic since it assumes zero density inside the bubble. The shell structure of spherical nuclear bubbles has been investigated in simple phenomenological shell model potentials allowing partial filling of the bubble in Ref. Dietrich and Pomorski (1997, 1998).
More sophisticated and realistic models which take self-consistency effects into account have been used in the detailed studies of bubble nuclei starting from 1990’s. The bubble structure in 34Si and the density profiles of neighboring nuclei have been extensively studied in the non-relativistic and relativistic density functional theories (DFTs) Grasso et al. (2009); Karakatsanis et al. (2017); Yao et al. (2013), ab initio approaches Duguet et al. (2017) and beyond mean field approaches Karakatsanis et al. (2017); Yao et al. (2012, 2013); Wu et al. (2014). The possibility of the existence of deformed bubbles in light nuclei has been investigated within the relativistic mean field (RMF) approach in Ref. Shukla and Åberg (2014) and the 24Ne, 32Si and 32Ar nuclei are found to be the best candidates. Bubble structures in very neutron-rich 68Ar nucleus have been investigated in Ref. Khan et al. (2008) and in 22O in Refs. Gasques et al. (2007); Grasso et al. (2009). The impact of tensor force on the formation of bubble structures in light nuclei or nuclei has been investigated in Ref. Nakada et al. (2013). The bubble structures in superheavy nuclei have been studied in non-relativistic and relativistic DFTs in Refs. Bender et al. (1999); Dechargé et al. (2003); Afanasjev and Frauendorf (2005); Schuetrumpf et al. (2017). A systematic survey of bubble structures in spherical nuclei with N(Z)=8, 20, 28, 40, 50, 82 and N=126 has been performed in the RMF framework in Ref. Saxena et al. (2019). These approaches have also been used in the studies of bubble structures in hyperheavy () nuclei (see Refs. Dechargé et al. (1999, 2003); Agbemava et al. (2019); Agbemava and Afanasjev (2021)). It is necessary to mention that the investigations of bubble structures in hyperheavy nuclei performed under restriction to spherical symmetry Dietrich and Pomorski (1997); Dechargé et al. (1999, 2003) ignore two facts Afanasjev et al. (2018); Agbemava et al. (2019); Agbemava and Afanasjev (2021), namely, (1) that the toroidal shapes are energetically more favored in such nuclei, and (2) that the most of such nuclei cannot be stabilized because of the absence of the local minimum in total energy at spherical shape.
These investigations significantly advanced our understanding of the mechanisms of the formation of the bubble structures in nuclei. They also found the counteracting mechanisms: pairing correlations Karakatsanis et al. (2017); Yao et al. (2012), beyond mean field effects Yao et al. (2012, 2013); Wu et al. (2014); Wu and Xiang (2018) and deformation Afanasjev and Frauendorf (2005); Pei et al. (2005); Shukla and Åberg (2014) soften fluctuations in the densities (as a function of radial coordinate in spherical nuclei) and somewhat reduce the bubble structures in the nuclei. In addition, some dependence of the predictions for the depletion in the central density on the model and employed functional has been found (see, for example, Refs. Afanasjev and Frauendorf (2005); Yao et al. (2012); Duguet et al. (2017); Saxena et al. (2019)).
The most of predicted bubble structures are located in exotic nuclei which either have not been measured so far or which are produced in very small amounts with very short lifetimes. So far, only in 34Si the formation of proton bubble has been indirectly confirmed in experiment Mutschler et al. (2017). Direct measurements of charge density distributions via electron scattering on unstable nuclei with sufficient luminosity are not possible today. However, such experiments can be feasible in light bubble nuclei in near future at the FRIB, FAIR and RIKEN facilities.
However, not in all respects of the physics of bubble nuclei the consensus has been reached. For example, the analysis of bubble structures in 34Si, 48Ca and , 126 and 184 isotopic chains based on the correlation analysis performed in Ref. Schuetrumpf et al. (2017) suggests that the central depression in medium-mass nuclei is very sensitive to shell effects, whereas for superheavy nuclei it is firmly driven by the electrostatic repulsion. The later result is in contradiction with the conclusions of Ref. Afanasjev and Frauendorf (2005) which clearly illustrated that the formation of central depression in the density distribution is driven by the filling of specific spherical subshells and shell structure of superheavy nuclei. It also contradicts the observation that spherical superheavy nuclei with have either no or significantly smaller depletion of the density in the central region as compared with the isotopes (see Fig. 2 in Ref. Afanasjev and Frauendorf (2005)).
The main goal of the present paper is to perform a detailed microscopic analysis of the mechanisms which lead to the formation of central depression in nucleonic densities of atomic nuclei. To achieve that the pairs of light and superheavy nuclei with and without central depression in the densities will be compared. The detailed comparison of the single-particle and Coulomb interaction contributions into the proton and neutron densities of the nuclei in these pairs allows to discriminate their role in the formation of central depression in nucleonic densities. This analysis will be further collaborated by the analysis of hyperheavy nuclei which possess pronounced bubble structure.
The paper is organized as follows. A brief outline of the theory and the selection of the nuclei under study is given is Sec. II. The role of the Coulomb interaction in the formation of bubble structure of superheavy nuclei is discussed in Sec. III. Sec. IV is dedicated to the discussion of the role of the single-particle degrees of freedom in the formation of central depression in the density distributions. The mechanisms of the formation of the wine bottle potentials are analyzed in Sec. V. The additivity rule for the densities of the pairs of the nuclei with and without central depression is considered in Sec. VI. Other general observations obtained in the present study are discussed in Sec. VII. Sec. VIII critically analyzes existing bubble indicators and their physical content. The factors affecting the availability of the low- states for occupation are analyzed in Sec. IX. Potential impact of deformation on the balance of the single-particle and Coulomb interaction contributions to the bubble structures is discussed in Sec. X. Finally, Sec. XI summarizes the results of our paper.
II Theoretical method and the selection of the nuclei
Theoretical calculations have been performed within the framework of covariant density functional theory (CDFT) Vretenar et al. (2005) employing the modified version of the computer code restricted to spherical symmetry used in Ref. Afanasjev and Frauendorf (2005). The pairing correlations are neglected in the calculations in order to better understand the underlying physical mechanisms. In reality, the pairing collapses in all nuclei considered in the present paper with the exception of the 310126 one (see Fig. 1 and further comments on this nucleus below) in relativistic Hartree-Bogoliubov (RHB) calculations with separable pairing interaction of two types (one from Ref. Agbemava et al. (2014) and another one [isospin dependent] from Ref. Teeti and Afanasjev (2021)).
| Nuclei | Proton [fm] | Neutron [fm] |
|---|---|---|
| 34Si | 3.046 | 3.304 |
| 36S | 3.171 | 3.297 |
| 208Pb | 5.450 | 5.738 |
| 292120 | 6.223 | 6.386 |
| 310126 | 6.302 | 6.519 |
| 466156 | 7.352 | 7.775 |
| 592186 | 8.048 | 8.569 |
Since the details of the CDFT framework are widely available (see, for example, Ref. Vretenar et al. (2005)), we focus on the physical quantities of the interest. The proton () and neutron () nucleonic potentials are defined as follows:
| (1) | |||||
| (2) |
where scalar potential is given by
| (3) |
meson defined part of the vector potential is written as
| (4) |
and
| (5) |
is the Coulomb potential. Note that for the sake of discussion we split vector potential (see, for example, Eq. (9) in Ref. Vretenar et al. (2005)) into meson defined and Coulomb parts. In addition, we consider only time-like components of vector mesons since only even-even nuclei are studied in the present paper.
The calculations are performed with the NL3* covariant energy density functional (CEDF) Lalazissis et al. (2009). This functional has a lot of similarities with the NL3 one used earlier in the study of bubble structures in superheavy nuclei (see Ref. Afanasjev and Frauendorf (2005)) but provides improved description of the masses and charge radii on the global scale (see Refs. Agbemava et al. (2014); Perera et al. (2021)). It was verified that main conclusions obtained in the present paper do not depend on the selection of the functional.
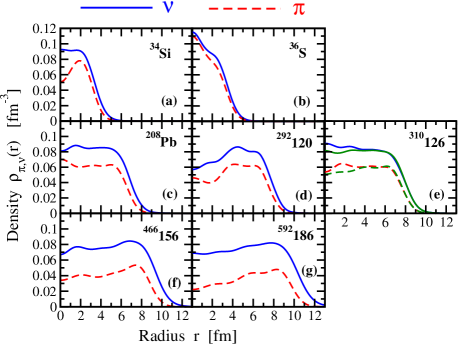
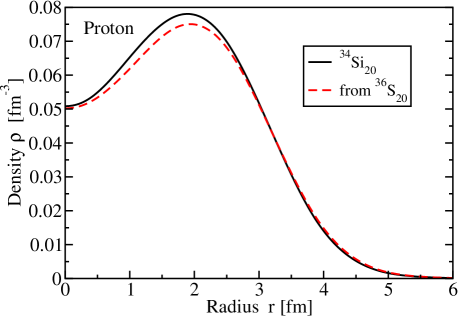
In the present study the pair of light nuclei 34Si/36S and the pair of superheavy nuclei 292120/310126 nuclei are considered. The first nucleus in these pairs (34Si and 292120) is characterized by substantial central depression, while such depression is either absent or almost suppressed in the second nucleus of the pair (see Fig. 1 and Refs. Dechargé et al. (1999, 2003); Afanasjev and Frauendorf (2005); Karakatsanis et al. (2017); Grasso et al. (2009)). Moreover, this feature exists in different theoretical frameworks. The detailed comparison of the single-particle and Coulomb interaction contributions into the differences of the proton and neutron densities of the nuclei in above mentioned pairs allows to discriminate their contribution into the formation of central depression in nucleonic densities. Note that significant central depression in the density distribution of the 292120 nucleus and flat density in the 310126 nucleus have been found both in relativistic and non-relativistic DFTs (see Refs. Afanasjev and Frauendorf (2005); Bender et al. (1999); Dechargé et al. (2003)). The fact that rms radii of proton/neutron matter distribution of the nuclei in these pairs are very similar (see Table 1) also simplifies the analysis of the additivity of the single-particle densities (see Sec. VI). Note that in the 34Si, 36S and 292120 nuclei the spherical minimum is the lowest one corresponding to the ground state in the RHB calculations (see Refs. Agbemava et al. (2014); Mas ; Agbemava et al. (2015)). In contrast, the same calculations bring oblate ground state for the 310126 nucleus (see Ref. Agbemava et al. (2015)). However, the spherical solution in this nucleus is considered here in order to have a benchmark theoretical solution with near flat density distribution in the region of superheavy nuclei.
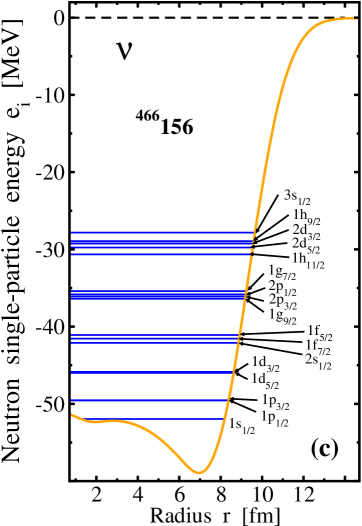
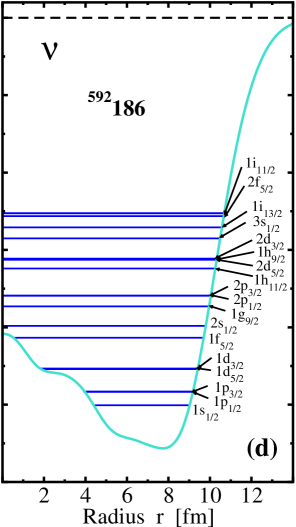
The 208Pb nucleus is also analyzed for the sake of comparison with superheavy nuclei. In addition, hyperheavy 466156 and 592186 nuclei are investigated in detail in order to get a better understanding of the factors affecting the profiles of density distributions with increasing proton number . These nuclei are located in the centers of the islands of potentially relatively stable spherical hyperheavy nuclei (see Refs. Afanasjev et al. (2018); Agbemava et al. (2019); Agbemava and Afanasjev (2021)). Note, however, that they correspond to highly excited local spherical minima and the lowest in energy solutions in axial RHB calculations have toroidal shapes.
III Superheavy bubble nuclei and the role of Coulomb interaction
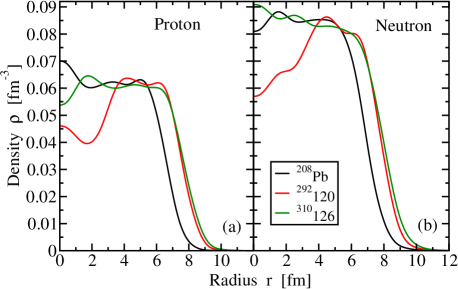
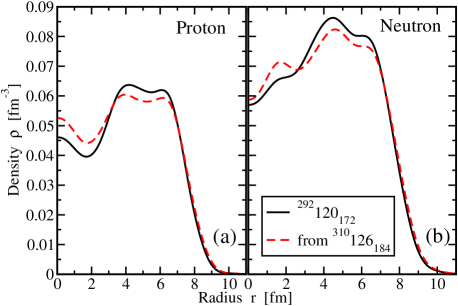
Proton and neutron density distributions of doubly magic 208Pb nucleus and superheavy 292120 and 310126 nuclei are shown in Fig. 2. The 292120 nucleus shows very pronounced depression in central densities. In contrast, such depression is absent in the 208Pb and 310126 nuclei. Thus, the increase of proton number on going from 292120 to 310126 nucleus does not trigger the enhancement of the central depression as it would be expected in the case when central depression is firmly defined by electrostatic repulsion (as suggested by Ref. Schuetrumpf et al. (2017)).
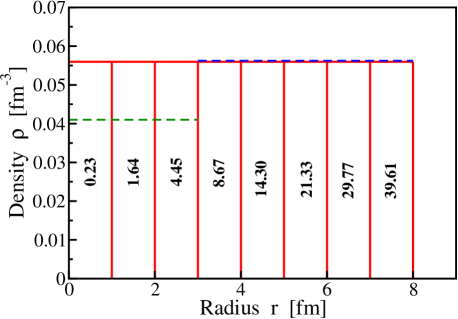
When considering central depression in medium mass to superheavy nuclei, one should keep in mind that they are created by the transfer of relatively small number of particles from the central region to near surface region. As a consequence, the bubble should not be considered as a bulk property Campi and D.W.L.Sprung (1973). The density plots as a function of radial coordinate tend to overemphasize the importance of central region since they ignore the fact that the number of particles in spherical shell of thickness is given by . To illustrate that we simplify the case of the proton subsystem of the 292120 nucleus [see Fig. 2(a)] to the sphere of radius fm and uniform density distribution . Then the number of particles in spherical shell with inner radius and outer radius is given by
| (6) |
The distribution of particles over spherical shells is shown in Fig. 3. There are only 0.23 particles in the inner sphere of radius 1.0 fm and 1.64 and 4.45 particles in the first and second spherical shells with outer radii 2.00 and 3.00 fm, respectively. Based on Fig. 2(a) one can assume that central depression with average density fm-3 is formed up to radius fm (see green dashed line in Fig. 3). To create such central depression one should move 0.061 particles from inner sphere, 0.44 particles from first inner shell, and 1.19 particles from second inner shell into outer shells located between 3.0 and 8.0 fm. If these particles are redistributed uniformly among outer shells this would lead only to a marginal increase of densities (see blue dashed line in Fig. 3).

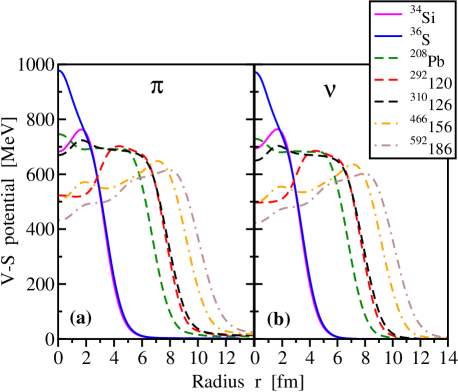
The Coulomb potentials are shown as a function of radial coordinate for the nuclei under study in Fig. 4. Their absolute values and evolution with radial coordinate are very similar for the 292120 and 310126 nuclei (see Fig. 4(a). This similarity becomes even more pronounced when normalized values of the Coulomb potential per number of protons are compared in Fig. 4(b). These results strongly suggest that the formation of the bubble structure in the 292120 nucleus is not driven predominantly by the electrostatic repulsion since such bubble structure is absent in the 310126 nucleus for which is larger. Note that the situation in this pair of the nuclei is very similar to the one seen in the pair of the nuclei 34Si and 36S (see Fig. 4) in which the formation of the proton bubble in 34Si is attributed solely to the single-particle effects (see Ref. Schuetrumpf et al. (2017)).
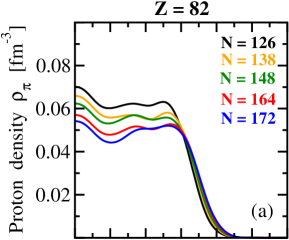
It is also interesting to compare normalized values of the Coulomb potential per number of protons for all nuclei under study (see Fig. 4(b)). At low radial coordinate has highest value in light nuclei and then it gradually decreases with increasing proton number. This correlates with the evolution of the proton density with proton number (see Fig. 1). Note that in all nuclei the asymptotic behavior of the is the same at fm.
The Coulomb potential alone in all these systems favors the arrangement of the protons into bubble like structures since , where is the radial coordinate at which the density is maximal in near surface region. is equal approximately to 0.78, 1.3, 5.7, 6.8 and 7.8 MeV in the 34Si, 36S, 208Pb, 292120 and 310126 nuclei, respectively (see Fig. 4). However, even in superheavy nuclei these contributions to the building of the wine bottle proton potential are smaller than those coming from nuclear interactions. For example, in the wine bottle potential of the 292120 nucleus the difference MeV [see Fig. 5(a)] and MeV accounts for less than one third of this value.
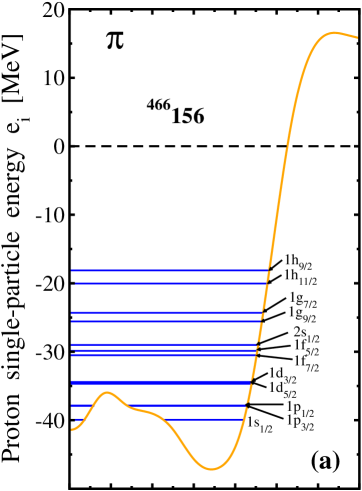
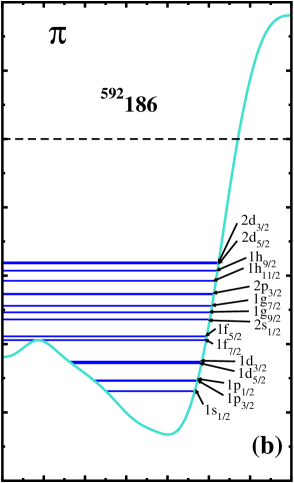
Although the role of the Coulomb potential in the formation of wine bottle potential increases in hyperheavy nuclei, even in those systems it does not become dominant. Indeed, in the 592186 nucleus MeV and MeV. Similar situation exist in the 466156 nucleus in which MeV and MeV. The values of the proton () and Coulomb () potentials in these differences are defined at radial coordinates corresponding to minimum and maximum points of the wine bottle part of the proton potentials shown in Figs. 10(a) and (b) below.
IV The role of single-particle degrees of freedom
In order to obtain better microscopic understanding of the origin of the bubble nuclei and the role of the single-particle structure in their formation we carry out a detailed investigation of the single-particle properties in the pair of superheavy nuclei 292120 and 310126 and in the pair of the isotones 34Si and 36S.
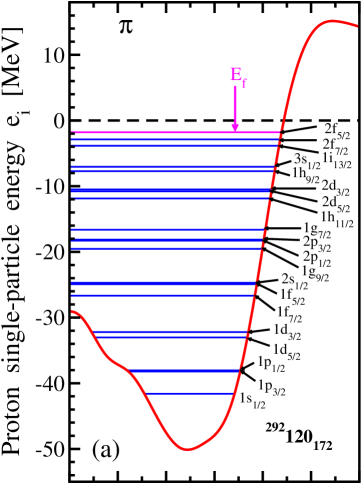
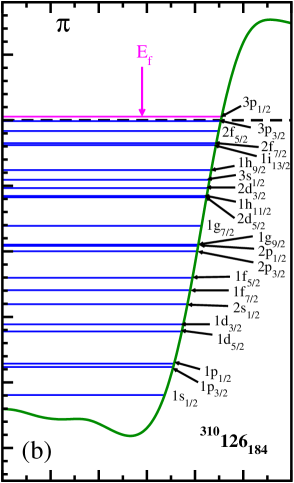
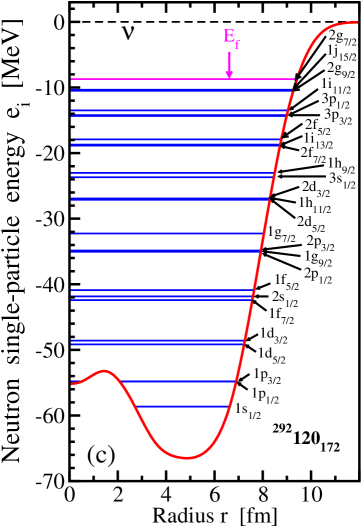
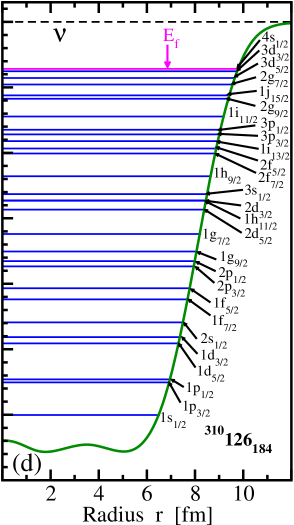
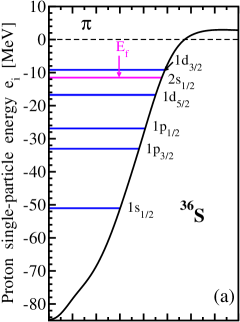
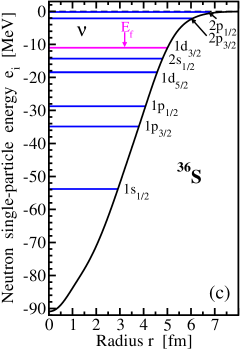
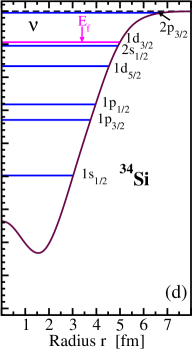
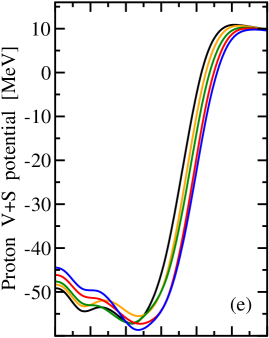
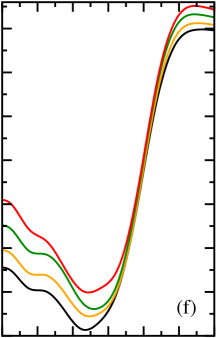
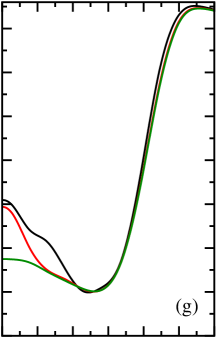
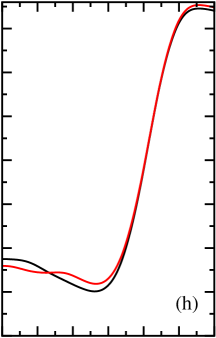
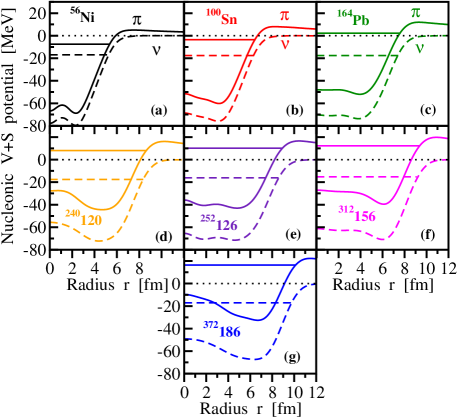
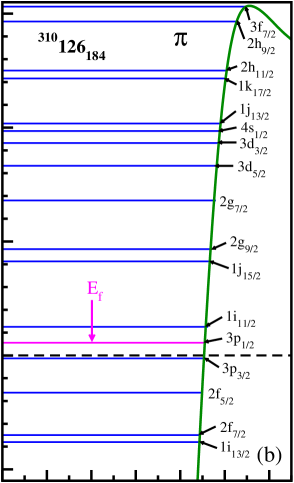
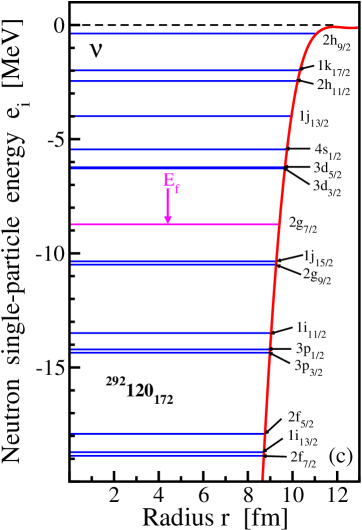
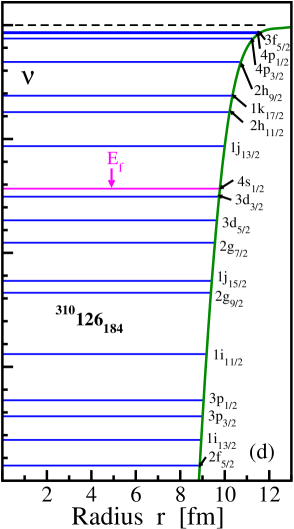
We start from the analysis of the first pair. The nucleonic potentials of these nuclei and their occupied states are shown in Fig. 5. The nucleonic potentials of the 310126 nucleus are similar to those of 208Pb (compare Fig. 3(c),(d) in Ref. Afanasjev and Frauendorf (2005) with Fig. 5(b) and (d) in the present paper): they have flat bottom potentials. In contrast, the nucleonic potentials of the 292120 nucleus are wine bottle shaped and this is especially pronounced for the proton subsystem (see Figs. 5(a) and (c)).
Total nucleonic density in a given subsystem (proton or neutron) is built from the contributions of individual particles as follow
| (7) |
Here we consider only the nuclei in which full spherical subshells (indicated by subscript ) are occupied. Thus, the sum runs over spherical subshells with multiplicity and is the density of the single-particle state belonging to the -th subshell with the normalization
| (8) |
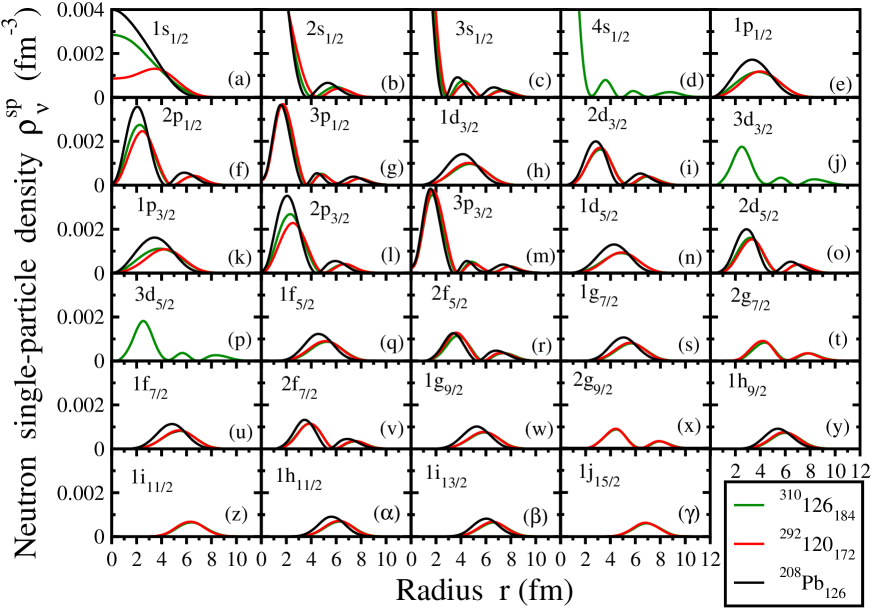
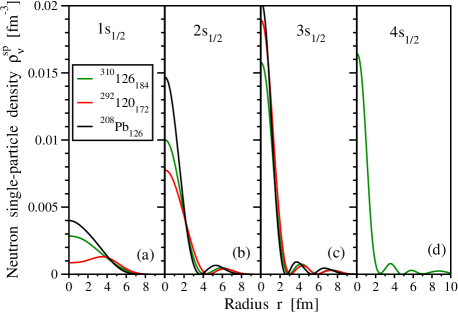
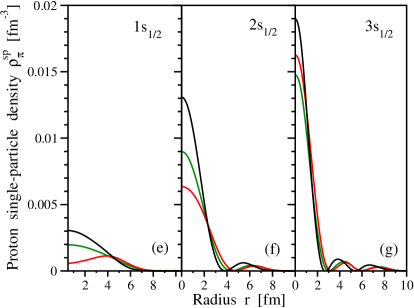
The calculated neutron single-particle densities of the 208Pb, 292120 and 310126 nuclei are shown in Fig. 6. For the subshells, proton single-particle densities are very similar to the neutron ones. Thus, they are not shown. The single-particle densities for the neutron and proton states are shown in greater detail in Fig. 7.
The following general features emerge from the analysis of these densities. First, the density at the center is built almost entirely by the states because centrifugal interaction does not allow the buildup of the density at for the states (see discussion in Sec. 6 of Ref. Nilsson and Ragnarsson ). In the relativistic framework, there is some contribution to the density at coming from the states which is especially pronounced for the and states [see Figs. 6(g) and (m)]. It originates from the fact that small components of the Dirac spinor have opposite parity to the large component. As a consequence, the state have the part of small component in the state which builds the density at . Note that in non-relativistic framework this mechanism is absent and the density at is built solely by the states (see Ref. Nilsson and Ragnarsson ).
Second, the single-particle densities of the states in the 292120 and 310126 nuclei are very similar: this is a consequence of similar rms radii in respective subsystems of these nuclei (see Table 1). The densities of the single-particle states in the 208Pb nucleus have similar radial dependences as those in superheavy nuclei but they are somewhat compressed in radial direction because of smaller rms radii (see Table 1).
Third, the peaks of the single-particle density of the states with principal quantum number move to higher radial coordinate with increasing . The analysis of the and states is complicated by the presence of two and three peaks in density distribution, respectively. However, these densities also move to higher radial coordinate with increasing .
Fourth, for the majority of the states located substantially above the bottom of nucleonic potential the densities of the spin-orbit partner orbitals are very similar [compare, for example, the and states in Fig. 6(t) and (x)]. The densities of the states of the spin-orbit doublets are only slightly compressed in radial coordinate as compared with the ones of their partners since these states are located deeper in the nucleonic potential due to spin-orbit interaction.
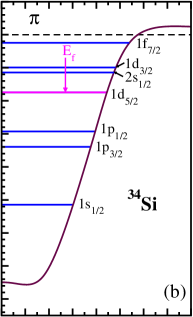
A specific feature of the bubble nuclei is the formation of wine bottle shaped potentials (see Ref. Afanasjev and Frauendorf (2005) and Figs. 5 and 8). The transition from the 310126 nucleus, characterized by the flat bottom potentials, to the 292120 one, characterized by wine bottle potentials, is done by removing the protons from the and spherical subshells and the neutrons from the , and spherical subshells (see Fig. 2 in Ref. Afanasjev and Frauendorf (2005) and Fig. 5). These orbitals built the density in central and near-central regions of the nuclei and their removal leads to the depletion of central density and, as a consequence, to the formation of wine bottle proton and neutron potentials. In a similar fashion, the removal of two neutrons from the subshell in 36S leads to the formation of wine bottle neutron potential in 34Si [compare Figs. 8(c) and (d)] and flattening of proton potential in 34Si [compare Figs. 8(a) and (b)].
However, the impact of wine bottle nucleonic potentials on the single-particle states and on their densities has not been studied so far. The analysis of Figs. 5(a) and (c) reveals that for some single-particle states located near the bottom of potential there is a classically forbidden region at radial coordinate fm. These are proton , , , and states [see Fig. 5 (a)] and neutron , and states [see Fig. 5 (c)]. The presence of this classically forbidden region leads to a substantial reduction of the densities of the proton and neutron states in the 292120 nucleus for radial coordinate and near it as compared with the ones in the 208Pb and 310126 nuclei, which are characterized by near flat bottom potential [see Figs. 7(a) and (e)]. In addition, the profiles of the density distributions of the states in the 292120 nucleus as a function of radial coordinate change drastically: the peak of the density is localized at fm in the 292120 nucleus while in the 208Pb and 310126 nuclei it is located at fm [see Figs. 7(a) and (e)].
Classically forbidden regions for the proton and neutron and states are located for radial coordinate which is smaller than approximately 2.0 fm (see Figs. 5(a) and (c)). However, its impact on the densities of these states is small since in the 292120 and 310126 nuclei the peak of their density distributions is located at fm and the difference between their densities in these two nuclei is small [see Figs. 6(e) and (k)]. The impact of classically forbidden regions of the proton potential on the densities of the proton and orbitals is even smaller. This is because the peak of their density distributions [at fm, see Figs. 6(n) and (h)] is located far away from the boundary of the classically forbidden region [at fm, see Fig. 5(a)].
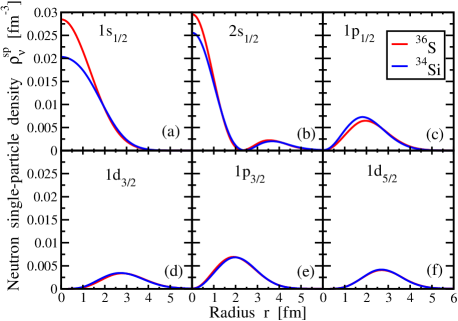
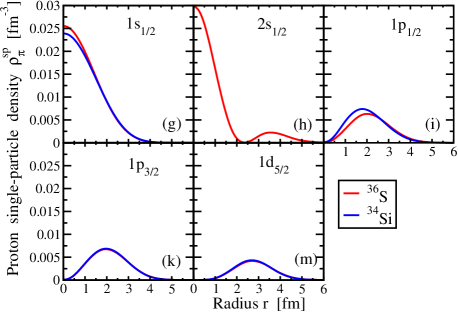
In addition, wine bottle potential affects the density distributions of other states which are located above its bottom and this effect is especially pronounced for the states. For example, it has substantial impact on the densities of the proton and neutron states which for fm are substantially smaller in the 292120 nucleus than those in the 208Pb and 310126 nuclei [see Figs. 7(b) and (f)]. Note that the total density of the nucleus at fm is built almost entirely by the states. As a consequence, the differences in the proton and neutron densities at seen in the pairs of nuclei 208Pb/292120 and 292120/310126 are predominantly due to the impact of the change of the occupation of the states and the impact of wine bottle nucleonic potentials of the 292120 nucleus on the density distributions of these states. A similar impact is also seen in the 36S/34Si pair of the nuclei for which the removal of two protons from the states in 36S leads to the formation of wine bottle neutron potential in 34Si (see Fig. 8). The consequence of this process is a substantial decrease of the single-particle densities of the neutron and states in the 34Si nucleus at low radial coordinate as compared with those in 36S [see Figs. 9(a) and (b)]. Note that this reduction is almost absent in proton subsystem since proton potential of 34Si has flat bottom [see Fig. 8(b)]. Note that spherical hyperheavy 466156 and 592186 nuclei are characterized by wine bottle nucleonic potentials (see Fig. 10 below) and the densities of low-lying states are affected by their presence in a similar way to that discussed above for the 292120 nucleus.
V The mechanisms of the formation of the wine bottle potentials
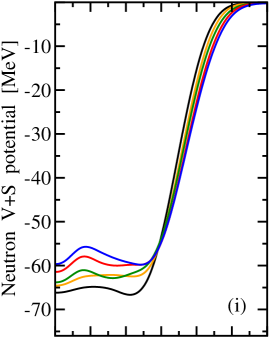
In order to better understand the mechanisms of the formation of wine bottle potentials we consider the evolution of nucleonic potentials and densities along the isotopic and isotonic chains in Fig. 11. We start from 208Pb and then sequentially occupy spherical subshells in the order shown in Table 2. In this way, the densities and potentials are built first along (first column in Fig. 11), then along (second column in Fig. 11) and (third column in Fig. 11) and finally along (fourth column in Fig. 11). Note that not necessary the occupation of spherical subshells in the order shown in Table 2 leads to the ground states in the nuclei of interest. However, this is acceptable since we are interested in the understanding of the mechanisms leading to the formation of the wine bottle potentials and their dependence on the occupation of specific single-particle states and this is easier to achieve by considering the occupation of full spherical subshells. Note that obtained solutions in 209Pb, 292120 and 310126 nuclei correspond to the ground states.
Let us start from the 208Pb nucleus and to see how the densities and potentials are affected by the addition of neutrons and protons. The neutron potential of this nucleus is flat bottom one [see Fig. 11(i)]. However, proton potential shows some development of wine bottom features but the difference between the values at and fm is only around 6 MeV (see Fig. 11(e)). Although some fluctuations induced by the single-particle effects exist, the proton and neutron densities of this nucleus in the subsurface region are close to flat ones [see Fig. 11(a) and (m)]. Note that when considering the addition of particle(s) one should take into account the structure of their single-particle density distributions shown in Fig. 6 and the location of the maxima (peaks) of their density distributions in radial coordinate () (see Table 2). The single-particle density is typically localized within fm region around the peak.
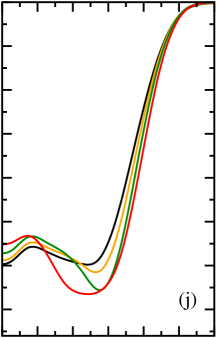
The Pb ) isotopic chain will be considered first. The surface region of these nuclei are located at fm [see Fig. 11(m)]. Thus, the occupation of the subshell, leading to the isotope, builds the neutron density mostly in the near surface and surface regions. As a consequence, the neutron density profile is similar for the and isotopes in the subsurface region [see Fig. 11(m)]. The occupation of the subshell, leading to the isotope builds the density in the subsurface region around (due to the first peak of the single-particle density distribution) and in the surface region (due to the second peak of the single-particle density at fm). As a consequence, the neutron density of the isotope is larger than those of the and isotopes at fm but smaller111The density in the central ( fm) region of the nucleus typically decreases with increasing proton or neutron number if no new state(s) is(are) occupied [see Figs. 11(a), (m), (b), (n), and (c)]. This is due to the stretching out the radial profile of the density distribution of the single-particle states with increasing proton and neutron number (see Fig. 6). (and similar in radial profile) for fm [see Fig. 11(m)]. The occupation of the subshell, leading to the isotope, contributes density mostly in the surface region since the peak of its single-particle density is located at fm (see Table 2). As a result, in the subsurface region the density profiles as a function of radial coordinate are very similar for the and isotopes [see Fig. 11(m)]. The effect of the occupation of the subshell is very similar to that of the subshell discussed above [see Fig. 11(m)].
The final result of the sequence of these occupations of the spherical subshells is the formation of the bubble structure in the neutron density of the isotope [see Fig. 11(m)]. It is created by the combination of two factors, namely, (i) the buildup of the densities at fm due to the first peaks of the single-particle densities of the and subshells and (ii) the reduction of the neutron densities in the central region (in particular, at ) due to a general stretching out of the nucleus with increasing neutron number. The latter effect is even more pronounced in proton subsystem [compare Figs. 11(a) and (m)]. Note, however, that in the subsurface region the radial profile of the proton densities remains more or less the same but its magnitude decreases drastically with increasing neutron number [see Figs. 11(a)].
The consequences of these density changes for the nucleonic potentials are somewhat counterintuitive. The neutron potentials of the Pb isotopes remain close to the flat bottom ones [see Fig. 11(i)] despite the formation of the neutron bubble structures in the and isotopes [see Fig. 11(m)]. In contrast, the wine bottom features become enhanced in the proton potentials of the and, especially, isotopes as compared with those of the isotope [see Fig. 11(e)].
Similar features are also seen in the isotopic chain. The occupation of the and spherical subshells builds density near fm and leads to the formation of pronounced proton bubble structures in the and, especially, isotones [see Table 2 and Fig. 11(b)]. The subsequent occupation of the and subshells leads to an additional buildup of the densities near fm in the isotone but this process still preserves the proton bubble structure [see Fig. 11(b)]. These modifications of the proton densities feed back into proton potentials the wine bottom features of which become more enhanced in the and isotones as compared with the one [see Fig. 11(f)]. Because of the isovector force, which tries to keep the neutron and proton density profiles alike, neutron bubble structures are also somewhat enhanced in the and isotones as compared with the one [see Fig. 11(n)]. This feeds back into the neutron potentials of these isotones which contrary to the and ones develop wine bottom features [see Fig. 11(n)].
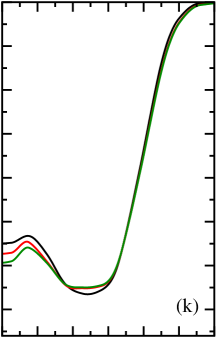
The next step is along the line. The occupation of the and subshells leading to the isotope builds density near fm making neutron density flat in the fm region [see Fig. 11(o)]. However, the neutron bubble still survives. Only the occupation of the subshell, leading to the isotope, eliminates this bubble [see Fig. 11(n)]. Note that proton bubble structures survive in these nuclei but they become less pronounced [see Fig. 11(c)]. These neutron density changes somewhat reduce wine bottom features of the neutron potential but do not eliminate them completely [see Fig. 11(k)]. The situation is more drastic for the proton potential in which the occupation of the neutron subshell significantly reduces wine bottom features of the potential [see Fig. 11(g)]. Let us consider the latter case of the transition from to in detail. This is definitely fully self-consistent process in which the drastic increase of the neutron density at and near induced by the occupation of the state [see Fig. 11(o)] leads to a moderate increase of the proton densities at and near due to isovector nature of nuclear force [see Fig. 11(c)]. This in turn requires the increase of the single-particle densities of the occupied proton , , and states [which is seen in detailed analysis] that can be achieved only by the transition from wine bottom to near flat bottom proton potential [see Fig. 11(g)].
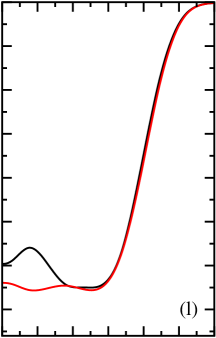
Finally, the transition from the to isotone along the line is carried out by occupying the and subshells. This leads to the flattening of the proton density in the subsurface region [see Fig. 11(d)] because the major peak of single-particle density of these proton subshells is located at fm [see Table 2 and Figs. 6(g) and (m)]. Similar effect is seen in the neutron densities because of the isovector character of nuclear force [see Fig. 11(p)]. However, the impact of this process on the features of the proton potential is rather small [see Fig. 11(h)]. In contrast, it completely removes wine bottom features from the neutron potential which becomes flat bottom one [see Fig. 11(l)].
The cases discussed above reveal that the formation/suppression of the bubble structure in the densities of one subsystem (let us call it as A) of the nucleus leads to a significant enhancement of wine bottle (flat bottom) features of the potential in another subsystem (let us call it as B)222If A=proton then B=neutron and vise versa.. Note that the potentials of the subsystem A are only moderately affected by this process. Similar features have been seen earlier in the analysis of the ground state and excited configurations of the 292120 nucleus (see the discussion of Fig. 3 in Ref. Afanasjev and Frauendorf (2005)). The following explanation is in place. Let us consider the case of the formation of the bubble structure in the densities of the subsystem A. It proceeds by the occupation of the states in the vicinity of the Fermi level and it has only minor impact on the nucleonic potential of this subsystem. The isovector interaction tries to keep proton and neutron densities alike. For a fixed number of the particles in the subsystem B, the formation of the bubble structure in its densities can be achieved only by a significant enhancement of wine bottom features of its potential.
VI Additivity rule for densities
| orbital | peak(s) [fm] | ||
| 1 | 2 | 3 | 4 |
| 126 | 138 | 6.2 | |
| 138 | 148 | 4.4 and 8 | |
| 148 | 164 | 6.8 | |
| 164 | 172 | 4.3 and 8 | |
| 82 | 92 | 5.7 | |
| 92 | 106 | 6.5 | |
| 106 | + | 120 | 3.8 and 7.4 |
| 172 | + | 182 | 2.5, 5.8 and 8.5 |
| 182 | 184 | 0 | |
| 120 | + | 126 | 1.8, 5.0, and 8.0 |
The addition or removal of particle(s) to the nucleonic configuration modifies the total physical observables. But it also creates the polarization effects on the physical properties (both in time-even and time-odd channels) of initial configuration. The comparison of relative properties of two configurations can shed important light both on the impact of the added/removed particle(s) in specific orbital(s) on physical observable of interest and on the related polarization effects. In this context the additivity rule of physical observables plays an extremely important role since it allows to verify whether the independent particle motion is realized in finite nuclei Satuła et al. (1996); Afanasjev (2022). This rule states that physical observable in the configuration can be approximated as a sum of physical observable in reference configuration and single-particle contributions of the states by which the configurations and differ
| (9) |
The additivity rule was successfully tested for the effective alignments and relative quadrupole moments of the superdeformed rotational bands in unpaired regime (see Refs. Ragnarsson (1993); Satuła et al. (1996); Afanasjev et al. (1998); Matev et al. (2007)). This justifies the use of an extreme single-particle model in an unpaired regime typical of high angular momentum. Note that the basic idea behind the additivity rule for one-body operators is rooted in the independent particle model Ragnarsson (1993); Satuła et al. (1996); Afanasjev (2022).
The additivity rule for densities is used here in order to verify whether the formation of the bubbles in the nuclei is predominantly due to single-particle degrees of freedom. This additivity rule is given as
| (10) |
Here, reference nucleus (either 310126 or 36S) is characterized by flat bottom potentials while that in compared nucleus (either 292120 or 34Si) by wine bottle potential(s). Single-particle density contributions of the single-particle states by which nuclei A and B differ are defined in the reference nucleus .
The application of additivity rule is demonstrated in Figs. 12 and 13. One can see that starting from proton and neutron self-consistent densities and respective single-particle densities in the 310126 nucleus, the additivity rule reasonably well predicts proton and neutron densities in the 292120 nucleus (see Fig. 12). The same is true for proton densities in the pair of the nuclei 34Si and 36S. Note that the level of the deviation of the densities obtained via additivity rule from self-consistent ones in similar in both pairs of nuclei. This is due to the similarity of the relative change in total particle numbers between nuclei B and A in both pairs (5.9% in the 34Si/36S pair and 6.2% in the 292120/310126 pair). Note that above discussed relative change in total particle number is comparable with the upper limit used in the analysis of additivity rule for relative quadrupole moments and effective alignments in Refs. Satuła et al. (1996); Afanasjev et al. (1998); Matev et al. (2007).
These results strongly point to the same mechanism of the formation of central depression of density distribution which is related to the single-particle degrees of freedom. In addition, in contrast to the results of Ref. Schuetrumpf et al. (2017) they suggest that electrostatic repulsion does not play a dominant role in the formation of bubble superheavy nuclei.
Note that the addition or removal of particle(s) to the nucleonic configuration modifies via the polarization effects the total and single-particle radii (see Refs. Reinhard and Flocard (1995); Perera et al. (2021)). For example, subsequent addition of neutrons leads to an increase of total charge radii Reinhard and Flocard (1995); Goodacre et al. (2021); Perera et al. (2021) and proton single-particle radii Afanasjev et al. (2021) in the Pb isotopic chain. These polarization effects are minimized in the considered pairs of the nuclei. This is because the rms radii of proton/neutron matter distributions are very similar in compared nuclei (see Table 1). It is reasonable to expect that with the increase of the difference of these radii in the pairs of nuclei under comparison the accuracy of the additivity principle for the single-particle densities will somewhat decrease. This is because the polarization effects will lead to a larger difference of the rms radii of proton and neutron singe-particle states in compared nuclei.
VII General observations
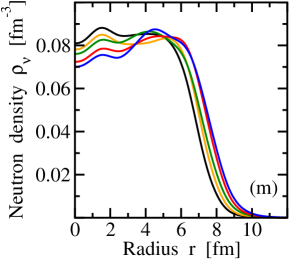
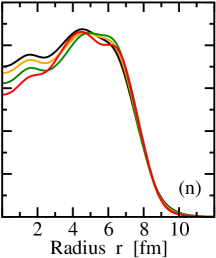
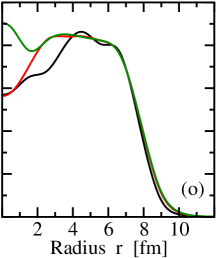
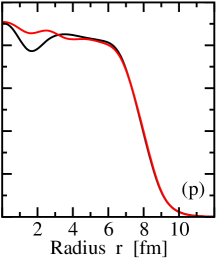
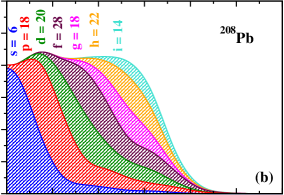
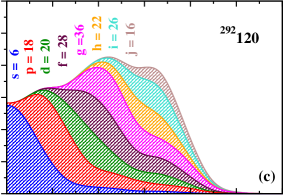
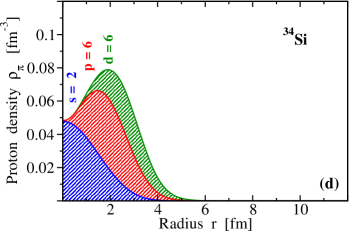
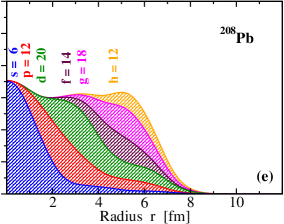
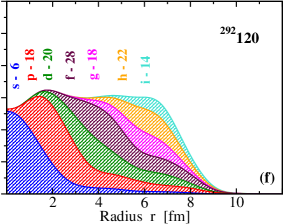
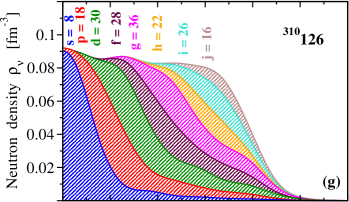
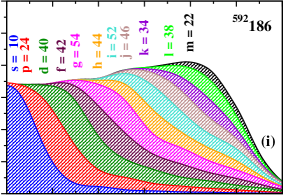
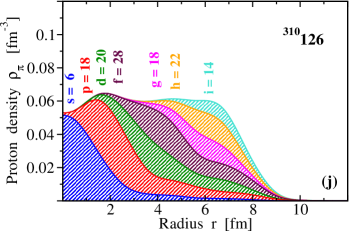
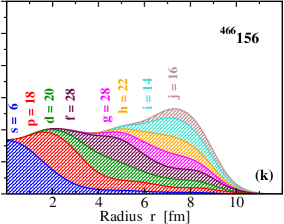
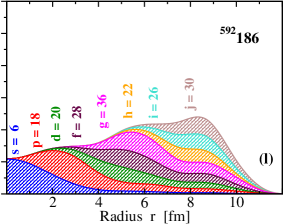
In order to better understand the origin of the central depressions in density distributions let us consider the contributions of different groups of the single-particle states with given orbital angular momentum to the total neutron and proton densities. They are shown in Fig. 14 for selected set of spherical nuclei across the nuclear chart. These nuclei include a very light 34Si nucleus, doubly magic 208Pb nucleus, superheavy 292120 and 310126 nuclei and hyperheavy 466156 and 592186 nuclei (located in the centers of potential islands of stability of spherical hyperheavy nuclei (see Refs. Agbemava et al. (2019); Agbemava and Afanasjev (2021)). The analysis of this figure leads to several important conclusions.
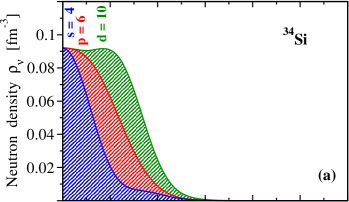

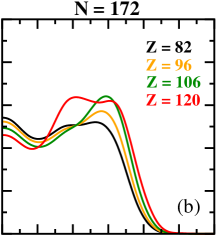
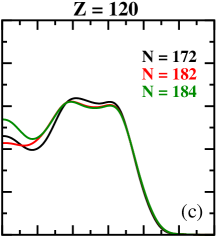
First, let us consider the average density in the respective -th subsystem for radial coordinate below the one at which the surface density reaches its maximum value. Neutron average density is located near saturation density fm-3 for all these nuclei. Although there is some trend of the decrease of this density with increasing proton number , it is significantly less pronounced than the one for proton average densities . The neutron average density tries to saturate at fm-3 and this forces proton subsystem to expand and follow the radial pattern of neutron density distribution. Because of the imbalance between proton and neutron numbers this can be achieved only by reducing overall proton density down to fm-3 in the 208Pb, 292120 and 310126 nuclei and down to fm-3 in very neutron-rich hyperheavy 466156 and 592186 nuclei. Similar features are seen in the nuclei of the isotopic chains with and 126 (see Fig. 2 in Ref. Afanasjev and Frauendorf (2005)) and in global survey of Ref. Saxena et al. (2019): neutron average densities stay close to the fm-3 while average proton densities decrease with increasing neutron number. These observations (in particular, the saturation of neutron density near fm-3) suggest that overall behavior of nuclear system is predominantly defined by nuclear forces and not by the Coulomb interaction.
Second, the proton and neutron densities in the center of the nucleus, in its central and surface regions depend sensitively on the availability for occupation of the single-particle states with respective radial properties. The densities at are built almost entirely by the states. However, with increasing particle numbers additional states are not always available (see, for example, Fig. 5 in the present paper and Figs. 5 and 8 in Ref. Agbemava et al. (2019)). The most striking example is the proton subsystem in which only six states are available for occupation in the ground states of the nuclei with (see Figs. 14(e), (f), (j), (k), and (l)). Indeed, the transition from the 208Pb nucleus to 592186 one (which is equivalent to an addition of 104 protons to the 208Pb nucleus) does not provide any additional state. As a consequence, the density at falls down from fm-3 in the 208Pb nucleus to fm-3 in the 592186 nucleus [compare Figs. 14(e) and (l)]. The same features are also seen in neutron subsystem: the transition from the 208Pb nucleus to the 292120 one [both of them have six occupied states, see Figs. 14(b) and (c)] and from the 310126 nucleus to 466156 one [both of them have eight occupied states, see Figs. 14(g) and (h)] do not bring additional occupation of the states which results in the reduction of the density at .
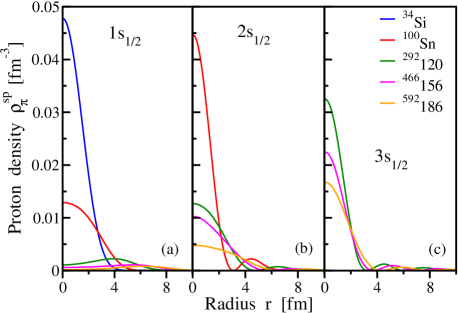
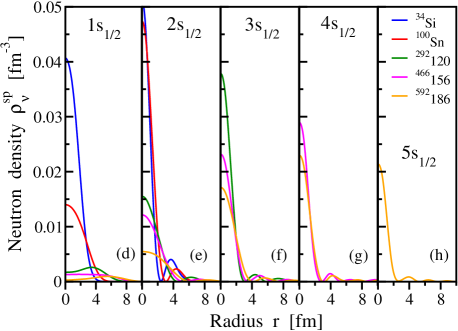
This significant reduction of the density at the center of super- and hyperheavy nuclei is also facilitated by two factors which affect the magnitude of the single-particle density of the states at . The first factor is the presence of classically forbidden regions in the nucleonic potentials which leads to a decrease of the density of the and states at [see Figs. 15(a), (b), (d), and (e)]. This decrease is especially drastic in the , 466156 and 592186 nuclei and for the states. For example, the density at the center of the proton subsystem of the 592186 nucleus is built only by the and states and the contribution of the state is almost zero. Note that the 77% of the total proton density at is built by only two protons. Another factor is the stretching out the radial profile of the density distribution of a given single-particle state with increasing proton number or mass of the nucleus (see Fig. 15). It leads to the decrease of the density of the states at because of the normalization condition of Eq. (8).
Third, the densities in the central fm regions of proton and neutron subsystems are built by the occupation of the , and states in all nuclei under study (see Fig. 14). Again the availability of such states for occupation plays a critical role. For example, the number of occupied proton , and states is 6, 18 and 20, respectively, in the 292120, 310126, 466156 and 592186 nuclei [see Figs. 14(f), (j), (k) and (l)]. As a consequence, the process of the increase of the radius of the nucleus with increasing (see Table 1) leads to a reduction of the proton density in the central region with increasing . A similar example is seen in the neutron subsystem of the 208Pb and 292120 nuclei in which the number of occupied , and states is exactly the same (6, 18 and 20, respectively) [see Figs. 14(b) and (c)]. Again the increase of mass number triggers the reduction of neutron density in the central region.
Fourth, the densities at higher radial coordinate and in the surface and near-surface regions are built predominantly by the groups of medium and high- orbitals, respectively (see Figs. 6 and 14). However, the attribution of the orbitals to these two groups depends on the nucleus and in many cases it is not unique. This is because the contribution of the groups of the orbitals with specific orbital angular momentum to the nucleonic density stretches over considerable range of radial coordinate (see Fig. 14). In addition, the groups of the states with fixed are built from a number of the subshells with different principal quantum numbers which differ significantly in the nodal structure of density distribution (the number of the peaks of single-particle density is equal to ) and in the localization of density in radial coordinate (see Fig. 6).
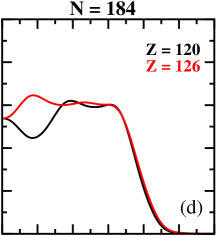
The nucleonic density profiles in these regions depend also on the availability of specific groups of the orbitals for occupation. To illustrate that let us compare the proton densities of the 466156 and 592186 nuclei [see Figs. 14(k) and (l)]. The number of the , , and states building the density in the fm region is the same in both nuclei. However, the transition from the 466156 nucleus to the 592186 one leads to the increase of mass number which triggers the increase of the size of nucleus (see Table 1) and as a consequence the lowering of the density in the fm region of the 592186 nucleus as compared with the 466156 one. This transition is also associated with the addition of eight , eight and fourteen protons to the proton subsystem of the 466156 nucleus: these orbitals build density mostly in near-surface and surface regions of the 592186 nucleus [see Fig. 14(l)]. However, the maximum density at the surface of the latter nucleus is smaller than that in the former one because of the increase of the size of proton subsystem [compare Figs. 14(k) and (l)]. As a consequence of these self-consistent processes, the proton depletion factor (see definition in Eq. (11) below) of the 592186 nucleus is significantly larger than that of the 466156 one (see Table 3). Interestingly enough the neutron depletion factor shows opposite trend (see Table 3) and this is predominantly due to occupation of two additional neutrons leading to an increase of the density at in the 592186 nucleus as compared with the 466156 one [see Figs. 14(k) and (l)].
VIII Bubble indicators and their physical content
| Nuclei | (%) | (%) |
|---|---|---|
| 34Si | 34.8 | 0 |
| 36S | 0 | 0 |
| 40Ca | 0 | 0 |
| 208Pb | 0 | 8.2 |
| 292120 | 27.7 | 34.0 |
| 310126 | 16.7 | 0 |
| 466156 | 36.3 | 20.4 |
| 592186 | 53.8 | 16.0 |
Two measures of the central depression in nucleonic densities are used in the literature. The first one called as depletion factor is defined by Grasso et al. (2009); Chu et al. (2010)
| (11) |
where and represent the central and maximum densities, respectively. This is the simplest measure and numerical values of for the nuclei of interest are shown in Table 3. More complicated measure of central depression has been introduced in Ref. Schuetrumpf et al. (2017) and it is defined as
| (12) |
where , is the density at the center of respective subsystem and is the average density of the nucleus assuming a constant density up to diffraction radius Friedrich and Voegler (1983). The authors of Ref. Schuetrumpf et al. (2017) use this radius instead of rms radius since it is not affected by surface thickness.
| Nuclei | (%) | (%) |
|---|---|---|
| 56Ni | 0 | 0 |
| 100Sn | 24.31 | 21.84 |
| 164Pb | 0 | 0 |
| 240120 | 26.12 | 20.88 |
| 252126 | 15.91 | 17.39 |
| 312156 | 34.45 | 28.23 |
| 372186 | 58.25 | 51.36 |
Both indicators are strongly affected by the single-particle degrees of freedom. For example, in both definitions is determined almost entirely by the states and their availability for occupation across the nuclear chart. Second ingredient entering into Eqs. (11) and (12) is also not free from single-particle degrees of freedom. Let us first consider depletion factor . In the cases when the density in center is larger than the one at the surface [see Figs. 1(a), (b), (c) and (f)] then and (see Table 3). In other cases, is defined by the single-particle states which build maximum density in the region near the surface [see Figs. 1(a), (d), (e), (f), (g) and (h), Fig. 14 and discussion of the second part of Sec. VII]. used in Eq. (12) also depends on the underlying single-particle structure and availability of the single-particle states for occupation despite the fact that it averages densities up to diffraction radius .
These facts strongly suggest that both indicators cannot be reliable measures of bulk properties (such as those related to the Coulomb interaction). This is especially true because in wine bottle nucleonic potentials the densities of the states, their magnitudes at and their radial profiles, are affected strongly by classically forbidden regions of the potentials (see Secs. IV and VII). Thus, the conclusions of Ref. Schuetrumpf et al. (2017) that the central depression in superheavy nuclei is firmly driven by the electrostatic repulsion should be treated with extreme caution since they are based on the bubble indicator of Eq. (12).
In nuclei the protons feel combined nuclear and Coulomb potentials which lead to proton single-particle states with specific density distributions over radial coordinate. In addition, there is a nuclear interaction between protons and neutrons which further complicates the situation. As a consequence, there is no straightforward procedure of the separation of nuclear and Coulomb interaction effects on the central depression in density distributions. On the other hand, in the light of the conclusions of Ref. Schuetrumpf et al. (2017) it is important to estimate possible magnitude of the Coulomb interaction effects on these depressions. From out point of view, the only possible way to get that is by comparing proton and neutron depressions in symmetric nuclei with the same nucleonic configurations in proton and neutron subsystems.
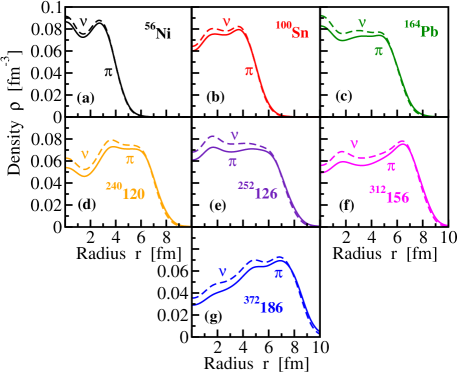
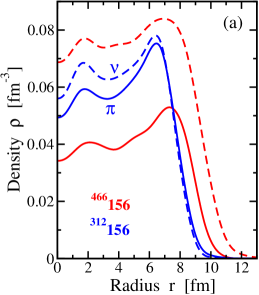
Proton and neutron densities of selected set of the nuclei are shown in Fig. 16. Most of these nuclei belong to isotopic chains discussed above, but we also added 56Ni and 100Sn333The majority of these nuclei are proton unbound (see Fig. 17) and there is no local minimum at spherical shape in deformation energy curves of hyperheavy nuclei. The lowest in energy solutions of the hyperheavy 312156 and 372186 nuclei in the axial RHB calculations correspond to toroidal shapes. Thus, spherical solutions in these two hyperheavy nuclei are used here as theoretical benchmarks for the investigation of the impact of single-particle degrees of freedom and Coulomb interaction on the formation/suppression of the bubble structures in hyperheavy nuclei.. One can see in Fig. 16 that in a given nucleus the proton densities closely follow the radial profiles of the neutron densities but with somewhat reduced absolute magnitudes. This is due to the fact that Coulomb interaction (by means of electrostatic repulsion) somewhat increases the radius of the proton density as compared with the neutron one. This corresponds to transfer of protons from sub-surface region into surface one.
The resulting depletion factors are shown in Table 4. One can see that on average they are larger in the proton subsystem as compared with the neutron one by only approximately 20%. This suggests that the Coulomb interaction plays only a secondary role in the formation of the depletions in the central density distribution. It is interesting that the depletion factors are similar in the medium mass 100Sn and superheavy 240120 nuclei. This again supports the notion that single-particle degrees of freedom are dominant in creation of the bubbles and Coulomb interaction plays only a secondary role.
IX The factors affecting the availability of the low- states for occupation
The densities of the occupied single-particle states represent the basic building blocks of the total densities. To build a flat density distribution one should have a balanced combination of the occupied states which build the density in the center of the nuclei and in their middle and surface parts. However, the question of whether such a balanced combination of single-particle states is available for occupation in super- and hyperheavy nuclei has not even been raised so far in the literature.
| 0 | 1 | 2 | 3 | 4 | 5 | 6 | 7 | 8 | 9 | 10 | |
| 0 | 2/2/2 | 2/2/2 | 2/2/2 | 2/0/2 | 2/0/2 | 2/0/0 | |||||
| 1 | 6/6/6 | 6/6/6 | 6/6/6 | 6/0/6 | 6/0/0 | ||||||
| 2 | 10/10/10 | 10/10/10 | 10/0/10 | 10/0/10 | 10/0/0 | ||||||
| 3 | 14/14/14 | 14/14/14 | 14/0/14 | 14/0/0 | |||||||
| 4 | 18/18/18 | 18/18/18 | 18/0/18 | 18/0/0 | |||||||
| 5 | 22/22/22 | 22/0/22 | 22/0/0 | ||||||||
| 6 | 26/26/26 | 26/0/26 | 26/0/0 | ||||||||
| 7 | 30/30/30 | 30/0/16 | |||||||||
| 8 | 34/0/34 | 34/0/0 | |||||||||
| 9 | 38/0/38 | ||||||||||
| 10 | 42/0/22 | ||||||||||
| Total | 2/2/2 | 6/6/6 | 12/12/12 | 20/20/20 | 30/30/30/ | 42/42/42 | 56/44/56 | 72/30/72 | 90/0/90 | 110/0/54 | 132/0/22 |
A specific feature of a realistic nuclear potential is the fact that within a shell with a given principal quantum number the states with highest possible orbital angular momentum are the lowest in energy while those with lowest (such as the states in even- shells and the states in odd- shells) are typically located at the highest or near highest energies in the shell (see, for example, Fig. 6.3 in Ref. Nilsson and Ragnarsson ). Thus, with the filling of a specific shell the density is first built at the surface, then in the middle part of the nucleus and only then in the central region and at .
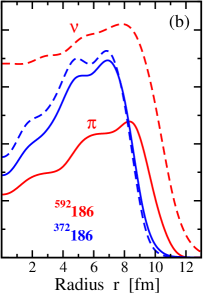
The detailed analysis of the occupation of different groups of the states in the 592186 nucleus reveals that only high- subshells are occupied in the high- shells (see Table 5). Let us consider proton subsystem. All states are occupied in it (see Table 5). However, only and states are occupied in the shell and only states in the shell444Similar pattern of the occupation is seen in the neutron subsystem in which the last fully occupied shell has . Only and subshells are occupied in the shell and only subshell in the shell (see Table 5). (see Table 5). This imbalance between the occupation of the high- and low- subshells is definitely responsible for a preferential buildup of the density in the surface region and as a consequence of the formation of pronounced bubble in this nucleus [see Fig. 18(b)]. This feature becomes even more pronounced for symmetric 372186 nucleus which has the same nucleonic configurations in proton and neutron subsystems [see Fig. 18(b)].
Let us consider how the neutron system of the 592186 nucleus is built from the one in the 372186 nucleus. The former nucleus has 220 extra neutrons which according to the Table 5 are placed into the states (4 neutrons), states (6 neutrons), states (20 neutrons) and the rest into higher states. The presence of these low- states allows to increase the density in the central region and to build significantly flatter neutron density distribution (compare dashed red curves for the 372186 and 592186 nuclei in Fig. 18(b)]). Detailed analysis reveals that similar features are also active in the isotopes (see Fig. 18(a)]).
These two examples clearly indicate that although the effects of the Coulomb interaction are increased in hyperheavy nuclei as compared with lighter ones they alone cannot explain the density profiles seen in Fig. 18. It turns out that the unavailability of the low- states for occupation plays an extremely important role in the formation of the bubble structures in such nuclei.
It is important to evaluate which factors affect the availability of the low- single-particle states for occupation. Since earlier studies it became clear that the bubble can have a profound impact on relative energies of the low- and high- states. For example, it was shown in Ref. Wong (1973) (see discussion of Figs. 30 and 31 in this paper) within schematic shell model approach that low- (high-) states rise in energy (go down in energy) with increasing inner bubble radius . However, this approach is unrealistic since it assumes zero density inside the bubble for . Such a scenario is not realized in the nuclei under study and thus the effect of the bubble is substantially overestimated in Ref. Wong (1973). Similar effect (see Fig. 8 in Ref. Dietrich and Pomorski (1997)) is seen also in the calculations of Ref. Dietrich and Pomorski (1997) in a phenomenological shell approach which allows partial filling of the hole. Non-relativistic Hartree-Fock calculations of the 200Hg nucleus show that for realistic shapes of the bubble the effect is significantly smaller: only the states rise in energy by a few MeV with increasing of the bubble size while the energies of other states remains almost constant (see Fig. 4 in Ref. Campi and D.W.L.Sprung (1973)). The Hartree-Fock-Bogoliubov calculations with the D1S force also show that the energies of low- states (high-) states rapidly rise (gradually decrease) in energy with the increase of the size of the bubble (see Figs. 18 and 19 in Ref. Dechargé et al. (2003)).
All these results suggest that in some situations the presence of the bubble in the density can lead to unavailability of the low- states for occupation at given particle number as compared with the case of flat density distribution in the subsurface region of nucleus. One should keep in mind that constraining bubble potential is usually added to hamiltonian in order to evaluate the evolution of single-particle levels with bubble size/shape by minimization of (see, for example, Refs. Campi and D.W.L.Sprung (1973); Dechargé et al. (2003)). Here is bubble parameter. Unfortunately, the same shape of the bubble is assumed for proton and neutron subsystems in the calculations of Refs. Wong (1973); Campi and D.W.L.Sprung (1973); Dietrich and Pomorski (1997); Dechargé et al. (2003) and this contradicts to calculated total densities seen in Figs. 1, 2 and 18. Note that the bubbles are different in proton and neutron subsystems even in the nuclei (see Fig. 16). In addition, the results of the calculations depend on the assumption about the form on .
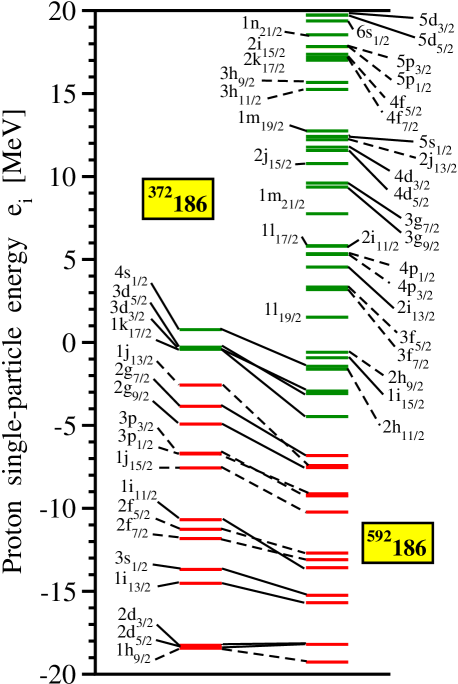
Thus, the results of the calculations discussed above should be taken with some grain of salt and alternative methods of the analysis of the impact of the bubble on the single-particle structure should be considered. The comparison of the single-particle spectra in the pair of the nuclei with and without bubble structures provide such an alternative. The best example of such a comparison is provided by the pair of the 292120 and 310126 nuclei (see Fig. 19) since these two nuclei have very similar rms radii of proton and neutron matter distributions (see Table 1).
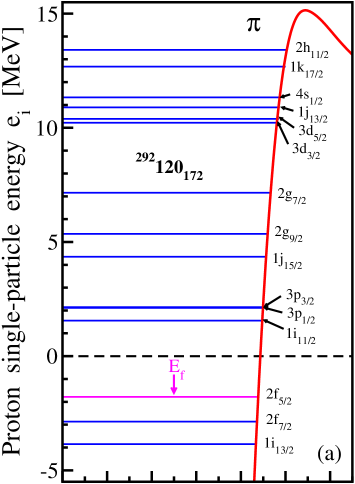
The sequence of the proton states from the vicinity of the Fermi level up to the top of the Coulomb potential in the flat density nucleus 310126 is , , , , , , , , , , , , , and (see Fig. 19(b)). Almost the same sequence with a pair of exceptions discussed below are seen in the proton subsystem of the bubble nucleus 292120 (see Fig. 19(a)). The energies of the proton states are typically located within 1 MeV in both nuclei. So the bubble does not produce a significant impact on their energies. On the contrary, it has a more pronounced impact on the energies of the low- and states: it moves them from below their high- neighbours ( and , respectively) in flat density 310126 nucleus to above them in bubble nucleus 292120 [compare Figs. 19(a) and (b)]. It is interesting that the effect of the bubble is less pronounced in the neutron subsystem: the sequence of the states is the same in both nuclei [compare Figs. 19(c) and (d)]. This is due to the fact that wine bottle potential is less pronounced in the neutron subsystem of the 292120 nucleus than in the proton one [compare Figs. 5(a) and (c)]. In contrast, the bubble is more pronounced in neutron densities (see Fig. 2). Thus, one can conclude that these are the modifications in the potentials (and not in densities) which govern the behavior of the single-particle states.
Although the presence of the bubble somewhat increases the energies of the and states in the proton subsystem and affects the availability of these states for occupation as a function of proton number, this effect in superheavy nuclei is not that drastic. It will only shift in proton number the position in the plane at which bubble structures are either enhanced or suppressed.
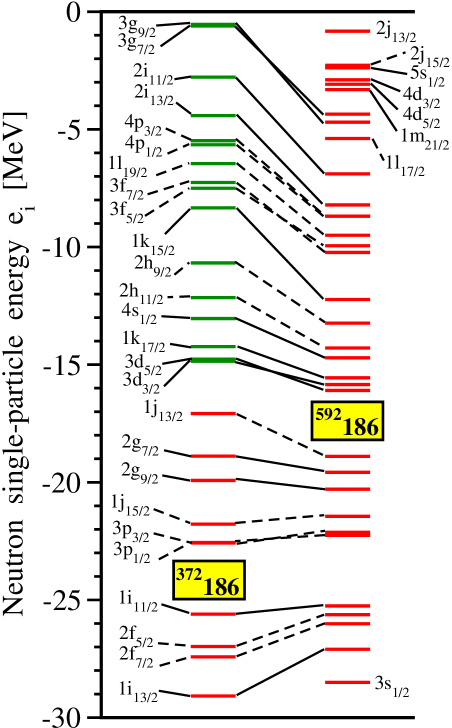
Such kind of comparison as the one discussed above for the 292120/310126 pair of superheavy nuclei is not feasible for hyperheavy nuclei. This is because it is impossible to find a pair of hyperheavy nuclei with and without bubble structures located close enough in nuclear chart so that their sizes are comparable. However, it is still interesting to see how the formation or suppression of the bubble structures affects the single-particle structure. For that we compare single-particle structures of the 372186 and 592186 nuclei. Both nuclei have the same proton configuration. However, the latter nucleus is created from the former one by the addition of the 220 neutrons including four neutrons, six neutrons and twenty neutrons (compare Figs. 14(i) and (l) and see Fig. 20) which leads to a substantial/some suppression of the bubble structure in neutron/proton subsystems (see Fig. 18(b) and compare Tables 4 and 3).
Neutron single-particle energies of these two nuclei are compared in Fig. 20. The sequence of the states is basically the same in both nuclei with the exception of the fact that the order of the states is inverted in the spin-orbit doublets built on the low- orbitals. The neutron spectra are more compressed in the 592186 nucleus as compared with the 372186 one: this is due to larger radii of the neutron density and potential in the former nucleus. In the proton subsystem, there are some changes in the sequence of the single-particle states in two nuclei under study. It is caused by a substantial reduction of the spin-orbit splitting of the high- orbitals (such as and or and , see Fig. 21) on transition from to isotope. Similar effect is also seen in the neutron subsystem but it does not affect the sequence of the states in two nuclei under study (see Fig. 20).
These figures also illustrate the relative rarity of the states in hyperheavy nuclei. For example, the neutron , and states in the 592186 nucleus are located at the energies MeV, MeV and MeV, respectively (see the right column of Fig. 20). Thus, starting from the system with occupied state one should add 108 neutrons to occupy the state and starting from the system with occupied state one should add 142 neutrons to occupy the state. This rough estimate is obtained under the assumption that the occupation of the states does not change the sequence of the states shown in the right column of Fig. 20. Similar estimates could be obtained from the analysis of the proton single-particle states shown in the right column of Fig. 21.
This analysis suggests that similar to superheavy nuclei, the availability (as a function of particle number) of the low- (in particular, the states) states for occupation is not that drastically affected by the transition from flat to bubble density distributions in hyperheavy 592186 and 372186 nuclei. It will only somewhat shift in proton and neutron numbers the position in the plane at which bubble structures are either enhanced or suppressed.
It is well known that the spin-orbit interaction is modified in bubble nuclei (see Refs. Davies et al. (1973); Dietrich and Pomorski (1997, 1998); Dechargé et al. (2003); Karakatsanis et al. (2017)). The spin-orbit potential in the CDFT is given by Vretenar et al. (2005)
| (13) |
where is the mass of nucleon and is its effective mass. This potential in the case of spherical symmetry produces a spin-orbit term of the following form Vretenar et al. (2005)
| (14) |
As a consequence, the spin-orbit splitting of the states in the spin-orbit doublet with orbital angular momentum depends on the derivative of the difference of vector and scalar potentials . These differences for the nuclei under study are shown in Fig. 22. They range from 1000 MeV in the center of the 36S nucleus to MeV in the center of the 592186 nucleus. However, for most of the nuclei the values are in the vicinity of MeV in the subsurface.
In the nuclei with flat density distributions such as 208Pb and 310126, the potential is almost flat in the subsurface region. Thus, this part of the nucleus contributes only marginally to the spin-orbit splittings which are almost entirely defined by the decrease of the potential in the surface region. In contrast, in the bubble nuclei the potential increases with increasing in the subsurface region. Thus, this region contributes to the spin-orbit splittings but with the sign opposite to the one produced in the surface region where the potential decreases with increasing . This mechanism is responsible for the modifications of the spin-orbit splittings such as the reduction and/or inversion of spin-orbit splittings of the low- spin-orbit doublets in the bubble nuclei discussed above.
X Potential impact of deformation on the balance of the single-particle and Coulomb interaction contributions to the bubble structures
It is an interesting question on how the balance of the contributions of the single-particle degrees of freedom and Coulomb interaction to the formation of bubble structures changes on the transition from spherical to deformed nuclei.
The emergence of the deformation has two important consequences for the single-particle structure. First, the deformation leads to a more even distribution of the deformed single-particle states emerging from the high- and low- spherical subshells as compared with the one of the single-particle states at spherical shape (see, for example, the Nilsson diagrams in Figs. 3 and 4 of Ref. Chasman et al. (1977) and in Figs. 1-3 of Ref. Dobaczewski et al. (2015)). Second, the wave functions of deformed single-particle states contain the contributions from different spherical -subshells and the mixture of such contributions increases with increasing deformation. Both these factors effectively reduce the contribution of the single-particle states into the formation of the bubble structures. Thus, in a given nucleus the density profile of a deformed solution is flatter than that of a spherical one (see Fig. 5 in Ref. Afanasjev and Frauendorf (2005) and Fig. 10 in Ref. Pei et al. (2005)).
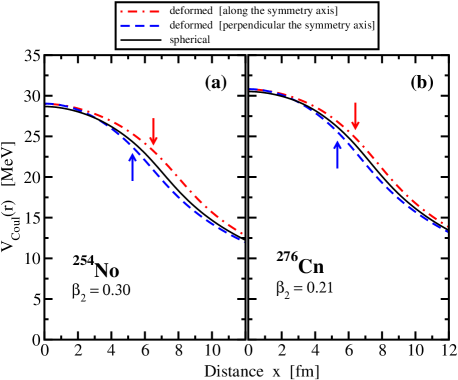
In contrast, the transition from spherical to deformed shapes has a relatively small impact on the Coulomb potential. This is illustrated here by the examples of the 254No and 276Cn nuclei the bubble structures in the proton and neutron densities of which have been studied earlier (see discussion of Fig. 5 in Ref. Afanasjev and Frauendorf (2005)). The Coulomb potential in axially deformed nuclei depends on and . Here is the distance from the center of the nucleus along the symmetry axis and is the distance in radial direction. For simplicity, the Coulomb potential in these deformed nuclei is considered as a function of the distances along () and perpendicular () the symmetry axis (see Fig. 23). For comparison, the Coulomb potential of spherical solution is also presented in this figure. One can see that and the splitting between these two branches increases with deformation but it is rather modest. Note that the average of these two branches is very close to .
As discussed in Sec. III, the impact of the Coulomb potential on the formation of wine bottle potential and bubble structures is defined by the difference , where is the coordinate in a given direction at which the density is maximal in near surface region (the point at which the surface region starts). Red and blue arrows in Fig. 23 indicate the distances from the center of the nucleus in the direction along and perpendicular the symmetry axis, respectively. of the spherical solution is located approximately at the middle point between these two arrows. There are some differences in the values of and of deformed and spherical solutions. Despite that the impact of the Coulomb interaction on the formation of the bubble structure in deformed nuclei integrated over the volume of the nucleus is expected to be close to that of spherical solution. This is because two factors, namely, (i) for fm and (ii) for .
These observations have two consequences. First, with increasing deformation the relative impact of the Coulomb interaction on the formation of the bubble structures in deformed nuclei increases since the one due single-particle degrees of freedom decreases. Second, the bubble structures in superheavy deformed nuclei are relatively small (see Fig. 5 in Ref. Afanasjev and Frauendorf (2005), Figs. 6, 7 and 10 in Ref. Pei et al. (2005) and Fig. 2 in Ref. Schuetrumpf et al. (2017)): this is especially true for the nuclei located far away from double shell closures. In many cases, they are smaller that those in deformed light nuclei (see Ref. Shukla and Åberg (2014)). Let us ignore the impact of the single-particle degrees of freedom and attribute the effect of the bubble creation entirely to the Coulomb interaction. Then the fact that the bubble structures are either absent or relatively small in deformed superheavy nuclei allows to conclude that the effect of the Coulomb interaction on the formation of the bubble structures in such nuclei is rather modest. This conclusion is expected to be valid also for spherical superheavy nuclei since the impact of the Coulomb interaction on the formation of the bubble structures only weakly depend on the deformation.
XI Conclusions
The detailed investigation of microscopic mechanisms leading to the formation of bubble structures in the nuclei with main emphasis on the role of the single-particle degrees of freedom and Coulomb interaction has been performed in the framework of covariant density functional theory. Many of existing publications such as Refs. Dechargé et al. (2003); Schuetrumpf et al. (2017) emphasize dominant role of the Coulomb interaction in the creation of the bubble structures in super- and hyperheavy nuclei. However, our detailed analysis paints much more complicated picture in which single-particle degrees of freedom play a significant role which overshadows the role of the Coulomb interaction in superheavy nuclei. The main results can be summarized as follows:
-
•
There is a central classically forbidden region at the bottom of the wine bottle potentials the size of which depends on the nucleus. The presence of this region leads to a substantial reduction of the densities of the states and somewhat smaller reduction in the densities of the states for radial coordinate and near it as compared with the case of flat bottom potential. The densities of the and states located at the bottom of the wine bottle potential can also be pushed away from . This represents a new never discussed before microscopic mechanism of the creation of bubble structures in nuclei. It is responsible for a significant reduction of the nucleonic densities at in hyperheavy nuclei.
-
•
Microscopic mechanisms of the formation of the wine bottle nucleonic potentials have been investigated in detail. It was shown that the formation of the bubble structure in the densities of the subsystem A (proton or neutron) of the nucleus leads to a significant enhancement of wine bottle features of the potential in other subsystem B (neutron or proton). The microscopic origin of this feature lies in the isovector character of nuclear interaction which tries to keep proton and neutron densities alike. The formation of bubble structure in the densities of the subsystem A with increasing particle number proceeds by the occupation of the states in the vicinity of the Fermi level and it has only minor impact on radial profile of the bottom of the nucleonic potential in this subsystem. For a fixed number of the particles in the subsystem B, the formation of the bubble structure in its densities, driven by the formation of the bubble structures in the subsystem A, can be achieved only by a significant enhancement of wine bottle features of its potential.
-
•
The bubbles in nucleonic total densities also depend on the availability of low- single-particle states for occupation since their densities represent the basic building blocks of total densities. However, such states (in particular, the states) appear less frequently as compared with medium and high states with increasing principal quantum number . This is a typical feature of realistic nucleonic potential: within a shell with a given principal quantum number the states with highest possible orbital angular momentum are the lowest in energy while those with lowest (such as the states in even- shells and the states in odd- shells) are typically located at the highest or near highest energies in the shell. Thus, with filling of a specific shell the density is first built at the surface, then in the middle part of the nucleus and only then in the central region and at . The balanced distribution of the occupation of low, medium and high- states is required for building flat density distribution. However, this balance is substantially broken in hyperheavy nuclei and the density is built predominantly in near surface region by the high- states.
-
•
Existing bubble indicators [see Eqs. (11) and (12)] are strongly affected by single-particle properties. In particular, the central density is defined almost entirely by occupied states. Thus, they cannot be reliable measures of bulk properties (such as a Coulomb interaction). This is especially true for the nuclei characterized by wine bottle nucleonic potentials since the densities of the lowest states at are strongly affected by classically forbidden regions of the potentials.
-
•
An additivity rule for the densities has been proposed for the first time. It was verified on the pairs of the 34Si/36S and 292120/310126 nuclei: the first nucleus in the pair has bubble structure while second one is characterized by flat density distributions. The additivity rule works with comparable accuracy in both pairs of the nuclei. This strongly suggests the same mechanism of the formation of the central depression in lighter nucleus of the pair which is related to emptying of specific low- singe-particle orbitals.
-
•
The global evolution of the densities is governed also by saturation mechanisms. The analysis of the densities shown in the present paper and in Refs. Afanasjev and Frauendorf (2005); Saxena et al. (2019) clearly reveals that average neutron densities in subsurface region of the nuclei try to stabilize near saturation density fm-3. In contrast, average proton densities in subsurface region can be significantly below this value especially in neutron-rich nuclei. This strongly suggests that Coulomb interaction effects are secondary to nuclear interaction ones in absolute majority of the nuclei.
-
•
Self-consistency effects are characterized by a very complex nature of the impact of the nuclear densities on the nucleonic potentials. For example, the removal of two protons from 36S leads to a creation of bubble structure in proton densities of 34Si. However, it has a substantially larger impact on neutron potential of 34Si (which becomes wine bottle one) than on the proton one (which becomes flat bottom one). Similar effects have been seen before in Ref. Afanasjev and Frauendorf (2005): particle-hole excitations in neutron subsystem led to substantial changes in neutron densities but this process results in larger changes in the proton potential as compared with the neutron one.
One can see in some publications the statements that the Coulomb interaction is at the origin of the systematic deviations from a uniform charge distributions since the system can lower its (positive) electrostatic energy by forming bubble structures (see, for example, Refs. Dechargé et al. (2003); Schuetrumpf et al. (2017)). In extreme, the lowest Coulomb energy would be reached if all the protons were located in a thin layer at the nuclear surface. However, in nuclei this trend is counteracted by the quantum nature of the single-particle states: only specific single-particle states with specific density profiles can be occupied with increasing proton and neutron numbers. In addition, there is a nuclear interaction between protons and neutrons which further complicates the situation. The pattern of the saturation of neutron density at fm-3 counteracts the frequent argument that the neutron density follows to a certain extent the trend produced by the protons as a result of the strongly attractive neutron–proton interaction. As a consequence, the formation of bubble structures depends on the competition of several factors and there is no simple indicator which would clearly allow to separate nuclear and Coulomb interaction effects on the central depression in density distributions. However, our detailed analysis of different aspects of bubble physics strongly suggests that the formation of bubble structures in superheavy nuclei is dominated by single-particle effects. This is in contrast to the conclusions of Ref. Schuetrumpf et al. (2017) that the central depression in superheavy nuclei is firmly driven by the electrostatic repulsion. The role of the Coulomb interaction increases in hyperheavy nuclei but even for such systems we do not find strong arguments that the formation of bubble structures is dominated by the Coulomb interaction.
XII Acknowledgement
This material is based upon work supported by the U.S. Department of Energy, Office of Science, Office of Nuclear Physics under Award No. DE-SC0013037.
References
- (1) S. G. Nilsson and I. Ragnarsson, Shapes and shells in nuclear structure, (Cambridge University Press, 1995) .
- Wilson (1946) H. Wilson, Phys. Rev. 69, 538 (1946).
- Siemens and Bethe (1967) P. J. Siemens and H. A. Bethe, Phys. Rev. Lett. 18, 704 (1967).
- Davies et al. (1972) K. Davies, C.Y.Wong, and S.J.Krieger, Phys. Lett. B 41, 455 (1972).
- Campi and D.W.L.Sprung (1973) X. Campi and D.W.L.Sprung, Phys. Lett. B 46, 291 (1973).
- Davies et al. (1973) K. Davies, S.J.Krieger, and C.Y.Wong, Nucl. Phys. A 216, 250 (1973).
- Wong (1973) C. Y. Wong, Annals of Physics 77, 279 (1973).
- Dietrich and Pomorski (1997) K. Dietrich and K. Pomorski, Nucl. Phys. A 627, 175 (1997).
- Dietrich and Pomorski (1998) K. Dietrich and K. Pomorski, Phys. Rev. Lett. 80, 37 (1998).
- Grasso et al. (2009) M. Grasso, L. Gaudefroy, E. Khan, T. Nikšić, J. Piekarewicz, O. Sorlin, N. V. Giai, and D. Vretenar, Phys. Rev. C 79, 034318 (2009).
- Karakatsanis et al. (2017) K. Karakatsanis, G. A. Lalazissis, P. Ring, and E. Litvinova, Phys. Rev. C 95, 034318 (2017).
- Yao et al. (2013) J. Yao, H. Mei, and Z. Li, Phys. Lett. B 723, 459 (2013).
- Duguet et al. (2017) T. Duguet, V. Somà, S. Lecluse, C. Barbieri, and P. Navrátil, Phys. Rev. C 95, 034319 (2017).
- Yao et al. (2012) J.-M. Yao, S. Baroni, M. Bender, and P.-H. Heenen, Phys. Rev. C 86, 014310 (2012).
- Wu et al. (2014) X. Y. Wu, J. M. Yao, and Z. P. Li, Phys. Rev. C 89, 017304 (2014).
- Shukla and Åberg (2014) A. Shukla and S. Åberg, Phys. Rev. C 89, 014329 (2014).
- Khan et al. (2008) E. Khan, M. Grasso, J. Margueron, and N. V. Giai, Nucl. Phys. A 800, 37 (2008).
- Gasques et al. (2007) L. R. Gasques, A. V. Afanasjev, M. Beard, J. Lubian, T. Neff, M. Wiescher, and D. G. Yakovlev, Phys. Rev. C 76, 045802 (2007).
- Nakada et al. (2013) H. Nakada, K. Sugiura, and J. Margueron, Phys. Rev. C 87, 067305 (2013).
- Bender et al. (1999) M. Bender, K. Rutz, P.-G. Reinhard, J. A. Maruhn, and W. Greiner, Phys. Rev. C 60, 034304 (1999).
- Dechargé et al. (2003) J. Dechargé, J.-F. Berger, M. Girod, and K. Dietrich, Nucl. Phys. A 716, 55 (2003).
- Afanasjev and Frauendorf (2005) A. V. Afanasjev and S. Frauendorf, Phys. Rev. C 71, 024308 (2005).
- Schuetrumpf et al. (2017) B. Schuetrumpf, W. Nazarewicz, and P.-G. Reinhard, Phys. Rev. C 96, 024306 (2017).
- Saxena et al. (2019) G. Saxena, M. Kumawat, M. Kaushik, S. Jain, and M. Aggarwal, Phys. Lett. B 788, 1 (2019).
- Dechargé et al. (1999) J. Dechargé, J.-F. Berger, K. Dietrich, and M. Weiss, Phys. Lett. B 451, 275 (1999).
- Agbemava et al. (2019) S. E. Agbemava, A. V. Afanasjev, A. Taninah, and A. Gyawali, Phys. Rev. C 99, 034316 (2019).
- Agbemava and Afanasjev (2021) S. E. Agbemava and A. V. Afanasjev, Phys. Rev. C 103, 034323 (2021).
- Afanasjev et al. (2018) A. V. Afanasjev, S. E. Agbemava, and A. Gyawali, Phys. Lett. B 782, 533 (2018).
- Wu and Xiang (2018) X. Y. Wu and J. Xiang, Phys. Rev. C 98, 054319 (2018).
- Pei et al. (2005) J. C. Pei, F. R. Xu, and P. D. Stevenson, Phys. Rev. C 71, 034302 (2005).
- Mutschler et al. (2017) A. Mutschler, A. Lemasson, O. Sorlin, D. Bazin, C. Borcea, R. Borcea, Z. Dombrádi, J.-P. Ebran, A. Gade, H. Iwasaki, E. Khan, A. Lepailleur, F. Recchia, T. Roger, F. Rotaru, D. Sohler, M. Stanoiu, S. Stroberg, J. A. Tostevin, M. Vandebrouck, D. Weisshaar, and K. Wimmer, Nature Phys. 13, 152 (2017).
- Vretenar et al. (2005) D. Vretenar, A. V. Afanasjev, G. A. Lalazissis, and P. Ring, Phys. Rep. 409, 101 (2005).
- Agbemava et al. (2014) S. E. Agbemava, A. V. Afanasjev, D. Ray, and P. Ring, Phys. Rev. C 89, 054320 (2014).
- Teeti and Afanasjev (2021) S. Teeti and A. V. Afanasjev, Phys. Rev. C 103, 034310 (2021).
- Lalazissis et al. (2009) G. A. Lalazissis, S. Karatzikos, R. Fossion, D. P. Arteaga, A. V. Afanasjev, and P. Ring, Phys. Lett. B671, 36 (2009).
- Perera et al. (2021) U. C. Perera, A. V. Afanasjev, and P. Ring, Phys. Rev. C 104, 064313 (2021).
- (37) Mass Explorer: DFT mass tables at http://massexplorer.frib.msu.edu/content/DFTMassTables.html .
- Agbemava et al. (2015) S. E. Agbemava, A. V. Afanasjev, T. Nakatsukasa, and P. Ring, Phys. Rev. C 92, 054310 (2015).
- Satuła et al. (1996) W. Satuła, J. Dobaczewski, J. Dudek, and W. Nazarewicz, Phys. Rev. Lett. 77, 5182 (1996).
- Afanasjev (2022) A. V. Afanasjev, in ”Handbook on Nuclear Physics” Springer, in press, see also nuclear theory arkhive arXiv:2203.0446 (2022).
- Ragnarsson (1993) I. Ragnarsson, Nucl. Phys. A 557, c167 (1993).
- Afanasjev et al. (1998) A. V. Afanasjev, G. Lalazissis, and P. Ring, Nucl. Phys. A 634 (1998).
- Matev et al. (2007) M. Matev, A. V. Afanasjev, J. Dobaczewski, G. A. Lalazissis, and W. Nazarewicz, Phys. Rev. C 76, 034304 (2007).
- Reinhard and Flocard (1995) P.-G. Reinhard and H. Flocard, Nucl. Phys. A 584, 467 (1995).
- Goodacre et al. (2021) T. D. Goodacre, A. V. Afanasjev, A. E. Barzakh, B. A. Marsh, S. Sels, P. Ring, H. Nakada, A. N. Andreyev, P. V. Duppen, N. A. Althubiti, B. Andel, D. Atanasov, J. Billowes, K. Blaum, T. E. Cocolios, J. G. Cubiss, G. J. Farooq-Smith, D. V. Fedorov, V. N. Fedosseev, K. T. Flanagan, L. P. Gaffney, L. Ghys, M. Huyse, S. Kreim, D. Lunney, K. M. Lynch, V. Manea, Y. M. Palenzuela, P. L. Molkanov, M. Rosenbusch, R. E. Rossel, S. Rothe, L. Schweikhard, M. D. Seliverstov, P. Spagnoletti, C. V. Beveren, M. Veinhard, E. Verstraelen, A. Welker, K. Wendt, F. Wienholtz, R. N. Wolf, A. Zadvornaya, and K. Zuber, Phys. Rev. Let. 126, 032502 (2021).
- Afanasjev et al. (2021) A. V. Afanasjev, U. C. Perera, and P. Ring, Bulg. J. Phys. 48, 375 (2021).
- Chu et al. (2010) Y. Chu, Z. Ren, Z. Wang, and T. Dong, Phys. Rev. C 82, 024320 (2010).
- Friedrich and Voegler (1983) J. Friedrich and N. Voegler, Nucl. Phys. A 373, 192 (1983).
- Chasman et al. (1977) R. R. Chasman, I. Ahmad, A. M. Friedman, and J. R. Erskine, Rev. Mod. Phys. 49, 833 (1977).
- Dobaczewski et al. (2015) J. Dobaczewski, A. V. Afanasjev, M. Bender, L. M. Robledo, and Y. Shi, Nucl. Phys. A 944, 388 (2015).