Testing the r2SCAN density functional for the thermodynamic stability of solids with and without a van der Waals correction
Abstract
A central aim of materials discovery is an accurate and numerically reliable description of thermodynamic properties, such as the enthalpies of formation and decomposition. The r2SCAN revision of the strongly constrained and appropriately normed (SCAN) meta-generalized gradient approximation (meta-GGA) balances numerical stability with high general accuracy. To assess the r2SCAN description of solid-state thermodynamics, we evaluate the formation and decomposition enthalpies, equilibrium volumes, and fundamental bandgaps of more than 1,000 solids using r2SCAN, SCAN, and PBE, as well as two dispersion-corrected variants, SCAN+rVV10 and r2SCAN+rVV10. We show that r2SCAN achieves accuracy comparable to SCAN and often improves upon SCAN’s already excellent accuracy. Whereas SCAN+rVV10 is often observed to worsen the formation enthalpies of SCAN, and makes no substantial correction to SCAN’s cell volume predictions, r2SCAN+rVV10 predicts marginally less-accurate formation enthalpies than r2SCAN, and slightly more-accurate cell volumes than r2SCAN. The average absolute errors in predicted formation enthalpies are found to decrease by a factor of 1.5 to 2.5 from the GGA level to the meta-GGA level. Smaller decreases in error are observed for decomposition enthalpies. For formation enthalpies r2SCAN improves over SCAN for intermetallic systems. For a few classes of systems – transition metals, intermetallics, weakly-bound solids, and enthalpies of decomposition into compounds – GGAs are comparable to meta-GGAs. In total, r2SCAN and r2SCAN+rVV10 can be recommended as stable, general-purpose meta-GGAs for materials discovery.
I Introduction
The backbone of modern ab initio simulations of solids is practical Kohn-Sham density functional theory (DFT) Kohn and Sham (1965). Efficient, first principles approximations to the generally-unknown exchange-correlation energy have made rapid advances in solid state materials physics possible. Within the Perdew-Schmidt Perdew and Schmidt (2001) hierarchy of density functional approximations (DFAs), the generalized gradient approximation (GGA), which depends upon the spin-densities and their gradients, and the meta-GGA, which further depends on the local kinetic energy spin-densities, stand as the most appealing semi-local DFAs. GGAs, like the Perdew-Burke-Ernzerhof (PBE) GGA Perdew et al. (1996), offer reasonable general accuracy at low computational expense.
Meta-GGAs offer greater general accuracy than GGAs, but can be much more computationally intensive to use. The strongly constrained and appropriately normed (SCAN) meta-GGA Sun et al. (2015) accurately simulates complex materials, such as the “strongly-correlated” cuprates Furness et al. (2018); Zhang et al. (2020a) and transition metal monoxides Zhang et al. (2020b), but suffers well-known numerical instabilities inherent to its construction Bartók and Yates (2019); Furness and Sun (2019). These instabilities are more problematic for small-grid codes used to study atoms, molecules, and clusters, but can also make stable convergence behavior challenging in plane-wave codes used for solids Ning et al. (2022a).
The r2SCAN meta-GGA Furness et al. (2020) was constructed as a numerically-stable, general-purpose revision of SCAN intended to retain much of its accuracy. r2SCAN builds upon the rSCAN meta-GGA of Bartók and Yates Bartók and Yates (2019), but restores important exact constraints to rSCAN, such as the uniform density limit and coordinate scaling properties Furness et al. (2022). Tests of r2SCAN for molecules Furness et al. (2020); Mejía-Rodríguez and Trickey (2020); Mejiá-Rodríguez and Trickey (2020); Ehlert et al. (2021); Grimme et al. (2021) and for solids Furness et al. (2020); Mejía-Rodríguez and Trickey (2020); Kingsbury et al. (2022); Furness et al. (2022); Ning et al. (2022b) have shown that r2SCAN indeed retains or improves upon the high accuracy of SCAN.
To promote further progress towards high-throughput meta-GGA calculations for solids, we compare the formation and decomposition enthalpies, unit cell volumes, and electronic structures of more than 1,000 solid-state materials calculated using r2SCAN, SCAN, and PBE. In addition to SCAN and r2SCAN, we present results for their dispersion-corrected Sabatini et al. (2013) variants: SCAN+rVV10 Peng et al. (2016) and r2SCAN+rVV10 Ning et al. (2022a). The dispersion-corrected r2SCAN+D4 Ehlert et al. (2021) describes molecular thermochemistry with exceptional accuracy, however a broad benchmark of a dispersion-corrected r2SCAN in solids has not previously been attempted. As in Refs. 20 and 10, we use for SCAN+rVV10 and for r2SCAN+rVV10. The -parameter controls the damping of the rVV10 dispersion correction at short-range. A larger produces a stronger cutoff. This is needed as semilocal DFAs include a reasonable description of short-range correlation, and meta-GGAs in particular can include an accurate description of intermediate-ranged dispersion interactions in their exchange parts.
II Computational details
Calculation of the enthalpies of formation are performed for 934 binary compounds and 81 ternary compounds (see Table S1 of the Supplementary Materials for chemical formulas). The structures and reference formation enthalpies for these 1015 compounds are taken from the datasets of Isaacs et al. Isaacs and Wolverton (2018) and Zhang et al. Zhang et al. (2018). Reference structures and enthalpies of decomposition for 987 compounds are taken from the dataset of Bartel et al.Bartel et al. (2019).
All calculations are performed using the Vienna Ab Initio Simulation Package (VASP) Kresse and Hafner (1993, 1994); Kresse and Furthmüller (1996a, b) using the projector augmented wave (PAW) method. A plane wave energy cutoff of 600 eV is used. -centered, uniform Monkhorst-Pack -point meshes with -point density of 700 -points per Å-3 are generated with pymatgen Jain et al. (2011). First-order Methfessel-Paxton smearing Methfessel and Paxton (1989) of width 0.2 eV is employed for structural relaxations, while total energy calculations use the tetrahedron method with Blöchl corrections Blöchl et al. (1994). We compare three semilocal exchange-correlation density functional approximations (DFAs): the PBE GGAPerdew et al. (1996), the SCAN meta-GGA Sun et al. (2015), and the r2SCAN meta-GGA Furness et al. (2020). As no meta-GGA pseudopotentials are available in VASP, we use the “PAW 52” PBE pseudopotentials. In magnetically active systems, the ferromagnetic ordering is considered to be the ground-state. For the systems CrB, CoF2, CNiO3, F2Mn, Fe2O3, Fe3O4, Fe4Ni2O8, and NiSO4 antiferromagnetic orderings are considered. For structure selection, the calculations are converged to eV in the total energy, and 0.01 eV/Å in the atomic forces. For computing formation enthalpies, all calculations are converged to eV in the total energy, and 0.01 eV/Å in the atomic forces. Molecular reference states are used for H2, N2, O2, F2 and Cl2, where the isolated molecule is represented by a dimer in a Å3 box. Experimental standard enthalpies of formation used to determine the error in formation energy are defined at 298 K and 1 atm of pressure Isaacs and Wolverton (2018).
III Results and Discussion
III.1 Formation enthalpy
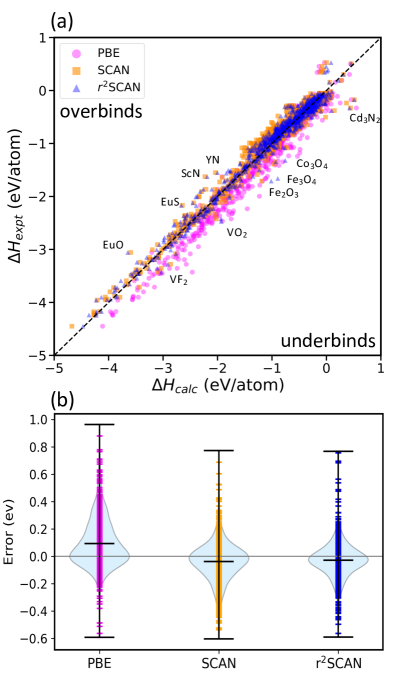
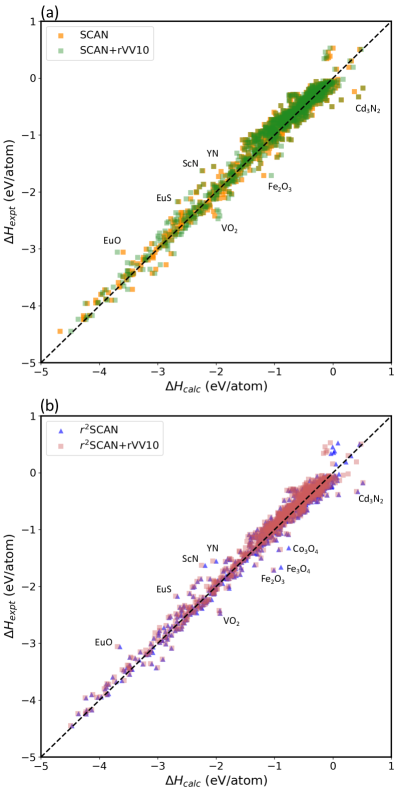
To systematically compare the performance of DFAs on formation enthalpies of solid-state materials, we group databases according to Isaacs et al. Isaacs and Wolverton (2018) and Zhang et al. Zhang et al. (2018). The total set comprises 1015 solids. Figure 1(a), which compares experimental and calculated formation enthalpies, shows that PBE systematically underbinds solids, whereas SCAN and r2SCAN tend to overbind “weakly-bound” solids ( eV/atom). Violin plots of the PBE, SCAN, and r2SCAN error distributions are shown in Fig. 1(b). The PBE error distribution is strongly skewed towards positive errors (predicting too-small absolute formation enthalpies), indicating systematic underbinding. SCAN’s errors are much less systematic, but show a tendency to slightly overbind. The r2SCAN median error lies closest to zero, and the error distribution is more symmetric than SCAN’s.
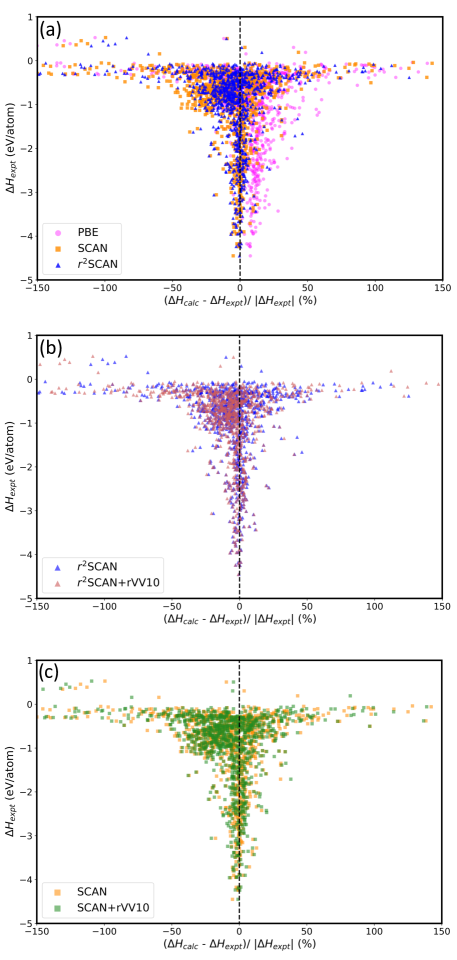
While we have performed calculations using the rVV10 counterparts of SCAN and r2SCAN, they are not presented in Fig. 1 for reasons of clarity. Scatter plots of the errors made by the rVV10-corrected meta-GGAs are given in Fig. S1 of the Supplementary Materials.
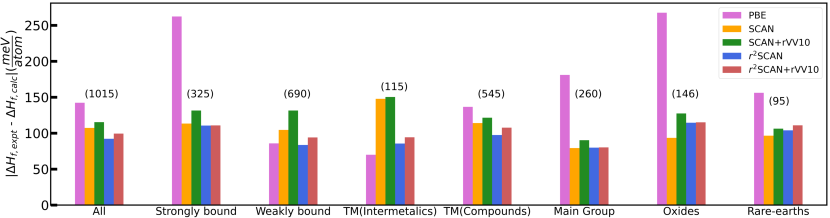
To better gauge the accuracy of predicted formation enthalpies, Fig. 2 presents errors for subsets of the database. “All” is the entire 1015 solid set; “strongly-bound” solids have experimental formation enthalpies eV/atom; “weakly-bound” solids have eV/atom. Transition metal (TM)-containing compounds are grouped into TM(Intermetallics), which are intermetallics composed only of transition metals, and TM(Compounds), which contain other elements. Main group solids contain elements from the main group (groups 1, 2, and 13–18 of the periodic table). Oxides are oxygen-containing solids, and rare-earths contain at least one rare-earth element (lanthanide series, Sc and Y).
We define a few statistical error metrics that will be used throughout: the mean error (ME) or mean deviation (MD)
| (1) |
where is a quantity (energy difference, volume, bandgap, etc.) computed with a DFA, and is a reference value. We assume quantities belong to a set. We use “error” to indicate that a reference value is known with very low uncertainty and high accuracy. We use “deviation” when comparing quantities between different approximate methods. The mean absolute error (MAE) or deviation (MAD) is
| (2) |
When analyzed in conjunction with the MAE/MAD, the ME/MD is useful for determining the degree to which a DFA makes systematic errors. If , a DFA makes wholly systematic errors. If , a DFA makes essentially random errors. The root-mean-squared error (RMSE) or deviation (RMSD)
| (3) |
is a metric comparable to the MAE/MAD. The RMSE/RMSD is simply the square root of the variance. The MAE/MAD is more frequently used than the RMSE/RMSD, however both carry important information.
For the entire set, the 92 meV/atom MAE of r2SCAN is the lowest of all considered DFAs, including r2SCAN+rVV10 (99 meV/atom MAE). SCAN has a modestly higher 107 meV/atom MAE for the entire set. For strongly-bound compounds, r2SCAN, r2SCAN+rVV10, and SCAN have nearly identical 111 meV/atom MAEs. r2SCAN and PBE predict the most accurate formation enthalpies for weakly-bound solids with 84 and 86 meV/atom MAEs, respectively. SCAN and SCAN+rVV10 find larger errors for these solids with 105 and 132 meV/atom MAEs, respectively. Consistent with Refs. 21 and 17, PBE predicts the most accurate formation enthalpies of intermetallics (70 meV/atom MAE), with SCAN and SCAN+rVV10 making substantially larger MAEs, 148 and 150 meV/atom, respectively. r2SCAN and r2SCAN+rVV10 predict intermetallic formation enthalpies with accuracy much closer to PBE: their MAEs are 86 and 94 meV/atom, respectively.
For transition metal-containing compounds, r2SCAN has the lowest MAE at 97 meV/atom, followed by r2SCAN+rVV10, SCAN, SCAN+rVV10 and PBE, with 108, 114, 122, 137 meV/atom MAEs, respectively. For main group compounds, r2SCAN, SCAN, and r2SCAN+rVV10 have nearly identical 80 meV/atom MAEs. SCAN is the most accurate DFA for the oxides (94 meV/atom), with r2SCAN and r2SCAN+rVV10 following closely behind (114 and 115 meV/atom MAEs, respectively). Last, all meta-GGAs are comparably accurate for the rare-earth-containing compounds, with SCAN making the smallest MAE, 97 meV/atom.
SCAN+rVV10 often predicts markedly less accurate formation enthalpies than SCAN, as is the case for the strongly-bound, weakly-bound, and oxide compounds of Fig. 2. The increase in errors made by r2SCAN+rVV10 over r2SCAN is generally less pronounced. SCAN already includes a large fraction of intermediate-range dispersion interactions in its exchange functional, indicated by the large -damping parameter. Thus, SCAN+rVV10 often further overbinds solids that SCAN overbinds. r2SCAN includes a less comprehensive description of intermediate-range dispersion interactions than SCAN (indicated by the smaller value, or less severe damping). Thus, even in cases where r2SCAN overbinds, r2SCAN+rVV10 further overbinds, but to a less pronounced extent.
III.2 Volumes
To assess the accuracy of the predicted crystal structures, we compare the computed relaxed volume per atom to experimental values. Table 1 presents errors in the equilibrium volumes predicted by PBE, SCAN, r2SCAN, and their rVV10 counterparts. While PBE overestimates volumes by 0.77 Å3/atom on average, SCAN underestimates equilibrium volumes by 0.11 Å3/atom on average, and r2SCAN overestimates them by 0.24 Å3/atom. The MAE in equilibrium volumes for r2SCAN and SCAN are 0.59 Å3/atom and 0.58 Å3/atom respectively; thus r2SCAN retains the good general accuracy of SCAN.
The rVV10 van der Waals (vdW) correction does not improve upon the volumes predicted by SCAN. However, r2SCAN+rVV10 improves slightly on r2SCAN with a 0.5 Å3/atom MAE. This is again a reflection of the underlying meta-GGA description of dispersion interactions. rVV10 often produces more meaningful corrections to r2SCAN than to SCAN because SCAN includes a more substantial description of intermediate-range dispersion interactions. Thus rVV10 can often over-correct SCAN.
| DFA | ME | MAE | RMSE | ||
|---|---|---|---|---|---|
| (Å3/atom) | (Å3/atom) | (Å3/atom) | |||
| PBE | 0.77 | 0.98 | 1.80 | ||
| SCAN | -0.11 | 0.58 | 0.96 | ||
| SCAN+rVV10 | -0.32 | 0.59 | 0.95 | ||
| r2SCAN | 0.24 | 0.59 | 1.04 | ||
| r2SCAN+rVV10 | -0.11 | 0.5 | 0.88 |
Notably, r2SCAN and SCAN over- and underestimate the volume of CoI2 by 7% (2.2 Å3/atom and -2.1Å3/atom), respectively; r2SCAN+rVV10 overestimates its volume by only 1.6% (0.5 Å3/atom). The volumes of layered materials tend to be more accurate when a vdW correction is usedNing et al. (2022a); Peng et al. (2016). Thus, using a vdW correction to r2SCAN or SCAN can improve cell volumes without harming the accuracy of predicted formation enthalpies, and can be recommended for general materials discovery.
III.3 Magnetism
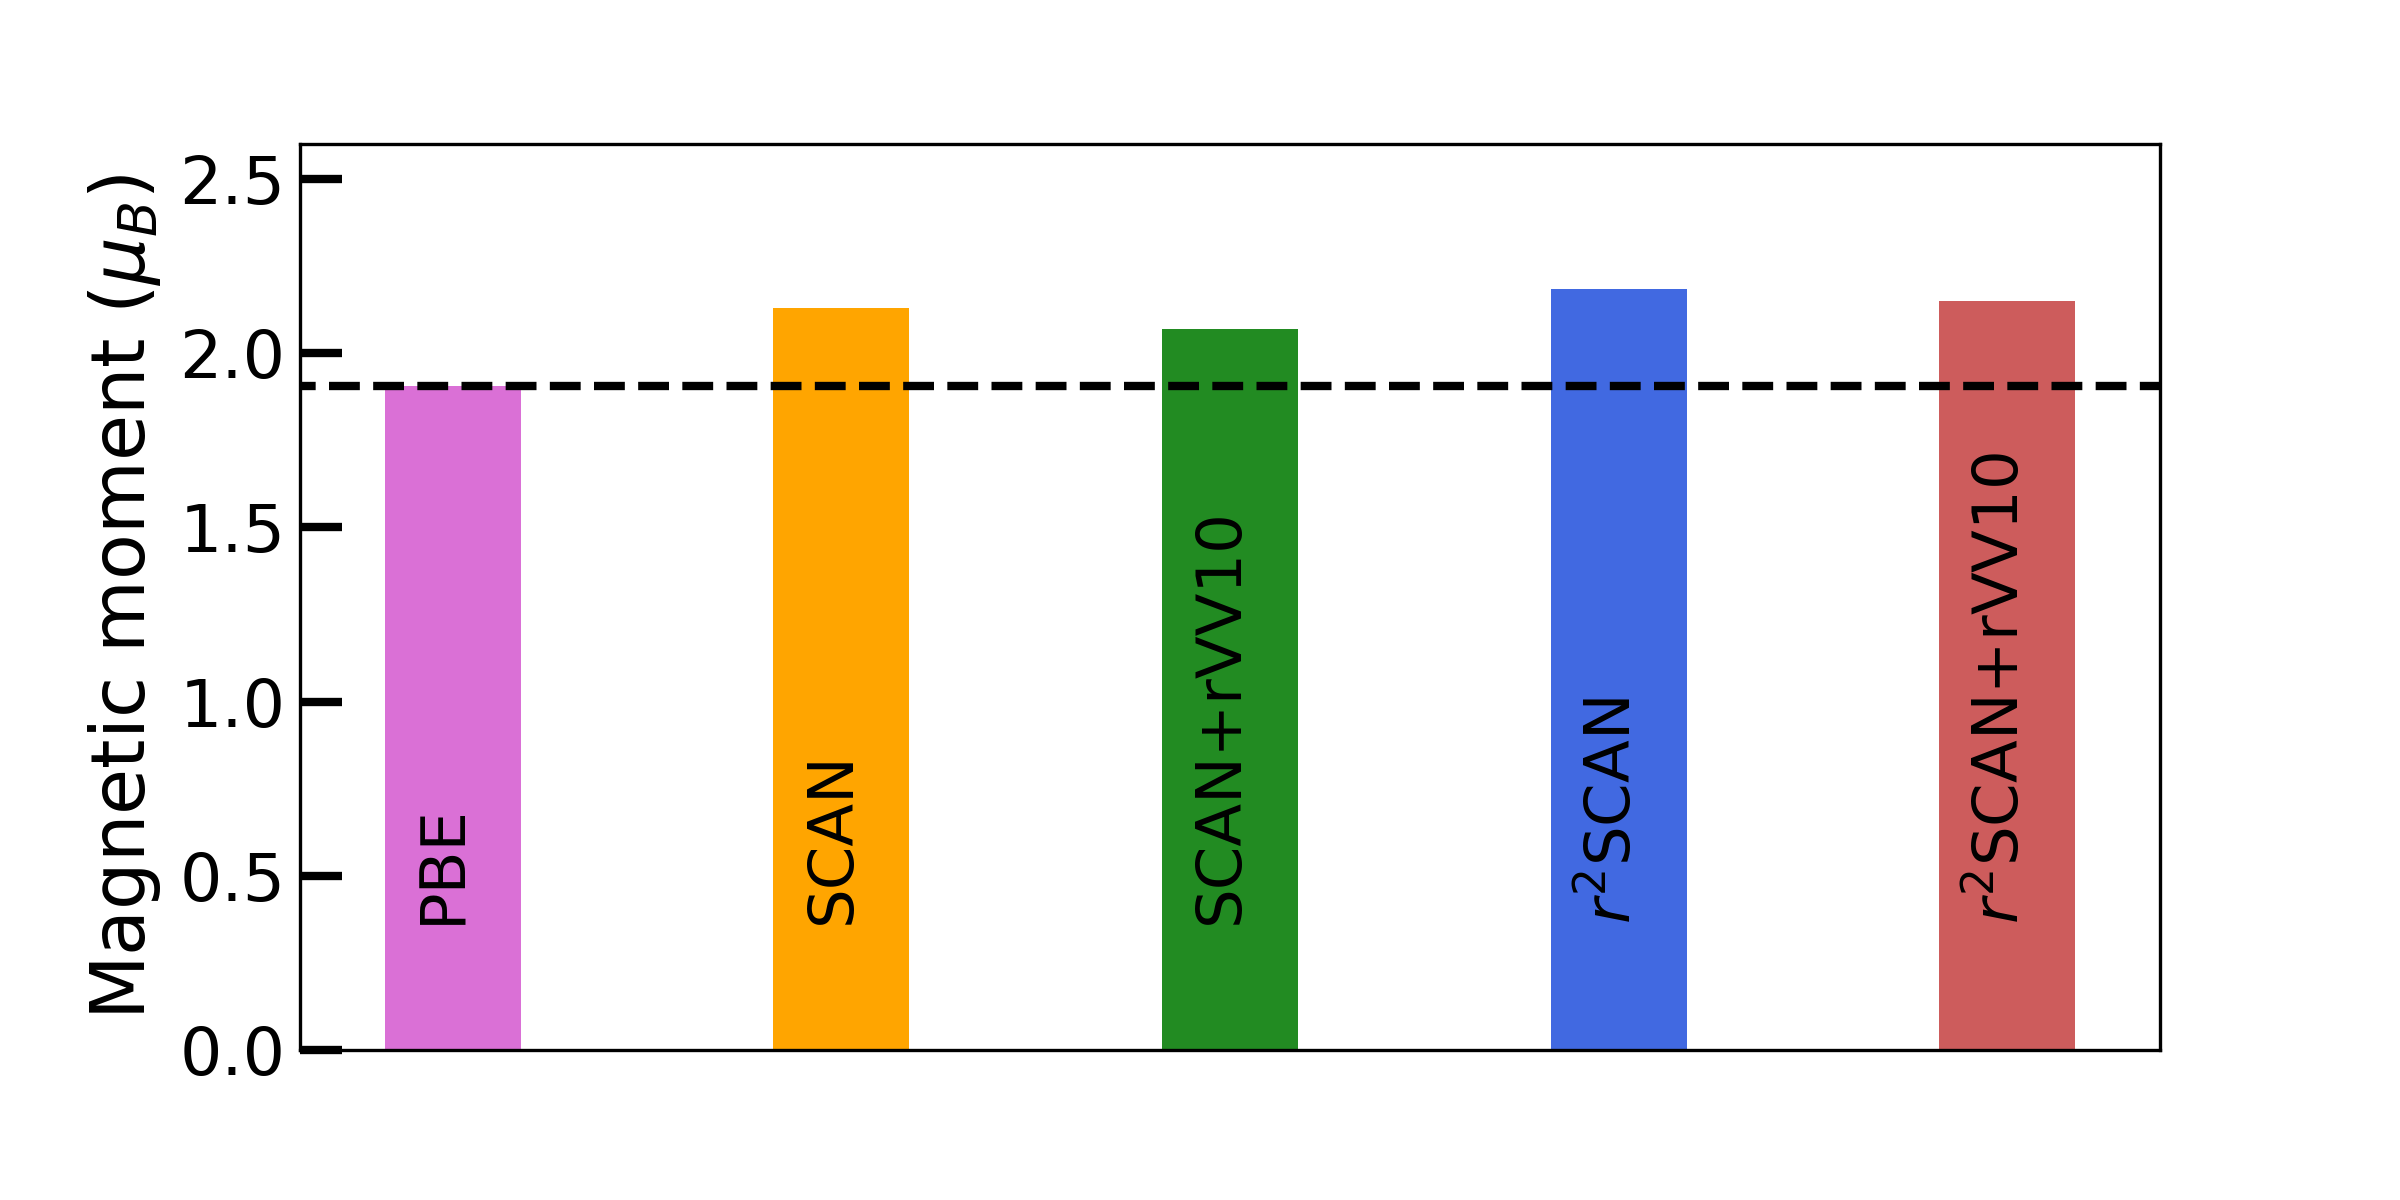
Next, we explore the magnetic properties of the elemental metals Fe, Co, and Ni using PBE, SCAN and r2SCAN. The predicted and experimental saturation magnetizations are shown in Table 2. In all cases, r2SCAN predicts larger magnetic moments than SCAN, which in turn predicts larger magnetic moments than PBE. r2SCAN and SCAN overestimate the magnetization of Fe by 24% and 17% respectively, while PBE underestimates it by only 1.8%. In contrast, SCAN’s magnetization for Co (1.72 ) is closer to the experimental value (1.75 ) than that of r2SCAN (1.78 ) and PBE (1.59 ). These results confirm a known tendency Mejía-Rodríguez and Trickey (2019) of r2SCAN to overestimate magnetic moments.
| DFA | Fe() | Co() | Ni() | ||||
|---|---|---|---|---|---|---|---|
| PBE | 2.18 | 1.59 | 0.62 | ||||
| SCAN | 2.60 | 1.72 | 0.72 | ||||
| SCAN+rVV10 | 2.66 | 1.77 | 0.82 | ||||
| r2SCAN | 2.76 | 1.78 | 0.80 | ||||
| r2SCAN +rVV10 | 2.75 | 1.78 | 0.79 | ||||
| Experiment | 2.22 | 1.75 | 0.62 |
While SCAN+rVV10 predicts larger magnetic moments than SCAN, r2SCAN+rVV10 predicts nearly the same magnetic moments as r2SCAN. The local magnetic moments predicted by PBE, SCAN (+rVV10), and r2SCAN (+rVV10) for all magnetic systems with magnetic moment greater than 0.1 are shown in Supplementary Materials Fig. S3. r2SCAN and SCAN predict 15% and 12% larger magnetic moments (on average) than PBE; their rVV10 counterparts show slightly lower average magnetic moments in comparison with the meta-GGAs.
III.4 Bandgaps
Here we consider SCAN, r2SCAN, and their rVV10 counterparts for electronic bandgap prediction. It is well known that semilocal DFAs such as PBE underestimate the fundamental bandgapPerdew (1985). In a GGA or a meta-GGA (when the latter is implemented in a generalized Kohn-Sham scheme), the fundamental bandgap for a given DFA equals the ionization energy minus the electron affinity of the solid for the same DFA. The meta-GGA bandgaps tend to be slightly more realistic than those of GGAs because the corresponding total energy diference tends to be slightly more realistic Perdew et al. (2017).
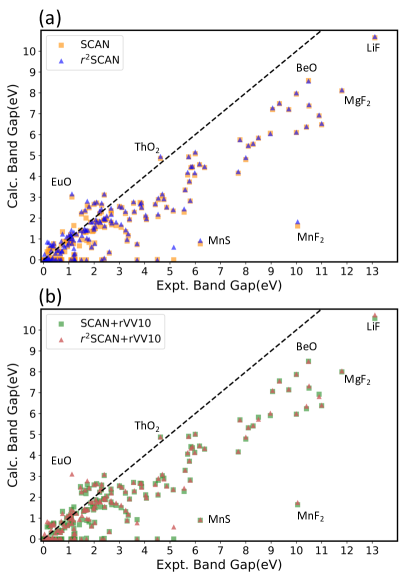
Figure 3 compares computed band gaps to experimental values from Refs. 34; 35. Nearly all the points lie below the dashed line of perfect agreement, indicating that r2SCAN systematically underestimates the fundamental gap. However, consistent with Ref. 36, some of the r2SCAN gaps are larger than those predicted by SCAN: SCAN predicts WS2 to be gapless, whereas r2SCAN predicts a 1.41 eV gap, slightly larger than the 1.1 eV experimental gap. Similar trends are seen for the compounds ZnTe, Sb2Te3, InSe, InSb, InN, InAs, GeTe, FeS2, and GaAs.
There are a few systems where r2SCAN overestimates the gap more than SCAN underestimates it. For example, SnSe has an experimental bandgap of 0.91 eV; SCAN predicts a 0.89 eV gap, whereas r2SCAN predicts a much larger 1.06 eV gap. A similar tendency to overestimate the gaps of small-gap insulators has been observed Neupane et al. (2021) for the TASK Aschebrock and Kümmel (2019) meta-GGA, which was designed for accurate bandgap prediction. The r2SCAN bandgap tends to be more accurate across all insulators than SCAN’s: r2SCAN (SCAN) makes a 1.15 (1.20) eV MAE for this set. The 0.05 eV difference in average errors is largely due to wide-gap compounds such as LiF, MgF2, BeO and MnF2. For insulators with an experimental gap less than 5 eV, r2SCAN (SCAN) makes a 0.73 (0.77) eV MAE; for insulators with experimental gaps greater than 5 eV, r2SCAN (SCAN) makes a 1.36 (1.43) eV MAE.
IV Decomposition enthalpy
Recent studies showed that the signs of decomposition enthalpies are more useful quantities than formation enthalpies for evaluating the stability of compoundsBartel et al. (2019); Bartel (2022). To calculate decomposition enthalpies, we must evaluate the reaction energies of the competing phases of compounds and elements in a composition spaceHautier et al. (2012); Ong et al. (2008); Zunger (2018). For a given ternary compound ABC, the compound ABC competes with all the possible elements, binaries, and ternaries in the corresponding A-B-C space. To obtain the decomposition enthalpy of ternary ABC, we compare the energy of ABC with the linear combination of the competing compounds with the same average composition as the ABC compound that minimizes the combined energy of the competing compounds, . The decomposition enthalpy, is :
| (4) |
indicates that the ABC compound is unstable with respect to compounds formed from the competing space of A-B-C. Similarly, indicates that the ABC compound is stable with respect to its competing phases.
The decomposition reactions that determine fall into one of three types as defined in Ref.23. A type 1 compound is the only known compound in its composition space; the decomposition products are its elemental constituents, and thus = . For Type 2 compounds, the decomposition products are compounds, thus there are no elemental constituents in the decomposed products. For Type 3 compounds, the decomposition products are a combination of compounds and elements.
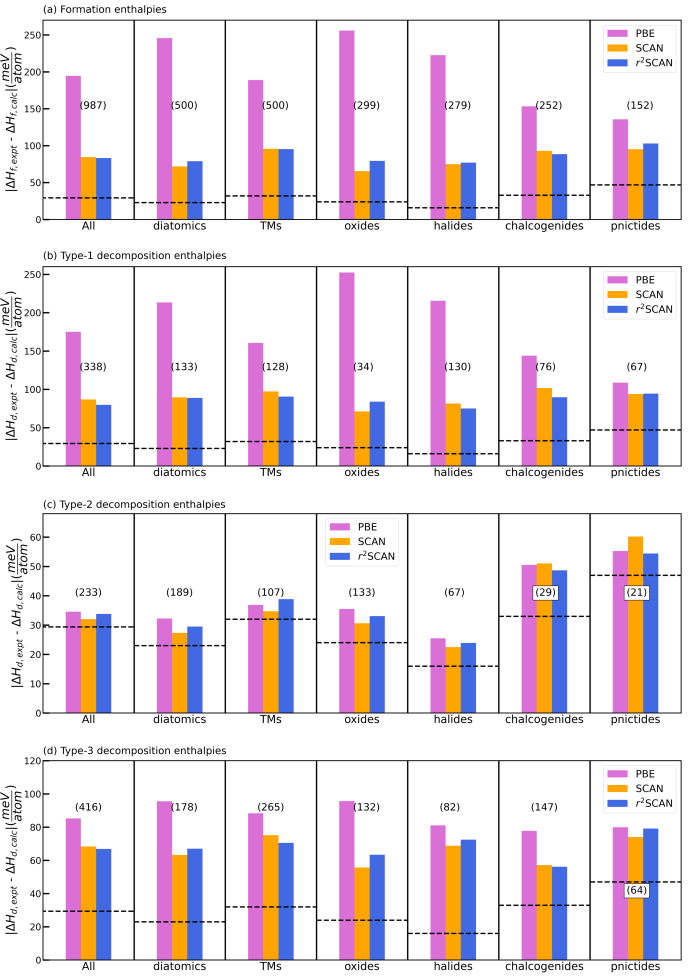
Here we compare the performance of PBE, SCAN and r2SCAN for the decomposition enthalpies of solid-state materials previously benchmarked by Bartel, et al. Bartel et al. (2019). To better elucidate the accuracy of the decomposition enthalpies, Figure 4 presents the errors for subsets of the database. “All” is the entire 987 solid set; “diatomics” contain at least one element in the set H, N, O, F, Cl; “TMs” contain at least one element from groups 3-11; “oxides” contain oxygen; “halides” contain F, Cl, Br, or I; “chalcogenides” contain S, Se, or Te; and “pnictides” contain N, P, As, Sb, or Bi. The total set of 987 solids is partitioned into Type 1 (34%), 2 (24%), and 3 (42%) reactions. As shown in Fig. 4(a), we first analyzed for all compounds to establish a baseline for subsequent comparison to . The MAE for is partitioned for various chemical subsets of the dataset in Fig 4(a) to understand elemental dependence. For this set of 987 compounds, the MAE between the experimentally determined at 298 K, and calculated at 0 K, was found to be 194 meV/atom for PBE, 84 meV/atom for SCAN, and 83 meV/atom for r2SCAN. PBE shows large systematic errors for a range of diversely bonded systems. SCAN and r2SCAN are comparably accurate for all the partitioned subsets, except for oxides, which are described better by SCAN. The good general accuracy of SCAN is typically attributed to its satisfaction of all 17 known constraints applicable to a semilocal DFA Kaplan et al. (2023). r2SCAN satisfies one fewer exact constraint than SCAN by recovering a lower-order gradient expansion for exchange than SCAN Furness et al. (2020). r2SCAN’s smoother exchange-correlation energy density could be the reason for its exceptional performance.
To determine the decomposition enthalpies , and thus the thermodynamic stability of compounds, we used to perform an -dimensional convex hull analysis. We consider only PBE, SCAN, r2SCAN, and experimental values. For 338 compounds that decompose as Type 1 reactions, = , the 80 meV/atom MAE of r2SCAN is the lowest of all considered DFAs, followed by 87 meV/atom for SCAN, and 175 meV/atom for PBE. As expected, the trend for the Type 1 reactions is similar to the overall formation enthalpies shown in figure 4(a). In “real” phase diagrams that are comprised only of computed data (e.g., those retrievable in Materials ProjectJain et al. (2013), OQMDSaal et al. (2013); Kirklin et al. (2015), etc.), there are effectively zero “Type 1” compounds because (nearly) every chemical space has at least two calculated compositions.
For the 233 Type 2 decomposition reactions, where compounds compete only with other compounds and not elements, r2SCAN, SCAN and PBE are found to perform comparably, with MAEs of 35 meV/atom. All DFAs have slightly larger MAEs for the Type 2 chalcogenide and pnictide decomposition enthalpies. Specifically for Type 2, our results show excellent agreement between experiment and theory for on a diverse set of materials without requiring an empirical Hubbard-like correction. For the 416 Type 3 decomposition reactions, where compounds have elements and compounds that compete energetically, does not significantly change from SCAN to r2SCAN. However, for these compounds, SCAN and r2SCAN improve over PBE by 20%, and the MAE between r2SCAN and experiment (67 meV/atom) falls between those for Type 1 (79 meV/atom) and Type 2 (34 meV/atom).
V Conclusions
This work has shown that r2SCAN Furness et al. (2022) and the dispersion-corrected r2SCAN+rVV10 Ning et al. (2022a) are suitable for general-purpose solid-state materials discovery, in the vein of Refs. 21, 22, and 17. Thus we highlight conclusions common to previous works and ours, and those that are unique to the work at hand.
Zhang, et al. Zhang et al. (2018) established that SCAN predicted formation enthalpies of 102 main group compounds with roughly a factor of 2.5 less average absolute error than PBE. This greater-than-twofold decrease in MAE is readily confirmed with the larger 260-solid set of main group compounds presented in Fig. 2. Likewise, the formation enthalpies (or Type I decomposition enthalpies) of Figs. 4(a-b) show a roughly 1.5 to 3-fold decrease in MAE in going from PBE to SCAN or r2SCAN.
Figure 2 and Table 2 show that the simple PBE GGA is more accurate than the more sophisticated meta-GGAs for the formation enthalpies and magnetic moments of metals, as observed in earlier works Isaacs and Wolverton (2018); Mejía-Rodríguez and Trickey (2019); Ekholm et al. (2018); Fu and Singh (2018); Kaplan and Perdew (2022). The reason has been discussed in Ref. 49: The exact exchange-correlation energy density at a position is proportional to the Coulomb interaction between an electron at that position and the density of the exact exchange-correlation hole which surrounds it. The more short-ranged the hole shape is, the better the functional can be approximated using just the local electron density and its low-order derivatives. Since the long-range part of the exact exchange hole is screened by the long-wavelength dielectric constant of the material, the hole shape is especially short-ranged in metals, where this screening is perfect, and where the meta-GGA ingredient is somewhat too nonlocal. Global hybrid functionals, with the even-more-nonlocal exact exchange energy density as an ingredient, are even less accurate Fu and Singh (2018) for the magnetic moments of metals than meta-GGAs are.
Recall that SCAN recovers more of the intermediate-ranged vdW interaction than does r2SCAN. A larger rVV10 -parameter (see also Refs. 20 and 10) more strongly damps the dispersion correction at short-range. The SCAN+rVV10 value Peng et al. (2016) is much larger than that of r2SCAN+rVV10, , Ning et al. (2022a) indicating that r2SCAN needs a more substantial dispersion correction at short- to intermediate-range than does SCAN. In this sense, rVV10 is a more compatible correction to r2SCAN than to SCAN (rVV10 essentially over-corrects SCAN at shorter range). Thus, while Fig. 2 often shows marked increases in the MAEs for SCAN+rVV10 over SCAN (see especially the strongly-bound, weakly-bound, and oxide MAEs), r2SCAN+rVV10 essentially does no harm to r2SCAN in predicting formation enthalpies. Moreover, r2SCAN+rVV10 predicts modestly more accurate cell volumes than r2SCAN, as shown in Table 1.
We found that both r2SCAN and SCAN tend to underestimate the fundamental bandgaps of insulators, as noted previously Kingsbury et al. (2022); Mejía-Rodríguez and Trickey (2020); Kaplan and Perdew (2022). However, we also found that r2SCAN sometimes overestimates the bandgaps of narrow-gap insulators. This is consistent with the tendency of the TASK meta-GGA Aschebrock and Kümmel (2019) to overestimate the gaps of narrow-gap insulators Neupane et al. (2021).
We confirm the conclusion of Ref. 17 that r2SCAN predicts slightly more accurate formation enthalpies and cell volumes than SCAN. GGAs tend to predict much more accurate formation enthalpies for weakly-bound solids, as shown here, and in Ref. 21 for PBE and SCAN, and in Ref. 17 for PBEsol Perdew et al. (2008), SCAN, and r2SCAN. Likewise, PBE and PBEsol predict much more accurate energetics of transition metal intermetallics Isaacs and Wolverton (2018); Kingsbury et al. (2022); Kaplan and Perdew (2022) than the meta-GGAs, for reasons discussed previously.
The Type 2 decomposition enthalpies of Fig.4 show PBE is slightly more accurate than SCAN or r2SCAN.
However, all DFAs predict Type 2 decomposition enthalpies with accuracy close to or below the 30 meV/atom experimental uncertainty. Except for the diatomic and oxide decomposition enthalpies, much smaller decreases in the Type 3 decomposition enthalpies are observed in going from the GGA to meta-GGA level. We have not applied SCAN+rVV10 and r2SCAN+rVV10 to the set of solid-state decomposition enthalpies (which differs from the set Isaacs and Wolverton (2018) presented in Fig. 2), for two reasons: (1) this would be computationally cost-prohibitive; and (2) if most solids in the set are strongly-bound, a dispersion correction will make insignificant changes to the total energies.
Given the general accuracy and numerical stability of r2SCAN Furness et al. (2022); Mejía-Rodríguez and Trickey (2020); Kingsbury et al. (2022) and r2SCAN+rVV10 Ning et al. (2022a), it is safe to recommend either for general materials discovery. When transition metal intermetallic systems are of interest, a GGA or Laplacian-level meta-GGA may be a better choice. When considering layered materials, we recommend r2SCAN+rVV10.
Acknowledgements.
J.S., J.N., and M.K. acknowledge the support of the U.S. Department of Energy (DOE), Office of Science (OS), Basic Energy Sciences (BES), Grant No. DE-SC0014208. J.W.F. acknowledges support from DOE grant DE-SC0019350. A.D.K. thanks Temple University for a Presidential Fellowship. J.P.P. acknowledges the support of the US NSF under Grant No. DMR-1939528. We thank Dr. Alan Weimer for providing experimental formation enthalpy data.References
- Kohn and Sham (1965) W. Kohn and L. J. Sham, Phys. Rev. 140, A1133 (1965).
- Perdew and Schmidt (2001) J. P. Perdew and K. Schmidt, in Density Functional Theory and Its Applications to Materials, Vol. 577, edited by V. E. Van Doren, C. Van Alsenoy, and P. Geerlings (American Institute of Physics, 2001) p. 1.
- Perdew et al. (1996) J. P. Perdew, K. Burke, and M. Ernzerhof, Phys. Rev. Lett. 77, 3865 (1996).
- Sun et al. (2015) J. Sun, A. Ruzsinszky, and J. P. Perdew, Phys. Rev. Lett. 115, 036402 (2015).
- Furness et al. (2018) J. W. Furness, Y. Zhang, C. Lane, I. G. Buda, B. Barbiellini, R. S. Markiewicz, A. Bansil, and J. Sun, Commun. Phys. 1, 1 (2018).
- Zhang et al. (2020a) Y. Zhang, C. Lane, J. W. Furness, B. Barbiellini, J. P. Perdew, R. S. Markiewicz, A. Bansil, and J. Sun, Proc. Natl. Acad. Sci. U.S.A. 117, 68 (2020a).
- Zhang et al. (2020b) Y. Zhang, J. Furness, R. Zhang, Z. Wang, A. Zunger, and J. Sun, Phys. Rev. B 102, 045112 (2020b).
- Bartók and Yates (2019) A. P. Bartók and J. R. Yates, J. Chem. Phys. 150, 161101 (2019).
- Furness and Sun (2019) J. W. Furness and J. Sun, Phys. Rev. B 99, 041119 (2019).
- Ning et al. (2022a) J. Ning, M. Kothakonda, J. W. Furness, A. D. Kaplan, S. Ehlert, J. G. Brandenburg, J. P. Perdew, and J. Sun, “Workhorse minimally empirical dispersion-corrected density functional, with tests for dimers and layered materials: r2SCAN+ rVV10,” (2022a), arXiv:2204.11717.
- Furness et al. (2020) J. W. Furness, A. D. Kaplan, J. Ning, J. P. Perdew, and J. Sun, J. Phys. Chem. Lett. 11, 8208 (2020), ibid. 11, 9248(E) (2020).
- Furness et al. (2022) J. W. Furness, A. D. Kaplan, J. Ning, J. P. Perdew, and J. Sun, J. Chem. Phys. 156, 034109 (2022).
- Mejía-Rodríguez and Trickey (2020) D. Mejía-Rodríguez and S. B. Trickey, Phys. Rev. B 102, 121109 (2020).
- Mejiá-Rodríguez and Trickey (2020) D. Mejiá-Rodríguez and S. B. Trickey, J. Phys. Chem. A 124, 9889 (2020).
- Ehlert et al. (2021) S. Ehlert, U. Huniar, J. Ning, J. W. Furness, J. Sun, A. D. Kaplan, J. P. Perdew, and J. G. Brandenburg, J. Chem. Phys. 154, 061101 (2021).
- Grimme et al. (2021) S. Grimme, A. Hansen, S. Ehlert, and J.-M. Mewes, J. Chem. Phys. 154, 064103 (2021).
- Kingsbury et al. (2022) R. Kingsbury, A. S. Gupta, C. J. Bartel, J. M. Munro, S. Dwaraknath, M. Horton, and K. A. Persson, Phys. Rev. Materials 6, 013801 (2022).
- Ning et al. (2022b) J. Ning, J. W. Furness, and J. Sun, Chemistry of Materials 34, 2562 (2022b).
- Sabatini et al. (2013) R. Sabatini, T. Gorni, and S. De Gironcoli, Phys. Rev. B 87, 041108 (2013).
- Peng et al. (2016) H. Peng, Z.-H. Yang, J. P. Perdew, and J. Sun, Phys. Rev. X 6, 041005 (2016).
- Isaacs and Wolverton (2018) E. B. Isaacs and C. Wolverton, Phys. Rev. Materials 2, 063801 (2018).
- Zhang et al. (2018) Y. Zhang, D. A. Kitchaev, J. Yang, T. Chen, S. T. Dacek, R. A. Sarmiento-Pérez, M. A. L. Marques, H. Peng, G. Ceder, J. P. Perdew, and J. Sun, npj Comput. Mater. 4, 9 (2018).
- Bartel et al. (2019) C. J. Bartel, A. W. Weimer, S. Lany, C. B. Musgrave, and A. M. Holder, npj Computational Materials 5, 1 (2019).
- Kresse and Hafner (1993) G. Kresse and J. Hafner, Phys. Rev. B 47, 558 (1993).
- Kresse and Hafner (1994) G. Kresse and J. Hafner, Phys. Rev. B 49, 14251 (1994).
- Kresse and Furthmüller (1996a) G. Kresse and J. Furthmüller, Phys. Rev. B 54, 11169 (1996a).
- Kresse and Furthmüller (1996b) G. Kresse and J. Furthmüller, Comp. Mater. Sci. 6, 15 (1996b).
- Jain et al. (2011) A. Jain, G. Hautier, C. J. Moore, S. P. Ong, C. C. Fischer, T. Mueller, K. A. Persson, and G. Ceder, Computational Materials Science 50, 2295 (2011).
- Methfessel and Paxton (1989) M. Methfessel and A. T. Paxton, Phys. Rev. B 40, 3616 (1989).
- Blöchl et al. (1994) P. E. Blöchl, O. Jepsen, and O. K. Andersen, Phys. Rev. B 49, 16223 (1994).
- Mejía-Rodríguez and Trickey (2019) D. Mejía-Rodríguez and S. Trickey, Physical Review B 100, 041113 (2019).
- Perdew (1985) J. P. Perdew, International Journal of Quantum Chemistry 28, 497 (1985).
- Perdew et al. (2017) J. P. Perdew, W. Yang, K. Burke, Z. Yang, E. K. Gross, M. Scheffler, G. E. Scuseria, T. M. Henderson, I. Y. Zhang, A. Ruzsinszky, H. Peng, J. Sun, E. Trushin, and A. Görling, Proc. Nat. Acad. Sci. U.S.A. 114, 2801 (2017).
- Strehlow and Cook (1973) W. Strehlow and E. L. Cook, Journal of Physical and Chemical Reference Data 2, 163 (1973).
- Yang et al. (2016) Z.-h. Yang, H. Peng, J. Sun, and J. P. Perdew, Physical review B 93, 205205 (2016).
- Aschebrock and Kümmel (2019) T. Aschebrock and S. Kümmel, Phys. Rev. Research 1, 033082 (2019).
- Neupane et al. (2021) B. Neupane, H. Tang, N. K. Nepal, S. Adhikari, and A. Ruzsinszky, Phys. Rev. Materials 5, 063803 (2021).
- Bartel (2022) C. J. Bartel, Journal of Materials Science , 1 (2022).
- Hautier et al. (2012) G. Hautier, S. P. Ong, A. Jain, C. J. Moore, and G. Ceder, Physical Review B 85, 155208 (2012).
- Ong et al. (2008) S. P. Ong, L. Wang, B. Kang, and G. Ceder, Chemistry of Materials 20, 1798 (2008).
- Zunger (2018) A. Zunger, Nature Reviews Chemistry 2, 1 (2018).
- Bale et al. (2014) C. W. Bale, E. Bélisle, P. Chartrand, S. Decterov, G. Eriksson, A. Gheribi, K. Hack, I.-H. Jung, J. Melançon, A. Pelton, et al., in Celebrating the Megascale (Springer, 2014) pp. 141–148.
- Kaplan et al. (2023) A. D. Kaplan, M. Levy, and J. P. Perdew, Annu. Rev. Phys. Chem. 74, 1 (2023), to appear; see arXiv:2207.03855 for a preprint.
- Jain et al. (2013) A. Jain, S. P. Ong, G. Hautier, W. Chen, W. D. Richards, S. Dacek, S. Cholia, D. Gunter, D. Skinner, G. Ceder, et al., APL materials 1, 011002 (2013).
- Saal et al. (2013) J. E. Saal, S. Kirklin, M. Aykol, B. Meredig, and C. Wolverton, Jom 65, 1501 (2013).
- Kirklin et al. (2015) S. Kirklin, J. E. Saal, B. Meredig, A. Thompson, J. W. Doak, M. Aykol, S. Rühl, and C. Wolverton, npj Computational Materials 1, 1 (2015).
- Ekholm et al. (2018) M. Ekholm, D. Gambino, H. J. M. Jönsson, F. Tasnádi, B. Alling, and I. A. Abrikosov, Phys. Rev. B 98, 094413 (2018).
- Fu and Singh (2018) Y. Fu and D. J. Singh, Phys. Rev. Lett. 121, 207201 (2018).
- Kaplan and Perdew (2022) A. D. Kaplan and J. P. Perdew, “Laplacian-level meta-generalized gradient approximation for solid and liquid metals,” (2022), arXiv:2203.09403, arXiv:2203.09403 [cond-mat.mtrl-sci] .
- Perdew et al. (2008) J. P. Perdew, A. Ruzsinszky, G. I. Csonka, O. A. Vydrov, G. E. Scuseria, L. A. Constantin, X. Zhou, and K. Burke, Phys. Rev. Lett. 100, 136406 (2008).
Supplemental Materials: Testing the r2SCAN density functional for the
thermodynamical stability of solids with and without a van der
Waals correction
Manish Kothakonda,1 Aaron Kaplan,2,Eric B. Isaacs,3Christopher J Bartel,4 James Furness,1 Jinliang Ning,1 Chris Wolverton,5John Perdew,2 Jianwei Sun1
1Department of Physics and Engineering Physics, Tulane University, New Orleans, LA 70118, USA
2Department of Physics, Temple University, Philadelphia, Pennsylvania 19122, United States
3HRL Laboratories, LLC, Malibu, California 90265, United States
4Department of Materials Science and Engineering, University of California, Berkeley, United States
5Department of Materials Science and Engineering, Northwestern University, Evanston, Illinois 60208, United States
E-mail: jsun@tulane.edu
| System | Expt | SCAN | r2SCAN | SCAN+rVV10 | r2SCAN+rVV10 |
|---|---|---|---|---|---|
| Ag2O | 1.2 | 0.245 | 0.261 | 0.228 | 0.244 |
| Ag2S | 0.95 | 0.63 | 0.713 | 0.64 | 0.651 |
| AgCl | 3.25 | 1.346 | 1.437 | 1.309 | 1.383 |
| AgI | 2.869 | 1.641 | 1.808 | 1.61 | 1.727 |
| Al2O3 | 9.7 | 7.196 | 7.237 | 7.137 | 7.17 |
| Al2Se3 | 3.1 | 2.502 | 2.526 | 2.469 | 2.489 |
| AlAs | 2.1 | 1.754 | 1.812 | 1.728 | 1.762 |
| AlN | 5.74 | 4.933 | 4.946 | 4.915 | 4.906 |
| AlP | 2.45 | 1.911 | 1.952 | 1.888 | 1.888 |
| AlSb | 1.62 | 1.382 | 1.497 | 1.352 | 1.456 |
| As | 1.2 | 0 | 0.546 | 0.514 | 0.497 |
| AsI3 | 2.29 | 2.297 | 2.441 | 2.356 | 2.42 |
| BaF2 | 9.06 | 7.203 | 7.288 | 7.057 | 7.109 |
| BaO | 5.13 | 2.336 | 2.41 | 2.353 | 2.38 |
| BaS | 3.88 | 2.489 | 2.525 | 2.508 | 2.478 |
| BAs | 1.46 | 1.415 | 1.404 | 2.508 | 2.478 |
| BaTe | 3.4 | 1.915 | 1.971 | 1.911 | 1.926 |
| BeO | 10.48 | 8.591 | 8.57 | 8.506 | 8.499 |
| Bi | 0.015 | 0 | 0 | 0 | 0 |
| Bi2Se3 | 0.21 | 0.51 | 0.831 | 0.637 | 0.778 |
| Bi2Te3 | 0.145 | 0.392 | 0.857 | 0.579 | 0.836 |
| BiI3 | 1.73 | 2.615 | 2.814 | 2.61 | 2.787 |
| BN | 8 | 4.804 | 4.905 | 4.78 | 4.882 |
| BP | 2 | 1.52 | 1.467 | 1.525 | 1.446 |
| CaB6 | 4.5 | 0.014 | 0 | 0 | 0 |
| CaF2 | 10 | 7.944 | 8.006 | 7.87 | 7.896 |
| CaI2 | 5.98 | 4.051 | 4.176 | 4.143 | 4.136 |
| CaO | 7.7 | 4.148 | 4.231 | 4.166 | 4.193 |
| CaS | 5.8 | 2.816 | 2.847 | 2.824 | 2.816 |
| CaSe | 4.87 | 2.514 | 2.535 | 2.541 | 2.534 |
| CaTe | 4.07 | 1.926 | 1.979 | 1.954 | 1.978 |
| CdCl2 | 5.7 | 4.069 | 4.196 | 4.06 | 4.135 |
| CdO | 1.2 | 0 | 0.075 | 0 | 0 |
| CdS | 2.4175 | 1.554 | 1.631 | 1.51 | 1.568 |
| CdSe | 1.714 | 0.925 | 1.044 | 0.891 | 0.981 |
| CdTe | 1.517 | 0.967 | 1.171 | 0.925 | 1.128 |
| CeN | 0.7 | 0 | 0 | 0 | 0 |
| CeO2 | 2.68 | 2.222 | 2.179 | 2.224 | 2.2 |
| CoO | 0.47 | 0.192 | 0.313 | 0.287 | 0.287 |
| CoSi | 0.045 | 0 | 0 | 0 | 0 |
| Cr2O3 | 1.68 | 2.004 | 1.418 | 2.172 | 1.384 |
| CrO2 | 0.23 | 0 | 0 | 0 | 0 |
| CrSi2 | 0.35 | 0 | 0 | 0 | 0 |
| CsCl | 8.1 | 5.447 | 5.485 | 5.319 | 5.342 |
| CsF | 10 | 6.1 | 6.122 | 5.972 | 6.002 |
| CsI | 6.37 | 4.42 | 4.472 | 4.302 | 4.338 |
| Cu2O | 2.023 | 0.81 | 0.781 | 0.799 | 0.78 |
| Cu2Se | 1.23 | 0 | 0 | 0 | 0 |
| Cu2Te | 1.08 | 0 | 0 | 0 | 0 |
| CuCl | 3.306 | 0.899 | 0.98 | 0.863 | 0.901 |
| CuI | 3.07 | 1.559 | 1.707 | 1.497 | 1.623 |
| EuO | 1.122 | 3.011 | 3.164 | 0 | 3.111 |
| EuS | 1.645 | 2.309 | 2.386 | 2.339 | 2.348 |
| FeI2 | 5.15 | 0 | 0.607 | 0 | 0.578 |
| FeP2 | 0.4 | 0.769 | 0.666 | 0.762 | 0.666 |
| FeS2 | 1.2 | 1.641 | 1.333 | 1.535 | 1.317 |
| FeSi | 0.1 | 0 | 0 | 0 | 0 |
| FeTe2 | 0.46 | 0 | 0 | 0 | 0 |
| Ga2O3 | 4.54 | 2.884 | 2.964 | 2.812 | 2.906 |
| Ga2S3 | 3.59 | 2.275 | 2.337 | 2.253 | 2.318 |
| Ga2Se3 | 2.05 | 1.503 | 1.605 | 1.498 | 1.589 |
| GaAs | 1.42 | 0.669 | 0.957 | 0.682 | 0.937 |
| GaN | 3.24 | 2.221 | 2.323 | 2.195 | 2.291 |
| GaP | 2.22 | 1.824 | 1.864 | 1.823 | 1.809 |
| GaS | 2.5 | 1.985 | 2.108 | 2.053 | 2.057 |
| GaSb | 0.725 | 0.008 | 0.405 | 0 | 0.406 |
| GaSe | 1.98 | 1.388 | 1.543 | 1.391 | 1.517 |
| Ge | 0.665 | 0.138 | 0.313 | 0.313 | 0.313 |
| GeI2 | 1.5 | 2.198 | 2.306 | 2.204 | 2.261 |
| GeO2 | 5.56 | 2.283 | 2.444 | 2.278 | 2.436 |
| GeS | 1.58 | 1.321 | 1.379 | 1.322 | 1.361 |
| GeSe | 1.1 | 1.005 | 1.122 | 1.048 | 1.085 |
| GeSe2 | 2.38 | 1.897 | 2 | 1.934 | 1.958 |
| GeTe | 0.84 | 0.387 | 0.619 | 0.534 | 0.597 |
| I | 1.3 | 1.194 | 1.248 | 1.233 | 1.233 |
| InAs | 0.356 | 0 | 0.094 | 0 | 0.078 |
| InN | 2.4 | 0.015 | 0.086 | 0.028 | 0 |
| InS | 1.86 | 1.797 | 1.821 | 1.721 | 1.805 |
| InSb | 0.17 | 0 | 0.044 | 0 | 0 |
| InSe | 1.187 | 0.775 | 0.948 | 0.778 | 0.912 |
| K2S | 2.1 | 2.72 | 2.774 | 2.646 | 2.64 |
| K2Se | 1.8 | 2.494 | 2.565 | 2.416 | 2.454 |
| K3Sb | 1 | 0.761 | 0.817 | 0.712 | 0.752 |
| KCl | 8.5 | 5.83 | 5.864 | 5.827 | 5.735 |
| KF | 10.9 | 6.899 | 6.946 | 6.928 | 6.819 |
| KI | 6.17 | 4.559 | 4.601 | 4.448 | 4.469 |
| Li3Sb | 1 | 1.056 | 1.185 | 1.088 | 1.151 |
| LiCl | 9.33 | 7.483 | 7.519 | 7.565 | 7.558 |
| LiF | 13.105 | 10.643 | 10.705 | 10.554 | 10.722 |
| LiI | 6 | 5.083 | 5.169 | 5.01 | 5.038 |
| Mg2Ge | 0.532 | 0.359 | 0.454 | 0.355 | 0.415 |
| Mg2Pb | 0.041 | 0 | 0.271 | 0 | 0.24 |
| Mg2Si | 0.6 | 0.429 | 0.456 | 0.429 | 0.42 |
| MgF2 | 11.8 | 8.096 | 8.147 | 7.998 | 8.044 |
| MgO | 7.77 | 5.753 | 5.761 | 5.702 | 5.701 |
| MgSe | 5.6 | 3.345 | 3.366 | 3.287 | 3.296 |
| MgTe | 4.7 | 3.079 | 3.162 | 3.03 | 3.103 |
| MnF2 | 10.05 | 1.623 | 1.828 | 1.639 | 1.751 |
| MnI2 | 4.04 | 2.048 | 2.146 | 2.114 | 2.109 |
| MnO | 3.7 | 0 | 0 | 0 | 0 |
| MnS | 6.2 | 0.768 | 0.928 | 0.894 | 0.927 |
| MnSe | 1.8 | 0.834 | 0.992 | 0.816 | 0.956 |
| MnTe | 1.25 | 0 | 0 | 0 | 0 |
| MoS2 | 1.07 | 1.207 | 1.216 | 1.077 | 1.216 |
| Na2S | 2.4 | 3.103 | 3.157 | 3.039 | 3.098 |
| Na2Se | 2 | 2.656 | 2.727 | 2.588 | 2.623 |
| Na2Te | 2.3 | 2.612 | 2.724 | 2.579 | 2.625 |
| Na3Sb | 1.1 | 0.949 | 1.019 | 0.91 | 0.963 |
| NaCl | 8.97 | 6.065 | 6.047 | 5.906 | 6.027 |
| NaF | 10.5 | 7.371 | 7.442 | 7.22 | 7.329 |
| NaI | 5.89 | 4.443 | 4.479 | 4.368 | 4.425 |
| NiO | 3.7 | 0.731 | 0.779 | 0.927 | 0.777 |
| NiS | 0.12 | 0 | 0 | 0 | 0 |
| PbO | 1.936 | 1.359 | 1.813 | 1.567 | 1.757 |
| PbO2 | 1.7 | 0 | 0 | 0.037 | 0 |
| PbS | 0.41 | 0.619 | 0.802 | 0.716 | 0.767 |
| PbSe | 0.27 | 0.555 | 0.695 | 0.594 | 0.644 |
| PdO | 1.5 | 0 | 0 | 0 | 0 |
| PrO2 | 0.66 | 0 | 0 | 0 | 0 |
| PtS | 0.8 | 0.888 | 0.71 | 0.752 | 0.71 |
| PtS2 | 0.75 | 1.343 | 1.237 | 1.323 | 1.221 |
| RbCl | 8.29 | 5.538 | 5.579 | 5.411 | 5.436 |
| RbF | 10.4 | 6.36 | 6.392 | 6.235 | 6.358 |
| RbI | 5.83 | 4.415 | 4.471 | 4.422 | 4.348 |
| ReSi2 | 0.12 | 0 | 0 | 0 | 0 |
| S | 3.82 | 2.745 | 2.681 | 2.669 | 2.669 |
| Sb | 0.1 | 0 | 0 | 0 | 0 |
| Sb2Te3 | 0.3 | 0.11 | 0.449 | 0.277 | 0.439 |
| SbI3 | 2.22 | 2.215 | 2.346 | 2.237 | 2.317 |
| ScN | 2.6 | 0.322 | 0.394 | 0.354 | 0.354 |
| Se | 1.75 | 1.372 | 1.425 | 1.408 | 1.407 |
| Si | 1.12 | 0.827 | 0.787 | 0.767 | 0.748 |
| SiO2 | 11 | 6.473 | 6.538 | 6.379 | 6.411 |
| SmS | 0.22 | 0 | 0 | 0 | 0 |
| SnI2 | 2.4 | 1.903 | 1.964 | 1.902 | 1.941 |
| SnO2 | 2.7 | 1.679 | 1.767 | 1.642 | 1.742 |
| SnS | 1.08 | 1.075 | 1.206 | 1.167 | 1.173 |
| SnS2 | 2.07 | 1.855 | 1.932 | 1.881 | 1.889 |
| SnSe | 0.91 | 0.887 | 1.095 | 1.006 | 1.062 |
| SnSe2 | 1.03 | 0.933 | 1.014 | 0.95 | 0.992 |
| SnTe | 0.18 | 0.271 | 0.149 | 0 | 0.13 |
| SrO | 5.77 | 3.728 | 3.785 | 3.719 | 3.747 |
| SrS | 4.76 | 2.888 | 2.93 | 2.91 | 2.873 |
| SrSe | 4.42 | 2.641 | 2.693 | 2.646 | 2.609 |
| TaN | 2.3 | 0 | 0 | 0 | 0 |
| TaS2 | 0.1 | 0 | 0 | 0 | 0 |
| TbO2 | 0.5 | 0 | 0 | 0 | 0 |
| Te | 0.332 | 0.531 | 0.71 | 0.709 | 0.696 |
| ThO2 | 4.625 | 4.859 | 4.961 | 4.876 | 4.886 |
| Ti2O3 | 0.02 | 0 | 0 | 0 | 0 |
| TiO2 | 3 | 2.556 | 2.572 | 2.541 | 2.572 |
| TiS2 | 1.24 | 0.23 | 0.31 | 0.272 | 0.271 |
| Tl2Te3 | 0.7 | 0.706 | 0.89 | 0.762 | 0.86 |
| TlCl | 3.56 | 2.712 | 2.788 | 2.707 | 2.709 |
| TlI | 2.67 | 2.355 | 2.477 | 2.386 | 2.409 |
| TlSe | 0.73 | 0.391 | 0.446 | 0.41 | 0.422 |
| V2O3 | 0.1 | 0 | 0 | 0 | 0 |
| VO | 0.3 | 0 | 0 | 0 | 0 |
| WS2 | 1.1 | 0 | 1.423 | 1.411 | 1.407 |
| YN | 1.9 | 0.576 | 0.62 | 0.621 | 0.62 |
| ZnI2 | 4.53 | 2.071 | 2.194 | 2.102 | 2.162 |
| ZnO | 3.35 | 1.151 | 1.252 | 1.138 | 1.195 |
| ZnS | 3.87 | 2.704 | 2.744 | 2.653 | 2.672 |
| ZnSe | 2.67 | 1.8 | 1.893 | 1.771 | 1.84 |
| ZnTe | 2.25 | 1.598 | 1.797 | 1.534 | 1.774 |
| ZrC | 0.6 | 0 | 0 | 0 | 0 |
| ZrS2 | 1.68 | 1.314 | 1.417 | 1.388 | 1.383 |