JWST unveils heavily obscured (active and passive) sources up to
Abstract
A wealth of extragalactic populations completely missed at UV-optical wavelengths has been identified in the last decade, combining the deepest HST and Spitzer observations. These dark sources are thought to be dusty and star-forming systems at , and major contributors to the stellar mass build up. In this Letter we report an investigation of the deep JWST survey in the SMACS0723 cluster, analysing NIRCam and MIRI images. We search for sources in the F444W band that are undetected in the F200W catalogues. We characterise the properties of these sources via detailed SED modelling, accounting for a wide set of parameters and star formation histories, after a careful determination of their photometry. Among a robust sample of 20 candidates, we identify a mixed population of very red sources. We highlight the identification of evolved systems, with stellar masses M⊙ at characterized by unexpectedly important dust content at those epochs ( up to mag), challenging current model predictions. We further identify an extremely red source (F200W-F440W7mag) that can be reproduced only by the spectrum of a passive, quenched galaxy of M⊙ at , filled of dust (mag).
keywords:
galaxies: high-redshift – galaxies: evolution – infrared: galaxies1 Introduction
The statistical identification of galaxies at various cosmic epochs is key to understanding their formation and evolution. In the deepest extragalactic fields, multiwavelength observational efforts (from the X-ray to the radio spectral region) allowed for a reconstruction of the distinct galaxy populations and their formation history. The measurement of the star formation rate density (SFRD) is a key finding (e.g. Madau & Dickinson 2014). The SFRD peaked at and then descended quickly to the current period. However, recent studies have suggested that the portion of the SFRD hidden by dust, and so unaccounted for by optical/UV surveys at is not negligible and is likely to increase with redshift at least up to (e.g. Novak et al. 2017, Gruppioni et al. 2020). Thus, a thorough investigation of high redshift galaxies is crucial for our comprehension of the early epochs of galaxy stellar mass growth.
The more traditional method of analyzing sources at relies on their broadband colors, as they allow to identify the presence of a brightness drop (i.e. the Lyman Break or the Lyman Forest). Such objects are known as Lyman-Break Galaxies (LBGs). Although this method is relatively simple to use, it is also significantly incomplete and contaminated. In particular, the LBG selection is known to be significantly biased towards relatively young massive and starforming galaxies citep[;][]Giavalisco02,Shapley11,Dunlop13, missing the heavy dust obscuration in the UV spectral region. As a result LBGs are actually more likely to exclude the more massive galaxies due to their increased dust content (e.g. Whitaker et al. 2017).
Other independent near-IR color schemes have thus been suggested to extend the census of the high- population, in particular thanks to the Spitzer space telescope. Wang et al. (2016) provide a strategy that allows for a rather clear selection of galaxies. For example, the color cut is proposed to select old or dusty galaxies at (called HIEROs) that are completely missed even by the deepest Hubble Space Telescope (HST) imaging. Such UV-optically dark objects are dominated by obscured and dusty systems, including submillimeter sources (Wang et al., 2019). HIEROs have typical and SFR at an average . They exhibit low number space densities and active star formation, contributing up to of the SFRD at to 5 (e.g. Gruppioni et al., 2020; Sun et al., 2021; Talia et al., 2021; Enia et al., 2022), and up to of the bright end of the stellar mass function (Rodighiero et al., 2007). A more extreme class of objects revealed at millimeter wavelengths includes optically dark sources undetected even in deep Spitzer images (e.g. Yamaguchi et al., 2019; Williams et al., 2019; Gruppioni et al., 2020). However, their contribution to the SFRD is still uncertain given their low statistics.
Despite the significance of these galaxies, most of their physical characteristics are still very speculative, with the exception of a few spectroscopic confirmations (Wang et al., 2019; Casey et al., 2019; Umehata et al., 2020; Caputi et al., 2021; Ikarashi et al., 2022). The James Webb Space Telescope (JWST) has just opened a new window on the distant Universe, allowing through its near-to-mid IR eyes to detect farther and fainter sources. In this Letter we exploit the first deep field imaging offered by the early release observations (ERO) to demonstrate the ability of JWST to identify optically and near-IR dark sources missed even by Spitzer because of their fainter luminosities. We present the detection and characterization of sources selected in the longest NIRCam filter, F444W, lacking a detection in the F200W band in blindly extracted catalogs (e.g. F200W dropouts). By combining the Near-Infrared Camera (NIRCam; Rieke et al., 2005) and Mid Infrared Instrument (MIRI; Rieke et al., 2015) photometry, we investigate the properties of the most robust detections, highlighting: i) the discovery of extremely dusty low mass systems, filling the faint end of the HIEROs mass function; ii) the potential identification of massive quenched galaxies at ; iii) the confirmation of high- systems () as already probed by JWST (Adams et al., 2022; Atek, 2022; Carnall et al., 2022a; Castellano et al., 2022; Donnan et al., 2022; Finkelstein et al., 2022; Naidu et al., 2022), but with large dust content. Throughout the paper, we consider a CDM cosmology with , , and a Kroupa (2001) stellar Initial Mass Function; all magnitudes are in the AB system.
2 JWST OBSERVATIONS OF SMACS0723
The Reionization Lensing Cluster Survey (RELICS, Coe et al., 2019) dedicated 188 HST orbits and 946 Spitzer hours, observing 41 of the most massive galaxy clusters discovered by Planck at redshift . The relatively deep ACS and WFC3/IR imaging, spanning 0.4-1.7 m, has been used to derive accurate magnification maps of these clusters. The cluster SMACS J0723.37327 (hereafter SMACS0723) at has two lens models (Glafic and Lenstool), publicly available in the RELICS repository111 https://archive.stsci.edu/missions/hlsp/relics/smacs0723-73/models/. According to these maps, the magnification region at is relatively extended, allowing the selection of galaxies at (Salmon et al., 2020).
The observations of SMACS0723 by the world’s premier space science observatory JWST marked the official beginning of the highly promising observatory’s science operations (Pontoppidan et al., 2022). The high quality of the Webb first images and spectra of SMACS0723 have been obtained in particular with the instruments NIRCam and MIRI. The ERO program aims at demonstrating the ability of JWST to image high-redshift galaxies, at a depth unrivaled by HST or ground based telescopes.
2.1 NIRCam images
The NIRCam instrument targeted SMACS0723, pointing one detector on the cluster, and the other detector on the adjacent off-field. The NIRCam filters F090W, F150W, F200W, F277W, F356W, and F444W have been exposed for seconds each, resulting in a 5 sensitivity limit of AB magnitude for point-like sources. These depths are equivalent to the ones obtained with WFC3/IR for the HUDF12 pointing (Koekemoer et al., 2013), and they are a factor of 10 times more sensitive than the deepest Spitzer/IRAC imaging available at 3.6 and 4.5 m. The SMACS J0723.3-7327 JWST observations include two NIRCam modules, each observing with a Field of View (FoV, one centered on the cluster BCG, the other offset by ).
The NIRCam reduced images have been retrieved from the Mikulski Archive for Space Telescopes (MAST)222https://archive.stsci.edu.. The official reduction has overall good quality, with slightly off-centering problems of alignment between the different bands. In order to overcome this issue, we decided to carry out a first catalog in each band using SExtractor Bertin & Arnouts (1996), matching a posteriori the catalogs in absolute coordinates. The matched catalog has been used in order to pre-select high-z galaxy candidates with the dropout technique. As described in Section 2.3, a detailed photometric analysis has been applied on the relevant sources only. We adopt the calibration software version 1.5.3 and the updated NIRCam photometric calibration333https://jwst-crds.stsci.edu/context_table/jwst_0942.pmap released on the 29th of July 2022 by the Space Telescope Science Institute.
2.2 MIRI images
The MIRI instrument observed the central region of SMACS0723 with the F770W, F1000W, F1500W and F1800W filters. The MIRI observations cover only part of the NIRCam field, given the difference in the field-of-view of the two instruments (i.e. for MIRI, two for NIRCam).
Differently from NIRCam, the MIRI fully reduced images available on MAST show the presence of strong background patterns (e.g. vertical striping and gradients). The prominence of these features varies significantly among filters. Since such a background could impact on the number of detections and photometric quality of our sample, we decide to re-run the JWST pipeline444https://jwst-pipeline.readthedocs.io/en/latest/index.html. (v. 1.6.1) adding an additional step to improve the background cleaning and homogenization. The final result is not purely cosmetic: a SExtractor run on the final image shows that we are able to minimize spurious detections while maximizing the number of real sources. Besides, the magnitude of bright sources is not affected. This ensures us that the extra-cleaning of the background does not impact on our magnitude estimates. As for NIRCam, we use SExtractor to correct the astrometry of the MIRI images.
2.3 Sample selection
We propose to identify potential high- and/or dusty sources by selecting F200W dropouts candidates in the SMACS0723 JWST deep field. Indeed, these objects could be interpreted either as: i) LBGs, ii) heavily extinguished galaxies iii) red and dead passive sources at . We start from the SExtractor photometry in the different NIRCam bands (see Sect. 2.1), we cross-match the single bands extractions to the F444W catalog adopting a 0.2 arcsec search radius. We look for sources with a F444W mag29mag [AB] detection (above the 5 depth) and we select a sample of F200W dropouts that lack a counterpart in the F200W band extracted from SExctractor (see Section 2.1). We visually inspected each candidate, removing all spurious or contaminated objects. We identify a robust sample of 20 sources, for which we perform a refined photometric measurement (see Section 2.4), in order to avoid biases due to local background variations in the NIRCam and MIRI maps. The coordinates and multiwavelength fluxes of the final sample are presented in Table 1 (available as online material). We note that some non-detections at wavelengths shorter then F200W in the preliminary SExtractor catalogs are instead very faint detections after our detailed photometric analysis. The nature of the sources will be investigated through SED fitting in Section 4.
2.4 Ad hoc source photometry
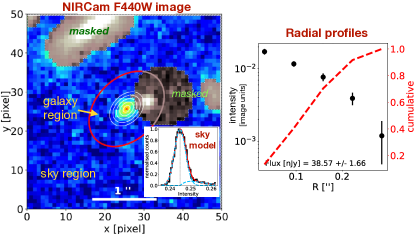
Our photometric analysis is based on the extraction of cumulative light profiles from sky-subtracted images after the removal of contamination from point-like and extended sources. We provide a brief description of our method below, using the NIRCam F444W image of target #15 as a working example (Fig. 1), but the same approach is used for all the other JWST images. More detailed information on the method are provided in Marasco et al. (2022).
We first extract cutouts of pixels, centered at the coordinates of the target. Each cutout is visually inspected for the presence of major contaminants (such as an off-centered bright galaxy, or the diffraction figure from a nearby source), which are manually masked and excluded from the analysis. The image is then partitioned into a ‘sky’ and a ‘galaxy’ region, via an ellipse (shown in red in the left panel of Fig. 1) whose size, axial ratio and orientation are manually selected after visual inspection. The image background and noise are determined by modelling the 1D pixel intensity distribution in the sky region with the sum of a Gaussian function, whose mean and standard deviation correspond to and , and a Schechter function, that accounts for minor contaminants (such as a population of faint, unresolved sources) within this region. This procedure is illustrated in the inset of the left panel of Fig. 1. The background is subtracted from the cutout before the next analysis steps.
The galaxy region is partitioned into a series of rings that are used to extract the radial profile and the growth curve (right panel in Fig. 1) by replacing masked pixels in each ring with the mean intensity computed in that ring. Profiles are truncated where the signal-to-noise ratio (SNr) in a given ring drops below unity: this corresponds to measuring fluxes using a variable aperture, with a size that is tuned to the properties of each target. Targets with sufficiently good SNr feature a visible flattening in their growth curve, which is a key check for the goodness of their photometry. MIRI fluxes are corrected for aperture effects, using simulated MIRI point spread functions555https://jwst-docs.stsci.edu/jwst-mid-infrared-instrument/miri-performance/miri-point-spread-functions. We do not implement corrections for NIRCam fluxes, given that the adopted apertures are large enough to enclose virtually all of the PSF light. Flux uncertainties are determined with a Monte-Carlo technique: we re-compute times the flux by injecting Gaussian noise into the image, and take the standard deviation of the resulting flux distribution as our fiducial uncertainty.
Finally, our procedure is fairly robust against small variations in the target center. Visual inspection of our cutouts indicates that target coordinates can be kept fixed for all filters of a given instrument, but must be adjusted from MIRI to NIRCam (by typically 1.3″) to account for astrometric offsets between the two instruments.
3 SED FITTING
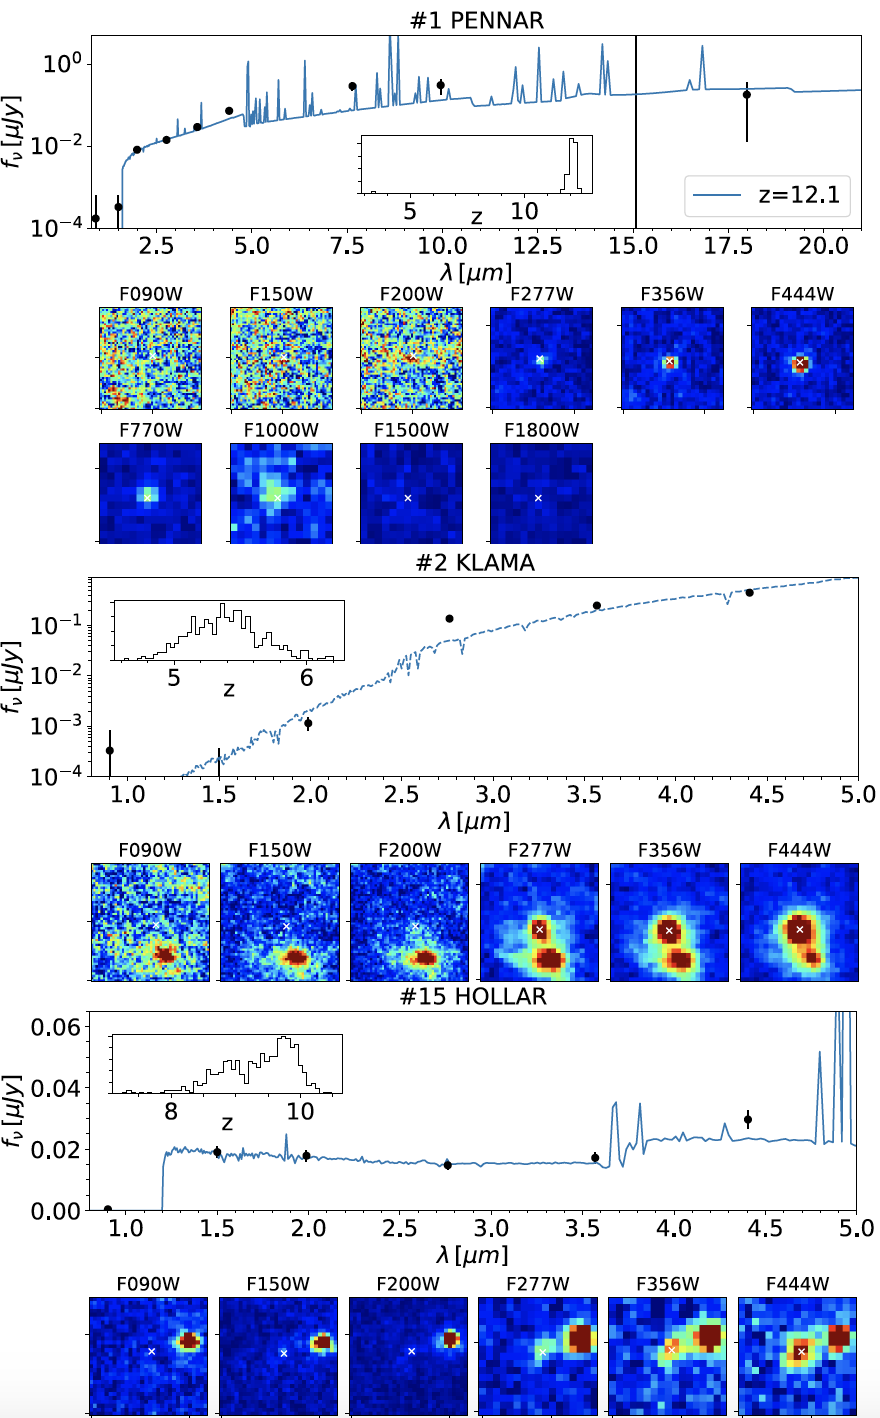
We derived the redshift and galaxy physical properties (e.g. stellar mass, SFR) using the Bayesian Analysis of Galaxies for Physical Inference and Parameter EStimation (BAGPIPES; Carnall et al., 2018). In particular, we consider Bruzual & Charlot (2003) stellar population models with stellar metallicity from 0.005 solar up to solar. We allow the code to explore the redshift range and the stellar mass range up to 10. Nebular emission lines were included assuming a ionization parameter from 10-4 to 10-2 and we considered the same reddening law (i.e., Calzetti et al., 2000) for both the stellar continuum and the nebular emission lines. We run the code twice, once with an exponentially declining (i.e. SFR) star-formation history and once with a rising (i.e. SFR) one, both with ages ranging from 1 Myr to the age of the Universe and 0.01 to 10 Gyr. Between these two runs, we kept the fit with the minimum , but we highlight that redshift, stellar mass and SFR are, for the majority of cases, consistent between the two cases. We show the fits of source 1-PENNAR, 2-KLAMA and 15-HOLLAR as examples in Figure 2.
The spectral properties of a local brown dwarf can resemble the rest-frame optical observations of high- galaxies. Therefore, we also fit our candidates dropouts with L and T dwarf models available from Burrows et al. (2006). Such templates span effective temperatures between 700 K and 2300 K, metallicities between [Fe/H]=-0.5 and 0.5 and gravities between and .
We performed the SED fitting allowing the extinction parameter to span the range of values . Values of exceeding mag have been observed only in the the central 1–2 kpc of local luminous IR galaxies (Mayya et al., 2004; Scoville et al., 2015). In comparison, dusty submillimeter galaxies at have typical average extinction around (Knudsen et al., 2005; Da Cunha et al., 2015). Another class including heavily obscured sources is that of HIEROs. However, even in this case the reddening has typical values around at (Wang et al., 2019; Barrufet et al., 2022). Results from this SED fitting analysis are reported in Table 2.
4 RESULTS
4.1 Nature of the F444W sources with a faint F200W counterpart
We rely on the SED fitting approach described in Section 3 to infer the physical properties of our sample. A summary of the photometric redshifts and basic outputs from BAGPIPES is reported in Table 2. When the posterior distribution of the physical parameters derived with BAGPIPES show two or more separate peaks, we report the two most probable solutions. We note that a Brown Dwarf solution is never preferred by the .
Fig. 3 summarizes the position of the sources in the M∗-SFR plane at their best assigned photo- (corrected for magnification when required). The sources can be grouped in the following main classes.
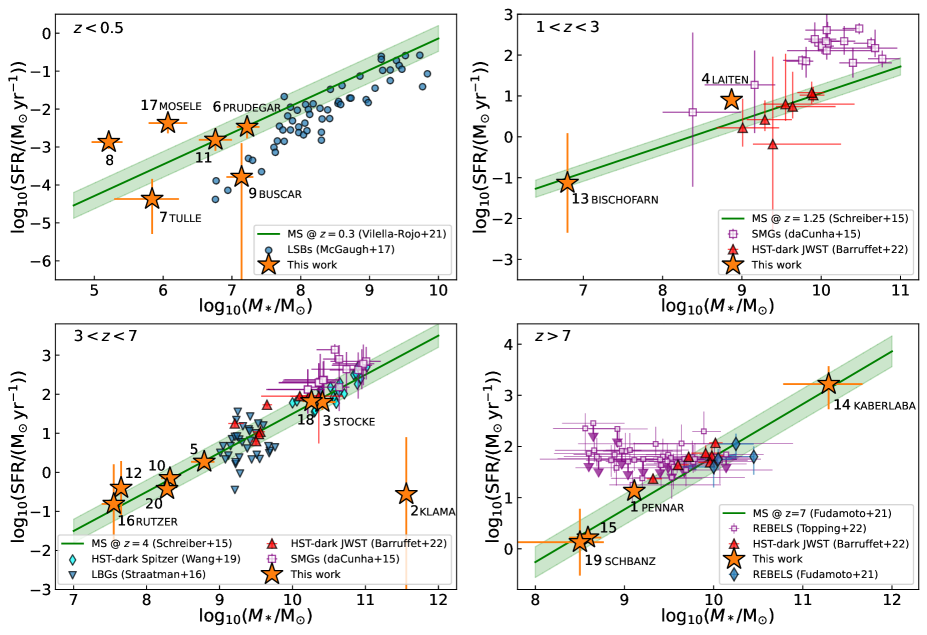
Low redshift contaminants ()
-
•
Red and dusty low- dwarf galaxies: the SED of four sources are reproduced with templates of galaxies, low stellar masses log(M∗/M⊙)5-7, and SFR consistent with the faint end of the Main Sequence (MS) in the local Universe (Fig. 3 top-left). These sources are less massive even than Low Surface Brightness (LSB) galaxies at (e.g. McGaugh et al., 2017b). However, the JWST dwarves are much more extinguished than traditional UV selection, with up to mag (IDs 6-PRUDEGAR, 7-TULLE, 8-LAMARA, 9-BUSCAR, 11-SCHACHER, 17-MOSELE).
- •
Having recognized the lower redshift contaminants, we are then left with higher candidates, most of them being unreachable or unidentifiable before the JWST.
Distant sources ()
-
•
dusty star-forming systems: 40% of the sample sits on the MS at , part of them filling the obscured faint end of the Main Sequence missed by LBGs (similar to Barrufet et al. (2022), IDs 3-STOCKE, 5-ORKENTAAL, 10-BALDE, 12-TAAL, 16-RUTZER, 18-MORAR, 20-BERGA, Fig. 3 bottom-left). In particular, IDs 3- and 18- present a color F200W-F444W2.3mag, very close to the HIERO definition, due to their larger extinction parameter (). We also note that half of the global sample have such red F200W-F444W colors. As discussed in Section 1, this population was completely missed by HST and Spitzer, lacking the sensitivity to statistically identify [4.5]>mag optically dark sources, but they could play a major role in the stellar assembly of today’s massive galaxies.
-
•
A quenched, dusty and massive galaxy at ? We identify the most extreme red object in our sample (F200W-F440W7mag), that can be explained only by templates of a massive (log(M∗/M⊙)11.56) quenched galaxy at with anomalous abundant dust extinction, mag (ID 2-KLAMA). This object is even redder than the JWST source with SCUBA2 analysed by (Zavala et al., 2022), which is at a similar redshift but it is starbursting. We verify the presence of a possible less dusty solution by running BAGPIPES limiting the reddening to . However, the best solution results in a that is three times larger than the solution with . We also varied the ionization parameter (U) to test if the red colors of this galaxy could be due to the presence of nebular emission lines. Indeed, strong rest-optical emission lines at could significantly contaminate broadband photometry around 3 and 4 m (e.g. Labbé et al., 2013; Stark et al., 2013; Alcalde Pampliega et al., 2019). A red F200W dropout could then mask as a ultra-faint source with continuum below the detection limit and the F444W flux boosted by an emission line. Typically, such objects are likely to be low mass and low metallicity sources (e.g. Maseda et al., 2019; Maseda et al., 2020). We have mitigated this possibility leaving the U parameter free to vary down to values of log(U)=-4, and metallicities as low as . Even with this configuration, the best solution remains a galaxy around and with . While passive sources at are already emerging in JWST early observations (Carnall et al., 2022b), the existence of a massive source with log(M∗/M⊙)11.56, dusty and quenched at in a small survey volume is very unexpected. The majority of quiescent galaxies that have spectroscopy and studied individually in detail at to date do not show evidence of abundant dust content (Valentino et al., 2020). In fact, little evidence exists for widespread dust in quiescent galaxies out to the highest redshifts currently probed (Schreiber et al., 2018; Whitaker et al., 2021), apart from some exceptions (Gobat et al., 2018; Magdis et al., 2021), suggesting that it likely does get rapidly destroyed . Given the quality of the new JWST imaging products, the accurate photometric treatment and the extended range of parameters accounted for by our SED fitting, we consider 2-KLAMA as a very strong candidate for a quiescent galaxy whose dust content has yet to be destroyed, a possible indicator of recent quenching.
-
•
Extinguished high- star-forming sources (): the daily recording of the farthest objects with JWST is currently providing candidates up to (e.g. Harikane et al., 2022). These sources are consistent with primordial young star forming galaxies, with a negligible dust content. Indeed, the common LBG technique used to select them privileges UV blue and bright spectral types. In our approach we include redder populations, and we do not limit the extinction parameter while fitting the observed SEDs. Surprisingly, we classify four objects (IDs 1-PENNAR, 14-KABERLABA, 15-HOLLAR, 19-SCHBANZ) at , with mature stellar populations, log(M∗/M⊙)9-11, that differ from already detected JWST sources at similar cosmic epochs for their extreme dust content (mag). Fudamoto et al. (2021) report the ALMA C ii detection of two sources at , providing additional evidence for the existence of obscured systems that could contribute on the order of to the cosmic SFRD. Such objects are currently unexplained by theoretical models. Ferrara et al. (2022) provide a possible explanation based on the assumption that dust has been efficiently ejected during the early stages of galaxy formation. Our results bring the attention to a potentially unexplored evolution of dust production and dust lifetime in the primeval Universe. In particular, we highlight source 1-PENNAR, the only object securely detected even in two MIRI bands (F770W and F1000W). The NIRCAM+MIRI photometry provides stronger constraints on the SED fitting, turning a primary solution at (see Fig 2, with the source sitting on the extrapolated MS at (see Fig. 3 bottom-right). Compared to the other UV bright sources at the same cosmic epoch, #1 has an extinction best-fit of mag.
By selecting and photometrically characterizing NIRCam F444W sources in the SMACS0723 deep field that lack a F200W counterpart, we provide only a first glimpse on the potential of the JWST to uncover new galaxy populations. We remind that their classification remains still speculative, until upcoming spectroscopic follow-ups will systematically constrain their distance and nature.
Acknowledgements
We thank the anonymous reviewer for his/her comments, that improved the work quality and flow. GR and LB acknowledge the support from grant PRIN MIUR 2017 - 20173ML3WW 001. We thank Daniel Stark and Michael Topping for providing the stellar masses and SFR for the sample of REBELS galaxies reported in our Figure 3. We thank Andrea Ferrara and Pavel Kroupa for their feedbacks and comments.
DATA AVAILABILITY
The data underlying this article will be shared on reasonable request to the corresponding author.
References
- Adams et al. (2022) Adams N. J., et al., 2022, arXiv e-prints, p. arXiv:2207.11217
- Alcalde Pampliega et al. (2019) Alcalde Pampliega B., et al., 2019, ApJ, 876, 135
- Atek (2022) Atek H. e. a., 2022, arXiv e-prints, p. arXiv:2207.12338
- Barrufet et al. (2022) Barrufet L., et al., 2022, arXiv e-prints, p. arXiv:2207.14733
- Bertin & Arnouts (1996) Bertin E., Arnouts S., 1996, A&AS, 117, 393
- Bisigello et al. (2018) Bisigello L., Caputi K. I., Grogin N., Koekemoer A., 2018, A&A, 609, A82
- Bruzual & Charlot (2003) Bruzual G., Charlot S., 2003, MNRAS, 344, 1000
- Burrows et al. (2006) Burrows A., Sudarsky D., Hubeny I., 2006, ApJ, 640, 1063
- Calzetti et al. (2000) Calzetti D., Armus L., Bohlin R. C., Kinney A. L., Koornneef J., Storchi-Bergmann T., 2000, ApJ, 533, 682
- Caputi et al. (2021) Caputi K. I., et al., 2021, ApJ, 908, 146
- Carnall et al. (2018) Carnall A. C., McLure R. J., Dunlop J. S., Davé R., 2018, MNRAS, 480, 4379
- Carnall et al. (2022a) Carnall A. C., et al., 2022a, arXiv e-prints, p. arXiv:2207.08778
- Carnall et al. (2022b) Carnall A. C., et al., 2022b, arXiv e-prints, p. arXiv:2208.00986
- Casey et al. (2019) Casey C. M., et al., 2019, ApJ, 887, 55
- Castellano et al. (2022) Castellano M., et al., 2022, arXiv e-prints, p. arXiv:2207.09436
- Coe et al. (2019) Coe D., et al., 2019, ApJ, 884, 85
- Da Cunha et al. (2015) Da Cunha E., et al., 2015, ApJ, 806, 110
- Donnan et al. (2022) Donnan C. T., et al., 2022, arXiv e-prints, p. arXiv:2207.12356
- Dunlop et al. (2013) Dunlop J. S., et al., 2013, MNRAS, 432, 3520
- Enia et al. (2022) Enia A., et al., 2022, ApJ, 927, 204
- Ferrara et al. (2022) Ferrara A., Pallottini A., Dayal P., 2022, arXiv e-prints, p. arXiv:2208.00720
- Finkelstein et al. (2022) Finkelstein S. L., et al., 2022, arXiv e-prints, p. arXiv:2207.12474
- Fudamoto et al. (2021) Fudamoto Y., et al., 2021, Nature, 597, 489
- Giavalisco (2002) Giavalisco M., 2002, ARA&A, 40, 579
- Gobat et al. (2018) Gobat R., et al., 2018, Nature Astronomy, 2, 239
- Gruppioni et al. (2020) Gruppioni C., et al., 2020, Astronomy & Astrophysics, 643, A8
- Harikane et al. (2022) Harikane Y., et al., 2022, arXiv e-prints, p. arXiv:2208.01612
- Ikarashi et al. (2022) Ikarashi S., Ivison R. J., Cowley W. I., Kohno K., 2022, A&A, 659, A154
- Knudsen et al. (2005) Knudsen K. K., et al., 2005, ApJ, 632, L9
- Koekemoer et al. (2013) Koekemoer A. M., et al., 2013, ApJS, 209, 3
- Kroupa (2001) Kroupa P., 2001, MNRAS, 322, 231
- Labbé et al. (2013) Labbé I., et al., 2013, ApJ, 777, L19
- Madau & Dickinson (2014) Madau P., Dickinson M., 2014, ARAA, 52, 415
- Magdis et al. (2021) Magdis G. E., et al., 2021, A&A, 647, A33
- Marasco et al. (2022) Marasco A., et al., 2022, arXiv e-prints, p. arXiv:2209.02726
- Maseda et al. (2019) Maseda M. V., Franx M., Chevallard J., Curtis-Lake E., 2019, MNRAS, 486, 3290
- Maseda et al. (2020) Maseda M. V., et al., 2020, MNRAS, 493, 5120
- Mayya et al. (2004) Mayya Y. D., Bressan A., Rodríguez M. e. a., 2004, ApJ, 600, 188
- McGaugh et al. (2017a) McGaugh S. S., Schombert J. M., Lelli F., 2017a, ApJ, 851, 22
- McGaugh et al. (2017b) McGaugh S. S., Schombert J. M., Lelli F., 2017b, ApJ, 851, 22
- Naidu et al. (2022) Naidu R. P., et al., 2022, arXiv e-prints, p. arXiv:2207.09434
- Novak et al. (2017) Novak M., et al., 2017, Astronomy & Astrophysics, 602, A5
- Pontoppidan et al. (2022) Pontoppidan K., et al., 2022, arXiv e-prints, p. arXiv:2207.13067
- Pope et al. (2017) Pope A., et al., 2017, ApJ, 838, 137
- Rieke et al. (2005) Rieke M. J., Kelly D., Horner S., 2005, SPIE, 5904
- Rieke et al. (2015) Rieke G. H., et al., 2015, PASP, 127, 584
- Rodighiero et al. (2007) Rodighiero G., Cimatti A., Franceschini A. e. a., 2007, A&A, 470, 21
- Rodríguez-Muñoz et al. (2022) Rodríguez-Muñoz L., et al., 2022, MNRAS, 510, 2061
- Salmon et al. (2020) Salmon B., et al., 2020, ApJ, 889, 189
- Schreiber et al. (2015) Schreiber C., et al., 2015, A&A, 575, A74
- Schreiber et al. (2018) Schreiber C., et al., 2018, A&A, 611, A22
- Scoville et al. (2015) Scoville N., et al., 2015, ApJ, 800, 70
- Shapley (2011) Shapley A. E., 2011, ARA&A, 49, 525
- Stark et al. (2013) Stark D. P., Schenker M. A., Ellis R., Robertson B., McLure R., Dunlop J., 2013, ApJ, 763, 129
- Straatman et al. (2016) Straatman C. M. S., et al., 2016, ApJ, 830, 51
- Sun et al. (2021) Sun F., et al., 2021, ApJ, 922, 114
- Talia et al. (2021) Talia M., Cimatti A., Giulietti M. e. a., 2021, ApJ, 909, 23
- Topping et al. (2022) Topping M. W., et al., 2022, MNRAS,
- Umehata et al. (2020) Umehata H., et al., 2020, A&A, 640, L8
- Valentino et al. (2020) Valentino F., et al., 2020, ApJ, 889, 93
- Vilella-Rojo et al. (2021) Vilella-Rojo G., et al., 2021, A&A, 650, A68
- Wang et al. (2016) Wang T., et al., 2016, ApJ, 816, 84
- Wang et al. (2019) Wang T., et al., 2019
- Whitaker et al. (2017) Whitaker K. E., Pope A., Cybulski R., Casey C. M., Popping G., Yun M. S., 2017, ApJ, 850, 208
- Whitaker et al. (2021) Whitaker K. E., et al., 2021, Nature, 597, 485
- Williams et al. (2019) Williams C. C., et al., 2019, ApJ, 884, 154
- Yamaguchi et al. (2019) Yamaguchi Y., et al., 2019, ApJ, 878, 73
- Zavala et al. (2022) Zavala J. A., et al., 2022, arXiv e-prints, p. arXiv:2208.01816
| ID | RA | DEC | fF090W | fF150W | fF200W | fF277W | fF356W | fF444W | fF770W | fF1000W | fF1500W | fF1800W | |
|---|---|---|---|---|---|---|---|---|---|---|---|---|---|
| h m s | d m s | nJy | nJy | nJy | nJy | nJy | nJy | nJy | nJy | nJy | nJy | ||
| 1 PENNAR | 7:23:16.79 | -73:26:41.72 | 0.170.44 | 0.330.28 | 8.110.83 | 14.091.40 | 29.102.91 | 72.137.21 | 353.5977.16 | 393.37155.32 | 0.036.66 | 178.68165.84 | |
| 2 KLAMA | 7:22:50.39 | -73:28:17.63 | 0.330.48 | 0.010.35 | 1.430.33 | 136.9913.70 | 248.8124.88 | 447.8244.78 | – | – | – | – | |
| 3 STOCKE | 7:22:48.73 | -73:29:05.09 | 0.430.43 | 3.830.80 | 7.170.82 | 37.223.73 | 115.3911.54 | 185.9918.56 | – | – | – | – | |
| 4 LAITEN | 7:23:26.72 | -73:26:10.13 | 1.120.99 | 12.351.24 | 18.541.27 | 103.6810.37 | 191.521.93 | 204.512.09 | 799.6979.97 | 616.41268.20 | 1084.28211.57 | 28.49176.89 | |
| 5 ORKENTAAL | 7:22:56.99 | -73:29:23.35 | 2.641.11 | 6.590.65 | 6.300.90 | 14.461.96 | 21.382.14 | 33.923.38 | – | – | – | – | |
| 6 PRUDEGAR | 7:22:39.56 | -73:30:08.24 | -0.270.67 | 13.551.83 | 20.432.04 | 30.533.05 | 26.462.65 | 27.842.79 | 35.2774.49 | -10.4121.31 | 55.2838.01 | 160.797.6 | |
| 7 TULLE | 7:22:42.47 | -73:29:47.51 | 6.901.49 | 21.782.48 | 28.992.90 | 23.382.34 | 23.192.32 | 15.031.50 | – | – | – | – | |
| 8 LAMARA | 7:23:10.87 | -73:27:57.67 | 0.530.59 | 7.170.71 | 7.590.77 | 3.030.52 | 4.760.50 | 11.091.11 | – | – | – | – | |
| 9 BUSCAR | 7:22:56.30 | -73:28:42.20 | -0.320.70 | 3.980.76 | 14.461.10 | 34.742.57 | 17.941.80 | 21.621.78 | – | – | – | – | |
| 10 BALDE | 7:22:46.86 | -73:28:54.08 | 6.010.79 | 6.140.65 | 7.880.78 | 16.841.68 | 15.611.56 | 19.891.99 | – | – | – | – | |
| 11 SCHACHER | 7:22:33.28 | -73:29:11.18 | 3.320.58 | 10.381.18 | 10.101.19 | 14.711.47 | 10.601.59 | 12.391.75 | – | – | – | – | |
| 12 TAAL | 7:23:25.60 | -73:26:12.01 | 6.741.08 | 6.920.92 | 13.171.31 | 28.462.84 | 14.721.47 | 29.812.98 | – | – | – | – | |
| 13 BISCHOFARN | 7:23:05.46 | -73:26:29.98 | 0.110.63 | 20.982.10 | 5.350.54 | 27.542.75 | 28.952.90 | 24.922.49 | – | – | – | – | |
| 14 KABERLABA | 7:22:33.73 | -73:28:03.54 | -0.770.60 | 0.820.38 | 0.470.35 | 0.600.50 | 2.240.40 | 21.012.10 | – | – | – | – | |
| 15 HOLLAR | 7:22:44.02 | -73:29:15.86 | 0.430.57 | 19.081.91 | 17.901.79 | 14.791.48 | 17.211.72 | 29.702.97 | – | – | – | – | |
| 16 RUTZER | 7:23:09.34 | -73:27:21.35 | 12.851.86 | 7.211.03 | 17.711.79 | 24.132.44 | 57.425.74 | 38.843.88 | – | – | – | – | |
| 17 MOSELE | 7:22:47.69 | -73:27:47.12 | 2.961.07 | -0.480.72 | -0.090.59 | 11.681.57 | 9.951.19 | 21.411.76 | – | – | – | – | |
| 18 MORAR | 7:22:44.02 | -73:29:15.86 | 0.560.38 | 2.610.58 | 5.820.74 | 43.814.38 | 130.441.30 | 184.3418.43 | – | – | – | – | |
| 19 SCHBANZ | 7:23:09.34 | -73:27:21.35 | -0.250.55 | 0.700.55 | 0.970.45 | 0.100.72 | 4.000.65 | 11.511.15 | – | – | – | – | |
| 20 BERGA | 7:22:47.69 | -73:27:47.12 | -0.430.47 | 6.290.63 | 4.960.80 | 15.211.52 | 12.991.30 | 15.281.52 | – | – | – | – |
| ID | z | AV | z | AV | ||||||||
|---|---|---|---|---|---|---|---|---|---|---|---|---|
| 1st solution | 2nd solution | |||||||||||
| 1 PENNAR | 12.11 | 9.11 | 1.12 | 2.36 | 5.76 | 3.37 | 8.51 | 0.45 | 4.41 | 17.80 | 1848.55 | 2.650.35 |
| 2 KLAMA | 5.40 | 11.56 | -0.56 | 4.74 | 56.87 | – | – | – | – | – | 21375.50 | – |
| 3 STOCKE | 6.05 | 10.41 | 1.80 | 3.18 | 1.40 | 2.53 | 9.48 | 0.81 | 5.17 | 7.24 | 3509.75 | – |
| 4 LAITEN | 2.98 | 8.89 | 0.92 | 3.59 | 24.89 | 5.28 | 9.93 | 1.19 | 2.14 | 32.45 | 4866.44 | 1.40.1 |
| 5 ORKENTAAL | 6.05 | 8.79 | 0.27 | 1.58 | 1.46 | 7.77 | -0.86 | 7.47 | 95.47 | – | ||
| 6 PRUDEGAR | 0.48 | 7.22 | -2.47 | 2.83 | 0.35 | 2.13 | 8.06 | -0.74 | 0.65 | 3.81 | 150.88 | – |
| 7 TULLE | 0.09 | 5.84 | -4.37 | 2.60 | 0.15 | – | – | – | – | – | 28.63 | – |
| 8 LAMARA | 0.24 | 5.21 | -2.87 | 0.67 | 19.20 | 8.76 | 7.83 | -0.36 | 0.06 | 30.43 | 29.92 | – |
| 9 BUSCAR | 0.35 | 7.14 | -3.79 | 5.49 | 17.63 | 11.91 | 8.80 | 0.72 | 0.57 | 23.73 | 231.24 | – |
| 10 BALDE | 5.14 | 8.32 | -0.15 | 0.59 | 0.70 | – | – | – | – | – | 210.78 | – |
| 11 SCHACHER | 0.47 | 6.76 | -2.81 | 1.81 | 3.49 | 1.89 | 7.66 | -1.48 | 4.36 | 64.77 | – | |
| 12 TAAL | 3.54 | 7.64 | -0.41 | 1.07 | 7.97 | 0.42 | 5.93 | -2.19 | 3.14 | 19.73 | 357.56 | 1.50.1 |
| 13 BISCHOFARN | 1.44 | 6.70 | 2.98 | 67.37 | 5.38 | 8.55 | -0.23 | 0.79 | 74.03 | 275.26 | 1.70.2 | |
| 14 KABERLABA | 11.06 | 11.29 | 3.22 | 5.83 | 0.13 | 6.01 | 9.40 | 1.48 | 5.69 | 2.20 | 48.07 | – |
| 15 HOLLAR | 8.85 | 8.59 | 0.22 | 0.12 | 1.95 | 9.70 | 8.73 | 0.31 | 0.15 | 2.57 | 109.05 | – |
| 16 RUTZER | 4.43 | 7.54 | -0.82 | 1.16 | 22.13 | – | – | – | – | – | 209.19 | 12.33.9 |
| 17 MOSELE | 0.35 | 6.07 | -2.37 | 3.68 | 0.15 | 5.46 | 8.18 | 0.07 | 1.06 | 0.68 | 33.91 | – |
| 18 MORAR | 4.88 | 10.26 | 1.82 | 3.94 | 4.02 | 2.60 | 9.56 | 0.93 | 5.47 | 12.42 | 6802.54 | – |
| 19 SCHBANZ | 8.26 | 8.49 | 0.12 | 4.55 | 4.85 | – | – | – | – | – | 8.19 | 39.533.6 |
| 20 BERGA | 5.19 | 8.28 | -0.43 | 0.30 | 4.36 | 2.91 | 7.65 | -0.47 | 1.32 | 5.53 | 128.92 | – |
vspace-0.3cm