]These authors contributed equally to this work.; rkromani@gmail.com
]These authors contributed equally to this work.; rkromani@gmail.com
A Stress Induced Source of Phonon Bursts and Quasiparticle Poisoning
Abstract
The performance of superconducting qubits is degraded by a poorly characterized set of energy sources breaking the Cooper pairs responsible for superconductivity, creating a condition often called “quasiparticle poisoning”. Recently, a superconductor with one of the lowest average quasiparticle densities ever measured exhibited quasiparticles primarily produced in bursts which decreased in rate with time after cooldown. Similarly, several cryogenic calorimeters used to search for dark matter have also observed an unknown source of low-energy phonon bursts that decrease in rate with time after cooldown. Here, we show that a silicon crystal glued to its holder exhibits a rate of low-energy phonon events that is more than two orders of magnitude larger than in a functionally identical crystal suspended from its holder in a low-stress state. The excess phonon event rate in the glued crystal decreases with time since cooldown, consistent with a source of phonon bursts which contributes to quasiparticle poisoning in quantum circuits and the low-energy events observed in cryogenic calorimeters. We argue that relaxation of thermally induced stress between the glue and crystal is the source of these events, and conclude that stress relaxation contributes to quasiparticle poisoning in superconducting qubits and the athermal phonon background in a broad class of rare-event searches.
I Introduction
Coherence times are a key benchmark for the performance of superconducting qubits, a technology from which quantum computers may be constructed [1]. These times have improved by many orders of magnitude over the past two decades [2] but remain limited by mechanisms capable of breaking Cooper pairs in the superconducting circuit, creating a condition often called quasiparticle poisoning [3, 4, 5]. Stray infrared radiation (IR) [6, 7, 8], environmental ionizing radiation [9, 10, 11, 12], and resonant absorption of microwave photons [13, 14] have all been shown to create excess quasiparticles in superconducting quantum circuits. However, identification of the full set of poisoning mechanisms is yet incomplete, as suggested by other results in which efforts were made to shield and isolate superconducting circuits [15, 10].
Notably, a superconductor was recently shown to have one of the lowest residual quasiparticle densities ever measured in a quantum circuit [15]. In this superconductor, two key behaviours were observed. First, the density of quasiparticles decreased as a function of time after the superconductor was cooled down. Second, the quasiparticles appeared in ms-long “bursts” which were short compared to the time between bursts. Together, these behaviors indicate that the cause of the quasiparticle background is unlikely to be fully explained by photons and ionizing radiation.
Similarly, multiple dark-matter experiments using cryogenic crystals observe excess low-energy (10–100 eV scale) events of an unknown origin [16, 17, 18]. Measurements suggest a background source that is non-ionizing [19, 20] and which also decreases with time since cooldown [19, 18, 21, 22]; it is not well-explained by any known radiogenic or instrumental backgrounds.
The burst-like nature and variation in rate with time since cooldown suggest a common mechanism for these backgrounds and disfavor the sources of nonequilibrium quasiparticles thus far identified by the superconducting-qubit and dark-matter communities. For example, neither black-body IR that leaks from higher temperature stages [6, 7] nor the slow annihilation of quasiparticles near the superconducting gap [23] would create burst-like events. Short-lived radiogenic backgrounds could display a similar time dependence, but this dependence would not reset with thermal cycling. The lack of any ionization production in the germanium detectors used in Refs. [20, 19] further limits the viable hypotheses because both electronic and nuclear recoils produce observable ionization signals in this energy range [24].
The most probable hypothesis is that multi-atom lattice rearrangements, i.e. microfractures, causes these phonon bursts. The athermal phonons released in this process can break Cooper pairs in a qubit’s superconducting films or be directly sensed in an athermal phonon sensor. If these microfractures are driven by stress caused by differential thermal contraction of a detector’s materials or support structure—glue, clamps, metal films, etc.—this hypothesis also naturally explains the time variation since cooldown: the system is slowly releasing thermal stress and coming into equilibrium.
The CRESST dark-matter experiment has shown that stress-driven macroscopic fractures can cause phonon bursts [25]. Although the properties of their events—energy scale and time dependence—do not match the phonon bursts reported here, they provide an existence proof for stress-induced backgrounds in cryogenic devices.
An earlier iteration of the experiment clamped sapphire crystals with sapphire spheres, which tightened into the crystals at cryogenic temperatures and produced highly concentrated stress at the sphere/crystal contact points. Their detectors exhibited an excess rate of keV- to MeV-scale phonon bursts and macroscopic cracking at the clamp contact points. Redesigning the structural support to reduce the clamping force decreased this background by orders of magnitude [17, 25]. The observed bursts were found to be non-Poissonian, to not have noticeable time dependence in rate, and to occur at a much higher energy scale. These properties are incompatible with the low-energy background currently observed in cryogenic calorimeters and superconducting circuits; a different explanation is needed.
II Experimental Setup
We used two silicon crystals to study the effects of stress on the athermal phonon background: one mounted with a typical High Stress (HS) method and the other held with a new Low Stress (LS) method. The LS crystal was suspended by three sets of two 50 m diameter aluminium wires (see Fig. 1, B), bonded to aluminium pads on the surface of the crystal and to a gold-plated copper mount which was attached rigidly to the cryogenic system. This reasonably represents a significantly lower-stress mounting scheme compared to glue- or clamp-based schemes and that it is naturally less susceptible to vibrations. The HS crystal was glued directly to the gold-plated copper mount using a thin layer of GE/IM7031 varnish covering the back side of the calorimeter, which contracts relative to the silicon while cooling [26], inducing stress in the crystal. We chose this configuration because it was straightforward to implement, and it is representative of the adhesive-based mounting schemes (e.g. vacuum grease [15, 10], silver epoxy [10]) often used to hold crystals that host quantum circuits. Additionally, the dark matter experiment that observed the largest low-energy excess [19] used epoxy, suggesting that glue may be a particularly effective source of stress-induced events.
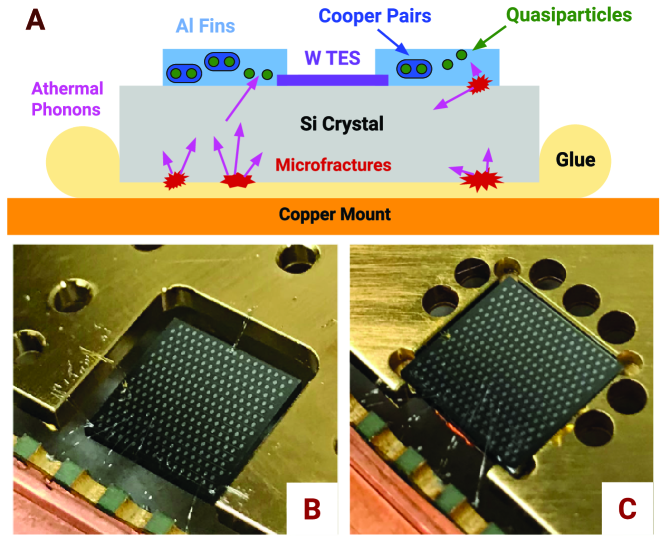
Athermal phonon sensors optimized for high collection efficiency are a natural choice to study an anomalous phonon population capable of breaking Cooper pairs. We instrumented both the LS and HS crystals with functionally identical arrays of Quasiparticle-trap-assisted Electrothermal Feedback Transitions Edge Sensors (QETs) [27, 28], designed to be sensitive to athermal phonons with energies larger than the aluminium superconducting bandgap. The phonons are collected with (10%) efficiency and are read out with eV-scale energy resolution [29]. These sensors couple thin-film aluminium “fins,” where athermal phonons are absorbed from the silicon crystal and converted into quasiparticles, with tungsten Transition Edge Sensors (TESs) that change resistance as they are heated by quasiparticle absorption. This readout scheme is broadly used in cryogenic calorimeters that search for low-energy signals from dark matter and neutrinos [16, 17, 18] and is optimally sensitive to any athermal phonons which may contribute to quasiparticle poisoning in quantum circuits.
Aside from their mounting schemes, the HS and LS calorimeters were intentionally constructed and operated in as similar a manner as possible. The phonon-sensor designs are identical, and the sensors were fabricated onto (and the calorimeters later cut from) the same silicon wafer at Texas A&M University. The superconducting transition temperature () is an important indicator of performance for TES-based sensors [30]. We measured only a modest 20% difference between the TES transition temperatures for the two calorimeters (HS, 44.3 mK, LS, 53.0 mK), which also showed qualitatively similar sensor performance. These similarities suggest that we were largely successful in producing a matched calorimeter pair capable of isolating differences in background rates due to variation in structural support. Additionally, they were characterized together in a common optical cavity with a direct line of sight between the calorimeters and were read out using matching electronics, thereby minimizing operational differences. The dilution refrigerator in which this experiment was performed is located in a basement lab at the University of California, Berkeley, where no special efforts were taken to minimize radioactive backgrounds.
III Data Analysis
III.1 Measured Background
We observed a background event rate approximately two orders of magnitude larger in the HS device compared to the LS device. With the well understood electrothermal response of our phonon sensors, we identified the background as composed of individual events occurring in lengths of time shorter than the (10 s) calorimeter response time, rather than as a continuous power source. The background spectra are shown in Fig. 2. We report the energy of a given event as the energy absorbed in the TES (which is invariant to small changes in film properties, as described in Sec. V.4). Note that at high energies the calorimeters saturate such that all very energetic events appear in the energy range 85–170 eV. The exact energy scale and shape of the saturation depends on tungsten film properties, which were observed to vary between the two devices (see Sec. V.1), leading to the differences in saturation observed between the two devices.
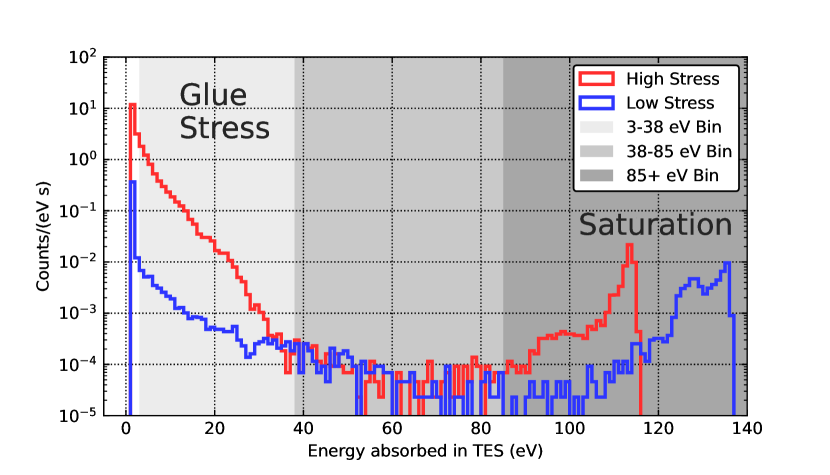
The background was divided into three energy bins for further analysis. The highest-energy events (85+ eV) with a saturated calorimeter response were binned together. In the range 38–85 eV, the backgrounds observed in HS and LS were similar; we therefore grouped them together into one bin. In the lowest-energy bin (3–38 eV), the backgrounds observed in the HS and LS calorimeters appear to substantially differ.
III.2 Time Dependence of Background Rates
To study the time dependence of these backgrounds, 80 hours of data were taken over a 5 d period, starting approximately 3 d after starting the cooldown of the calorimeters. During this period, the rate in each of the three energy bins (see Fig. 2) was measured 70 for each calorimeter in 1 hour time bins (see Table 4).
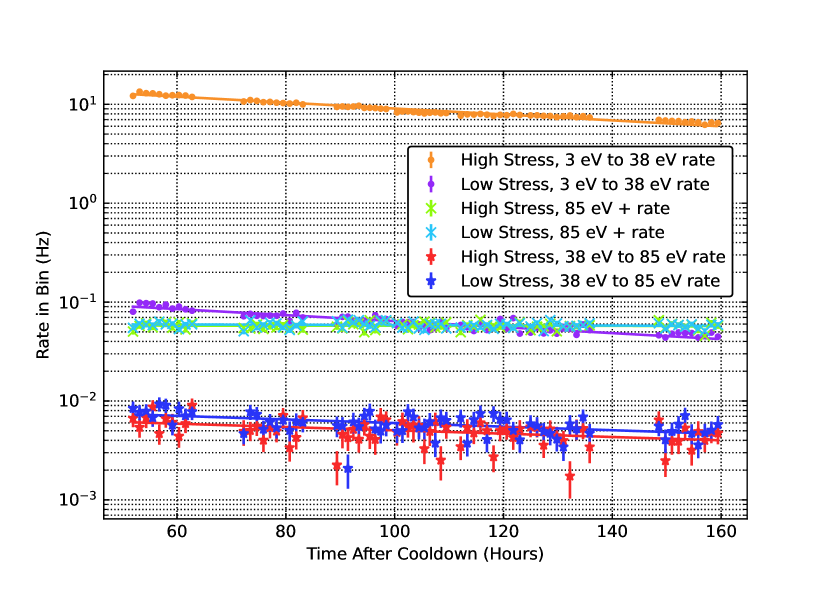
As shown in Fig. 3, the rates in both the 3–38 and 38–85 eV bins decreased with time, whereas the rates in the highest-energy bin (85+ eV) were constant (consistent with muons and other high-energy backgrounds). An exponential was fit to each time-dependent rate to estimate the relevant timescale; the results are summarized in Table 1. We find that the 3–38 and 30–85 eV rates decreased with a time constant of 6–10 d, broadly consistent with the quasiparticle measurements in Ref. [15] and calorimetric results in Refs. [19, 22, 21]. We did not test whether the observed rates changed after thermal cycling, and plan to study this in future work.
In the lowest-energy bin in the HS calorimeter, a single exponential does not sufficiently describe the time-dependent rate (/(dof) = 4192/68). This bin is especially well-measured because it contains 2–3 orders of magnitude more events than any of the other bins. There may be similar deviations from our exponential model in the other time-series data that cannot be detected due to insufficient statistics. A sum of exponentials or a power law (as described in Ref. [15]) may be a more appropriate fit to the data.
As the HS and LS calorimeters were functionally identical aside from their mounting method, we attribute the difference in their 3–38 eV backgrounds as due to stress from the GE varnish contracting relative to the HS crystal. When this stress relaxes in the form of a microfracture, many eV-scale bonds are broken effectively instantaneously with respect to the calorimeter response, releasing phonon energy which our sensors read out as a single event. The relatively short decay time (6–10 d) indicates that non-artificially activated radioactive backgrounds cannot be responsible for the observed events. The scintillation mechanism suggested in Ref. [31] cannot compose a large fraction of the observed background because it decreased with time and was not coincident between our two detectors, which were closely co-located in the same optical cavity. IR photon backgrounds would not decrease with time given constant cryogenic performance (as was observed), would not be concentrated into events with tens of eV deposited within the 10 s calorimeter response time, and would be expected to be coincident between the two detectors.
Within the 38–85 eV range, the event rate increased quasi-exponentially with decreasing energy and decreased with time, similar to the stress-relaxation process observed at lower energies in the HS calorimeter. However, the magnitude, spectral shape, and time dependence of the 38–85 eV rate were consistent in both devices (see Table 1), indicating that mount-related stress may not be the cause of the background in this energy range. We hypothesize that stress in the QET thin films may be responsible. As the crystal, films, and photolithographically etched design are all essentially identical between the two devices, this background (if present) should be very similar between the two calorimeters. Both differential thermal contraction between the crystal and films during cooldown and relative strain created during film deposition are natural sources of such stress.
To demonstrate the plausibility of film stresses as a source of background events, we briefly sketch the physics of an aluminium film that becomes stressed when cooling from room temperature to close to absolute zero. Relative to a silicon substrate, aluminium will contract by a factor of about 410-3 [32], yielding an energy density of MeV/. Given the 600 nm aluminium film thickness, the stress energy per unit area is of order 35 meV/Å2 at the Al/Si interface. This is comparable to the 40–100 meV/Å2 fracture energy density thresholds reported in Ref. [33], suggesting that film microfractures via this mechanism are plausible.
III.3 Inferred Residual Quasiparticle Density Scales
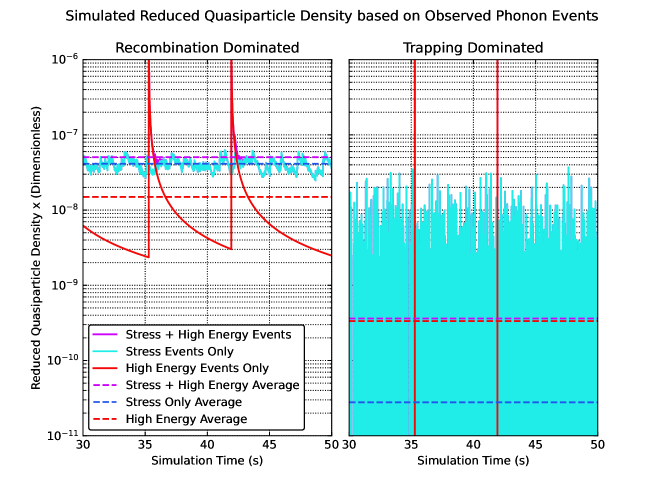
To contextualize our observation of stress-induced athermal phonons for the superconducting qubit community, we estimate reduced quasiparticle densities based on simulations described in Sec. V.6 and Appendix C. We simulate the quasiparticles produced by our observed stress-induced phonon events as well as high-energy backgrounds (muons, etc.) in two representative quasiparticle dynamics limits: the recombination-dominated qubit in Ref. [11] and the trapping-dominated superconductor in Ref. [15]. We emphasize that these estimates merely indicate that the properties and approximate scale of the quasiparticle densities simulated with our stress-induced events are in general agreement with the densities observed in previous experiments. Exact quasiparticle densities may differ significantly from our estimates because of the inherent variation among setups (glue type, superconductor geometry, etc.),
In the case of the qubit, we find that our stress-induced background would produce a reduced quasiparticle density of , while high-energy backgrounds should induce . The latter is in general agreement with the lower bound of estimated in Ref. [11] for high-energy backgrounds. For the system in Ref. [15], we find that our stress events induce , while high-energy backgrounds induce .
These estimates suggest that in the case of recombination-dominated systems similar to Ref. [11], stress backgrounds may already cause quasiparticle densities comparable to or greater than those created by high-energy backgrounds. Running qubits in low-background, underground environments [10] would presumably only increase the relative importance of stress-induced backgrounds. The striking similarities (time dependence of rate, etc.) between the residual quasiparticle densities observed in Ref. [15] and our athermal phonon population observations strongly suggest that stress-induced phonons were the primary cause of their quasiparticle bursts. The difference between our simulated quasiparticle densities and their observations suggests that stress events occurred at a higher rate or energy scale in their system.
IV Conclusion
We observed that mounting a cryogenically cooled silicon crystal with GE varnish leads to a large rate of athermal phonon events with energies in the range of 10s–100s of eV per event. The mounting of crystals with other glue-like substances—e.g., vacuum grease [15] or epoxy [10]—likely also results in a population of athermal phonons. Experimenters constructing quasiparticle-sensitive quantum circuits or low-threshold calorimeters on cryogenic crystals should therefore consider alternative mounting techniques (such as suspending crystals from wire bonds) that avoid use of adhesives.
More broadly, experiments which are sensitive to athermal phonon backgrounds may be sensitive to stress in their crystals from a variety of mechanisms. In addition to adhesive-based mounting schemes, using clamps to hold crystals can result in excess event rates [25]. Based on our results, we also hypothesize that stress between a device’s crystal substrate and thin films may be a source of stress-induced events (see Sec. III.2). A systematic program of stress reduction may substantially decrease both the low-energy excesses currently observed in cryogenic calorimeters used to search for dark matter and the time-dependent component of the quasiparticle poisoning problem in quantum circuits.
V Methods
V.1 Calorimeter Construction
In our calorimeters (see Fig. 1), phonons from the silicon crystal are absorbed by aluminium fins patterned onto the crystal’s surface. These phonons break Cooper pairs and create quasiparticles, which diffuse to and are absorbed by tungsten TESs coupled to the aluminium fins. When heated by quasiparticle thermalization, the current through a voltage-biased TES changes as the resistance changes. This change in current can be read out using SQUID electronics. A small gold pad on the silicon surface was connected to the thermal bath via a gold wire bond, thus removing thermal phonons from the crystal.
Our calorimeters were fabricated from a single 1 mm thick, 100 mm diameter polished high-purity wafer (Float Zone intrinsic silicon, 10 kOhm/square). Tungsten, aluminium, and gold films were deposited onto the crystal surface, and then photolithographically etched into the desired shapes.
The s of the HS and LS devices were measured to be 44.3 and 53.0 mK, respectively. The fraction of the surface area of the calorimeters (including sidewalls and bottoms) covered by “active” aluminium fins (which collect athermal phonons into TESs) and tungsten TESs (which collect sub-gap phonons) were 2.8% and 0.29%. The “passive” areal fractions of aluminium, tungsten, and gold were 3.3%, 0.29%, and 0.037%, respectively. By design, these coverage fractions were similar to the calorimeter used in Ref. [16]. We note that the fraction of “passive” aluminium and tungsten includes approximately half of the total number of QETs, which were not read out due to broken wire bonds. The broken readout channel was the same for both calorimeters.
V.2 Cryogenic Configuration
The HS and LS calorimeters were run inside a Cryoconcept HEXADRY UQT-B 200 dry (pulse tube based) dilution refrigerator. The refrigerator was located in a subbasement lab at the University of California, Berkeley, with minimal overburden and no radiation shielding (lead, etc.). No special radiopurity precautions were undertaken.
The configuration of the refrigerator and pulse tube cooler were optimized to transmit minimal vibrations from the pulse tube to the cold stages of the refrigerator. Further, both the HS and LS mounting schemes are relatively insusceptible to vibrations. We operated the refrigerator in a “pulse tube off” configuration for short periods of time (up to 15 min) and did not measure any significant difference in noise, performance, or background (vs. pulse tube on) for either the HS or LS calorimeter. All data presented in this paper were recorded with the pulse tube on and with a stable refrigerator base temperature 10 mK. We have also studied a low-stress “resting” configuration in which the calorimeter was sitting directly on a copper surface without being glued down; these devices were extremely susceptible to pulse-tube vibrations.
The HS and LS calorimeters were located inside the same copper optical cavity, with a direct line of sight between them. The printed circuit boards used to read out the calorimetry signals were also located in this optical cavity, presumably leading to a subdominant scintillation background as described in Ref. [31]. This cavity was held at the temperature of the mixing chamber (10 mK) and was sealed with copper tape to increase light tightness. The mixing chamber and the optical cavity were located inside the refrigerator’s still thermal shield (1 K), which was in turn located inside 4 K and 50 K shields sealed inside a 300 K vacuum can. An external mu-metal shield was used to reduce internal magnetic fields.
V.3 Readout Signal Chain
The HS and LS calorimeters were read out using standard TES readout techniques (see, e.g., Ref. [27]). The current flowing through the TESs was read out using a SQUID amplifier on the 100 mK cold-plate stage of the dilution refrigerator. This SQUID was operated in a feedback mode and was controlled by room-temperature electronics. Data were collected continuously with a National Instruments PCIe-6376 DAQ operating at 1.25 MHz.
V.4 Data Collection and Energy Measurement
Approximately 80 hours of data were collected in 7 datasets, summarized in Table 4. For both the HS and LS calorimeters, each dataset was recorded as a continuous stream, and a threshold-based event selection was carried out with offline software. Pulses in the continuous data stream were found using an optimal filtering approach, and 20 ms traces (symmetric around the pulse) were recorded for each event. The resulting set of triggered events were then processed using an optimal filtering algorithm to measure pulse heights.
Thanks to the well understood electrothermal feedback mechanism in TESs [27], we can directly infer the energy absorbed in a TES from the size of a pulse. After determining the pulse height in units of current using the optimal filtering algorithm, we calculated the power absorbed in the TES in the infinite loop gain limit as
| (1) |
We multiplied this peak power by the integral of the pulse-fitting template (in units of time) to find the energy associated with the pulse. This method of calculating the energy absorbed in the TES is in general insensitive to the exact characteristics of the TES film (given films with similar which are significantly colder than , as was the case for our calorimeters). Note that the energy measured with this approach corresponds to the energy absorbed in the TES, rather than the energy deposited in the phonon system. As described in Appendix B, the latter can be estimated by assuming a phonon collection efficiency of 12.5.
In the case of saturation, the temperature of the TES rises significantly above and the electrothermal feedback mechanism fails to completely capture the energy absorbed in the TES. Therefore, the energy of saturated pulses measured using this approach will be underestimated. The energy at which this saturation takes place depends on the of the film, among other factors, leading to the variation in saturation energy seen in Fig. 2.
Because we did not directly calibrate the phonon collection efficiency, we report energy as absorbed in the TESs rather than energy deposited in the calorimeter (aside from the estimates in Appendix B). Given the phonon collection efficiencies observed in similar calorimeters [29], we can safely conclude that the events we observe are relevent to the observed low energy excess. Our analysis and conclusions are otherwise insensitive to the exact energy that the observed events deposit in the calorimeter.
V.5 Data Quality Cuts
To ensure a consistent detector response, only the events passing three sets of data-quality cuts were considered for analysis. Events were required to pass
-
•
a baseline cut requiring the magnitude of the pre-pulse baseline to be in a range associated with consistent detector response,
-
•
a slope cut requiring the slope of the baseline before and after a pulse to be consistent with steady-state detector operation, and
-
•
a chi-squared cut requiring the shape of the pulse to be consistent with a representative pulse template.
These cuts were designed to pass a large fraction of events. Passage fractions are summarized in Tables 5 and 6.
Pulses larger than a threshold associated with saturation failed to pass both the slope and chi-squared cuts, even for pulses associated with the expected response of the device. All such saturated pulses were therefore set to pass and were thus included in our reported (85+ eV) event rates. These pulses are outside of the main region of interest for this analysis.
Cut passage fraction as a function of time was monitored by finding the passage fraction of randomly acquired traces as a function of time. Our reported event rates have been corrected by this measured passage fraction to account for cut efficiency. Note that the passage fraction did not significantly vary over time and was never less than 0.85, indicating that cut-efficiency time dependence cannot be the source of the rate variation described in Sec. III.2.
V.6 Quasiparticle Density Simulations
For our quasiparticle density estimates, we use a zero dimensional model in which the quasiparticle dynamics for the reduced quasiparticle density, , are governed by
| (2) |
where and are the number densities of quasiparticles and Cooper pairs, respectively, is the constant associated with recombination in aluminium [34], is the trapping rate in a given system, and is the quasiparticle generation rate. We approximate by , where
| (3) |
is the phonon energy of the event in a device substrate, [35] is the collection efficiency of phonon event energy into quasiparticles, and are the area and thickness of the superconductor (qubits and ground plane combined), respectively, eV is the superconducting bandgap of aluminium, and is the Cooper pair density in aluminium.
We estimate for two systems. One system is recombination-limited (i.e., , modeled after the device in Ref. [11]), with 100% superconductor surface coverage and a superconductor thickness of 200 nm. In the other system, dominated by trapping (modeled after the device in Ref. [15]), we assume a 20 % coverage fraction, a 35 nm thick superconductor, and kHz. The properties of the two systems are summarized in Table 3.
In both systems, we use the actual measured behavior of our HS calorimeter to model and and thus construct and . For events under the saturation threshold, we use event energies and timing without modification. For saturated events, in simulations that include high-energy backgrounds, we assign an energy of 100 keV (similar to Ref. [34]); whereas, these events are assigned 0 eV for simulations without high-energy backgrounds. The datasets with zero energy from saturated events are designed to simulate the performance of a qubit operated in a well-shielded setup, such as an underground laboratory with good radiopurity controls where high-energy backgrounds would be greatly reduced (as suggested in Ref. [10]).
We numerically simulate with the constructed in 25 s time steps. After discarding an initial period, during which the simulation equilibrated, the simulated was plotted (see Fig. 5) and time averages were taken (see Table 2). Simulations were performed for each system—recombination and trapping dominated—with only high-energy backgrounds, with only stress backgrounds, and with both backgrounds. The results are summarized in Sec. III.3 and further discussed in Appendix C.
Acknowledgments
The authors thank Aaron Chou for encouraging the publication of these results and Bert G. Harrop for discussions of wire bonding techniques.
This study was performed by the SPICE/HeRALD collaboration in M. Pyle’s UC Berkeley laboratory. W.A.P. performed critical precursor work on resting calorimeters. The calorimeters used in this study were designed by C.F. and were fabricated at Texas A&M University by M. Platt. S.M., W.A.P., M.R., and R.K.R. developed the low-stress hanging technique, and M.R. and R.K.R. assembled the LS and HS calorimeters. DAQ and other software tools used in this analysis were designed by C.F., W.A.P., B. Serfass, B. Suerfu, and S.L.W. The main data analysis was undertaken by R.K.R. All authors read and approved the manuscript, which was written primarily by R.B., M. Pyle and R.K.R.
This work was supported by the U.S. Department of Energy (DOE) under Contract Nos. DE-AC02-05CH11231 (LBNL) and DE-AC05-76RL01830 (PNNL), through the Office of High Energy Physics Quantum Information Science Enabled Discovery (QuantISED) program, and through DOE Grant DE-SC020374 (TESSERACT). W.G. acknowledges support from the National High Magnetic Field Laboratory at Florida State University, which is supported by the National Science Foundation Cooperative Agreement No. DMR-1644779 and the state of Florida.
Appendix A Summary of Fits to Background Rate vs. Time Data
In Table 1, we summarize the fits to the data describing the background rate as a function of time.
| Stress, Bin | Relative Rate111Fit rate relative to the fit rate in the high stress 3–38 eV bin (60 hours after cooldown). | Decay Const. (1/d) | Fit (d) | /(dof) |
|---|---|---|---|---|
| High, 3–38 eV | 1.000 0.026 | 0.1659 0.0039 | 6.03 0.14 | 4192/68 |
| High, 38–85 eV | 0.093 0.023 | 10.8 2.7 | 93.5/68 | |
| High, 85+ eV | 0.0017 0.0070 | 90.7/68 | ||
| Low, 3–38 eV | 0.1678 0.0082 | 5.96 0.29 | 124.8/68 | |
| Low, 38–85 eV | 0.100 0.020 | 9.97 1.96 | 83.1/68 | |
| Low, 85+ eV | 0.0076 0.0062 | 70.2/68 |
Appendix B Comparison with Other Calorimetric Experiments
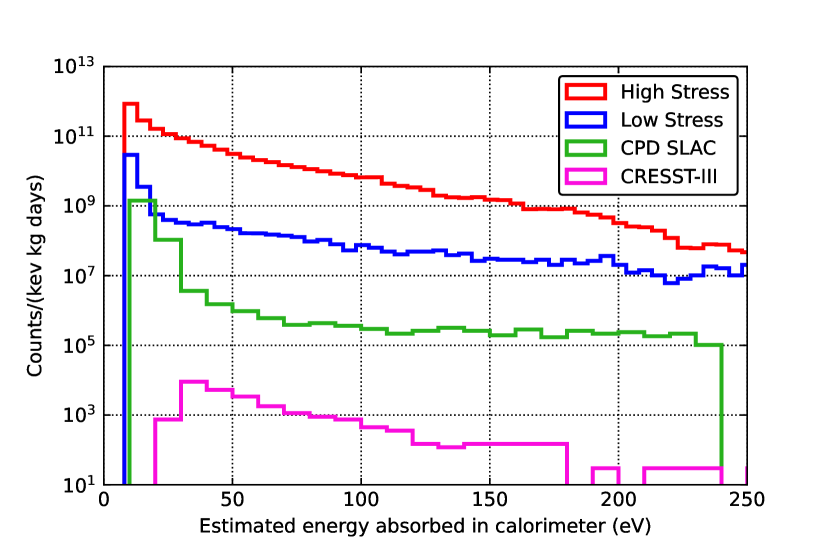
For comparison, we show the low-energy spectra measured with our HS and LS devices alongside the spectra observed in the CPD [16] and CRESST-III [17] calorimeters in Fig. 4. This comparison assumes a phonon collection efficiency of 12.5% in the HS and LS calorimeters, consistent with the observed collection efficiencies for devices of this type within (2) [16]. The low-energy excesses in all of these calorimeters were found to vary with time constants in the range of weeks [21, 22]. We hypothesize that varying levels of stress, either in the thin films (see section III.2) or as a result of the crystal mounting schemes, are responsible for some of the discrepancy in background rates. Note that the elevated background observed in the HS and LS calorimeters cannot be entirely due to a UC Berkeley cryostat-specific effect (e.g., larger environmental backgrounds), because the CPD detector from Ref. [16] was operated in the UC Berkeley cryostat and measured a background consistent with the published spectrum to within a factor of two.
Appendix C Estimating Quasiparticle Densities for Representative Quantum Systems
Athermal phonons incident on a superconductor can break Cooper pairs in the superconductor, creating quasiparticles which can cause decoherence of superconducting qubits. The impact of “high energy” backgrounds on quantum circuit performance has recently been the subject of significant study [11, 10, 34]. In this section, we comment on the importance of such high-energy backgrounds relative to stress-induced backgrounds.
To this end, we separate the background observed in our calorimeters into two regions: the first between 3 and 85 eV (the two lowest-energy bins in Fig. 2), and the second above 85 eV where the response of the detector saturates such that the energy deposited in the detector cannot be accurately reconstructed. We associate the first region with stress-related events (as argued in Sec. III.2) and the second region with cosmic-ray muons, high-energy gammas, neutrons, alphas, etc. interacting with the calorimeter. As we cannot accurately reconstruct the energy of these saturated events, we assume that each deposits 100 keV of energy in the phonon system, corresponding approximately to the energy deposited by a minimum ionizing muon [36] and similar to the average energy in Ref. [34].
In the simplest terms, we can compare the relative powers of the high-energy and stress-induced backgrounds. For example, in our first dataset, we see a rate of approximately 672 eV/s of stress events in the HS calorimeter, 10.9 eV/s in the LS calorimeter, and 5.8 keV/s of high-energy backgrounds in either calorimeter—summing the energies observed directly in the case of stress backgrounds and assuming 100 keV per saturated event in the case of high-energy backgrounds. In radiopure underground cryostats, as suggested in Ref. [10], the high-energy background power may be reduced by as much as a factor of , implying that stress-induced backgrounds may completely dominate the phonon-background power in such systems.
In many quantum circuits, the average quasiparticle density depends not only on the power of phonons incident on the superconducting elements but also on the average energy of the phonon events. Inspecting Eq. 2 in Sec. V.6, we note that if the system is dominated by recombination (i.e., is small, as in many quantum circuits [11]) and is not constant with time, as is the case for both high-energy and stress-related quasiparticle creation, then the time-averaged quasiparticle density will in general be smaller for infrequent high-energy events than for frequent low-energy events, even if both backgrounds have similar powers. Dense quasiparticle populations created by infrequent high-energy events will recombine more quickly than more diffuse quasiparticle populations created by frequent low-energy events.
We simulated the time-dependent quasiparticle density in two cases: a recombination-limited superconductor modeled after Ref. [11] and a trapping-dominated superconductor based on Ref. [15] (as discussed in Sec. III.3 and Sec. V.6). In both cases, we simulate the quasiparticle densities based on measured phonon event energies and timing in our HS calorimeter, assigning a phonon energy of 100 keV for saturated events. Figure 5 shows the simulated quasiparticle densities.
| Average Power | Recombination Dominated 111Modeled after a recombination-dominated qubit in Ref. [11]. | Trapping Dominated 222Modeled after a trapping-dominated superconductor in Ref. [15]. | |
|---|---|---|---|
| High-energy Backgrounds | 5.8 keV/s | ||
| Stress-induced Backgrounds | 672 eV/s | ||
| Stress + High Energy | 6.5 keV/s |
| Recombination-Dominated Superconductor 111Modeled after a recombination-dominated qubit in Ref. [11]. | Trapping-Dominated Superconductor 222Modeled after a trapping-dominated superconductor in Ref. [15]. | |
|---|---|---|
| Thickness | 200 nm | 35 nm |
| Superconductor Coverage Fraction | 100 % | 40% |
| Recombination Time Constant | (20 ns)-1 | (20 ns)-1 |
| Trapping Rate | 0 Hz | 8 kHz |
| Phonon Collection Efficiency | 50% | 50% |
In the recombination-dominated case (i.e., insignificant quasiparticle trapping), we simulate a time-averaged value of due to stress events only and if energy from high-energy backgrounds is included. The simulated reduced quasiparticle density due to high-energy backgrounds alone is , which is comparable to the lower bound estimated in Ref. [11] for background radiation. While it is notable that the stress-induced and high-energy contributions to are comparable in this recombination-dominated case, this will not be generally true; stress-induced events may occur in different systems with significantly different rates or energy scales that depend on details of the experimental setup.
Multiple works [37, 34] have suggested using quasiparticle traps to suppress the time-averaged residual quasiparticle density. We simulate such a system (based on Ref. [15]) with the same event-rate assumptions as for the recombination-dominated case and estimate if high-energy backgrounds are included and with only stress events included, approximately three orders of magnitude lower than measured in Ref. [15]. However, if we increase the average energy per stress event by a factor of , or equivalently increase the rate density of events by a factor of and assume energy is much more locally absorbed, we recover both with and without high-energy backgrounds (as observed shortly after cooldown in Ref. [15]). This increased energy scale ( keV) is still lower than the scale of events observed by CRESST [25], suggesting that some combination of increases in rate and energy scale plausibly explains the time-varying quasiparticle density observed in Ref. [15].
Previously discussed mitigation techniques include operating radiopure quantum circuits in low-background environments [10, 11] (which would not reduce the stress-induced phonon background) and using phonon sinks to reduce the background athermal phonon populations [34]. Phonon sinks would reduce the effects of the stress-induced phonon background if the phonons are generated by, e.g., glue-crystal microfractures. However, phonon sinks would not significantly mitigate the effects of film-crystal microfractures, e.g., between the crystal and superconducting qubit thin films. In the latter case, energy would presumably be efficiently transferred to the quasiparticle system of the qubit without involving significant crystal-scale phonon propagation. As we have shown, trapping quasiparticles within the qubit [37, 34] would somewhat mitigate the effects of stress-induced athermal phonons, but a resolution of the underlying athermal phonon problem is needed to achieve thermal densities of quasiparticles.
In summary, our simulations indicate that in the case of the recombination-dominated qubit, stress and high-energy backgrounds plausibly contribute about equally to quasiparticle poisoning, while experimental evidence [15] indicates that the quasiparticle density is dominated by stress-induced quasiparticles in the trapping-dominated superconductor. In either case, the rate and energy scale of stress-induced events will presumably vary from experiment to experiment, either increasing or decreasing the relative importance of this background.
Appendix D Waiting Time Distribution
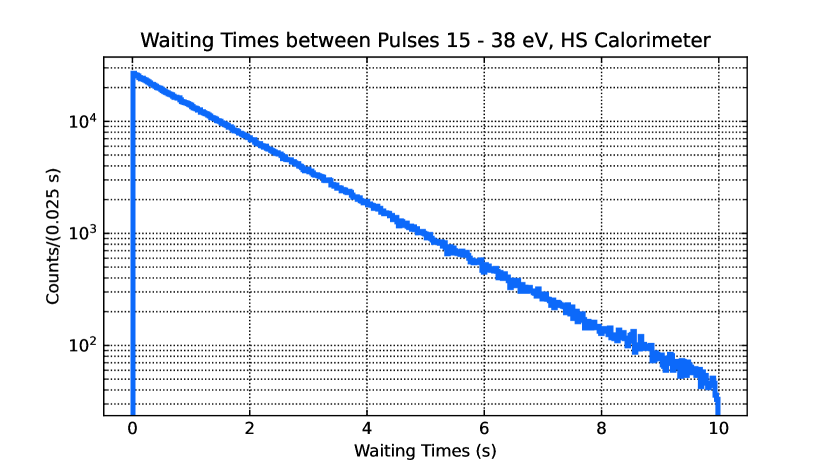
In Ref. [25], the distribution of waiting times between events was studied and used to argue that a fracture-like process was responsible for the observed excess background. Shown in Fig. 6, we performed a similar study of the distribution of waiting times in our HS calorimeter for low-energy events, which we argue are largely microfracture events.
The distribution of waiting times for our microfracture events does not agree with the deviations to the Possionian model presented in Ref. [25]. Notably, we are observing a fracture process taking place at an energy scale around three orders of magnitude lower than observed in the CRESST calorimeters. Presumably, even very similar fracture mechanisms may manifest differently at such different energy scales.
Appendix E Summary of Datasets Taken
In Table 4, we summarize the various datasets that were taken, specifying the start time, end time, and duration of each dataset.
| Dataset Number | Start Date | Start Time (UTC) | Length (Hours) |
|---|---|---|---|
| 1 | 2022-05-03 | 21:54:54 | 12.06 |
| 2 | 2022-05-04 | 18:15:33 | 12.06 |
| 3 | 2022-05-05 | 11:23:22 | 10.06 |
| 4 | 2022-05-05 | 22:25:41 | 10.06 |
| 5 | 2022-05-06 | 10:08:08 | 12.07 |
| 6 | 2022-05-06 | 22:58:07 | 12.07 |
| 7 | 2022-05-07 | 22:32:50 | 12.07 |
Appendix F Summary of Cut Passage Fraction
In Tables 5 and 6, we summarize the passage fractions of our data quality cuts, applied to the randomly triggered data and the threshold triggered data, respectively.
| Dataset No., Stress State | Baseline | Slope (Sequential) | Slope (Total) | (Sequential) | (Total) | Total Passage |
|---|---|---|---|---|---|---|
| 1, Low Stress | 0.964 | 1.00 | 0.964 | 0.973 | 0.973 | 0.939 |
| 2, Low Stress | 0.966 | 1.00 | 0.966 | 0.984 | 0.984 | 0.951 |
| 3, Low Stress | 0.962 | 1.00 | 0.965 | 0.995 | 0.995 | 0.960 |
| 4, Low Stress | 0.969 | 1.00 | 0.969 | 0.981 | 0.981 | 0.951 |
| 5, Low Stress | 0.965 | 1.00 | 0.965 | 0.979 | 0.978 | 0.944 |
| 6, Low Stress | 0.970 | 1.00 | 0.970 | 0.985 | 0.985 | 0.956 |
| 7, Low Stress | 0.968 | 1.00 | 0.969 | 0.983 | 0.983 | 0.951 |
| 1, High Stress | 0.952 | 1.00 | 0.952 | 0.970 | 0.970 | 0.923 |
| 2, High Stress | 0.952 | 1.00 | 0.946 | 0.977 | 0.977 | 0.930 |
| 3, High Stress | 0.940 | 1.00 | 0.956 | 0.970 | 0.970 | 0.927 |
| 4, High Stress | 0.959 | 1.00 | 0.959 | 0.937 | 0.937 | 0.898 |
| 5, High Stress | 0.959 | 1.00 | 0.959 | 0.978 | 0.977 | 0.937 |
| 6, High Stress | 0.960 | 1.00 | 0.960 | 0.979 | 0.979 | 0.939 |
| 7, High Stress | 0.959 | 1.00 | 0.963 | 0.982 | 0.982 | 0.936 |
| 1, High + Low Stress | 0.869 | |||||
| 2, High + Low Stress | 0.889 | |||||
| 3, High + Low Stress | 0.892 | |||||
| 4, High + Low Stress | 0.857 | |||||
| 5, High + Low Stress | 0.888 | |||||
| 6, High + Low Stress | 0.901 | |||||
| 7, High + Low Stress | 0.893 |
-
Cuts are applied sequentially. Sequential passage is the fraction of events that passed the previous cut which also pass this cut, total passage is the fraction of all events that pass this cut.
High + Low Stress total passage fractions show the passage fraction for the combined total high and low stress cuts.
| Dataset No., Stress State | Baseline | Slope (Sequential) | Slope (Total) | (Sequential) | (Total) | Total Passage |
|---|---|---|---|---|---|---|
| 1, Low Stress | 0.959 | 0.976 | 0.965 | 0.973 | 0.973 | 0.921 |
| 2, Low Stress | 0.964 | 0.977 | 0.971 | 0.981 | 0.981 | 0.935 |
| 3, Low Stress | 0.964 | 0.974 | 0.969 | 0.990 | 0.990 | 0.942 |
| 4, Low Stress | 0.967 | 0.976 | 0.972 | 0.980 | 0.980 | 0.935 |
| 5, Low Stress | 0.963 | 0.974 | 0.969 | 0.975 | 0.975 | 0.927 |
| 6, Low Stress | 0.969 | 0.977 | 0.974 | 0.981 | 0.981 | 0.939 |
| 7, Low Stress | 0.969 | 0.977 | 0.973 | 0.979 | 0.979 | 0.936 |
| 1, High Stress | 0.931 | 0.960 | 0.940 | 0.961 | 0.961 | 0.868 |
| 2, High Stress | 0.935 | 0.961 | 0.944 | 0.966 | 0.966 | 0.877 |
| 3, High Stress | 0.951 | 0.964 | 0.946 | 0.964 | 0.964 | 0.881 |
| 4, High Stress | 0.939 | 0.964 | 0.946 | 0.925 | 0.925 | 0.846 |
| 5, High Stress | 0.939 | 0.964 | 0.948 | 0.963 | 0.963 | 0.881 |
| 6, High Stress | 0.940 | 0.963 | 0.950 | 0.968 | 0.968 | 0.887 |
| 7, High Stress | 0.946 | 0.966 | 0.954 | 0.978 | 0.978 | 0.894 |
| 1, High + Low Stress | 0.803 | |||||
| 2, High + Low Stress | 0.826 | |||||
| 3, High + Low Stress | 0.834 | |||||
| 4, High + Low Stress | 0.796 | |||||
| 5, High + Low Stress | 0.821 | |||||
| 6, High + Low Stress | 0.838 | |||||
| 7, High + Low Stress | 0.843 |
-
Cuts are applied sequentially. Sequential passage is the fraction of events that passed the previous cut which also pass this cut, total passage is the fraction of all events that pass this cut.
High + Low Stress total passage fractions show the passage fraction for the combined total high and low stress cuts.
References
- Krantz et al. [2019] P. Krantz, M. Kjaergaard, F. Yan, T. P. Orlando, S. Gustavsson, and W. D. Oliver, A quantum engineer’s guide to superconducting qubits, Appl. Phys. Rev. 6, 021318 (2019).
- Oliver and Welander [2013] W. D. Oliver and P. B. Welander, Materials in superconducting quantum bits, MRS Bull. 38, 816 (2013).
- Aumentado et al. [2004] J. Aumentado, M. W. Keller, J. M. Martinis, and M. H. Devoret, Nonequilibrium quasiparticles and periodicity in single-Cooper-pair transistors, Phys. Rev. Lett. 92, 066802 (2004).
- Martinis et al. [2009] J. M. Martinis, M. Ansmann, and J. Aumentado, Energy decay in superconducting Josephson-junction qubits from nonequilibrium quasiparticle excitations, Phys. Rev. Lett. 103, 097002 (2009).
- Serniak et al. [2018] K. Serniak, M. Hays, G. de Lange, S. Diamond, S. Shankar, L. D. Burkhart, L. Frunzio, M. Houzet, and M. H. Devoret, Hot non-equilibrium quasiparticles in transmon qubits, Phys. Rev. Lett. 121, 157701 (2018).
- Córcoles et al. [2011] A. D. Córcoles, J. M. Chow, J. M. Gambetta, C. Rigetti, J. R. Rozen, G. A. Keefe, M. B. Rothwell, M. B. Ketchen, and M. Steffen, Protecting superconducting qubits from radiation, Appl. Phys. Lett. 99, 181906 (2011).
- Barends et al. [2011] R. Barends, J. Wenner, M. Lenander, Y. Chen, R. C. Bialczak, J. Kelly, E. Lucero, P. O’Malley, M. Mariantoni, D. Sank, et al., Minimizing quasiparticle generation from stray infrared light in superconducting quantum circuits, Appl. Phys. Lett. 99, 113507 (2011).
- Liu et al. [2022a] C.-H. Liu, D. C. Harrison, S. Patel, C. D. Wilen, O. Rafferty, A. Shearrow, A. Ballard, V. Iaia, J. Ku, B. L. T. Plourde, et al., Quasiparticle poisoning of superconducting qubits from resonant absorption of pair-breaking photons (2022a), arXiv:2203.06577 [quant-ph] .
- McEwen et al. [2022] M. McEwen, L. Faoro, K. Arya, A. Dunsworth, T. Huang, S. Kim, B. Burkett, A. Fowler, F. Arute, J. C. Bardin, et al., Resolving catastrophic error bursts from cosmic rays in large arrays of superconducting qubits, Nature Phys. 18, 107 (2022).
- Cardani et al. [2021] L. Cardani, F. Valenti, N. Casali, G. Catelani, T. Charpentier, M. Clemenza, I. Colantoni, A. Cruciani, L. Gironi, L. Grünhaupt, et al., Reducing the impact of radioactivity on quantum circuits in a deep-underground facility, Nature Commun. 12, 2733 (2021).
- Vepsäläinen et al. [2020] A. Vepsäläinen, A. H. Karamlou, J. L. Orrell, A. S. Dogra, B. Loer, F. Vasconcelos, D. K. Kim, A. J. Melville, B. M. Niedzielski, J. L. Yoder, et al., Impact of ionizing radiation on superconducting qubit coherence, Nature 584, 551 (2020).
- Wilen et al. [2021] C. D. Wilen, S. Abdullah, N. A. Kurinsky, C. Stanford, L. Cardani, G. D’Imperio, C. Tomei, L. Faoro, L. B. Ioffe, C. H. Liu, et al., Correlated charge noise and relaxation errors in superconducting qubits, Nature 594, 369 (2021).
- Liu et al. [2022b] C.-H. Liu, D. C. Harrison, S. Patel, C. D. Wilen, O. Rafferty, A. Shearrow, A. Ballard, V. Iaia, J. Ku, B. L. Plourde, et al., Quasiparticle poisoning of superconducting qubits from resonant absorption of pair-breaking photons (2022b), arXiv:2203.06577 [quant-ph] .
- Diamond et al. [2022] S. Diamond, V. Fatemi, M. Hays, H. Nho, P. D. Kurilovich, T. Connolly, V. R. Joshi, K. Serniak, L. Frunzio, L. I. Glazman, et al., Distinguishing parity-switching mechanisms in a superconducting qubit (2022), arXiv:2204.07458 [quant-ph] .
- Mannila et al. [2022] E. T. Mannila, P. Samuelsson, S. Simbierowicz, J. T. Peltonen, V. Vesterinen, L. Grönberg, J. Hassel, V. F. Maisi, and J. P. Pekola, A superconductor free of quasiparticles for seconds, Nature Phys. 18, 145 (2022).
- Alkhatib et al. [2021] I. Alkhatib et al. (SuperCDMS Collaboration), Light dark matter search with a high-resolution athermal phonon detector operated above ground, Phys. Rev. Lett. 127, 061801 (2021).
- Abdelhameed et al. [2019] A. H. Abdelhameed et al. (CRESST Collaboration), First results from the cresst-iii low-mass dark matter program, Phys. Rev. D 100, 102002 (2019).
- Adari et al. [2022] P. Adari et al., EXCESS workshop: Descriptions of rising low-energy spectra (2022), arXiv:2202.05097 [astro-ph.IM] .
- Hehn et al. [2016] L. Hehn et al. (EDELWEISS Collaboration), Improved EDELWEISS-III sensitivity for low-mass WIMPs using a profile likelihood approach, Eur. Phys. J. C 76, 548 (2016).
- Salagnac et al. [2021] T. Salagnac, J. Billard, J. Colas, D. Chaize, M. De Jesus, L. Dumoulin, J.-B. Filippini, J. Gascon, A. Juillard, H. Lattaud, et al. (RICOCHET Collaboration), Optimization and performance of the CryoCube detector for the future RICOCHET low-energy neutrino experiment (2021), arXiv:2111.12438 [physics.ins-det] .
- Pyle [2022] M. Pyle, Low Energy Event Excess in Calorimeters (2022), EXCESS2022 Workshop.
- Strandhagen [2021] C. Strandhagen, Low Energy Excess in CRESST (2021), EXCESS2021 Workshop.
- Bespalov et al. [2016] A. Bespalov, M. Houzet, J. S. Meyer, and Y. V. Nazarov, Theoretical model to explain excess of quasiparticles in superconductors, Phys. Rev. Lett. 117, 117002 (2016).
- Jones and Kraner [1975] K. W. Jones and H. W. Kraner, Energy lost to ionization by 254-eV atoms stopping in Ge, Phys. Rev. A 11, 1347 (1975).
- Åström et al. [2006] J. Åström, P. C. F. Di Stefano, F. Pröbst, L. Stodolsky, J. Timonen, C. Bucci, S. Cooper, C. Cozzini, F. v. Feilitzsch, H. Kraus, et al., Fracture processes observed with a cryogenic detector, Phys. Lett. A 356, 262 (2006).
- Perepechko [1980] I. Perepechko, Low-Temperature Properties of Polymers (Permagon Press, Inc., Elmsford, NY, 1980).
- Irwin and Hilton [2005] K. D. Irwin and G. C. Hilton, Transition-edge sensors, in Cryogenic Particle Detection, edited by C. Enss (Springer Berlin Heidelberg, Berlin, Heidelberg, 2005) pp. 63–150.
- Irwin et al. [1995] K. D. Irwin, S. W. Nam, B. Cabrera, B. Chugg, and B. A. Young, A quasiparticle‐trap‐assisted transition‐edge sensor for phonon‐mediated particle detection, Rev. Sci. Instrum. 66, 5322 (1995).
- Fink et al. [2021] C. W. Fink et al. (CPD Collaboration), Performance of a large area photon detector for rare event search applications, Appl. Phys. Lett. 118, 022601 (2021).
- Fink et al. [2020] C. W. Fink, S. L. Watkins, T. Aramaki, P. L. Brink, S. Ganjam, B. A. Hines, M. E. Huber, N. A. Kurinsky, R. Mahapatra, N. Mirabolfathi, et al., Characterizing tes power noise for future single optical-phonon and infrared-photon detectors, AIP Adv. 10, 085221 (2020).
- Du et al. [2022] P. Du, D. Egana-Ugrinovic, R. Essig, and M. Sholapurkar, Sources of low-energy events in low-threshold dark-matter and neutrino detectors, Phys. Rev. X 12, 011009 (2022).
- Totten et al. [2018] G. E. Totten, M. Tiryakioğlu, and O. Kessler, Encyclopedia of Aluminum and Its Alloys (CRC Press, Boca Raton, FL, 2018).
- Ward et al. [2006] D. K. Ward, W. A. Curtin, and Y. Qi, Aluminum–silicon interfaces and nanocomposites: A molecular dynamics study, Compos. Sci. Technol. 66, 1151 (2006).
- Martinis [2021] J. M. Martinis, Saving superconducting quantum processors from qubit decay and correlated errors generated by gamma and cosmic rays, npj Quantum Inf. 7, 90 (2021).
- Guruswamy et al. [2014] T. Guruswamy, D. J. Goldie, and S. Withington, Quasiparticle generation efficiency in superconducting thin films, Supercond. Sci. Technol. 27, 055012 (2014).
- Zyla et al. [2020] P. Zyla et al. (Particle Data Group), Review of Particle Physics, Prog. Theor. Exp. Phys. 2020, 083C01 (2020).
- Riwar et al. [2016] R.-P. Riwar, A. Hosseinkhani, L. D. Burkhart, Y. Y. Gao, R. J. Schoelkopf, L. I. Glazman, and G. Catelani, Normal-metal quasiparticle traps for superconducting qubits, Phys. Rev. B 94, 104516 (2016).