11email: andrea.pastorello@inaf.it 22institutetext: Universitá degli Studi di Padova, Dipartimento di Fisica e Astronomia, Vicolo dell’Osservatorio 2, 35122 Padova, Italy 33institutetext: School of Physics, O’Brien Centre for Science North, University College Dublin, Belfield, Dublin 4, Ireland 44institutetext: Instituto de astrofísica, Facultad de Ciencias Exactas, Universidad Andres Bello, Fernández Concha 700, Las Condes, Santiago, Chile 55institutetext: Millennium Institute of Astrophysics (MAS), Nuncio Monsenor Sótero Sanz 100, Providencia, Santiago, 8320000, Chile 66institutetext: Institute of Space Sciences (ICE, CSIC), Campus UAB, Carrer de Can Magrans s/n, E-08193, Barcelona, Spain 77institutetext: Department of Astronomy, University of California, Berkeley, CA 94720-3411, USA 88institutetext: Miller Institute for Basic Research in Science, University of California, Berkeley, CA 94720, USA 99institutetext: Department of Astronomy and Astrophysics, University of California, Santa Cruz, CA 95064, USA 1010institutetext: Tuorla Observatory, Department of Physics and Astronomy, University of Turku, FI-20014 Turku, Finland 1111institutetext: Cosmic Dawn Center (DAWN), Niels Bohr Institute, University of Copenhagen, Jagtvej 128, 2200 København N, Denmark 1212institutetext: Department of Physics and Astronomy, University of California, Davis, 1 Shields Avenue, Davis, CA 95616-5270, USA 1313institutetext: Gemini Observatory, 670 North A’ohoku Place, Hilo, HI 96720-2700, USA 1414institutetext: Department of Physics, Virginia Tech, 850 West Campus Drive, Blacksburg, VA 24061, USA 1515institutetext: DIRAC Institute, Department of Astronomy, University of Washington, 3910 15th Avenue NE, Seattle, WA 98195-0002, USA 1616institutetext: Las Cumbres Observatory, 6740 Cortona Dr. Suite 102, Goleta, CA 93117, USA 1717institutetext: Department of Physics, University of California, Santa Barbara, Santa Barbara, CA 93106, USA 1818institutetext: Yunnan Observatories, Chinese Academy of Sciences, Kunming 650216, China 1919institutetext: Key Laboratory for the Structure and Evolution of Celestial Objects, Chinese Academy of Sciences, Kunming 650216, China 2020institutetext: Physics Department and Tsinghua Center for Astrophysics (THCA), Tsinghua University, Beijing 100084, China 2121institutetext: School of Physics, Trinity College Dublin, The University of Dublin, Dublin 2, Ireland 2222institutetext: European Centre for Theoretical Studies in Nuclear Physics and Related Areas (ECT⋆), Fondazione Bruno Kessler, I-38123, Trento, Italy 2323institutetext: INFN-TIFPA, Trento Institute for Fundamental Physics and Applications, Via Sommarive 14, I-38123 Trento, Italy 2424institutetext: INAF – Osservatorio Astronomico di Brera, via E. Bianchi 46 I-23807, Merate, Italy 2525institutetext: Institut d’Estudis Espacials de Catalunya (IEEC), E-08034, Barcelona, Spain 2626institutetext: Aryabhatta Research Institute of observational sciencES, Manora Peak, Nainital 263 002, India 2727institutetext: Hiroshima Astrophysical Science Centre, Hiroshima University, 1-3-1 Kagamiyama, Higashi-Hiroshima, Hiroshima 739-8526, Japan 2828institutetext: Gran Telescopio Canarias (GRANTECAN), Cuesta de San José s/n, 38712 Breña Baja, La Palma, Spain 2929institutetext: Instituto de Astrofísica de Canarias, Vía Láctea s/n, 38200 La Laguna, Tenerife, Spain 3030institutetext: Finnish Centre for Astronomy with ESO (FINCA), University of Turku, FI-20014 Turku, Finland 3131institutetext: Department of Physics and Astronomy, University of North Carolina, 120 East Cameron Avenue, Chapel Hill, NC 27599, USA 3232institutetext: Center for Astrophysics | Harvard & Smithsonian, 60 Garden Street, Cambridge, MA 02138-1516, USA 3333institutetext: The NSF AI Institute for Artificial Intelligence and Fundamental Interactions 3434institutetext: Department of Physics and Astronomy, Aarhus University, Ny Munkegade 120, 8000 Aarhus C, Denmark 3535institutetext: Department of Physics, Florida State University, 77 Chieftan Way, Tallahassee, FL 32306, USA 3636institutetext: Department of Physics and Astronomy, Rutgers, The State University of New Jersey, 136 Frelinghuysen Road, Piscataway, NJ 08854, USA 3737institutetext: Turku Collegium for Science, Medicine and Technology, University of Turku, FI-20014 Turku, Finland 3838institutetext: Center for Interdisciplinary Exploration and Research in Astrophysics (CIERA), Northwestern University, Evanston, IL 60208, USA 3939institutetext: Key Laboratory of Optical Astronomy, National Astronomical Observatories, Chinese Academy of Sciences, Beijing 100101, China 4040institutetext: School of Astronomy and Space Science, University of Chinese Academy of Sciences, Beijing 101408, China 4141institutetext: W. M. Keck Observatory, 65-1120 Ma-malahoa Highway, Kamuela, HI 96743-8431, USA 4242institutetext: The Oskar Klein Centre, Department of Astronomy, Stockholm University, AlbaNova, SE-10691 Stockholm, Sweden 4343institutetext: Astrophysics Research Institute, Liverpool John Moores University, ic2, 146 Brownlow Hill, Liverpool L3 5RF, UK 4444institutetext: Max-Planck Institut für Astrophysik, Karl-Schwarzschild-Str. 1, D-85741 Garching, Germany 4545institutetext: Department of Applied Physics, University of Cádiz, Campus of Puerto Real, 11510 Cádiz, Spain 4646institutetext: Las Campanas Observatory, Carnegie Observatories, Casilla 601, La Serena, Chile 4747institutetext: Graduate Institute of Astronomy, National Central University, 300 Zhongda Road, Zhongli, Taoyuan 32001, Taiwan 4848institutetext: The Observatories of the Carnegie Institution for Science, 813 Santa Barbara St., Pasadena, CA 91101, USA 4949institutetext: Department of Physics and Astronomy, Johns Hopkins University, 3400 North Charles Street, Baltimore, MD 21218, USA 5050institutetext: Space Telescope Science Institute, 3700 San Martin Drive, Baltimore, MD 21218, USA 5151institutetext: Steward Observatory, University of Arizona, 933 North Cherry Avenue, Tucson, AZ 85721-0065, USA 5252institutetext: Astrophysics Research Centre, School of Mathematics and Physics, Queen’s University Belfast, BT7 1NN, UK 5353institutetext: Chinese Academy of Sciences, South America Center for Astronomy, National Astronomical Observatories, CAS, Beijing 100101, China 5454institutetext: Beijing Planetarium, Beijing Academy of Science and Technology, Beijing 100044, China 5555institutetext: Institute for Astronomy, University of Hawaii, 2680 Woodlawn Drive, Honolulu, HI 96822, USA
Panchromatic evolution of three luminous red novae
We present photometric and spectroscopic data on three extragalactic luminous red novae (LRNe): AT~2018bwo, AT~2021afy, and AT~2021blu. AT~2018bwo was discovered in NGC~45 (at about 6.8 Mpc) a few weeks after the outburst onset. During the monitoring period, the transient reached a peak luminosity of erg s-1. AT~2021afy, hosted by UGC~10043 ( Mpc), showed a double-peaked light curve, with the two peaks reaching a similar luminosity of erg s-1. Finally, for AT~2021blu in UGC~5829 ( Mpc), the pre-outburst phase was well-monitored by several photometric surveys, and the object showed a slow luminosity rise before the outburst. The light curve of AT~2021blu was sampled with an unprecedented cadence until the object disappeared behind the Sun, and it was then recovered at late phases. The light curve of LRN AT~2021blu shows a double peak, with a prominent early maximum reaching a luminosity of erg s-1, which is half of that of AT~2021afy. The spectra of AT~2021afy and AT~2021blu display the expected evolution for LRNe: a blue continuum dominated by prominent Balmer lines in emission during the first peak, and a redder continuum consistent with that of a K-type star with narrow absorption metal lines during the second, broad maximum. The spectra of AT~2018bwo are markedly different, with a very red continuum dominated by broad molecular features in absorption. As these spectra closely resemble those of LRNe after the second peak, AT~2018bwo was probably discovered at the very late evolutionary stages. This would explain its fast evolution and the spectral properties compatible with that of an M-type star. From the analysis of deep frames of the LRN sites years before the outburst, and considerations of the light curves, the quiescent progenitor systems of the three LRNe were likely massive, with primaries ranging from about 13 M⊙ for AT~2018bwo, to M⊙ for AT~2021blu, and over 40 M⊙ for AT~2021afy.
Key Words.:
binaries: close — stars: winds, outflows — stars: individual: AT 2018bwo — stars: individual: AT 2021afy — stars: individual: AT 2021blu1 Introduction
Luminous red novae (LRNe) are optical transients that are thought to result from a close binary interaction leading to the ejection of a common envelope, eventually followed by the coalescence of the stellar cores (e.g. Ivanova, 2017). LRNe span an enormous range of luminosities, but they have a surprisingly similar spectral evolution. About five orders of magnitude separate the peak luminosity of the faintest Galactic objects such as OGLE~2002-BLG-360 (Tylenda et al., 2013) and V1309~Sco (Mason et al., 2010; Tylenda et al., 2011) from bright extragalactic events ( mag; see, e.g. the sample presented by Pastorello et al., 2019a). The latter objects, with intermediate luminosity between those of classical novae and core-collapse supernovae, are ’gap transients’ (Kasliwal, 2012; Pastorello & Fraser, 2019; Cai et al., 2022a). LRNe have structured light curves, with a phase of slowly rising luminosity lasting months to years, followed by a major outburst. The outburst is usually characterised by a short-duration early peak, during which the object has a blue colour, followed by a plateau or a second broad peak with a redder colour. While a LRN during the slow pre-outburst brightening has not been spectroscopically monitored yet, spectra during the early peak show a blue continuum with prominent lines in emission of the Balmer series, similar to those of other gap transients. At later phases (during the plateau or the second peak), the spectral continuum of LRNe becomes progressively redder, the Balmer lines become weaker, and many narrow absorption lines of metals appear. At very late phases, the optical spectrum resembles that of intermediate to late M-type stars, dominated by prominent absorption bands of TiO and VO (Martini et al., 1999; Kimeswenger, 2006; Barsukova et al., 2007, 2014; Tylenda et al., 2015).
While not all of the physical processes leading to LRN outbursts have been fully understood (Ivanova et al., 2013a, b), significant progress has been made in the last decade from the observational side. In particular, follow-up observations of V1309~Sco revealed the signature of unstable mass transfer in a binary system when the primary filled its Roche lobe. The process may led to the ejection of a common envelope and the loss of angular momentum of the binary (Pejcha et al., 2016a, 2017; MacLeod et al., 2018; MacLeod & Loeb, 2020).
Regardless of the mass, a binary stellar system after the ejection of the common envelope can either evolve to a new stable and closer binary configuration (Jones, 2020, and references therein), or to a final coalescence (Tylenda & Soker, 2006), as is what happened for V1309~Sco (Tylenda et al., 2011). The merging event is the most popular scenario to explain the LRN observables (e.g. Kamiński et al., 2021). The double-peaked light curves and most of the observational properties of LRN outbursts are fairly well explained by gas outflow following the coalescence of the two stellar cores (e.g. Tylenda & Soker, 2006, for V838 Mon), and subsequent shock interaction with the outer envelope. This scenario has been successfully modelled by a number of authors (Shara et al., 2010; Nandez et al., 2014; Metzger & Pejcha, 2017; MacLeod et al., 2017). However, the merger scenario for LRNe has been occasionally challenged by late-time observations of the remnant (e.g. in the case of V838 Mon; Goranskij et al., 2020). Regardless of the fate of the system (merger or survived binary), the mass accretion onto an equatorial disk may power polar jets colliding with the slow-moving envelope, which may account for the properties of LRNe (Kashi & Soker, 2016; Soker & Kashi, 2016; Soker, 2016, 2020; Soker & Kaplan, 2021).
From an observational point of view, most LRNe display an early blue peak in the light curve resulting from the outflow of hot material ejected in the merging process. However, in some LRNe the initial blue colour is not detected (e.g. in AT~2015dl and AT~2020hat; Blagorodnova et al., 2017; Pastorello et al., 2021a). This can be due to an observational bias, as the early blue peak is a short-duration event. Alternatively, the lack of an initial blue phase can be due to an expanded, red giant (or supergiant) primary star.
In this paper, we report extensive datasets for three LRNe. First, we present new data for AT 2018bwo which complement those released by Blagorodnova et al. (2021). AT~2018bwo is an object whose observations do not show evidence of an early blue phase, but its explosion epoch is poorly constrained. Furthermore, we present optical and near-infrared (NIR) data for two LRNe discovered in 2021: AT~2021afy and AT~2021blu. In the case of the latter, Sloan - and -band light curves were also presented by Soraisam et al. (2022). In contrast to the monitoring campaigns of other LRNe in our programme (Pastorello et al., 2021a, b), the follow-up campaigns of these two objects were not significantly affected by the COVID-19 pandemic restrictions as to our access to observational facilities. This study is complemented by a companion paper on another LRN monitored during the same period, AT 2021biy (Cai et al., 2022b).
We provide the basic information for the three transients and their host galaxies in Sect. 2. The photometric data are presented in Sect. 3; the evolution of their physical parameters (bolometric luminosity, photospheric radius, and temperature) is illustrated in Sect. 4; and their spectral evolution is described in Sect. 5. The nature of the progenitors, the mechanisms producing LRN outbursts, and the updated version of the correlations presented by Pastorello et al. (2019a) and Pastorello et al. (2021a) are discussed in Sect. 6. A brief summary follows in Sect. 7.
2 AT~2018bwo, AT~2021afy, AT~2021blu, and their host galaxies
AT~2018bwo111The object is also known as DLT18x, ATLAS18qgb, and Gaia18blv. was discovered by the DLT40 survey (Tartaglia et al., 2018) on 2018 May 22.93 (UT dates are used throughout this paper; Valenti et al., 2018).222As mentioned by Blagorodnova et al. (2021), the discovery unfiltered magnitude reported by Valenti et al. (2018), 16.44 (AB mag scale), is incorrect; see Sect. 3.1. Its coordinates are and (J2000). Clark et al. (2018) noted the similarity with the spectrum of an F-type star and, also taking into account the faint absolute magnitude of the object, proposed an LRN classification for AT~2018bwo.
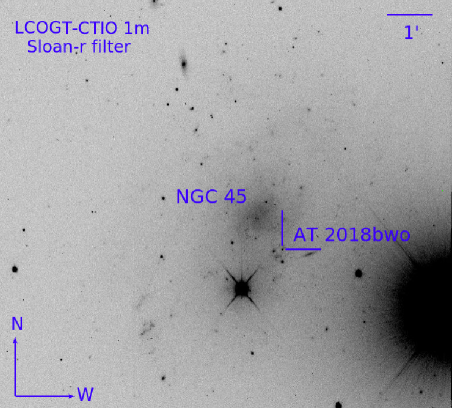
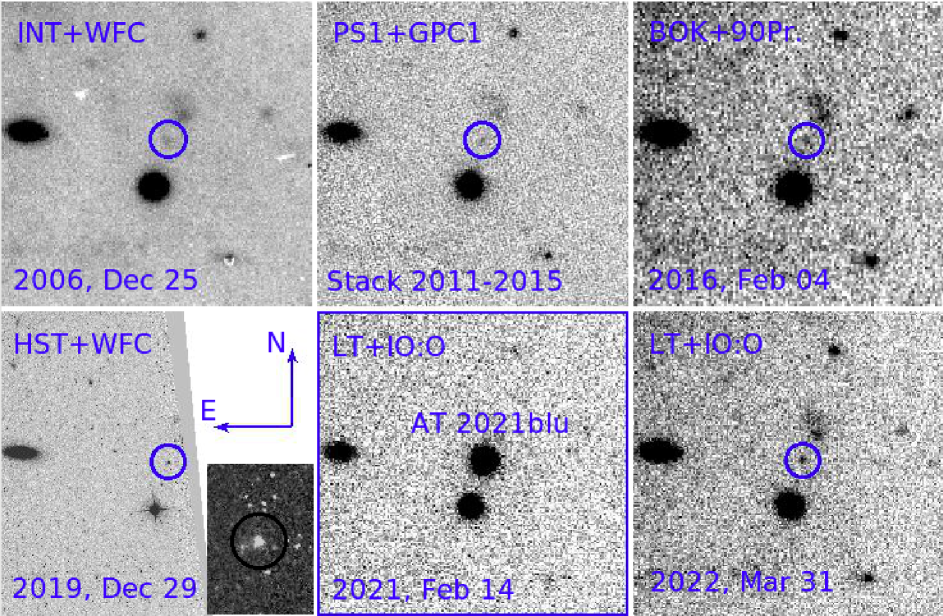
The host galaxy, NGC~45, is a nearly face-on SABd spiral. Although the object lies in the outskirts of NGC~45 ( W and S of the host-galaxy nucleus), it is very close to contaminating background sources (Fig. 1, top panel). While at odds with other methods (“sosie” galaxies333See, e.g., Bottinelli et al. (1985) for a description of the method., Tully-Fisher, kinematic), for the host-galaxy distance () we adopt the most recent value based on the tip of the red giant branch method (Sabbi et al., 2018), Mpc, corresponding to a distance modulus of mag. This value of is similar to that adopted by Blagorodnova et al. (2021), mag.
A (modest) average reddening within the host galaxy was estimated by Mora et al. (2007), mag. Blagorodnova et al. (2021) adopted an even lower value ( mag) based on the spectral energy distribution (SED) of the LRN progenitor. The peripheral location of AT~2018bwo and the presence of very blue sources in its vicinity suggest a negligible contribution of the host galaxy to the total line-of-sight reddening. For this reason, hereafter we assume that the total reddening towards AT~2018bwo is entirely due to the Milky Way contribution ( mag; Schlafly & Finkbeiner, 2011).
AT~2021afy444The object is also known as ZTF21aaekeqd. was discovered by the Zwicky Transient Facility (ZTF; Bellm et al., 2019; Graham et al., 2019) survey on 2021 January 10.52, at a magnitude of (Munoz-Arencibia et al., 2021). Alert of the discovery was released by the ALeRCE broker555http://alerce.online/object/ZTF21aaekeqd. (Carrasco-Davis et al., 2020). The coordinates of the transient are and (J2000). The object lies above the disk plane of the edge-on spiral (Sbc-type) galaxy UGC~10043 (Fig. 1, middle panel). For the host galaxy, a Tully-Fisher distance of about 49.2 Mpc was inferred by Tully et al. (2016, with H km s-1 Mpc-1, and assuming and ). Hence, the adopted distance modulus is mag666The distance to UGC~10043 is debated, as Tully-Fisher values reported in the literature range from about 40 to almost 60 Mpc, but are still within the (large) error bars adopted in Tully et al. (2016) estimate..
While the Milky Way reddening towards AT~2021afy is modest, mag, the detection of prominent absorption of the interstellar Na I doublet (Na I D) 5890, 5896 in the transient’s spectra at the redshift of the host galaxy (see Sect. 5) suggests significant reddening, which is unexpected given the peripheral location of AT~2021afy from the nucleus of UGC~10043. For this reason, we speculate that the gas and dust cloud is circumstellar, or located in the proximity of the object. Accounting for the contribution of the host-galaxy reddening (see Sect. 5.2 for details), we infer a total line-of-sight colour excess of mag.
AT~2021blu777Alternative survey names are ATLAS21dic, ZTF21aagppzg, PS21akb, and Gaia21cwl. was discovered by the Asteroid Terrestrial-impact Last Alert System (ATLAS; Tonry et al., 2018; Smith et al., 2020) survey on 2021 February 1.47, at an ATLAS-orange magnitude of (Tonry et al., 2021). The coordinates of the transient are and (J2000). The object lies in a remote location of the irregular (Im type) galaxy UGC~5829. While a distance of 8 Mpc (with Hubble constant H km s-1 Mpc-1) was estimated by Tully & Fisher (1988), the kinematic distance corrected for Local Group infall into Virgo gives Mpc (Mould et al., 2000) (computed adopting H km s-1 Mpc-1), and a distance modulus of mag. The site of AT~2021blu is shown in Fig. 1 (bottom panel).
The remote location of the transient in the host galaxy and the nondetection of the Na I D narrow interstellar feature at the redshift of UGC~5829 suggest no reddening due to host galaxy dust. For this reason, we assume that extinction is only due to the Galactic contribution, mag (Schlafly & Finkbeiner, 2011).
We remark that AT~2021blu was initially classified as a luminous blue variable outburst by Uno et al. (2021). However, as we detail in the next sections, follow-up data indicate that both this object and AT~2021afy are LRNe.
3 Photometric data
Basic information on the instrumental configurations used for the photometric campaigns of the three LRNe is provided in Appendix A. The reduction of the optical photometric data collected with our facilities was carried out with the SNOoPY888SNOoPY is a package for supernova photometry using point-spread-function (PSF) fitting and/or template subtraction developed by E. Cappellaro. A package description can be found at http://sngroup.oapd.inaf.it/ecsnoopy.html. package. Science frames were first bias-subtracted and flatfield-corrected. SNOoPY allows us to carry out the astrometric calibration of the images, and PSF-fitting photometry of the target after template subtraction, if required. Owing to their remote locations in the host galaxies, simple PSF-fitting photometry was used to obtain the photometric data for AT~2021afy and AT~2021blu, while template subtraction was necessary for AT~2018bwo. Deep template images of the AT~2018bwo explosion site (with Johnson , , ; and Sloan , , filters) were obtained on 2021 July 7 with one of the 1 m telescopes of the Las Cumbres Observatory global telescope network.
The instrumental magnitudes in the Sloan filters were then calibrated using zero points and colour-term corrections with reference to the Sloan Digital Sky Survey (SDSS) catalogue. As the field of AT~2018bwo was not sampled by SDSS, the Sloan-filter photometry of this LRN was calibrated using reference stars taken from the Pan-STARRS catalogue. A catalogue of comparison stars to calibrate photometry in the Johnson-Cousins filters was obtained by converting Sloan and Pan-STARRS magnitudes to Johnson-Cousins magnitudes using the transformation relations of Chronis & Gaskell (2008). Finally, for the - and -band ATLAS data, we directly used the template-subtracted forced photometry (Tonry et al., 2018; Smith et al., 2020) released through the ATLAS data-release interface999https://fallingstar-data.com/forcedphot/queue/..
Swift optical and ultraviolet (UV) magnitudes (see Appendix A) were measured with the task uvotsource included in the UVOT software package HEAsoft101010https://heasarc.gsfc.nasa.gov/docs/software/heasoft/. distribution v. 6.28. We performed aperture photometry using a radius, while the sky contribution was computed in a ring placed between and from the source.
NIR images required some preliminary processing steps. We first constructed sky images for each filter by median-combining several dithered science frames. The contribution of the bright NIR sky was hence subtracted from individual science frames. To improve the signal-to-noise ratio (S/N), we finally combined the sky-subtracted frames. For the NOTCam data (see Appendix A), the above steps were performed using a version of the NOTCam Quicklook v2.5 reduction package111111http://www.not.iac.es/instruments/notcam/guide/observe.html. with a few functional modifications (e.g., to increase the field of view of the reduced image). The following steps (astrometric calibrations, PSF-fitting photometry, and zero-point corrections) were made using SNOoPY and the same prescriptions as for the optical images. Reference stars from the Two Micron All-Sky Survey (2MASS) catalogue (Skrutskie et al., 2006) were used for the photometric calibration.
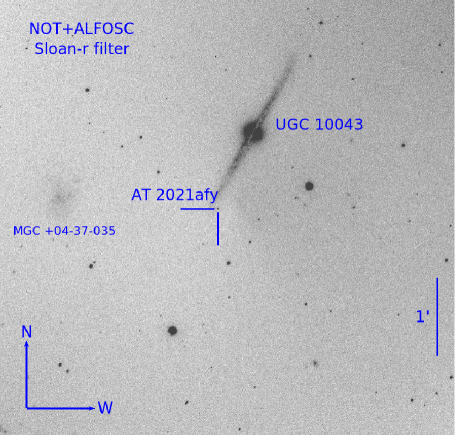
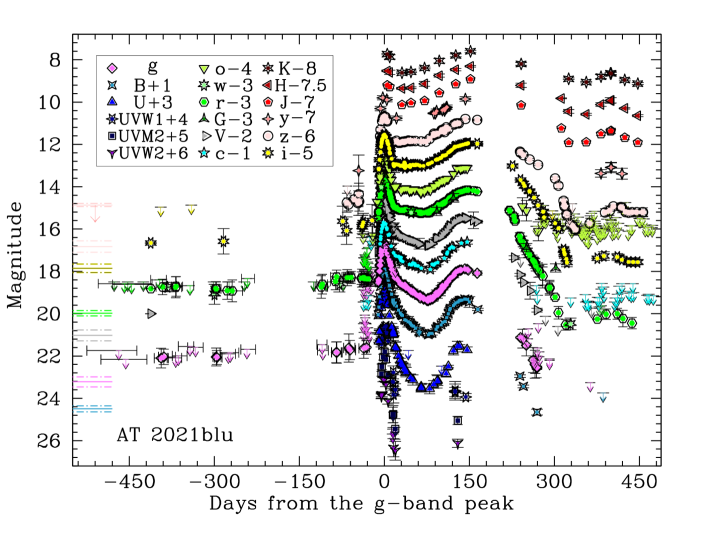
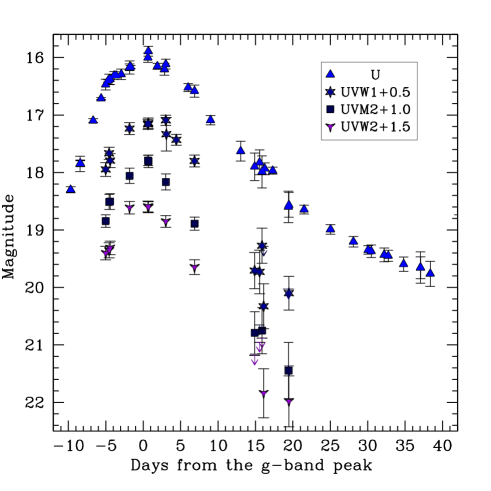
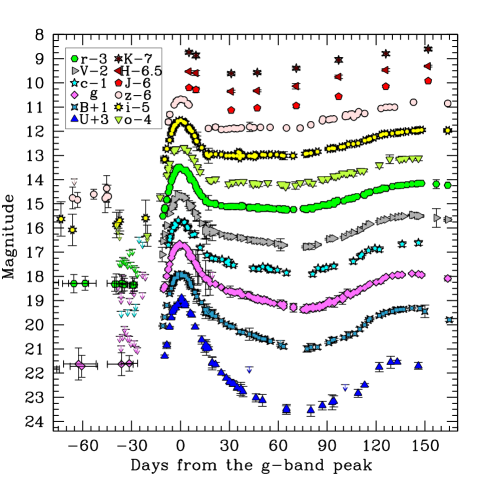
The final magnitudes of AT~2018bwo, AT~2021afy, and AT~2021blu in the optical bands are given in Tables A1, A2, and A3, respectively121212The tables are only available in electronic form at the CDS via anonymous ftp to cdsarc.u-strasbg.fr (130.79.128.5) or via http://cdsweb.u-strasbg.fr/cgi-bin/qcat?J/A+A/.. The light curves of AT~2018bwo and AT~2021afy are shown in Fig. 2 and 3, respectively. The long-term light curves of AT~2021blu from the UV to the NIR are shown in Fig. 4 (top panel). The bottom-left panel of Fig. 4 displays in detail the UV light curves of the AT~2021blu outburst during the first peak, while the bottom-right panel shows the evolution of the optical and NIR light curves during the LRN outburst, before the seasonal gap.
3.1 AT 2018bwo
Although AT~2018bwo was discovered on 2018 May 22, the object was also visible in DLT40 images taken eight and six days prior, at a comparable brightness. Earlier images are not available as the object was in solar conjunction. These early DLT40 images are unfiltered, but were calibrated to match the Johnson-Cousins band. In all these frames, the brightness remains nearly constant at –18.2 mag. The lack of earlier images prevents us from setting a stringent limit on the LRN onset. Monthly unfiltered DLT40 stacked images obtained from June to August 2017 do not show signs of the LRN down to a limit of mag. A closer nondetection is provided by the Gaia Alert team131313http://http://gsaweb.ast.cam.ac.uk/alerts/home., which reports that no source is visible at the location of the object on 2018 January 15, hence about four months before the discovery. Therefore, we can only estimate a lower limit for the LRN outburst duration. The last positive detection of the LRN is months after the discovery, while observations at later epochs only provide upper detection limits.
We find some differences between our Sloan-band light curves and those presented by Blagorodnova et al. (2021). Our data have smaller scatter, and they appear to be mag brighter in the band and 0.2 mag fainter in the band, while there is a fair agreement in the band. As both datasets were obtained after template subtraction, this mismatch is puzzling. We note, however, that we used the Pan-STARRS reference catalogue for the calibration. Other possible explanations are the low S/N of the source in individual images taken with 1 m-class telescopes, or inaccurate colour-term corrections.
Our optical data reveal that the LRN remained in a sort of plateau for over three weeks after the discovery, at average magnitudes of and mag, which provide absolute magnitudes of and mag. We also obtain the intrinsic colours in this phase, mag and mag. The plateau is followed by a luminosity drop in all bands. In its initial phase, the light-curve decline is relatively slow, but it becomes very steep days after the discovery. As for most of LRNe, the object leaves the plateau earlier in the bluer bands than in the redder bands.
The overall shape of the light curve of AT~2018bwo is reminiscent of those of LRNe during the late plateau phase (or soon after the broad, red light-curve maximum). This similarity is corroborated by spectroscopic clues, as the observed spectra of AT~2018bwo resemble the late-time spectra of canonical LRNe (see Sect. 5). Blagorodnova et al. (2021) suggested that the merger’s photosphere was initially at a much lower temperature and with a larger radius than typical LRNe. However, this statement is not supported by stringent observational constraints. In particular, from the available data, we can presume that the outburst onset occurred a few months before the LRN discovery, and we cannot rule out that the intrinsic colour was initially much bluer than that observed. Consequently, while we agree that the red colour of AT~2018bwo is an indication of a more expanded and cooler photosphere, this is possibly due to the late discovery of the transient (Pastorello et al., 2019a, b; Cai et al., 2019; Pastorello et al., 2021a, b).
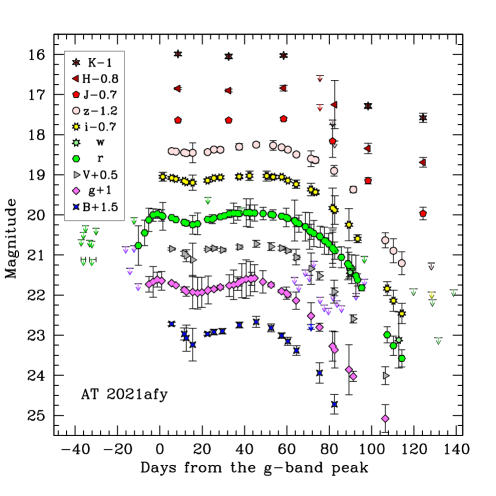
3.2 AT 2021afy
The light curve of the AT~2021afy outbursts is well sampled in the optical and NIR bands (Fig. 3). In contrast, only limited information is available for the pre-outburst phases.
To better constrain the epoch of the LRN outburst onset, we analysed the ZTF DR3 images, finding a weak () detection of the transient at mag on 2021 January 7.555, three days before the discovery announced by Munoz-Arencibia et al. (2021). However, nondetections are registered on the same day in the band ( mag) or at earlier epochs. To increase the S/N, we also stacked141414Information on the pre-outburst staked images of the AT~2021afy field is given in Appendix A.1 (Table 4). the highest-quality images obtained in December 2020, and no source was detected down to mag. No activity was revealed in earlier images provided by ZTF. In particular, we stacked images in the , , and bands obtained over several months in mid-2018, and no source was detected at the LRN location to the following limits: , , and mag.
The available data allow us to constrain a first light-curve rise, which lasts at least 10 days. The -band maximum, derived through a low-order polynomial fit to the light curve, is reached on MJD = , at mag. Hereafter, this epoch will be used as a reference for AT~2021afy. The -band peak is reached 0.7 days later. Accounting for the total line-of-sight extinction, the intrinsic colour at the first maximum is mag. After the first peak, the light curves decline in all bands for about two weeks, reaching a relative minimum 0.3–0.4 mag fainter, followed by a second, broader maximum about one month later. At the second peak, we measure mag, while is similar to the colour of the first peak. This broad peak is then followed by a rapid decline in all bands, and the colours become rapidly much redder ( mag, days after the first peak).
We note that the minimum between the two light-curve peaks is more pronounced in the blue bands than in the red bands, while the NIR light curves show sort of a long-lasting plateau after the first maximum, although the NIR light curves are not well sampled. Regardless of the filter, and in contrast with the behaviour of other LRNe, the luminosity of AT~2021afy at the time of the first maximum is very similar to that of the second peak in all bands. Accounting for the reddening and the distance adopted in Sect. 2, we obtain the following -band absolute magnitudes at the two peaks: and mag.
3.3 AT 2021blu
| UT Date | MJD | Filter | Magnitude | Instrumental configuration |
|---|---|---|---|---|
| 2006-02-25 | 54094.15 | 23.50 (0.14) | INT + WFC | |
| 2006-02-25 | 54094.13 | 23.03 (0.26) | INT + WFC | |
| 2006-12-25 | 54094.12 | 22.98 (0.12) | INT + WFC | |
| 2010-03-21 to 2013-02-12 | 55801.07∗ | 23.27 (0.21) | PS1 (stack) | |
| 2011-03-14 to 2014-02-09 | 56246.25∗ | 22.98 (0.18) | PS1 (slack) | |
| 2011-05-16 to 2015-01-12 | 56246.96∗ | 22.83 (0.27) | PS1 (slack) | |
| 2010-12-31 to 2015-01-22 | 56271.52∗ | 21.86 | PS1 (slack) | |
| 2011-03-14 to 2015-01-12 | 56582.35∗ | 22.86 (0.20) | PS1 (slack) | |
| 2016-03-09 | 57456.33 | 23.03 (0.34) | Bok + 90prime | |
| 2016-02-03 | 57421.37 | 22.73 | Bok + 90prime | |
| 2016-02-04 | 57422.40 | 22.79 (0.44) | Bok + 90prime | |
| 2016-02-04 | 57422.40 | 22.51 (0.35) | KPNO4m + Mosaic3 | |
| 2016-02-06 | 57424.38 | 22.50 (0.33) | KPNO4m + Mosaic3 | |
| 2016-02-15 | 57433.38 | 22.70 | Bok + 90prime | |
| 2017-03-22 | 57834.34 | 22.03 (0.18) | KPNO4m + Mosaic3 | |
| 2017-03-25 | 57837.31 | 22.06 (0.16) | KPNO4m + Mosaic3 | |
| 2017-05-17 | 57890.21 | 22.60 | Bok + 90prime |
Average MJD of the stacked image.
| Filter | (Å) | MJD (peak 1) | Magnitude (peak 1) | MJD (peak 2) | Magnitude (peak 2) |
|---|---|---|---|---|---|
| 2140 | – | – | |||
| 2273 | – | – | |||
| 2688 | – | – | |||
| 3416 | |||||
| 4313 | |||||
| 4751 | |||||
| 5409 | |||||
| 5446 | |||||
| 6204 | |||||
| 6866 | |||||
| 7519 | |||||
| 8992 | |||||
| 12350 | |||||
| 16620 | |||||
| 21590 |
3.3.1 Pre-outburst data
The field of AT~2021blu was extensively observed in the last few years. We inspected images released by the main surveys through public archives. To increase the S/N, we created periodic stacks171717Information on the pre-outburst ZTF stacked images of the AT~2021blu field is provided in Appendix A.1 (Table 5). using good-quality ZTF images, and a source was detected at the location of the LRN already in 2018. In addition, very deep images taken with ground-based, mid-sized telescopes in 2006 and early 2016 show a source of mag at the LRN location (Fig. 5). In particular, Johnson-Bessell and , and Sloan images taken in February 2006 with the Isaac Newton Telescope (INT) equipped with the wide-field camera (WFC) reveal a faint source at the LRN position, with , , and mag. The source is also detected in deep PS1 reference images determined by stacking frames obtained from March 2010 to January 2015. Specifically, the stack PS1 frame in the band shows the source being at the same magnitude as in 2006, with an intrinsic colour of mag. The magnitudes of the source at the position of AT~2021blu in the 2006–2017 period are reported in Table 1. We further discuss these archival data in Sect. 6.1, as they likely provide us with the most stringent information on the quiescent progenitor of AT~2021blu. We note, however, that the low spatial resolution and the relatively low S/N of these images do not allow us to rule out the presence of contaminating sources in the proximity of the LRN location.
Furthermore, archive frames in the Sloan , and filters obtained in 2016 with the 2.3 m Bok and the 4 m Mayall telescopes (both hosted at the Kitt Peak Observatory) equipped with mosaic cameras still show the putative progenitor of AT~2021blu. Over the decade, this source experienced modest magnitude evolution, and in February 2016 it had marginally brightened by –0.2 mag in the and bands (see Fig. 5, and Table 1).
More-recent images show this source becoming progressively more luminous: in one year (in March 2017) it has brightened by mag in the band, and the object has been repeatedly detected at later epochs. The -, - and -band light curves from December 2019 to January 2021 (approximately from d to d before -band maximum) show some luminosity fluctuations superposed on a global, slow luminosity rise (Fig. 4, top panel), very similar to those observed in other LRNe (Blagorodnova et al., 2017, 2020; Pastorello et al., 2019b, 2021a, 2021b). The colour remains at about 0.15–0.2 mag during that period. As for other members of this family, this slow luminosity rise follows the ejection of the common envelope, and it is possibly powered by collisions between circumbinary shells.
3.3.2 Photometric evolution of the outburst
The object is later observed in outburst (in early February 2021) by ATLAS on MJD = 59246.49 (at an -band magnitude of ). The object experiences a fast rise, reaching the first (blue) maximum light in a bit less than two weeks. The epoch of the -band maximum is MJD = , which is used hereafter as a reference for AT~2021blu. From the apparent magnitudes at the first peak, mag ( mag), we estimate the following absolute magnitudes and intrinsic colours: and 0.15 mag, with , mag. The UV light curves obtained with Swift rapidly reach maximum brightness at nearly the same time as the -band peak, at magnitudes between 16.5 and 17 (depending on the Swift UV filters; Fig. 4, bottom-left panel).
The first peak is followed by a luminosity decline which lasts about 75 days, during which AT~2021blu fades by mag in the band, 3.1 mag in the band, 2 mag in the band, 2.7 mag in the band, 1.6 mag in the band, and 1.5 mag in the band (see Fig. 4, bottom-right). A decline similar to that of the red optical bands is also observed in the NIR domain, although this phase was not well sampled. The UV light curves exhibit a very rapid post-peak decline, more rapid than the one observed in the band, with the LRN fading below the detection threshold of Swift/UVOT about three weeks after maximum.
Later, the luminosity rises again in all bands, reaching a second, broader peak, earlier in the blue filters. In particular, the light curve reaches the second -band maximum on MJD = , which is about 143 days after the first peak. The apparent magnitude at the second maximum is mag, which provides an absolute magnitude of mag, while the reddening-corrected colour at this epoch is mag. The second peak is reached slightly later (on MJD = ) in the -band, at a magnitude of mag ( mag). At this epoch, we determine a reddening-corrected colour of mag. The times and the apparent magnitudes of the two light-curve peaks were estimated through a low-order polynomial fit to the photometric data, and the resulting values for the different filters are reported in Table 2. While the first light-curve maximum is observed nearly at the same time in the different bands, the second maximum is reached earlier in the blue filters than in the red and NIR ones, as expected from a cooling photosphere.
Then, the object disappeared behind the Sun soon after the second maximum, and it was recovered two months later, showing a very fast decline in all the bands lasting about 100 days, with a slower decline rate in the NIR bands. After a faint minimum at mag ( mag), the luminosity shows a short-duration hump lasting about 30–40 days in the red-optical and NIR bands, which is mag brighter than the minimum. Finally, the light curves settle to nearly constant magnitude in all bands ( mag, hence mag). We note that a similar red hump was observed at late phases in other LRNe, including AT~2021jfs (Pastorello et al., 2019b) and AT~2021biy (Cai et al., 2022b).
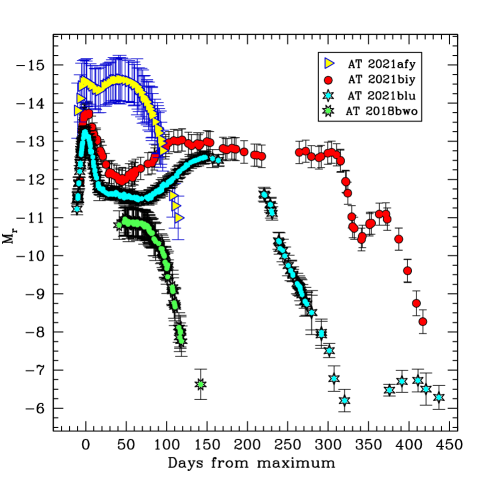
A comparison of the Sloan absolute light curve for the three LRNe presented in this paper with that of AT~2021biy (Cai et al., 2022b) is shown in Fig. 6. While the late-time red hump is evident in AT~2021biy, it is a lower-contrast but more persistent feature in the light curve of AT~2021blu. Although the nature of these bumps has not been convincingly expained so far, extra energy radiated by ejecta collisions with circumstellar shells is a plausible explanation. We note that the two LRNe with short-lasting outbursts in Fig. 6, AT~2021afy and AT~2018bwo, display a fast-declining light curve without evident late brightenings.
3.3.3 Hubble Space Telescope imaging of AT 2021blu
We used a deep ( s) Liverpool Telescope (LT) plus IO:O -band image of AT~2021blu as a reference to search for a possible progenitor in archival Hubble Space Telescope (HST) ACS-WFC data181818Program GO-15922, PI R. B. Tully. taken on 2019 December 29, and available through the Mikulski Archive for Space Telescopes191919https://archive.stsci.edu/.. A second epoch202020Program GO-16691, PI R. J. Foley. of HST imaging of the AT~2021blu location was obtained on 2022 February 24, yr after the LRN outburst.
Unfortunately, AT 2021blu lies at the edge of the available ACS image obtained in December 2019. In order to match the pre- and post-explosion images, we had to align the two frames using sources in the field that were situated east of AT~2021blu. Furthermore, only very few point sources were detected in both the LT and HST data. We hence used a collection of sources in the field to align the images, including compact clusters (that were unresolved by LT) and background galaxies. Using 11 such sources, the position of AT~2021blu on the HST+ACS image was localised with a root-mean-square uncertainty of 67 mas (see Fig. 5, bottom-left panel). Within this region, we find a single, bright source which we suggest to be the progenitor.
The DOLPHOT package (Dolphin, 2000) was used to perform PSF-fitting photometry on the progenitor candidate. While s exposures were taken with ACS in each of the and filters, these images were dithered and the location of AT 2021blu lies outside the field of view of one of the dither positions. We hence are left with only a single 380 s image in each of the and filters. We carefully examined this image for cosmic rays, but found that our photometry is unaffected by them. The following magnitudes are measured for the progenitor candidate: and mag (in the Vega magnitude system). All other sources within from this candidate are much fainter, and their integrated flux is about and of that of the AT~2021blu precursor in the and filters, respectively. Given the distance and extinction values adopted in Sect. 2, we obtain the following absolute magnitudes for the precursor of AT~2021blu: and mag.
Assuming a 5800 K blackbody consistent with the observed colour, we used the IRAF task SYNPHOT to calculate a conversion to Sloan filters, which provides and mag (AB system). These magnitudes are significantly brighter than earlier detections from ground-based telescopes, suggesting that the system was already in a pre-eruptive phase. For this reason, these HST data do not provide striking information on the nature of the quiescent progenitor system.
The second epoch of HST observations of the AT~2021blu field was obtained about 26 months later, when the LRN was very faint after the long luminosity decay following the second peak, and before the short-duration hump discussed at the end of Sect. 3.3.2. The source at the LRN location was much redder than at the first HST epoch, with and mag (in the Vega system). At this epoch, the integrated flux contribution of all faint sources within a radius of from the transient is in and in of the AT~2021blu flux. This may help to guess the contamination of background sources to late-time photometry of the LRN obtained with low spatial resolution ground-based facilities. Finally, applying the same strategy as above to convert magnitudes from the HST to the Sloan systems, we infer and mag (in the AB system).
4 Luminosity, radius, and temperature evolution
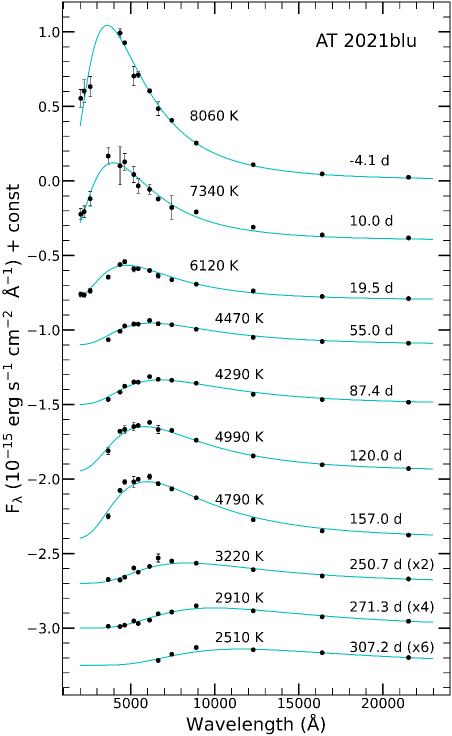
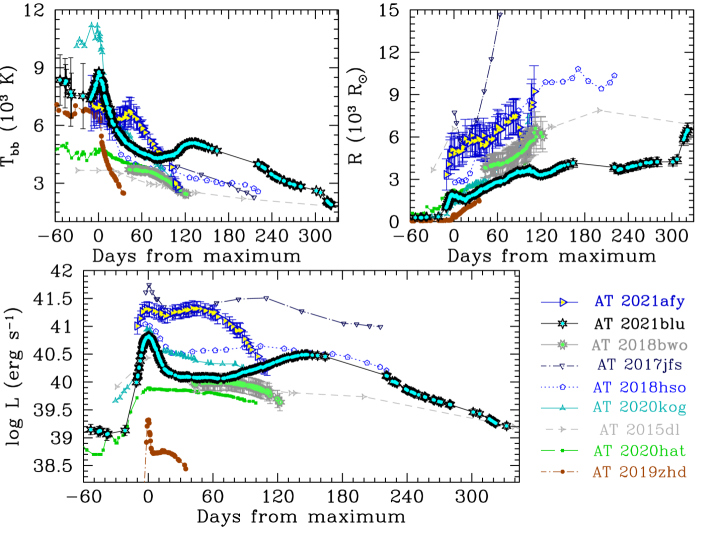
Adopting a similar approach as for other LRN studies (see, e.g. Cai et al., 2019; Blagorodnova et al., 2020, 2021; Pastorello et al., 2021b), we now estimate the bolometric light curves and the evolution of the temperature and the radius for the three objects. The broad-band light curves illustrated in Sect. 3 were used to infer the bolometric ones for the three LRNe. To obtain the bolometric luminosity at a selected epoch, we fit the reddening-corrected SED of the object at that epoch with a blackbody function. If the observation in one band is not available at that epoch, its flux contribution is estimated through an interpolation of available photometric data in adjacent epochs. Blackbody fits to the data of AT~2021blu at some selected epochs are shown for illustrative purposes in Fig. 7. The bolometric flux and the blackbody temperature (), along with their uncertainties, are determined through Monte Carlo simulations, as detailed by Valerin et al. (2022). The procedure is repeated for all epochs with multi-band observations. The resulting bolometric curves of the three LRNe are shown in Fig. 8 (bottom panel) and are compared with those of six well-studied LRNe.
AT~2021afy is one of the brightest objects in our sample. The two bolometric peaks have a very similar luminosity erg s-1 (which accounts for the errors in the host galaxy distance and the reddening estimate; see Sect. 2). Only AT~2017jfs is more luminous than AT~2021afy. In contrast with the expectation for a bright LRN, AT~2021afy remains luminous for a relatively short time ( months).
AT~2021blu has a quite luminous first peak, with a erg s-1, followed five months later by a fainter, second, broad maximum at erg s-1. The overall bolometric evolution resembles that of AT~2018hso (Cai et al., 2019), which is only marginally brighter than AT~2021blu.
As already mentioned in Sect.3.1, we could not follow the early-time evolution of AT~2018bwo. Consequently, we cannot precisely constrain the time of the early maximum, along with the duration of the LRN outburst. However, we argue that the outburst onset occurred several weeks before the discovery. We arbitrarily fixed the epoch of the early maximum at 40 days before our earliest detection. The object already appears to be on the plateau (or on a low-contrast second broad peak), with an average bolometric luminosity slightly exceeding erg s-1. In this phase, it is marginally brighter than AT~2020hat, an object that did not show a high-contrast early peak, and one order of magnitude brighter than AT~2019zhd, the lowest-luminosity object of the sample.
| UT Date | MJD | Phase | Instrumental configuration | Exp. time (s) | Range (Å) | Res. (Å) |
| AT 2018bwo | ||||||
| 2018-05-23 | 58261.18 | +8.3 | m SALT + RSS + PG0900 | 900 | 3640-7260 | 6 |
| 2018-05-26 | 58263.42 | +10.5 | 8.1 m Gemini-South + Flamingos-2 + JHG5801 | 2400 | 8920-18000 | |
| 2018-06-05 | 58274.41 | +21.5 | 6.5 m Magellan/Baade + FIRE | 2029 | 8200-24680 | |
| 2018-06-18 | 58287.30 | +34.4 | 4.1 m SOAR + Goodman + grt.400 | 1200 | 3700-7120 | 6.4 |
| 2018-07-11 | 58310.59 | +57.7 | 10 m Keck-I +LRIS +600/4000 | 1108 | 5600-10200 | 6 |
| 2018-08-25 | 58355.15 | +102.2 | 10.4 m GTC+OSIRIS + R1000B + R1000R | 2400+2400 | 3630-9800 | 7,8 |
| 2018-09-12 | 58373.26 | +120.4 | 6.5 m Magellan/Baade + FIRE | 1522 | 8200-24680 | |
| 2018-09-17 | 58380.90 | +128.0 | 10 m Keck-I +LRIS +600/4000 | 3600 | 5700-10200 | 6 |
| AT 2021afy | ||||||
| 2021-01-25 | 59239.26 | +7.6 | 10.4 m GTC + OSIRIS + R1000B | 3000 | 3630-7870 | 7 |
| 2021-02-17 | 59262.25 | +30.6 | 10.4 m GTC + OSIRIS + R1000B | 3600 | 3640-7870 | 7 |
| 2021-02-24 | 59269.19 | +37.5 | 10.4 m GTC + OSIRIS + R1000R | 3600 | 5080-10200 | 8 |
| 2021-04-06 | 59310.10 | +78.4 | 10.4 m GTC + OSIRIS + R1000R | 3600 | 5100-10400 | 8 |
| 2021-04-23 | 59327.02 | +95.3 | 10.4 m GTC + OSIRIS + R1000R | 2700 | 5100-10400 | 8 |
| AT 2021blu | ||||||
| 2021-02-06 | 59251.45 | 7.4 | 2.0 m FNT + FLOYDS | 3600 | 3500-10000 | 15 |
| 2021-02-07 | 59252.30 | 6.7 | 3.05 m Shane + Kast + 600/4310+300/7500 | 2460+2400 | 3620-10700 | 5,9 |
| 2021-02-10 | 59255.02 | 3.9 | 2.56 m NOT + ALFOSC + gm4 | 1800 | 3400-9650 | 14 |
| 2021-02-10 | 59255.46 | 3.4 | 2.0 m FNT + FLOYDS | 2700 | 3500-10000 | 15 |
| 2021-02-11 | 59256.24 | 2.6 | 3.05 m Shane + Kast + 452/3306+300/7500 | 1230+1200 | 3300-10300 | 5,9 |
| 2021-02-16 | 59261.05 | +2.2 | 1.82 m Copernico + AFOSC + VPH7 | 2700 | 3250-7270 | 14 |
| 2021-02-16 | 59261.05 | +2.2 | 3.6 m DOT + ADFOSC + 676R | 900 | 3550-8850 | 12 |
| 2021-02-18 | 59263.02 | +4.1 | 2.56 m NOT + ALFOSC + gm4 | 2440 | 3400-9700 | 14 |
| 2021-02-18 | 59263.29 | +4.4 | 3.05 m Shane + Kast + 600/4310+300/7500 | 2160+2100 | 3630-10740 | 5,10 |
| 2021-02-21 | 59266.12 | +7.2 | 3.6 m DOT + ADFOSC + 676R | 1200 | 3800-8880 | 11.5 |
| 2021-02-23 | 59268.37 | +9.5 | 10.0 m Keck-II + NIRES | 9640-24660 | ||
| 2021-02-25 | 59270.96 | +12.1 | 10.4 m GTC + OSIRIS + R1000B | 540 | 3630-7880 | 7 |
| 2021-03-02 | 59275.18 | +16.3 | 3.6 m DOT + ADFOSC + 676R | 1800 | 3700-8870 | 11.5 |
| 2021-03-05 | 59278.04 | +19.2 | 3.6 m DOT + ADFOSC + 676R | 1800 | 3900-8890 | 11.5 |
| 2021-03-07 | 59280.39 | +21.5 | 3.05 m Shane + Kast + 600/4310+300/7500 | 3060+3000 | 3620-10730 | 5,9 |
| 2021-03-14 | 59287.02 | +28.1 | 1.82 m Copernico + AFOSC + VPH7 | 3600 | 3350-7270 | 15 |
| 2021-03-15 | 59288.45 | +29.6 | 2.0 m FNT + FLOYDS | 2700 | 3500-10000 | 15 |
| 2021-03-18 | 59291.09 | +32.2 | 3.58 m TNG + LRS + LRB/LRR | 1800+1800 | 3350-9700 | 10,10 |
| 2021-03-30 | 59303.47 | +44.6 | 2.0 m FNT + FLOYDS | 2700 | 4000-10000 | 15 |
| 2021-04-02 | 59306.92 | +48.0 | 2.56 m NOT + ALFOSC + gm4 | 3600 | 3400-9680 | 14 |
| 2021-04-08 | 59312.46 | +53.6 | 2.0 m FNT + FLOYDS | 3600 | 3500-10000 | 15 |
| 2021-04-19 | 59323.89 | +65.0 | 10.4 m GTC + OSIRIS + R1000B + R1000R | 1500+1500 | 3630-10400 | 7,8 |
| 2021-05-05 | 59339.99 | +81.1 | 3.58 m + TNG+ LRS + LRB/LRR | 5400+3600 | 3400-9600 | 10,10 |
| 2021-05-12 | 59346.32 | +87.4 | 10.0 m Keck-I + LRIS + 600/400+400/8500 | 900+900 | 3150-10150 | 5,6 |
| 2021-05-18 | 59352.98 | +94.1 | 2.56 m NOT + ALFOSC + gm4 | 3800 | 3400-9600 | 18 |
| 2021-05-30 | 59364.97 | +106.1 | 2.56 m NOT + ALFOSC + gm4 | 3000 | 3400-9650 | 14 |
| 2021-06-04 | 59369.28 | +110.4 | 3.05 m Shane + Kast + 452/3306+300/7500 | 1230+1200 | 3400-10000 | 5,9 |
| 2021-06-15 | 59380.92 | +122.0 | 10.4 m GTC + OSIRIS + R2000B/R2500R | 1200+900 | 3850-7680 | 3.1,3.4 |
| 2021-06-29 | 59394.91 | +136.0 | 10.4 m GTC + OSIRIS + R1000B | 900 | 3630-7870 | 7 |
| 2021-07-08 | 59404.91 | +146.0 | 10.4 m GTC + OSIRIS + R1000B | 1200 | 3630-7870 | 7 |
The evolution of is shown in the top-left panel of Fig. 8. AT~2021blu is one of the hottest objects in the sample. The lack of simultaneous observations in multiple bands before the LRN outburst makes the estimates very uncertain. However, during the slow luminosity rise of the pre-outburst phase, remains between 7000 and 8000 K. Then, the temperature rises while the LRN reaches the first maximum. At peak, K, then declines to a relative minimum ( K) three months after the bolometric maximum. During the photometric rise to the second broad peak, the temperature grows again and reaches a maximum of K. Finally, it declines monotonically to K at d, and more rapidly later, reaching K one month later, when the bolometric light curve reaches a local minimum before the red hump discussed in Sect. 3.3.2. One may wonder if the assumption of a thermal continuum at such late phases is appropriate in the case of AT~2021blu. However, although AT~2021blu was not observed in spectroscopy after months past maximum (see Sect. 5.3 and Table 3), the SED is still consistent with a blackbody (Fig. 7). Furthermore, LRN AT~2021biy (Cai et al., 2022b) showed a similar behaviour in the late-time light curve and in the temperature evolution, while its spectra resembled those of intermediate M-type stars. All of this makes the assumption of thermal radiation at very late epochs plausible also for AT~2021blu.
AT~2021afy has a smoother temperature evolution. From the first days after the outburst onset and up to maximum light, remains nearly constant, at K. Then, two weeks after maximum, it slowly declines to a minimum of K, and rises again up to K at the time of the second light-curve maximum. The late phases are characterised by a linear temperature decline, which fades to –2900 K at phase 110 d.
Finally, the blackbody temperature of AT~2018bwo slowly declines from K to K over the observed follow-up campaign, similar to AT~2020hat during the plateau (Pastorello et al., 2021a) and AT~2015dl at the time of the second light-curve peak (Blagorodnova et al., 2017). Regardless of the exact explosion epoch, AT~2018bwo appears to have a cooler photosphere than other comparison objects, in agreement with Blagorodnova et al. (2021).
We can then estimate the evolution of the photospheric radius () for the three LRNe (Fig. 8, top-right panel). The value for AT~2021afy initially rises from 3300 R⊙ to 5000 R⊙ at the first maximum. After maximum, it increases more slowly, reaching –9000 R⊙ over three months later. The radius evolution of AT~2018bwo is somewhat similar, with ranging from about 3800 R⊙ to 6500 R⊙ over the two months following the discovery.
We note that both AT~2021afy and AT~2018bwo were observed in the optical bands at phases later than 110–120 d, but these observations mostly provide detection limits. In contrast, the two LRNe are clearly detected in the NIR bands, indicating a predominant emission in the IR domain (Blagorodnova et al., 2021). This incomplete SED information leads us to give uncertain bolometric luminosity estimates inferred from single-blackbody fits and, consequently, unreliable values of the temperature and the radius at very late phases.
The well-sampled panchromatic light curve of AT~2021blu allows us to study in detail how its evolves with time. In the pre-outburst phase, remains in the range 260–350 R⊙. At this phase, we expect that the photosphere is located in the common envelope. From phase about d to maximum light, rises from 1000 R⊙ to 1900 R⊙. After the peak, the photospheric radius initially declines to a local minimum observed two weeks after maximum ( R⊙) and then rises again until d, reaching a value of R⊙. This is followed by a shallow dip ( R⊙ at nearly 120 d) and a further increase. The radius, in fact, reaches a new maximum ( R⊙) soon after the broad light-curve peak, and then the photosphere recedes again by a few hundred solar radii when the object was re-observed after the seasonal gap. This phase is then followed by a new increase of the photospheric radius, which is initially slow, but later (at d) rapidly rises to a value of R⊙ at d, when the light curve reaches a minimum before the very late red and NIR hump. This feature, noticed also in AT~2021biy (Cai et al., 2022b) at a similar phase, can result from an additional source of energy, such as the CSM interaction.
The comparisons in Fig. 8 suggest not only that LRNe span a wide range of luminosities, but that there is also an evident heterogeneity in the bolometric light-curve shapes, with some objects showing a luminous early peak, while others (including AT~2020hat and, to a lesser extent, AT~2021afy) have a low-contrast first peak. The same heterogeneity is observed in the evolution of the temperature and radius at the photosphere; if LRNe are produced by the coalescence of the stellar cores in a binary system, this diversity can be considered as an indication that the two stellar components span a wide range of parameters.
5 Spectroscopic data
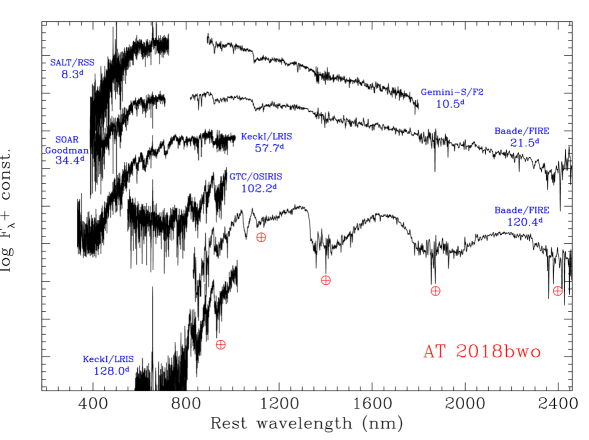
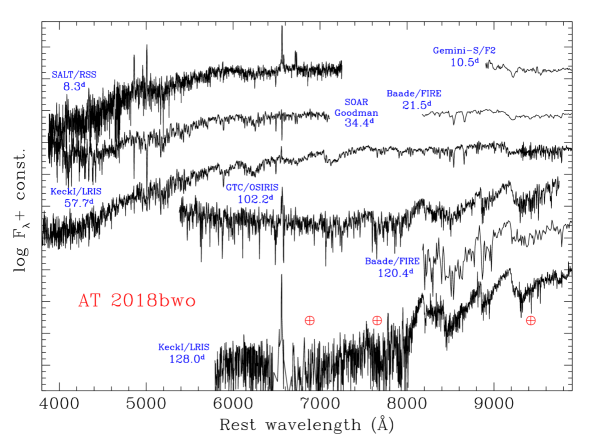
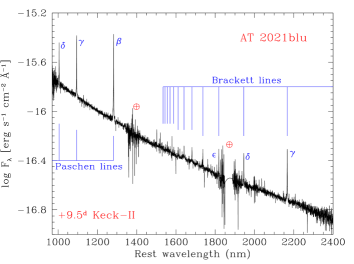
Blagorodnova et al. (2021) presented some optical and NIR spectra of AT~2018bwo. We complement their observations with an additional set of spectra obtained from a few days after the LRN discovery to months later. The spectra cover three phases of the LRN evolution: soon after the discovery, at the end of the plateau, and at very late phases when most of the LRN flux is emitted in the IR domain. We obtained five epochs of spectroscopy for AT~2021afy. All observations were performed after the first light-curve peak, until d. Given the faint apparent magnitude of the object, all spectra were obtained using the 10.4 m Gran Canarias Telescopio (GTC) with the Optical System for Imaging and low-Intermediate-Resolution Integrated Spectroscopy (OSIRIS). Finally, AT~2021blu has a more extensive spectroscopy, ranging from one week before maximum light to d. The instruments used for the spectroscopic observations of the three objects are listed in Appendix B, and basic information on the spectra is provided in Table 3.
All spectra were taken at the parallactic angle (Filippenko, 1982), except those obtained at Keck-I, where an atmospheric dispersion corrector is employed. The spectra were reduced using tasks in IRAF222222IRAF was distributed by the National Optical Astronomy Observatory, which was operated by the Association of Universities for Research in Astronomy (AURA), Inc., under a cooperative agreement with the National Science Foundation (NSF). or with dedicated pipelines such as FOSCGUI232323FOSCGUI is a Python-based graphic user interface (GUI) developed by E. Cappellaro, and aimed at extracting supernova spectroscopy and photometry obtained with FOSC-like instruments. A package description can be found at http://sngroup.oapd.inaf.it/foscgui.html. tool. The different tools perform the usual preliminary reduction steps, including bias subtraction and flatfield corrections of the two-dimensional images. Then, the spectra are calibrated in wavelength using comparison-lamp spectra and the night-sky lines, and 1-D spectra are optimally extracted. The spectra are flux-calibrated using spectra of standard stars taken during the night, and the calibration is finally checked versus the available photometry. Finally, the broad absorption bands of O2 and H2O due to Earth’s atmosphere are removed using the spectra of early-type stars, which are characterised by a nearly featureless continuum at the wavelengths of the telluric bands.
5.1 AT 2018bwo
The spectra of AT~2018bwo, shown in Fig. 9, have a red continuum with a number of molecular bands (primarily TiO), prominent both in the optical and the NIR regions. While our spectra complement those available in the literature, for a detailed line identification we direct the reader to Blagorodnova et al. (2021).
Our spectra are corrected only for Milky Way reddening, as specified in Sect. 2. Hereafter, the phases will be with reference to the time of the earliest LRN detection (MJD = 59252.9). Our first optical spectrum, at phase d, is noisy; hence, the narrow metal lines in absorption typical of LRNe in this phase cannot be discriminated from noise patterns. We detect narrow emission lines (H, [O II], [O III], [N II], [S II]) caused by contamination from host-galaxy H II regions, along with some bumps in the continuum which are possibly due to the emerging TiO features (in particular at 5200–5400 Å). The second spectrum was obtained two days later, and covers only the NIR domain (Fig. 9, top panel). It is characterised by a strong red continuum, but a few broad absorption features are observed at –11,300 Å (a known combination of CN and TiO features), and at –12,650 Å due to AlO and TiO, as proposed by Blagorodnova et al. (2021). Combining the d optical spectrum with the NIR spectrum at d, we measure the continuum temperature with a blackbody fit and find it to be K.
A NIR spectrum was also obtained at d (Fig. 9, top panel); it shows most of the features detected before, along with a prominent absorption band of TiO at 9100–9850 Å (Valenti et al., 1998). The AlO plus TiO blend at –12,650 Å is now less evident. The temperature of the continuum, K, is similar to that observed 11 days earlier, and is also consistent with those reported in Fig. 8 at a similar phase.
A second optical spectrum of AT~2018bwo, with higher S/N, was obtained at days. In this case, we see a red continuum ( K), a forest of narrow unresolved metal lines (also detected by Blagorodnova et al., 2021), along with some TiO bands, with the strongest being at 6100–6400 Å. The clear detection of narrow absorption lines of Ba II and Fe II allows us to estimate the photospheric velocity at this phase, km s-1. The H feature due to the LRN is barely visible, and cannot be disentangled from the narrow H of a nearby H II region.
The third optical spectrum (phase d) taken with the 10 m Keck-I telescope has good S/N. It shows a remarkably red continuum ( K) dominated by broad TiO absorption features. Metal lines (with Ba II being particularly strong) are still well visible. From the position of the minimum of the absorption metal lines, we infer a photospheric velocity of km s-1, still constant, and consistent (marginally higher) with that reported by Blagorodnova et al. (2021) for an almost coeval spectrum. H has a P Cygni profile, with an unresolved emission component, and an absorption which is blueshifted by km s-1.
Very-late-time optical spectra (at and d; see Fig. 9, bottom panel) show a continuum flux only above 7300 Å, along with very pronounced absorption bands at 7600–8000 Å, 8200–8750 Å, 8850–9050 Å, and above 9200 Å due to TiO, VO, and CN, usually visible at these phases in LRNe (e.g. Martini et al., 1999). We also obtained a third NIR spectrum at d, which is very similar to the spectrum obtained 110.6 d after the first LRN detection242424This phase corresponds to d adopting their reference epoch. shown by Blagorodnova et al. (2021). We confirm the detection of a number of molecular bands (TiO, VO, CN, and AlO), along with that of the CO band heads. All of these features are in common with late M-type to early L-type cool stars, as reported by Blagorodnova et al. (2021). However, while we confirm the detection of the broad molecular bands, our spectrum of AT~2018bwo does not convincingly support the detection of the numerous narrow metal lines identified in the late-time NIR spectrum of Blagorodnova et al. (2021, see their Fig. 7).
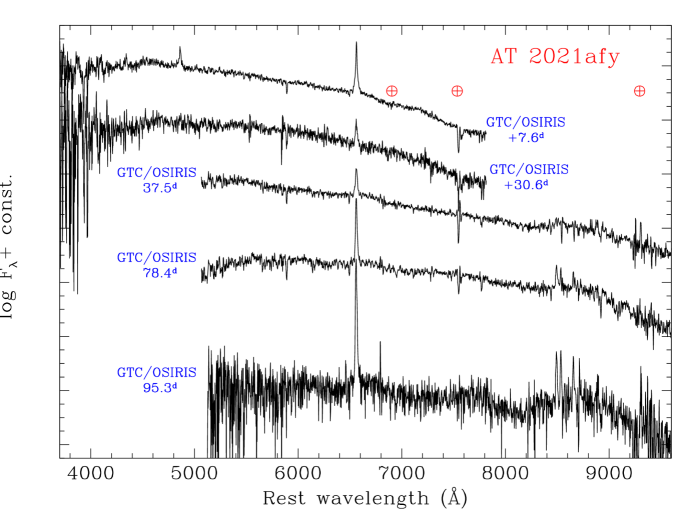
5.2 AT 2021afy
We obtained five GTC+OSIRIS spectra of AT~2021afy, spanning a period from a week to over 3 months after maximum brightness. The spectral sequence is shown in Fig. 10. Deep interstellar absorption of Na I D is present at the host-galaxy redshift, which is attributed to material along the LRN line of sight. Assuming a standard gas-to-dust ratio, we expect a significant extinction of the transient’s light in the host galaxy. We measure this Na I D absorption in the three higher-S/N spectra and find an equivalent width (EW) of Å. Following Turatto et al. (2003), we obtain the amount of host-galaxy extinction from the relation between EW of the Na I D and colour excess, mag. Accounting for the Milky Way reddening component, we obtain a total colour excess of mag (see Sect. 2).
The five spectra, after the correction for the total reddening estimated above, show the typical evolution of LRNe (see, e.g. Pastorello et al., 2019a). The spectrum at d shows a moderately blue continuum with K, prominent lines of the Balmer series in emission with a Lorentzian profile and a full width at half-maximum (FWHM) velocity () of km s-1 (after correction for instrumental resolution). Some line blanketing of metal lines (mostly Fe II) is likely responsible for the flux drop at wavelengths shorter than Å.
The second spectrum, at phase d, is more noisy. It appears to be slightly redder ( K), and H is significantly weaker but marginally broader, with km s-1. A higher-S/N spectrum was taken at d, and now shows a number of absorption metal lines (Fe II, Ba II, Sc II), as observed in other LRNe during the second photometric peak (Pastorello et al., 2019a, 2021a). The continuum temperature is K and H is still visible in emission, with km s-1.
The narrow metal lines in absorption become more prominent at d, the spectral continuum indicates a much lower temperature ( K), and H becomes more pronounced, although narrower (with km s-1). Its profile cannot be well fitted by a Gaussian function, so its FWHM has been obtained through a Lorentzian fit. In this phase, the Ca II NIR triplet is in emission, becoming the second strongest spectral feature. The last spectrum (at phase d; K) has lower S/N, and shows prominent NIR Ca II lines and H, the latter with km s-1.
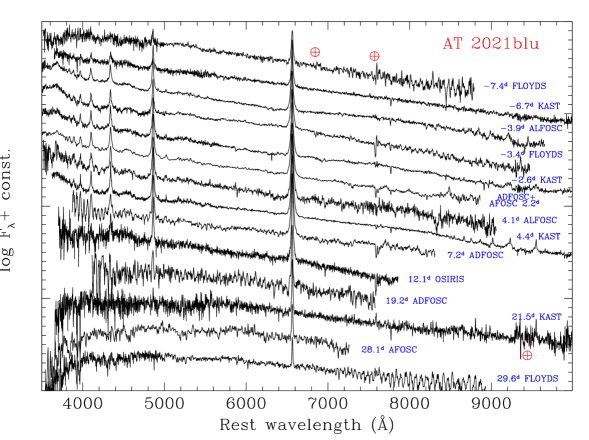
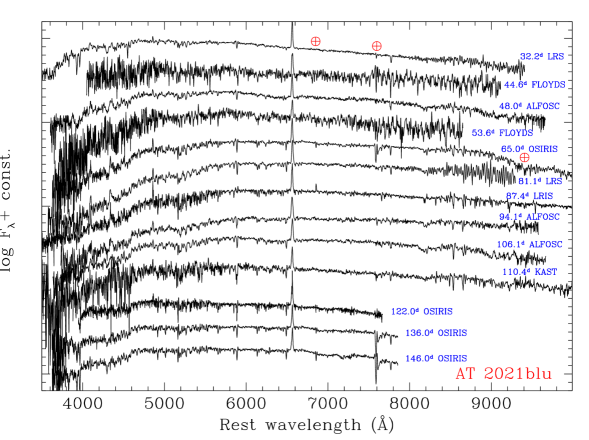
5.3 AT 2021blu
Optical spectra of AT~2021blu were obtained from week before the first blue peak to months later, corresponding approximately to the time of the second (red) maximum. We collected almost thirty spectra, although not all of them have good S/N. The sequence with the best-quality spectra is shown in Fig. 11.
All spectra obtained during the first peak (from d to d) are very similar, being characterised by a blue continuum (with in the range between 7500 K and 8000 K) and Balmer emission lines having Lorentian profiles and a typical –500 km s-1. Paschen lines are also detected in the good-quality d spectrum, along with numerous multiplets of Fe II in emission. The H lines are marginally resolved, with km s-1. The continuum temperature remains between 7500 and 8000 K over the entire period.
From about d to d, the spectra become progressively redder, the Fe II emission lines are replaced by absorption features, and H becomes fainter, although its profile always remains in pure emission. A residual Lorentzian profile still seems to persist, but the highest-resolution spectra in this phase are only marginally resolved (with km s-1). In the two spectra at d and d, the continuum temperature declines to K and K, respectively. Other metal lines are now visible in absorption, including Fe II, Sc II, Ba II, Na I D, Ca II (H&K and the NIR triplet), and O I.
The subsequent spectra show even more pronounced metal lines (in particular, the Ba II multiplets), while the continuum temperature continues its decline from K at d to K at d (see also Fig. 8, top-left panel). In this phase, the profile of the H emission line becomes more asymmetric, with a redshifted emission peak. The FWHM velocity at d obtained through a Lorentzian fit is km s-1.
Hereafter, the continuum temperature rises again, reaching K at d. At this phase (starting d after the blue peak), the light curve reaches the broader and redder second maximum. The spectra are dominated by a forest of metal lines, while H, visible until now, disappears in the last available spectra (at phases above d). At the same time, the H profile becomes more markedly asymmetric with time (see Fig. 12, right panel).
While our spectroscopic monitoring campaign of AT~2021blu stopped months after maximum brightness, an optical spectrum was obtained by Soraisam et al. (2022) months after maximum, showing the typical TiO bands observed in LRN spectra at late epochs.
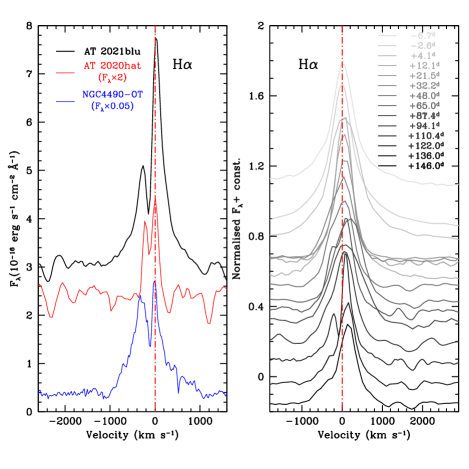
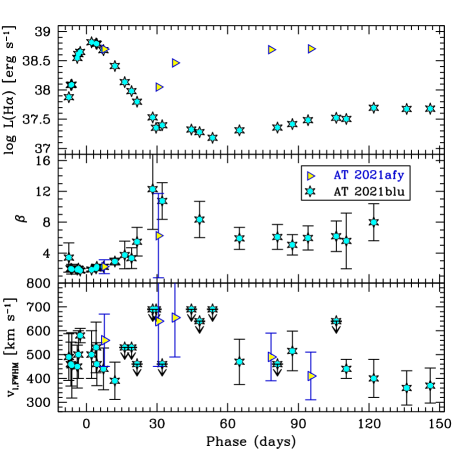
The H luminosity evolution of AT~2021blu is shown in the top panel of Fig. 13, while the evolution of the Balmer decrement (the H/H flux ratio) is reported in the middle panel. The values inferred for AT~2021blu are compared with those of AT~2021afy, while no measure was performed on the AT~2018bwo spectra because of the strong contamination of the narrow lines owing to nearby H II regions. We note that the evolution of the H luminosity of both AT~2021blu and AT~2021afy roughly follows the global trend of the bolometric light curves. Except for the very early phases, when the H luminosity of the two objects is comparable, it is systematically fainter in AT~2021blu.
The evolution of for AT~2021blu and AT~2021afy, obtained by fitting the H line with a Lorentzian function, is shown in the bottom panel of Fig. 13. We note that has a very slow evolution in both objects, and tends to decrease with time. The Balmer decrement () of AT~2021blu (Fig. 13, middle panel) has a minimum value of at around the time of the early light-curve peak, and it is similar to that observed in the d spectrum of AT~2021afy. These values are only slightly smaller than those expected from Case B recombination. The Balmer decrement of AT~2021blu increases up to –12 one month later, then declines to about two months past maximum light, and finally remains nearly constant during the long-lasting light-curve minimum.
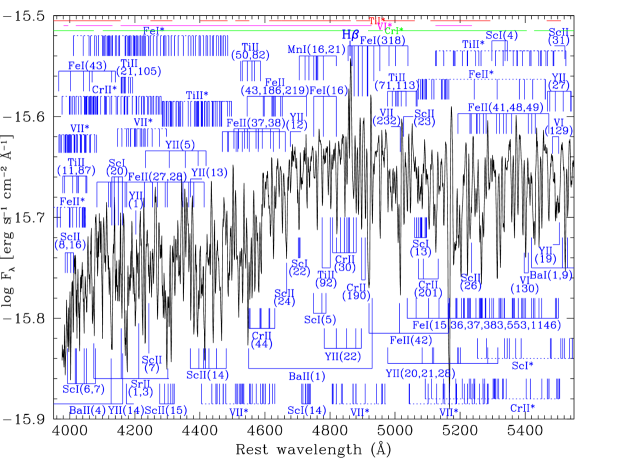
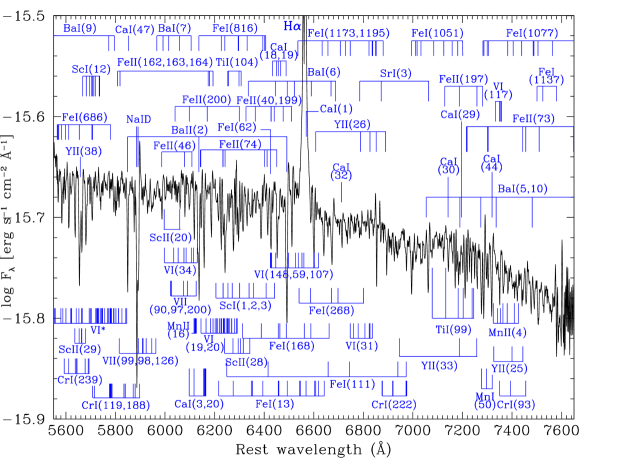
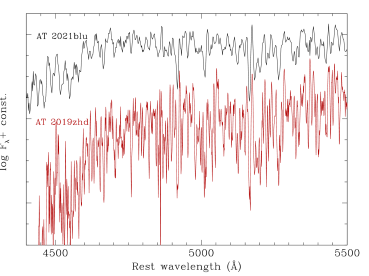
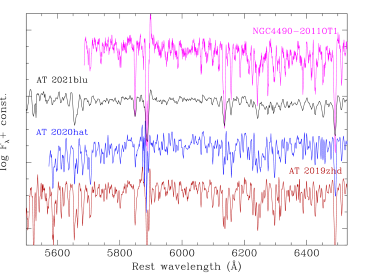
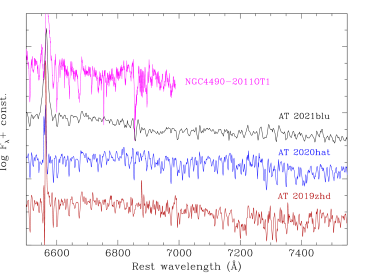
The high-quality, moderate-resolution GTC spectrum obtained at phase d reveals the nature of the asymmetry of H. The line is mostly in emission, but a narrow absorption component is observed, blueshifted by km s-1 (Fig. 12, left panel), similar to that observed in good-resolution spectra of LRNe AT~2020hat (Pastorello et al., 2021a) and NGC4490-2009OT1 (Smith et al., 2016). This spectrum of AT~2021blu allows us to identify the forest of lines visible at the time of the second photometric peak (Fig. 14). For the 5600–7600 Å region, we follow the identification performed in the AT~2020hat spectrum presented by Pastorello et al. (2021a), given the excellent match of the lines observed in the two spectra, while for the bluest spectral region, we use the transitions listed by Moore (1945). The forest of narrow features identified in the AT~2021blu spectrum in Fig. 14 are real metal lines and not noise patterns, as they are also detected in the best-resolution spectra of other LRNe (see Fig. 15) at a similar evolutionary stage. In particular, we find evidence for the presence of neutral and singly ionised Fe, Ti, Cr, Sc, V, Sr, Ba, and Y, along with Mn II. While the detection of Ca I lines is only tentative, the main Ca II lines are outside the range of the d spectrum. However, the H&K and the NIR triplet of Ca II are unequivocally detected in the low-resolution spectra at earlier and later epochs. The very strong absorption lines of Ba II allow us to precisely estimate the photospheric velocity as km s-1.
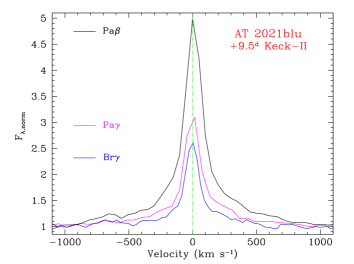
A NIR spectrum of AT~2021blu was obtained with the Keck-II telescope equipped with the Near-Infrared Echellette Spectrometer (NIRES; see Fig. 16, top panel) about 10 d after the first peak. The continuum matches that of a blackbody with K. Searching for individual features, we identify only H lines in emission of the Paschen and Brackett series, with a profile which is approximately Lorentzian, with a FWHM velocity of km s-1 (Fig. 16, bottom panel).
6 Discussion
From the data for the three transients discussed in this paper, it is evident that LRNe span a very wide range of observational parameters, as reported in previous studies (see, e.g. Pastorello et al., 2019a; Blagorodnova et al., 2021). In particular, the light curve of AT~2021afy exhibits a very small luminosity difference between the two peaks, while in AT~2021blu the luminosity of the early peak is largely predominant over that of the second peak. Apparently, AT~2018bwo does not show an early blue peak, although the observations suggest that the object was discovered in a late stage of its evolution. In this small sample, AT~2021blu is the object with the best observational coverage: we constrained its long-lasting phase with a slowly rising light curve prior to the LRN outburst, the classical double-peaked light curve of the outburst, and finally a late-time hump in the red optical and NIR light curves. All of this makes AT~2021blu one of the rare LRNe with comprehensive information on the main photometric parameters along its entire evolution.
For AT~2018bwo and AT~2021blu, we can also constrain the properties of the progenitor system through the inspection of archival images, when the stars were likely in quiescence. As we subsequently see in Sect. 6.1, this photometric information is crucial for inferring the progenitor mass. Other parameters of the progenitor can be estimated through simple models available in the literature (see Sect. 6.2). Finally, correlations among observational parameters of LRNe are systematically investigated in Sect. 6.3.
6.1 Progenitors
Blagorodnova et al. (2021) performed a detailed analysis of the nature of the stellar system that produced AT~2018bwo. In particular, they found a yellow source at the location of AT~2018bwo in the HST images obtained in 2004, 14 yr before the LRN outburst. At that epoch, the progenitor system was assumed to be in a quiescent stage. The progenitor’s photometry reported by Blagorodnova et al. (2021), with our assumptions regarding the host-galaxy distance and reddening, provides mag, and colours of mag and mag. Adopting the standard transformations between magnitudes in the natural HST photometric system and the Johnson-Bessell system (for an F6 star), we obtain mag. With this absolute magnitude, the binary system producing AT~2018bwo belongs to the intermediate-luminosity population of LRN progenitors.
As discussed by Blagorodnova et al. (2021), the absolute magnitude of the quiescent progenitor and the luminosity of the LRN outburst are tightly correlated with the mass of the progenitor system. Blagorodnova et al. (2021) compared the photometric parameters of the progenitor of AT~2018bwo (adopting slightly different reddening assumptions) with both single and binary stellar evolution models, and found that the best-matching progenitor was a binary with a massive yellow supergiant primary, whose mass ranged from 11 to 16 M⊙. The binary interaction then led to the ejection of a common envelope as massive as 0.15–0.5 M⊙ (Blagorodnova et al., 2021). Unfortunately, the photometric evolution of the system after the ejection of the common envelope is poorly constrained, as only a shallow upper limit to the total magnitude of the system is available at that phase ( mag, using the stacked unfiltered images obtained in mid-2017 by DLT40, and scaled to Johnson-Bessell -band photometry). Furthermore, AT~2018bwo was not observed at early phases because of the gap caused by solar conjunction. Blagorodnova et al. (2021) suggested that if the object was not very old when discovered, a very expanded photosphere at the time of the coalescence was necessary to explain its initial red colour. However, we cannot rule out that the object was discovered when it was already at the red peak (or the plateau) phase. Our interpretation is supported by the detection of AT~2018bwo about 1 week before the discovery epoch (Sect. 3.1), at a similar magnitude. In this respect, AT~2018bwo was likely discovered at a similar evolutionary stage as LRN UGC12307-2013OT1 presented by Pastorello et al. (2019a), where the early blue peak was missed owing to the seasonal gap.
Given the relatively large distance of the host galaxy ( Mpc), we have limited information about the AT~2021afy progenitor. HST imaged the LRN field252525Program GO-8645, PI R. Windhorst. on 2000 September 7. From an inspection of the available and images, no source is visible at the LRN location down to mag and mag, respectively. Furthermore, public stacked images obtained by Pan-STARRS several years before the outburst do not show sources at the location of AT~2021afy, with upper limits of , , , and mag (Table 4). Adopting the Johnson-to-Sloan band transformation relations of Jester et al. (2005) for normal stars, we obtain an upper detection limit of mag for the quiescent system. With the ZTF stacked images obtained in mid-2018, shallow upper limits for the slow pre-LRN rise are also derived (, , mag). Again, using Jester et al. (2005) conversions, we infer a limit of mag for the pre-LRN brightening. This phase is then followed by the classical LRN luminosity evolution, characterised by two peaks with almost the same luminosity, separated by a shallow minimum (see Sect. 3.2).

The information available for the quiescent progenitor of AT~2021blu is less robust than that of AT~2018bwo. The only pre-outburst HST observation was taken in December 2019 (Sect. 3.3.3), when the object was already in the slow brightening phase. For this reason, we inspected earlier images taken with ground-based telescopes and found a source with minor variability across the 2006 to 2016 decade (see Sect. 3.3.1). In 2006, we infer the following absolute magnitudes and intrinsic colours for the precursor of AT~2021blu: mag, mag, and mag. We also inspected PS1 template images obtained by stacking numerous frames taken before early 2015, and we inferred the following reddening-corrected absolute magnitudes and colours: mag, mag, mag, mag, and mag.
First, we assume that the measured source is the progenitor star and that the flux contamination of nearby stars is negligible (see Sect. 3.3.3). The main parameters of this source can be estimated by fitting the SED with a blackbody function, as detailed in Sect. 4. The best fit to the SED is obtained with a blackbody of K (Fig. 17). Given the above colours and accounting for the error bars, the source at the progenitor’s location corresponds to a star of F3–F4 spectral type. We also infer erg s-1 and R⊙ for the putative progenitor of AT~2021blu.
We now discuss the issue of the flux contamination from nearby sources in the photometry of the AT~2021blu progenitor. In Sect 3.3.3, we estimated that on 2019 December 29 the flux of the contaminating sources within a radius of from the transient was in and in of the LRN precursor flux. If we consider the flux of the quiescent progenitor in the Sloan and bands during the 2006–2016 period, the total flux of other stars within is estimated to be about and (respectively) of the progenitor flux. Although HST did not observe the field of AT~2021blu in blue filters, we note that the contaminating sources are significantly redder than the AT~2021blu progenitor. For this reason, the contamination is expected to be modest in the blue bands. Removing the contribution of the contaminating source would probably make the progenitor slightly bluer, changing the intrinsic colour to mag and thus shifting its classification towards an early-F star (see, e.g. Finlator et al., 2007; Fukugita et al., 2011). However, given that precise information on contaminating sources is only available for two HST filters, hereafter we assume that the flux of the source observed from 2005 to 2016 is largely dominated by the progenitor’s contribution, with the caveat that the progenitor is possibly slightly hotter ( K) and fainter.
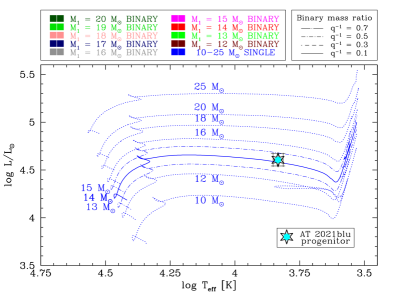
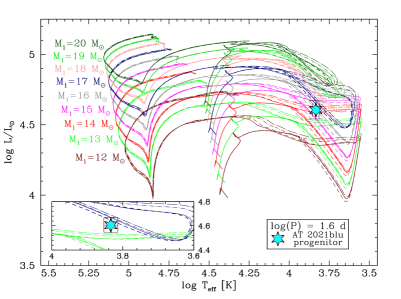
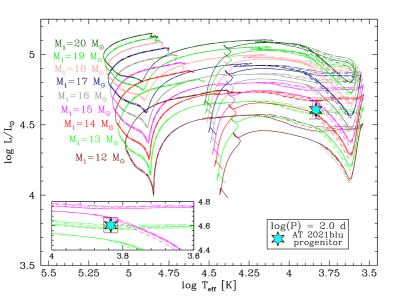
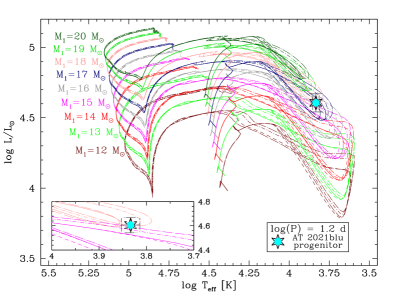
To constrain the mass of the AT~2021blu progenitor, we made use of a grid of BPASS evolutionary-track models 262626The tracks are taken from https://bpass.auckland.ac.nz/index.html. for single stars and binary systems at solar metallicity (Eldridge et al., 2017; Stanway & Eldridge, 2018), and plotted them in the Hertzsprung-Russell diagram (HRD). Single-star models from 10 to 25 M⊙ are shown in Fig. 18 as blue dotted lines, along with binary models with primary stars having ZAMS mass () ranging from 12 to 20 M⊙ (the tracks for the different stellar masses are shown with different colours). For each value of , we report tracks computed for different mass ratios of the two members of the binary (, 0.3, 0.5, and 0.7) and for three indicative initial orbital periods (, 40, and 100 days). The cyan starred symbol in Fig. 18 represents the photometric point of the AT~2021blu progenitor obtained without removing the contribution of stars within . Single-star models for M⊙ provide an excellent match to the observed photometry of the candidate progenitor of AT~2021blu. Evolutionary tracks for binary systems also well match the position of the observed progenitor in the HRD, in particular binaries whose primary has a mass ranging between 13 and 16 M⊙. We note, however, that even systems with more massive primaries are consistent with the progenitor’s photometry when the initial orbital period decreases, as we can expect for the binary progenitor of AT~2021blu. Consequently, if we include systems with (nearly 15 days), the range of possible masses for the primary star widens to 13–18 M⊙ (see the insets in Fig.18).
Unfortunately, the mass of the secondary companion is poorly constrained, as the evolutionary tracks are less sensitive to its mass; hence, we can only provide crude limits to the total binary mass, which lie in the range272727The lower binary mass limit is computed assuming M⊙ and , while the upper limit is computed assuming M⊙ and .. We remark that the above mass estimates assume that the observed progenitor in quiescence is not affected by significant circumstellar reddening. Additional reddening would make the progenitor more luminous and hotter, hence leading to a larger mass. Furthermore, removing the flux of the contaminants within would shift the location of the progenitor in the HRD to a slightly higher effective temperature and a marginally lower bolometric luminosity, without significantly changing the mass estimates.
Kochanek et al. (2014) noted the existence of a possible correlation between the LRN absolute magnitude at maximum brightness and the progenitor mass, which was later confirmed by Blagorodnova et al. (2021) based on a wider compilation of data from the literature. The analysis of Blagorodnova et al. (2021) has been recently revised by Cai et al. (2022b), with different assumptions about the distance and the reddening, and after adopting Johnson-Bessell as the reference band. Finally, Cai et al. (2022b) considered the magnitude of the second peak (or the plateau) instead of the magnitude of the first peak, as the former is likely dependent on the mass of the recombining hydrogen, while the latter is probably more sensitive to the parameters (mass and velocity) of the high-velocity gas ejected in the polar direction during the merging process (Metzger & Pejcha, 2017).
The empirical relation between the absolute magnitudes in the band at the second peak (or the plateau) and the mass (weighted by the uncertainties) obtained by Cai et al. (2022b) is
| (1) |
This relation can be used to infer an independent estimate of the mass of the LRN progenitors when the early-time light curve is not available. The masses of progenitors of LRNe with known photometric information during the second peak (or the plateau) inferred using Eq. 1 are reported in Table 4 (Column 12). For AT~2021blu, we obtain M⊙, consistent (within the large uncertainties) with the mass derived through the comparison of the archival progenitor imaging with the evolutionary tracks discussed above. This makes more plausible our suggestion that the faint source imaged in archival frames at the AT~2021blu location was dominated by the flux of the LRN progenitor. As a consistency check, we note that AT~2021blu is marginally brighter than AT~2015dl (whose progenitor system was estimated to have a primary of M⊙; Blagorodnova et al., 2017); thus, a total mass of M⊙ is a realistic estimate for the primary progenitor of AT~2021blu.
For AT~2021afy we infer a much larger progenitor mass, as expected from the high luminosity of its second light-curve peak: M⊙. We note, however, that the large error in the -band absolute magnitude at maximum (Sect. 2, and Table 4) makes this mass estimate quite uncertain. At the adopted distance, AT~2021afy is slightly less luminous than SNhunt248 (Kankare et al., 2015; Mauerhan et al, 2015, 2018) at the first brightness maximum, and is somewhat similar to NGC4490-2011OT1 (Smith et al., 2016; Pastorello et al., 2019a) (see Table 4). For this reason, we expect that its binary progenitor system belongs to the massive edge of the LRN distribution.
6.2 The merger scenario
While there is a consensus that the LRN phenomenon is an outcome of common-envelope binary evolution (Ivanova, 2017; Barsukova et al., 2017; Jones, 2020, and references therein), whether the two stars merged or rearranged into a new stable binary configuration is more debated (Howitt et al., 2020). Convincing arguments favouring the final merging scenario were provided by the detailed study of the Galactic LRN V1309~Sco (Mason et al., 2010; Tylenda et al., 2011; Mason & Shore, 2022). Specifically, as mentioned in Sect. 1, the decade-long follow-up observations of V1309~Sco performed by the OGLE survey, and the thorough observational studies by Tylenda et al. (2011), revealed the multiple stages leading to the LRN eruption. V1309~Sco showed a long-lasting phase of slow luminosity rise with a superposed binary variability, with a period of days. Then, the photometric period started to shorten as a consequence of the loss of systemic angular momentum, finally leading to the orbital decay. In 2007, the light curve showed a sudden decline, and the signatures of binary modulation disappeared. This was interpreted as the consequence of an outflow of material from the primary that generated an optically thick, expanding envelope. The common envelope engulfed the binary system, hiding the binary modulated variability. As a consequence of a continuous optically thick outflow (Pejcha, 2014), the photometric minimum was followed by a gradual luminosity rise which lasted about half a year. In that phase, V1309~Sco brightened by mag. A steep brightening by a further mag in about 10 days followed, and was attributed to the initial thermal energy from the outer, high-velocity, hot ejecta launched in the polar direction during the coalescence of the secondary’s core onto the primary (e.g. Metzger & Pejcha, 2017).
Although such high-cadence monitoring is not available for other LRNe, fragments of the sequence of the physical processes leading to an LRN outburst were observed for a number of extragalactic objects282828Extensive datasets of bright LRNe were provided by Blagorodnova et al. (2017); Mauerhan et al (2015, 2018); Kankare et al. (2015); Williams et al. (2015); Kurtenkov et al. (2015); Smith et al. (2016); Goranskij et al. (2016); Lipunov et al. (2017); Blagorodnova et al. (2017, 2020, 2021); Cai et al. (2019, 2022b); Pastorello et al. (2019a, b, 2021a, 2021b); Stritzinger et al. (2020).. All of them are intrinsically more luminous and longer lasting than V1309~Sco, but the general morphology of the light curve is similar. In particular, for the closest events, we monitored the slow brightening phase after the common-envelope ejection, which lasted up to a few years (see Fig. 4, top panel, for AT~2021blu), followed by a rapid brightening to the first maximum, and a subsequent luminosity decline to a plateau (or a new rise to a second, much broader and redder maximum). This particular morphology of the light curve was discussed in a number of studies. MacLeod et al. (2017) proposed that the first light-curve maximum is produced by a violent, merger-driven, high-velocity gas outflow. Then, a rapid luminosity decline is followed by a plateau or a second broad peak, usually explained by the recombination of the H-rich gas (Ivanova et al., 2013b; MacLeod et al., 2017), with most of the LRN energy being radiated during the plateau phase. This interpretation is supported by the effective temperature showing a minor evolution in this phase, the H emission component disappearing, and the spectrum becoming dominated by narrow absorption lines of metals. However, some scatter in the effective plateau temperatures can be noticed among the objects, with spanning from 3000 K to 6000 K, suggesting that shell-shell interaction or even a further mass ejection (Ivanova et al., 2013b) can also contribute to sustaining the light curve during this phase.
| LRN name | Host | Distance | (prog) | (CE) | |||||||
|---|---|---|---|---|---|---|---|---|---|---|---|
| galaxy | (Mpc) | (mag) | (mag) | (mag) | (mag) | (mag) | optical | (days) | (M⊙) | ||
| AT~2021afy | UGC 10043 | 1.0 | 120 | ||||||||
| UGC12307-2013OT1 | UGC 12307 | – | – | – | – | ||||||
| AT~2017jfs | NGC 4470 | – | 2.6 | 157 | |||||||
| SNhunt248 | NGC 5806 | 2.1 | 169 | ||||||||
| AT~2020kog | NGC 6106 | 2.0 | 100 | ||||||||
| AT~2018hso | NGC 3729 | – | 3.7 | 201 | |||||||
| NGC3437-2011OT1 | NGC 3437 | 0.9 | 174 | ||||||||
| AT~2014ej | NGC 7552 | – | |||||||||
| NGC4490-2011OT1 | NGC 4490 | 0.9 | 200 | ||||||||
| AT~1997bs | NGC 3627 | – | 3.2 | 62 | |||||||
| AT~2021blu | UGC 5829 | 2.4 | 242 | ||||||||
| AT~2021biy | NGC 4631 | 2.7 | 375 | ||||||||
| AT~2018bwo | NGC 45 | – | – | ||||||||
| AT~2015dl | M 101 | 2.0 | 229 | ||||||||
| AT~2020hat | NGC 5068 | 1.5 | 131 | ||||||||
| AT~2019zhd | M 31 | 5.1 | 27 | ||||||||
| M31LRN2015 | M 31 | 2.4 | 62 | ||||||||
| M31RV | M 31 | 2.0 | 110 | ||||||||
| CK~Vul) | Galaxy | – | – | 0.7 | 400 | – | |||||
| V838~Mon | Galaxy | – | 1.7 | 82 | |||||||
| V4332~Sgr | Galaxy | – | – | – | – | – | |||||
| V1309~Sco | Galaxy | – | 3.1 | 29 | |||||||
| OGLE-2002-BLG-360 | Galaxy | – | 1.0 | 837 | |||||||
| OGLE-2002-BLG-360 | Galaxy | – | 1.0 | 837 | – |
Mass estimates obtained through the direct detection of the progenitor or via light-curve modelling, as adopted by Cai et al. (2022b). The Milky Way reddening towards OGLE-2002-BLG-360 follows a non-standard reddening law ( mag, with ; Nataf et al., 2013). While the parameters for the -band photometry are robust, those inferred for photometry are uncertain owing to the low-cadence follow-up observations in that filter. The magnitudes are obtained through an interpolation of the colour curve at the epochs of the -band peaks. ) In this table, the parameters for CK~Vul are taken from Banerjee et al. (2020).
Matsumoto & Metzger (2022) recently presented accurate one-dimensional models of LRN light curves which improve on previous studies based on Popov (1993) approximations. The models of Matsumoto & Metzger (2022) assume that the short-lasting initial blue peak is due to thermal energy release from the low-mass, fast outer ejecta dominated by radiation pressure, while the second long-duration red peak emission is powered by hydrogen recombination. This study offers a grid of light-curve models showing two luminosity peaks, remarkably similar to those observed for LRNe. Following Matsumoto & Metzger (2022), we can estimate the LRN parameters during the first peak. In particular, the ejected mass () is inferred from
| (2) |
where is the duration of the first peak and is the velocity of the outer ejecta. The launching radius () is given by
| (3) |
where is the bolometric luminosity of the first light-curve peak. Finally, an upper limit to the energy radiated during the first peak () can be obtained from
| (4) |
We use Eq. 2-4 to infer the early physical parameters of the AT~2021blu ejecta, adopting the following values for the observed parameters: km s-1 (see Sect. 5.3, for the ejecta velocity at early phases), erg s-1, and days. We obtain M⊙, R⊙, and erg. We note that the above launching-radius estimate is reasonably similar to that inferred from the blackbody fit to the pre-outburst SED in Sect. 4 (see Fig. 8, top-right panel).
The same calculation can be performed for AT~2021afy, taking into account that the distance towards UGC~10043 adopted in this paper is affected by a large uncertainty (Sect. 2). From the observed parameters km s-1, erg s-1, and days, we infer M⊙ and R⊙, while the upper limit to the energy radiated during the first peak is erg. Hence, although the mass of the fast and hot ejecta is similar in the two objects, the energy radiated during the first peak is a least a factor of two (up to four) times higher in AT~2021afy than in AT~2021blu.
After the early peak, the light curve reaches a minimum before rising again to the second broad maximum, which is mostly powered by hydrogen recombination. We still follow Matsumoto & Metzger (2022) to describe the recombination phase. The mass of the recombining hydrogen shell () is obtained through the relation (equivalent to Eq. 16 in Matsumoto & Metzger, 2022, assuming that H recombines at a characteristic constant density of g cm-3)
| (5) |
For AT~2021blu, we assume a recombination phase lasting days and a luminosity erg s-1 during the second peak. More tricky is the choice of the velocity of the recombining material (). If km s-1 (at the time of the second peak; see Sect. 5.3 and Fig. 13), we obtain M⊙. If we instead adopt the photospheric velocity from the minimum of the absorption metal lines (250 km s-1), we infer a much smaller mass value of M⊙. We remark that the above mass estimates should be regarded as upper limits, obtained through the crude assumption that H recombination is the only source powering the light curve at this phase.
In the case of AT~2021afy, we adopt the following parameters during the second peak: days, erg s-1, and km s-1. This last value is obtained from a weighted average of measured in the spectra of AT~2021afy from +30 to +80 d after the first peak. We find that M⊙, about one order of magnitude smaller than the mass of the recombining material inferred for AT~2021blu.
Although we have poor constraints on the epoch of the AT~2018bwo outburst onset, we can tentatively estimate the mass of the recombining gas from the observed parameters during the plateau. We adopt km s-1 (Sect. 5.1) and erg s-1 (Sect. 4), while the minimum plateau duration is days. With these assumptions, we obtain M⊙. With a plateau duration of at least 60 days, the mass rises to M⊙, which is within the range of ejected mass extremes (0.02–2 M⊙) determined by Blagorodnova et al. (2021) using different calibration methods (see their Sect. 5.3).
Finally, using the values of and reported above, the upper limits to the total energy radiated during the second peak can be derived from
| (6) |
Applying Eq. 6 to AT~2021blu, we obtain erg, which is equivalent to the energy radiated during the first peak, and it is smaller than the value inferred for AT~2021afy ( erg)303030If we account for the error in the luminosity at the second peak, erg s-1, the upper limit to the total energy radiated by AT~2021afy in this phase ranges from to erg.. Assuming a plateau duration of 60 days, for AT~2018bwo we infer erg, which is over one order of magnitude less than that of AT~2021blu.
Once hydrogen has fully recombined, the luminosity abruptly declines, analogous to what is observed in Type IIP supernovae at the end of the plateau. Without radioactive material powering the light curve as happens in supernova explosions, we expect that the LRN bolometric light curve settles onto the nearly constant luminosity threshold of the resulting merger, although occasionally late-time humps can be observed, especially in the NIR domain, probably consequences of late-time interaction with confined circumstellar shells. This was observed in AT~2021blu, AT~2021biy, (Cai et al., 2022b, and Fig. 6), as well as earlier in AT~2017jfs (Pastorello et al., 2019b).
| LRN name | |||||
|---|---|---|---|---|---|
| ( erg s-1) | ( erg s-1) | (km s-1) | (K) | (au) | |
| AT 2021afy | |||||
| AT 2017jfs | |||||
| SNhunt248 | |||||
| AT 2020kog | |||||
| AT 2018hso | |||||
| NGC3437-2011OT1 | |||||
| AT 2014ej | |||||
| NGC4490-2011OT1 | |||||
| AT 1997bs | |||||
| AT 2021blu | |||||
| AT 2021biy | |||||
| AT 2020hat | |||||
| AT 2019zhd | |||||
| M31LRN2015 | |||||
| V838 Mon | |||||
| V1309 Sco |
The three objects discussed in this paper follow the general evolutionary framework of the best-studied events in the Milky Way and M 31. For this reason, we believe that most (or even all) of them are the outcome of merging events (but see Goranskij et al., 2020). But the heterogeneity observed in the light-curve shape, luminosity, and duration suggests a wide range of the physical parameters involved. In particular, the early-time sharp blue peak observed in AT~2021blu and its higher temperature at maximum brightness suggest a smaller photospheric radius than that of AT~2021afy. The interpretation of the observational properties of AT~2018bwo is more tricky, as the object was likely discovered a long time after maximum brightness. However, even if the object was older at discovery than assumed by Blagorodnova et al. (2021), the very low photosperic temperature implies an initially larger photospheric radius than that of AT~2021blu.
While other considerations indicate that the progenitors of AT~2021afy and AT~2021blu were both massive systems (see Sect. 6.3), the above estimates suggest very different configurations for the two LRNe. A very expanded primary star was likely the progenitor of AT~2021afy, while a proportionally smaller amount of material was launched by this event. In contrast, the AT~2021blu precursor was characterised by a very compact initial configuration and more-massive ejecta. The parameters of AT~2018bwo stay in the middle, although the progenitor system was likely less massive than the other two LRNe. The enormous difference between the inferred parameters for these three objects can be explained by a different fate of the system: while the large ejected mass of AT~2021blu can only result from the coalescence of massive stars, two different scenarios can be invoked to explain the low ejected mass of AT~2021afy: the massive primary merged with a very low-mass companion, or the system survived as a binary system. However, as remarked by Matsumoto & Metzger (2022), the ejected mass and the radius strongly depend on the adopted velocity, and the presence of an extra heating source (such as shock interaction with circumbinary material) may severely affect the above estimates.
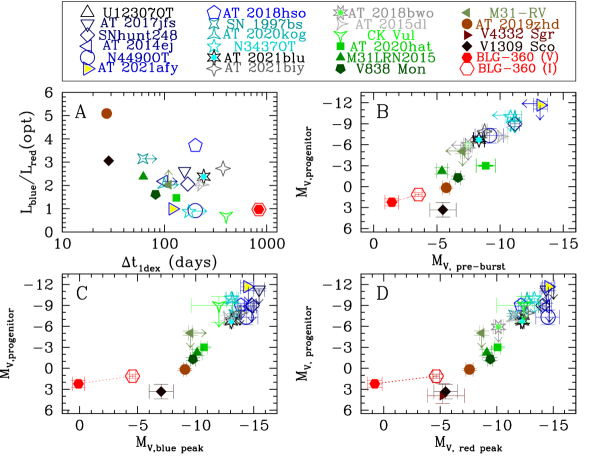
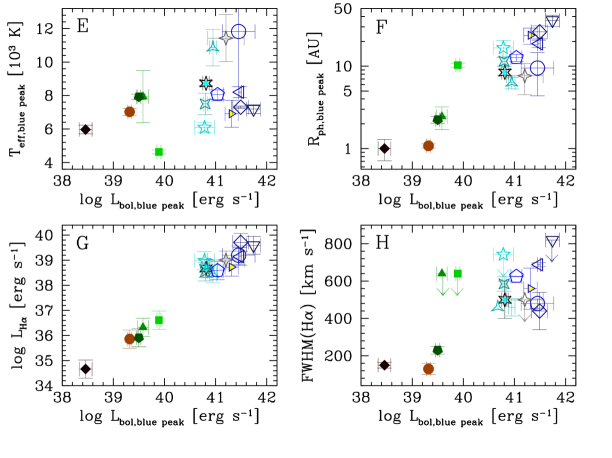
6.3 Correlations among physical parameters
With the inclusion of data presented in this paper (plus AT 2021biy, studied in detail by Cai et al., 2022b), we update with four new objects the diagrams showing possible correlations among the photometric parameters of LRNe presented by Pastorello et al. (2021b). The results are shown in Fig. 19 (top panels), while the parameters adopted for all objects are reported in Table 4. The new objects confirm the correlations between the absolute magnitude of the quiescent progenitor system with the absolute magnitude at the end of the slowly rising pre-outburst phase (panel B), the blue peak (panel C), and the broad red peak (or the plateau; panel D), with more-luminous LRN outbursts being produced by more-luminous (and, consequently, more-massive) stellar systems, as pointed out by Kochanek et al. (2017) and Blagorodnova et al. (2021).
To quantify the strength of the correlations, we carried out a Pearson test323232The parameters of OGLE-2002-BLG-360, a very peculiar object, were excluded in running the Pearson test., obtaining the following -values: , , and for panels B, C, and D (respectively). We also note a weak correlation (-value = 0.02) between the luminosity ratio of the two LRN maxima, and the time during which the luminosity stays between and (panel A). As noticed by Blagorodnova et al. (2021), dimmer objects seem to have a shorter duration, although OGLE-2002-BLG-360 (Tylenda et al., 2013) appears to be an outlier, as it does not follow the general observational LRN trends. However, this object was observed mostly in the Johnson-Cousins band, had a limited colour information, and showed a very peculiar, triple-peaked light curve which is challenging to interpret. We also remark that for CK~Vul, quite limited photometric information is available333333The object erupted in June 1670 and brightened again in April 1671. Only uncertain visual observations are documented from historical records, collected by Shara et al. (1985).; hence, the inferred quantities should be regarded as simply indicative.
We inspect other possible correlations of physical parameters computed at the time of the early blue peak (Fig. 19, bottom panels; the values for individual objects are reported in Table 5). In this analysis, we do not consider LRNe discovered after the early peak, such as AT 2018bwo and AT 2014ej, or whose photometric information is not accurate enough for a reliable estimate of and at that phase. In Fig. 19, we report the bolometric luminosity at the first peak (obtained through a blackbody fit to the SED) versus (panel E) and (panel F) computed at the same phase. Again, there is a general trend, with dimmer LRNe having lower temperatures and smaller radii at the photosphere. Following the same approach as above, we performed a Pearson test to verify the robustness of the correlations in panels E and F, and obtained -values of 0.02 and , respectively.
Finally, we inspect possible correlations of the bolometric luminosity at the blue peak with the H luminosity (H) (panel G) and the velocity of the expanding material (H)343434This value was computed for all objects through a Lorenzian fit to the line profile. (panel H) inferred from spectra obtained week after the first maximum. We made this choice because only a very limited number of LRN spectra are available at maximum brightness. Panel G shows a clear trend between and (H) (-value = ), with dimmer LRNe having fainter H luminosity. On the other hand, when the FWHM velocity is considered (panel H), the Pearson test does not reveal a significant correlation (-value = 0.48), although a correlation between peak luminosity and outflow velocity was predicted for LRNe by Pejcha et al. (2016b, see their Fig. 21).
The above correlations resemble those proposed by Blagorodnova et al. (2021) with slightly different parameters, but giving very similar outcomes: globally, the most-luminous LRNe are longer-duration events, often showing an early light-curve peak. Hence, they are expected to have initially a hotter, more expanded, and higher-velocity photosphere, producing more-luminous H spectral lines. Blagorodnova et al. (2021) suggested that the presence or the absence of an early blue peak in the light curve is due to different ionisation states of the gas shell where the photosphere is located. This shell would be initially fully ionised in ’hot’ events, and only marginally ionised in ’cold’ LRNe. Hot LRNe are usually high-luminosity events produced by more-massive progenitor systems. Blagorodnova et al. (2021) proposed that energetic outflows generated by such massive binaries can efficiently ionise the circumstellar shell generated during a previous mass-loss event. However, while the spectral appearance during the first photometric peak may support this explanation, it cannot be comfortably applied to all objects, including the faint-but-hot AT~2019zhd (Fig. 8, and Pastorello et al., 2021a).
While Sana et al (2012) predicted that mergers are a common endpoint of the evolution of massive stars in binary systems, precise rate estimates are still not available. We may expect that the LRN rates in different luminosity bins depend on the systemic mass. Using ZTF data, a volumetric rate of Mpc-1 yr-1 has been recently computed by Karambelkar et al. (2022) in the absolute magnitude range mag, hence considering intrinsically luminous events only. This is consistent with the larger volumetric rate of Mpc-1 yr-1 estimated in the local Universe by Howitt et al. (2020, including intrinsically faint LRNe), with 1–2 events per decade being expected in the Galaxy. This estimate is consistent with the discovery of a handful of LRNe in the Galaxy over the past 30 yr. The rates of LRNe are broadly dominated by the dimmest events, as discussed by Kochanek et al. (2014), implying that mergers of low-mass binaries are more common by 2–3 orders of magnitude than those of massive binaries. We also note that a number of low-mass Galactic contact binaries have been proposed to be in the pathway to become mergers (see, e.g. Wadhwa et al., 2020).
7 Conclusions
We presented photometric and spectroscopic datasets for three new objects (AT~2018bwo, AT~2021afy, and AT~2021blu) that belong to the high-luminosity population of LRNe. All of them are most likely the outcome of merging events involving massive stars. However, they exhibit different properties, with AT~2021blu being initially hotter and having a smaller photospheric radius than AT~2021afy (and probably also AT~2018bwo, despite its epoch of outburst onset being poorly constrained). In addition, the duration of the AT~2021blu outburst is twice as long as that of the other two objects, suggesting a larger outflowing mass.
Comparisons among observed parameters suggest that the three objects discussed here belong to the bright LRN population, with AT~2021afy being one of the most luminous events discovered to date. Making use of the correlation between the absolute magnitude of the outburst and the progenitor’s mass presented by Cai et al. (2022b), we estimate that the progenitor of AT~2021afy has a mass likely exceeding 40 M⊙ (although with a very large uncertainty). The binary progenitor system of AT~2021blu is characterised by a primary star of 13–18 M⊙, slightly more massive than that of AT~2018bwo (11–16 M⊙) reported by Blagorodnova et al. (2021).
Our study supports previous evidence (e.g. Pastorello et al., 2019a) that LRNe span a very wide range of physical properties, and that most observational parameters are somewhat correlated. In particular, the peak luminosity of LRN light curves appears to be correlated with the outburst duration, the H luminosity, the photospheric radius, the effective temperature, and (most importantly) the luminosity and mass of the progenitor stellar systems, as advocated by Kochanek et al. (2017) and Blagorodnova et al. (2021).
To increase our ability to characterise LRN variety, we need to expand the sample of events with excellent spectral and photometric coverage, and with available information regarding the quiescent progenitors. This will enable us to fine-tune the above correlations, making them a valuable tool for estimating the parameters of LRNe when only incomplete datasets are available, as well as for inferring the luminosity and mass of LRN binary progenitors without the need for a direct detection of the progenitor flux from archival pre-outburst images obtained with high-spatial-resolution facilities.
Acknowledgements.
We thank Jorge Anais Vilchez, Abdo Campillay, Nahir Muñoz-Elgueta, Natalie Ulloa, and Jaime Vargas-González for performing the observations on the Swope Telescope at Las Campanas Observatory, Chile; Takashi Nagao for his help with the NOT observations; and WeiKang Zheng for his help with Keck observations. We also thank Jun Mo for his help with the TNT data reduction. We acknowledge the support of the staffs of the various observatories where data were obtained.MF is supported by a Royal Society – Science Foundation Ireland University Research Fellowship. AR acknowledges support from ANID BECAS/DOCTORADO NACIONAL 21202412. GP and AR acknowledge support from the Chilean Ministry of Economy, Development, and Tourism’s Millennium Science Initiative through grant IC12009, awarded to the Millennium Institute of Astrophysics. EC, NER, and LT acknowledge support from MIUR, PRIN 2017 (grant 20179ZF5KS) “The new frontier of the Multi-Messenger Astrophysics: follow-up of electromagnetic transient counterparts of gravitational wave sources.” NER also acknowledges partial support from the Spanish MICINN grant PID2019-108709GB-I00 and FEDER funds, and from the program Unidad de Excelencia María de Maeztu CEX2020-001058-M. TMR acknowledges the financial support of the Jenny and Antti Wihuri and the Vilho, Yrjö and Kalle Väisälä Foundations. Research by SV is supported by NSF grants AST-1813176 and AST-2008108. Time-domain research by the University of Arizona team and DJS is supported by NSF grants AST-1821987, 1813466, 1908972, 2108032, and by the Heising-Simons Foundation under grant #2020-1864. KAB acknowledges support from the DIRAC Institute in the Department of Astronomy at the University of Washington. The DIRAC Institute is supported through generous gifts from the Charles and Lisa Simonyi Fund for Arts and Sciences, and the Washington Research Foundation. The LCO team is supported by NSF grants AST-1911225 and AST-1911151. JB is supported by NSF grants AST-1911151 and AST-1911225, as well as by National Aeronautics and Space Administration (NASA) grant 80NSSC19kf1639. YZC is funded by China Postdoctoral Science Foundation (grant 2021M691821). RD acknowledges funds by ANID grant FONDECYT Postdoctorado No. 3220449. LG acknowledges financial support from the Spanish Ministerio de Ciencia e Innovación (MCIN), the Agencia Estatal de Investigación (AEI) 10.13039/501100011033, and the European Social Fund (ESF) “Investing in your future” under the 2019 Ramón y Cajal program RYC2019-027683-I and the PID2020-115253GA-I00 HOSTFLOWS project, from Centro Superior de Investigaciones Científicas (CSIC) under the PIE project 20215AT016, and the program Unidad de Excelencia María de Maeztu CEX2020-001058-M. RK acknowledges support from the Academy of Finland (340613). KM acknowledges BRICS grant DST/IMRCD/BRICS/Pilotcall/ProFCheap/2017(G) for this work. AMG acknowledges financial support from the 2014–2020 ERDF Operational Programme and by the Department of Economy, Knowledge, Business and University of the Regional Government of Andalusia through the FEDER-UCA18-107404 grant. MDS is supported by grants from the VILLUM FONDEN (grant 28021) and the Independent Research Fund Denmark (IRFD; 8021-00170B). AVF’s group at UC Berkeley has received support from the Miller Institute for Basic Research in Science (where AVF was a Miller Senior Fellow), the Christopher R. Redlich Fund, and numerous individual donors. LW is sponsored (in part) by the Chinese Academy of Sciences (CAS), through a grant to the CAS South America Center for Astronomy (CASSACA) in Santiago, Chile. This work was supported in part by NASA Keck PI Data Award 2021A-N147 (PI: Jha), administered by the NASA Exoplanet Science Institute. This work is supported by National Natural Science Foundation of China (NSFC grants 12033003, 11633002), the Scholar Program of Beijing Academy of Science and Technology (DZ:BS202002), and the Tencent Xplorer Prize. This work is partially supported by China Manned Space Project (CMS-CSST-2021-A12).
This work is based on observations made with the Nordic Optical Telescope (NOT), owned in collaboration by the University of Turku and Aarhus University, and operated jointly by Aarhus University, the University of Turku and the University of Oslo, representing Denmark, Finland and Norway, the University of Iceland and Stockholm University at the Observatorio del Roque de los Muchachos, La Palma, Spain, of the Instituto de Astrofisica de Canarias; the 10.4 m Gran Telescopio Canarias (GTC), installed in the Spanish Observatorio del Roque de los Muchachos of the Instituto de Astrofísica de Canarias, in the Island of La Palma; the 2.0 m Liverpool Telescope operated on the island of La Palma by Liverpool John Moores University at the Spanish Observatorio del Roque de los Muchachos of the Instituto de Astrofísica de Canarias with financial support from the UK Science and Technology Facilities Council; the 3.58 m Italian Telescopio Nazionale Galileo (TNG) operated the island of La Palma by the Fundación Galileo Galilei of the Istituto Nazionale di Astrofisica (INAF) at the Spanish Observatorio del Roque de los Muchachos of the Instituto de Astrofísica de Canarias; the 4.1 m Southern African Large Telescope (SALT) of the South African Astronomical Observatory, Southerland, South Africa; the 6.5 m Magellan-Baade Telescope located at the Las Campanas Observatoy, Chile; the Southern Astrophysical Research Telescope and the Panchromatic Robotic Optical Monitoring and Polarimetry Telescopes (PROMPT) of the Cerro Tololo Inter-American Observatory (CTIO), on Cerro Pachón, Chile; the 3.05 m Shane telescope of the Lick Observatory, University of California Observatories, USA; the 1.82 m Copernico and the 67/92 cm Schmidt telescopes of INAF — Osservatorio Astronomico di Padova, Asiago, Italy; the 3.6 m Devasthal Optical Telescope, the 1.3 m Devasthal Fast Optical Telescope (DFOT), and the 1.04 m Sampurnanand Telescope (ST) of the Aryabatta Research Institute of Observational Sciences (ARIES), Manora Peak, Naintal, Uttarakhand, India; the 0.8 m Tsinghua-NAOC Telescope at Xinglong Observatory (China); the 0.6 m Rapid Eye Mount (REM) INAF telescope, hosted at ESO La Silla Observatory, Chile, under program ID 43308; and the 2.3 m Bok Telescope, operated by Stewart Observatory, Kitt Peak National Observatory, Arizona, USA. This work makes also use of observations from the Las Cumbres Observatory global telescope network (including the Faulkes North Telescope, and the 2.54 m Isaac Newton telescope operated by the Isaac Newton Group of Telescopes (ING), Roque de los Muchachos, La Palma, Spain. The NIRES data presented herein were obtained at the W. M. Keck Observatory from telescope time allocated to NASA through the agency’s scientific partnership with the California Institute of Technology and the University of California. The Observatory was made possible by the generous financial support of the W. M. Keck Foundation. A major upgrade of the Kast spectrograph on the Shane 3 m telescope at Lick Observatory was made possible through generous gifts from William and Marina Kast as well as the Heising-Simons Foundation. Research at Lick Observatory is partially supported by a generous gift from Google. The paper is also based on observations obtained at the international Gemini Observatory, a program of NSF’s NOIRLab, which is managed by AURA, Inc., under a cooperative agreement with the NSF on behalf of the Gemini Observatory partnership: the National Science Foundation (United States), National Research Council (Canada), Agencia Nacional de Investigación y Desarrollo (Chile), Ministerio de Ciencia, Tecnología e Innovación (Argentina), Ministério da Ciência, Tecnologia, Inovações e Comunicações (Brazil), and Korea Astronomy and Space Science Institute (Republic of Korea). The data presented herein were obtained in part with ALFOSC, which is provided by the Instituto de Astrofisica de Andalucia (IAA) under a joint agreement with the University of Copenhagen and NOT.
This study is also based on observations made with the NASA/ESA Hubble Space Telescope, obtained from the Data Archive at the Space Telescope Science Institute (STScI), which is operated by AURA, Inc., under NASA contract NAS 5-26555. This work made use of data from the All-Sky Automated Survey for Supernovae (ASAS-SN), obtained through the Sky Patrol interface (https://asas-sn.osu.edu/). This research is based on observations made with the mission, obtained from the MAST data archive at STScI, which is operated by AURA, Inc., under NASA contract NAS 5–26555. These observations are associated with programs with IDs 8645, 15922, and 16691. This work has made use of data from the Asteroid Terrestrial-impact Last Alert System (ATLAS) project. ATLAS is primarily funded to search for near-Earth objects through NASA grants NN12AR55G, 80NSSC18K0284, and 80NSSC18K1575; byproducts of the NEO search include images and catalogs from the survey area. The ATLAS science products have been made possible through the contributions of the University of Hawaii Institute for Astronomy, the Queen’s University Belfast, STScI, and the South African Astronomical Observatory, and The Millennium Institute of Astrophysics (MAS), Chile.
The Pan-STARRS1 Surveys (PS1) and the PS1 public science archive have been made possible through contributions by the Institute for Astronomy, the University of Hawaii, the Pan-STARRS Project Office, the Max-Planck Society and its participating institutes, the Max Planck Institute for Astronomy, Heidelberg and the Max Planck Institute for Extraterrestrial Physics, Garching, The Johns Hopkins University, Durham University, the University of Edinburgh, the Queen’s University Belfast, the Harvard-Smithsonian Center for Astrophysics, the Las Cumbres Observatory Global Telescope Network Incorporated, the National Central University of Taiwan, STScI, NASA under grant NNX08AR22G issued through the Planetary Science Division of the NASA Science Mission Directorate, NSF grant AST-1238877, the University of Maryland, Eotvos Lorand University (ELTE), the Los Alamos National Laboratory, and the Gordon and Betty Moore Foundation.
This publication is partially based on observations obtained with the Samuel Oschin 48-inch Telescope at the Palomar Observatory as part of the Zwicky Transient Facility (ZTF) project. ZTF is supported by the NSF under grant AST-1440341 and a collaboration including Caltech, IPAC, the Weizmann Institute for Science, the Oskar Klein Center at Stockholm University, the University of Maryland, the University of Washington, Deutsches Elektronen-Synchrotron and Humboldt University, Los Alamos National Laboratories, the TANGO Consortium of Taiwan, the University of Wisconsin at Milwaukee, and Lawrence Berkeley National Laboratories. Operations are conducted by COO, IPAC, and UW.
We acknowledge ESA Gaia, DPAC, and the Photometric Science Alerts Team (http://gsaweb.ast.cam.ac.uk/alerts). We acknowledge the use of public data from the Swift data archive. This research made use of the WISeREP database (https://wiserep.weizmann.ac.il). This research has made use of the NASA/IPAC Extragalactic Database (NED) which is operated by the Jet Propulsion Laboratory, California Institute of Technology, under contract with NASA. This publication used data products from the Two Micron All-Sky Survey, which is a joint project of the University of Massachusetts and the Infrared Processing and Analysis Center/California Institute of Technology, funded by NASA and the NSF.
This work used the Binary Population and Spectral Synthesis (BPASS) models as last described by Eldridge, Stanway, et al. (2017) and by Stanway, Eldridge, et al. (2018).
The authors wish to recognise and acknowledge the very significant cultural role and reverence that the summit of Maunakea has always had within the indigenous Hawaiian community. We are most fortunate to have the opportunity to conduct observations from this mountain.
References
- Banerjee et al. (2020) Banerjee, D. P. K., Geballe, T. R., Evans, A., et al. 2020, ApJ, 904, L23
- Barsukova et al. (2007) Barsukova, E. A., Goranskij, V. P., Abolmasov, P. K., & Fabrika, S. N. 2007, ASPC, 363, 206
- Barsukova et al. (2014) Barsukova, E. A., Goranskij, V. P., Valeev, A. F., & Zharova, A. V. 2014, Astroph. Bul., 510, 401
- Barsukova et al. (2017) Barsukova, E. A., Goranskij, V. P., & Valeev, A. F. 2017, ASPC, 510, 401
- Bellm et al. (2019) Bellm, E. C., Kulkarni, S. R., Graham, M. J., et al. 2019, PASP, 121, 018002
- Blagorodnova et al. (2017) Blagorodnova, N., Kotak, R., Polshaw, J., et al. 2017, ApJ, 834, 107
- Blagorodnova et al. (2020) Blagorodnova, N., Karambelkar, V., Adams, S. M., et al. 2020, MNRAS, 496, 5503
- Blagorodnova et al. (2021) Blagorodnova, N., Klencki, J., Pejcha, O., et al. 2021, A&A, 653, A134
- Bohlin (2014) Bohlin,
- Bottinelli et al. (1985) Bottinelli, L., Gouguenheim, L., Paturel, G., & de Vaucouleurs, G. 1985, ApJS, 59, 293
- Busso et al. (2018) Busso, G., Cacciari, C., Carrasco, J. M., et al. 2018, Gaia DR2 documentation, European Space Agency; Gaia Data Processing and Analysis Consortium. Online at https://gea.esac.esa.int/archive/documentation/GDR2/, ID 5
- Cai et al. (2019) Cai, Y.-Z., Pastorello, A., Fraser, M., et al. 2019, A&A, 632, L6
- Cai et al. (2022a) Cai, Y.-Z., Reguitti, A., Valerin, G., Wang, X.-F. 2022a, Universe, 8, 493
- Cai et al. (2022b) Cai, Y.-Z., Pastorello, A., Fraser, M., et al. 2022b, A&A, 667, A4
- Carrasco-Davis et al. (2020) Carrarco-Davis, R., Reyes, E., Valenzuela, C., et al. 2021, AJ, 162, 231
- Chambers et al. (2019) Chambers, K. C., et al. 2019, preprint arXiv:1612.05560 (version 4)
- Chronis & Gaskell (2008) Chronis, T. S., & Gaskell, C. M. 2008, AJ, 135, 264
- Clark et al. (2018) Clark, P., McBrien, O., Kankare, E., et al. 2018, Astron. Tel., 11669, 1
- Dolphin (2000) Dolphin, A. E. 2000, PASP, 112, 1383
- Eldridge et al. (2017) Eldridge, J. J., Stanway, E. R., Xiao, L., et al. 2017, PASA, 34, e058
- Filippenko (1982) Filippenko, A. V. 1982, PASP, 94, 715
- Finlator et al. (2007) Finlator, K., Ivezic, Z., Fan, X., et al. 2007, AJ, 120, 2615
- Flewelling et al. (2020) Flewelling, H. A., et al. 2020, ApJS, 251, 7
- Fukugita et al. (2011) Fukugita, M., Yasuda, N., Doi, M., Gunn, J. E., & York, D. G. 2011, AJ, 141, 47
- Gehrels et al. (2004) Gehrels, N., Chincarini, G., Giommi, P., et al. 2004, ApJ, 889, 1005
- Graham et al. (2019) Graham, M. J., Kulkarni, S. R., Bellm, E. C., et al. 2019, PASP, 131g8001G
- Goranskij et al. (2020) Goranskij, V. P., Barsukova, E. A., Burenkov, A. N., et al. 2020, Astroph. Bul., 75, 325
- Goranskij et al. (2016) Goranskij, V. P., Barsukova, E. A., Spiridonova, O. I., et al. 2016, Astroph. Bul., 71, 82
- Harris (2018) Harris, W. E. 2018, AJ, 156, 296
- Howitt et al. (2020) Howitt, G., Stevenson. S., & Vigna-Gómez, A. 2020, MNRAS, 492, 3229
- Hsiao et al. (2019) Hsiao, E. Y., Phillips, M. M., Marion, G. H. et al. 2019, PASP, 131:014002
- Huang et al. (2012) Huang, F., Li, J.-Z., Wang, X.-F. et al. 2012, Res. Astron., 12, 1585
- Ivanova (2017) Ivanova, N. 2017, in The Lives and Death-Throes of Massive Stars, Proceedings of the International Astronomical Union, IAU Symposium, Volume 329, pp. 199–206
- Ivanova et al. (2013b) Ivanova, N., Justham, S., Avendano Nandez, J. L., & Lombardi Jr, J. C. 2013, Science, 339, 433
- Ivanova et al. (2013a) Ivanova, N., Justham, S., Chen, X., et al. 2013, AA Rev., 21, 59
- Jester et al. (2005) Jester, S., Schneider, D. P., Richards, G. T., et al. 2005, ApJ, 130, 873
- Jones (2020) Jones, D. 2020, Reviews in Frontiers of Modern Astrophysics; From Space Debris to Cosmology, ISBN: 978-3-030-38509-5. Cham: Springer International Publishing, 2020, pp. 123-153
- Lipunov et al. (2017) Lipunov, V. M., Blinnikov, S., Gorbovskoy, E., et al. 2017, MNRAS, 470, L2339
- Kamiński et al. (2021) Kamiński, T., Tylenda, R., Kiljan, A., et al. 2021, A&A, 665, A32
- Kankare et al. (2015) Kankare, E., Kotak, R., Pastorello, A., et al. 2015, A&A, 581, L4
- Karambelkar et al. (2022) Karambelkar, V. R., Kasliwal, M. M., Blagorodnova, N., et al. 2022, ApJ, submitted (pre-print:arXiv:2211.05141)
- Kashi & Soker (2016) Kashi, A., & Soker, N. 2016, Res. Astron. Astrophys., 16, 99
- Kasliwal (2012) Kasliwal, M. M. 2012, PASA, 29, 482
- Kimeswenger (2006) Kimeswenger, S. 2006, Astron. Nachr., 327, 44
- Kochanek et al. (2014) Kochanek, C. S., Adams, S. M., & Belczynski, K. 2014, MNRAS, 443, 1319
- Kochanek et al. (2017) Kochanek, C. S., et al. 2017, PASP, 129, 104502
- Kurtenkov et al. (2015) Kurtenkov, A. A., Pessev, P., Tomov, T., et al. 2015, A&A, 578, L10
- Magnier et al. (2020) Magnier, E. A., Schlafly, E. F., Finkbeiner, D. P., et al. 2020, ApJS, 251, 6
- Martini et al. (1999) Martini, P., Wagner, R. M., Tomaney, A., et al. 1999, AJ, 118, 1034
- Masci et al. (2019) Masci, F. J., Laher, R. R., Rusholme, B., et al. 2019, PASP, 131, 018003
- Mason et al. (2010) Mason, E., Diaz, M., Williams, R. E., Preston, G., & Bensby, T. 2010, A&A, 516, A108
- Mason & Shore (2022) Mason, E., & Shore, S. N. 2022, A&A, 664, A12
- Mauerhan et al (2015) Mauerhan, J. C., Van Dyk, S. D., Graham, M. L,, et al. 2015, MNRAS, 447, 1922
- Mauerhan et al (2018) Mauerhan, J. C., Van Dyk, S. D., Johansson, J., et al. 2018, MNRAS, 473, 3765
- MacLeod & Loeb (2020) MacLeod, M., & Loeb, A. 2020, ApJ, 895, 29
- MacLeod et al. (2017) MacLeod, M., Macias, P., Ramirez-Ruiz, E., et al. 2017, ApJ, 835, 282
- MacLeod et al. (2018) MacLeod, M., Ostriker, E. C., & Stone, J. M. 2018, ApJ, 863, 5
- Matsumoto & Metzger (2022) Matsumoto, T., & Metzger, B. D. 2022, ApJ, 938, 5
- Metzger & Pejcha (2017) Metzger, B. D., & Pejcha, O. 2017, MNRAS, 471, 3200
- Moore (1945) Moore, C. E. 1945, Contrib. Princeton Univ. Obs., 20, 1
- Mora et al. (2007) Mora, M. D., Larsen, S. S., & Kissler-Patig, M. 2007, A&A, 464, 495
- Mould et al. (2000) Mould, J. H., Huchra, J. P., Freedman, W. L. et al. 2000, ApJ, 529, 786
- Munoz-Arencibia et al. (2021) Munoz-Arancibia, Forster, F., Bauer, F. E., et al. 2021, TNSTR, 137, 1
- Nandez et al. (2014) Nandez, J. L. A., Ivanova, N., & Lombardi, J. C., Jr. 2014, ApJ, 786, 39
- NASA High Energy Astrophysics Science Archive Research Center – Heasarc (2014) NASA High Energy Astrophysics Science Archive Research Center (Heasarc) 2014, Astrophysics Source Code Library, ascl:1408.0042014, Astrophysics Source Code Library, ascl:1408.004
- Nataf et al. (2013) Nataf, D. M., Gould, A., Fouqué, P., et al. 2013, ApJ, 769, 88
- Oke et al. (1995) Oke, J. B., Cohen, J. G., Carr, M., et al. 1995, PASP, 107, 375
- Pastorello & Fraser (2019) Pastorello, A., & Fraser, M. 2019, Nat. Astron., 3, 636
- Pastorello et al. (2019a) Pastorello, A., Mason, E., Taubenberger, S., et al. 2019a, A&A, 630, A75
- Pastorello et al. (2019b) Pastorello, A., Chen, T.-W., Cai, Y.-Z., et al. 2019b, A&A, 625, L8
- Pastorello et al. (2021a) Pastorello, A., Valerin, G., Fraser, M., et al. 2021a, A&A, 647, A93
- Pastorello et al. (2021b) Pastorello, A., Fraser., M., Valerin, G., et al. 2021b, A&A, 646, A119
- Pejcha (2014) Pejcha, O. 2014, ApJ, 788, 22
- Pejcha et al. (2016a) Pejcha, O., Metzger, B. D., & Tomida, K. 2016a, MNRAS, 461, 2527
- Pejcha et al. (2016b) Pejcha, O., Metzger, B. D., & Tomida, K. 2016b, MNRAS, 455, 4351
- Pejcha et al. (2017) Pejcha, O., Metzger, B. D., Tyles, J. G., & Tomida, K. 2017, ApJ, 850, 59
- Popov (1993) Popov, D. V. 1993, ApJ, 414, 712
- Roming et al. (2005) Roming, P. W. A., Kennedy, T. E., Mason, K. O., et al. 2005, SSRv, 120, 95
- Sabbi et al. (2018) Sabbi, E., Calzetti, D., Ubeda, L., et al. 2018, ApJS, 235, 23
- Sana et al (2012) Sana, H., de Mink, S. E., de Koter, A., et al. 2012, Science, 337, 444
- Schlafly & Finkbeiner (2011) Schlafly, E. F., & Finkbeiner, D. P. 2011, ApJ, 737, 103
- Shara et al. (1985) Shara, M. M., Moffat, A. F. J., & Webbink, R. F. 1985, ApJ, 294, 271
- Shara et al. (2010) Shara, M. M., Yaron, O., Prialnik, D., Kovetz, A., & Zurek, D. 2010, ApJ, 725, 831
- Shappee et al. (2014) Shappee, B. J., Prieto, J. L., Grupe, D., et al. 2014, ApJ, 788, 48
- Skrutskie et al. (2006) Skrutskie, M. F., Cutri, R. M, Stiening, R., et al. 2006, AJ, 131, 1163
- Smith et al. (2016) Smith, N., Andrews, J. E., Van Dyk, S. D., et al. 2016, MNRAS, 458, 950
- Smith et al. (2020) Smith, K. W., Smartt, S. J., Young, D. R., et al. 2020, PASP, 132, 085002
- Soker (2016) Soker, N. 2016, New A, 47, 16
- Soker (2020) Soker, N. 2020, ApJ, 893, 20
- Soker & Kaplan (2021) Soker, N., & Kaplan, N. 2021, Res. Astron. Astrophys., 21, 90
- Soker & Kashi (2016) Soker, N., & Kashi, A. 2016, MNRAS, 426, 217
- Soraisam et al. (2022) Soraisam, M., Matheson, T., Lee, C.-H., et al. 2022, ApJ, 926, L11
- Stanway & Eldridge (2018) Stanway, E. R., & Eldridge, J. J. 2018, MNRAS, 479, 75
- Stritzinger et al. (2020) Stritzinger, M. D., Taddia, F., Fraser, M. et al. 2020, A&A, 639, A104
- Sukhbold et al. (2016) Sukhbold, T., Ertl, T., Woosley, S. E., Brown, J. M., & Janka, H. T. 2016, ApJ, 821, 38
- Tartaglia et al. (2018) Tartaglia, L., Sand, D., Valenti, S., et al. 2018, ApJ, 853, 62
- Tonry et al. (2012) Tonry, J. L., Stubbs, C. W., Lykke, K. R., et al. 2012, ApJ, 750, 99
- Tonry et al. (2018) Tonry, J. L., Denneau, L., Heinze, A. N., et al. 2018, PASP, 130, 064505
- Tonry et al. (2021) Tonry, J, Denneau, L., Heinze, A., et al. 2021, TNSTR, 312, 1
- Tylenda et al. (2015) Tylenda, R., Górny, S. K., Kamiński, T., & Schmidt, M. 2015, A&A, 578, A75
- Tylenda et al. (2011) Tylenda, R., Hajduk, M., Kamiński, T., et al. 2011, A&A, 528, A114
- Tylenda et al. (2013) Tylenda, R., Kamiński, T., Udalski, A., et al. 2013, A&A, 555, A16
- Tylenda & Soker (2006) Tylenda, R., & Soker, N. 2006, A&A, 451, 223
- Tully et al. (2016) Tully, R. B., Courtois, H. M., & Sorce, J. C. 2016, AJ, 152, 50
- Tully & Fisher (1988) Tully, R. B., & Fisher, J. R. 1988, Catalog of Nearby Galaxies (Cambridge: Cambridge University Press)
- Turatto et al. (2003) Turatto, M., Benetti, S., & Cappellaro, E. 2003, in From Twilight to Highlight: The Physics of Supernovae, eds. W. Hillebrandt, & B. Leibundgut (Berlin: Springer-Verlag), 200
- Uno et al. (2021) Uno, K., Kawabata, M., & Taguchi, K. 2021, TNSCR, 393, 1
- Valenti et al. (1998) Valenti, J. A., Piskunov, N., & Johns-Krull, C. M. 1998, ApJ, 498, 851
- Valenti et al. (2018) Valenti, S., Sand, D., & Wyatt, S. 2018, TNSTR, 687, 1
- Valerin et al. (2022) Valerin et al. 2022, MNRAS, 513, 4983
- Wadhwa et al. (2020) Wadhwa, S. S., De Horta, A., Filipović, M. D., Tothill, N. F. H., Arbutina, B., Petrović, J., & Djuras̆ević, G. 2020, MNRAS, 501, 229
- Wang et al. (2008) Wang, X.-F., Li, W., Filippenko, A. V. et al. 2008, ApJ, 675, 626
- Williams et al. (2015) Williams, S. C., Darnley, M. L., Bode, M. F., & Steele, I. A. 2015, ApJ, 805, L18
- Yaron & Gal-Yam (2012) Yaron, O., & Gal-Yam, A. 2012, PASP, 124, 668
Appendix A Instruments used in the photometric campaigns
AT~2018bwo was monitored in the optical bands using the 0.41 m Prompt 3 (with Sloan and filters) and the 0.41 m Prompt 6 (with Johnson and filters), both hosted by the Cerro Tololo Inter-American Observatory (CTIO, Chile). Additional unfiltered photometry was obtained with the 0.41 m Prompt 5 (CTIO) telescope and the 0.41 m Prompt-MO-1 telescope (Meckering Observatory, south-western Australia), both operating in the framework of the DLT40 survey. Other data were obtained with the 1 m Swope Telescope of the Las Campanas Observatory, and several 1 m telescopes equipped with Sinistro cameras and filters, operating within the Las Cumbres Observatory global telescope network, in the framework of the Global Supernova Project. In particular, the telescopes used for the AT~2018bwo campaign are hosted at the Siding Spring Observatory (SSO; Australia), the South African Astronomical Observatory (SAAO, South Africa), and CTIO. Single-epoch observations were also obtained with the 3.56 m New Technology Telescope (NTT) equipped with EFOSC2, hosted at ESO-La Silla Observatory (Chile), and the 10.4 m GTC with OSIRIS, hosted at La Palma (Canary Islands, Spain). A small number of photometric data were provided by the Gaia survey in the Gaia band, and by ZTF. Four epochs taken by ZTF with the Sloan and filters353535The images were retrieved from https://www.ztf.caltech.edu/; Masci et al. (2019). during the late-time light-curve decline were measured by us using the template-subtraction technique. Finally, photometry in the orange () and cyan () bands are provided by the two 0.5 m ATLAS telescopes (ATLAS 1 is on Haleakalä and ATLAS 2 on Maunaloa, Hawaii, USA).
AT~2021afy was followed in and by ZTF. Although ZTF publicly provides forced photometry, we re-analysed the ZTF images obtained through the Public Data Release 3 without applying a template subtraction. We made this choice because the object was located in a remote position of the host-galaxy centre, and the ZTF templates were not optimal (in particular, in the band). We complemented the ZTF data with multi-band observations obtained with the following instruments: the 2 m Liverpool Telescope (LT) equipped with IO:O; the 2.56 m Nordic Optical Telescope (NOT) equipped with the Alhambra Faint Object Spectrograph and Camera (ALFOSC) and the NOT near-infrared Camera and spectrograph (NOTCam); the 10.4 m GTC with OSIRIS; the 1.82 m Copernico Telescope with the Asiago Faint Object Spectrograph and Camera (AFOSC) and the 0.67/0.92 m Schmidt Telescope with a Moravian camera of the Padova Observatory (Istituto Nazionale di Astrofisica, INAF, hosted at Mt. Ekar, near Asiago, Italy); and the 0.6 m Rapid Eye Mount (REM) telescope with the ROSS2 and REMIR cameras, hosted by the European Southern Observatory (ESO) in La Silla (Chile).
AT~2021blu was extensively observed by the following public surveys: the All-Sky Automated Survey for Supernovae (ASAS-SN; Shappee et al., 2014; Kochanek et al., 2017, in the band)363636ASAS-SN photometry is publicly released through the Sky Patrol ASAS-SN interface (https://asas-sn.osu.edu). which works through a network of small (0.14 m) telescopes in different world-wide sites; the 1.22 m Samuel Oschin Telescope at the Palomar Observatory (California, USA) serving the ZTF survey373737In this case, we used public ZTF forced photometry, which is released through the Lasair (https://lasair.roe.ac.uk/) and ALeRCE (https://alerce.online/) brokers, and already shown by Soraisam et al. (2022).; the two 0.5 m ATLAS telescopes, and the two 1.8 m Pan-STARRS383838The acronym stands for Panoramic Survey Telescope Rapid Response System. (PS1 and PS2; Chambers et al., 2019; Flewelling et al., 2020; Magnier et al., 2020) telescopes at Haleakalä (Hawaii, USA). Multi-Band data were also obtained with the same facilities used for the AT~2021afy campaign (except REM, owing to the northern declination of AT~2021blu), plus 0.4 m to 1 m telescopes of the Las Cumbres Observatory global telescope network equipped with SBIG STL6303 and Sinistro cameras, respectively, and hosted at the McDonald Observatory (Texas, USA) and the Teide Observatory (Tenerife, Canary Islands, Spain). Other telescopes used in the monitoring campaign of AT~2021blu are the 0.8 m Tsinghua-NAOC Telescope (TNT; Wang et al., 2008; Huang et al., 2012) with a PIXIS back-illuminated 1300B CCD camera at Xinglong Observatory (China); the 3.6 m Devasthal Optical Telescope (DOT) equipped with ADFOSC, the 1.3 m Devasthal Fast Optical Telescope (DFOT) and the 1.04 m Sampurnanand Telescope (ST) operated by Aryabhatta Research Institute of Observational Sciences (ARIES; India) with optical imagers. Data in the optical (with , , and filters) and UV (in the , , and bands) domains were obtained by the Neil Gehrels Swift Observatory spacecraft (Gehrels et al., 2004) equipped with UVOT (Roming et al., 2005).
A.1 Photometry tables
Tables A1, A2, and A3 are available in electronic form at the CDS, and contain the following information: the epoch and the MJD of the observation (Columns 1 and 2, respectively); the filter (Column 3); the magnitude and the error (Columns 4 and 5, respectively); the instrumental configuration (Column 6); additional notes (Column 7).
| Initial date | Initial MJD | Final date | Final MJD | Average MJD | Filter | magnitude | CCD code |
|---|---|---|---|---|---|---|---|
| 2011-05-31 | 55712.31 | 2012-05-16 | 56063.55 | 55888.13 | 23.05 | PS1 | |
| 2010-07-01 | 55378.42 | 2013-07-03 | 56476.40 | 56069.75 | 23.20 | PS1 | |
| 2011-05-19 | 55700.48 | 2014-07-11 | 56849.38 | 56396.19 | 23.40 | PS1 | |
| 2010-03-01 | 55256.57 | 2014-09-17 | 56917.23 | 55928.69 | 22.81 | PS1 | |
| 2018-03-26 | 58203.42 | 2018-09-08 | 58369.23 | 59286.82 | 20.95 | ZTF-c15 | |
| 2018-03-09 | 58186.48 | 2018-05-20 | 58258.25 | 59222.37 | 22.05 | ZTF-c15 | |
| 2018-04-20 | 58228.51 | 2018-09-06 | 58367.14 | 59297.82 | 21.33 | ZTF-c15 | |
| 2020-12-11 | 59194.55 | 2020-12-13 | 59196.57 | 59195.64 | 21.11 | ZTF-c15 | |
| 2020-12-15 | 59198.56 | 2020-12-18 | 59201.57 | 59199.56 | 21.11 | ZTF-c15 |
| Initial date | Initial MJD | Final date | Final MJD | Average MJD | Filter | magnitude | CCD code |
|---|---|---|---|---|---|---|---|
| 2018-04-25 | 58233.22 | 2018-06-23 | 58292.20 | 58260.72 | 21.98 | ZTF-c12 | |
| 2018-03-25 | 58202.26 | 2018-06-24 | 58293.18 | 58248.47 | 21.85 | ZTF-c09 | |
| 2018-10-31 | 58422.50 | 2019-06-28 | 58662.21 | 58520.01 | 22.20 (0.54) | ZTF-c09 | |
| 2019-10-09 | 58765.51 | 2019-12-29 | 58846.52 | 58802.75 | 22.17 | ZTF-c12 | |
| 2019-10-02 | 58758.51 | 2019-12-29 | 58846.51 | 58790.41 | 21.74 | ZTF-c09 | |
| 2020-01-04 | 58852.52 | 2020-01-29 | 58877.38 | 58865.24 | 22.10 (0.46) | ZTF-c12 | |
| 2020-01-01 | 58849.48 | 2020-01-31 | 58879.27 | 58869.97 | 22.04 (0.36) | ZTF-c09 | |
| 2020-02-01 | 58880.42 | 2020-02-27 | 58906.29 | 58891.04 | 22.09 | ZTF-c09 | |
| 2020-02-01 | 58880.42 | 2020-02-27 | 58906.31 | 58895.65 | 22.00 | ZTF-c12 | |
| 2020-03-01 | 58909.28 | 2020-03-28 | 58936.27 | 58916.00 | 21.55 | ZTF-c12 | |
| 2020-03-04 | 58912.26 | 2020-03-31 | 58939.31 | 58925.76 | 21.60 | ZTF-c09 | |
| 2020-04-15 | 58954.17 | 2020-04-29 | 58968.24 | 58962.46 | 22.04 (0.42) | ZTF-c09 | |
| 2020-04-15 | 58954.28 | 2020-04-29 | 58968.27 | 58963.53 | 22.07 (0.33) | ZTF-c12 | |
| 2020-05-02 | 58971.25 | 2020-05-29 | 58998.18 | 58983.74 | 21.90 | ZTF-c12 | |
| 2020-05-03 | 58972.23 | 2020-06-05 | 59005.17 | 58987.19 | 21.84 | ZTF-c09 | |
| 2020-06-01 | 59001.17 | 2020-06-27 | 59027.20 | 59016.53 | 21.69 | ZTF-c12 | |
| 2020-10-18 | 59140.51 | 2020-11-05 | 59158.48 | 59149.21 | 21.46 | ZTF-c09 | |
| 2020-10-18 | 59140.51 | 2020-11-06 | 59159.52 | 59150.39 | 21.74 | ZTF-c12 | |
| 2020-11-12 | 59165.53 | 2020-11-29 | 59182.56 | 59174.27 | 21.83 (0.49) | ZTF-c09 | |
| 2020-11-12 | 59165.52 | 2020-12-01 | 59184.45 | 59175.00 | 21.83 (0.50) | ZTF-c12 | |
| 2020-12-02 | 59185.51 | 2020-12-22 | 59205.43 | 59196.32 | 21.62 (0.66) | ZTF-c09 | |
| 2020-12-05 | 59188.47 | 2020-12-22 | 59205.43 | 59198.29 | 21.72 (0.46) | ZTF-c12 | |
| 2021-01-01 | 59215.49 | 2021-01-17 | 59231.42 | 59222.69 | 21.64 (0.48) | ZTF-c12 | |
| 2021-01-08 | 59222.39 | 2021-01-18 | 59232.43 | 59227.44 | 21.60 (0.32) | ZTF-c09 | |
| 2018-04-08 | 58216.22 | 2018-06-15 | 58284.18 | 58243.86 | 21.62 (0.51) | ZTF-c09 | |
| 2018-04-06 | 58214.20 | 2018-06-15 | 58284.17 | 53245.90 | 21.74 (0.46) | ZTF-c12 | |
| 2018-11-07 | 58429.52 | 2019-06-24 | 58658.18 | 58524.29 | 21.72 | ZTF-c12 | |
| 2018-10-31 | 58422.53 | 2019-07-05 | 58669.18 | 58509.83 | 21.75 (0.54) | ZTF-c09 | |
| 2019-09-25 | 58751.53 | 2019-12-29 | 58846.46 | 58800.39 | 21.58 | ZTF-c09 | |
| 2019-10-20 | 58776.51 | 2019-12-29 | 58846.46 | 58812.89 | 21.61 | ZTF-c12 | |
| 2020-01-01 | 58849.45 | 2020-01-29 | 58877.34 | 58861.95 | 21.40 | ZTF-c12 | |
| 2020-01-01 | 58849.44 | 2020-01-31 | 58879.34 | 58867.73 | 21.74 (0.36) | ZTF-c12 | |
| 2020-02-01 | 58880.32 | 2020-02-27 | 58906.23 | 58890.86 | 21.75 (0.50) | ZTF-c09 | |
| 2020-02-01 | 58880.34 | 2020-02-20 | 58899.34 | 58891.63 | 21.71 (0.47) | ZTF-c12 | |
| 2020-03-01 | 58909.32 | 2020-03-31 | 58939.21 | 58916.04 | 21.68 | ZTF-c12 | |
| 2020-04-15 | 58954.24 | 2020-04-29 | 58968.19 | 58961.56 | 21.82 (0.33) | ZTF-c12 | |
| 2020-04-15 | 58954.22 | 2020-04-29 | 58968.17 | 58962.46 | 21.83 (0.33) | ZTF-c09 | |
| 2020-05-01 | 58970.21 | 2020-05-29 | 58998.25 | 58981.72 | 21.91 (0.42) | ZTF-c12 | |
| 2020-05-03 | 58972.17 | 2020-06-27 | 59027.18 | 58990.65 | 21.93 (0.52) | ZTF-c09 | |
| 2020-06-04 | 59004.25 | 2020-06-27 | 59027.17 | 59017.06 | 21.34 | ZTF-c12 | |
| 2020-10-14 | 59136.52 | 2020-11-05 | 59158.53 | 59147.65 | 21.74 (0.53) | ZTF-c09 | |
| 2020-10-18 | 59140.53 | 2020-11-06 | 59159.49 | 59149.61 | 21.61 (0.47) | ZTF-c12 | |
| 2020-11-12 | 59165.49 | 2020-11-28 | 59181.49 | 59172.69 | 21.48 (0.39) | ZTF-c12 | |
| 2020-11-12 | 59165.49 | 2020-12-02 | 59185.47 | 59174.79 | 21.26 (0.31) | ZTF-c09 | |
| 2020-12-01 | 59184.51 | 2020-12-17 | 59200.52 | 59193.48 | 21.30 (0.38) | ZTF-c12 | |
| 2020-12-10 | 59193.52 | 2020-12-27 | 59210.43 | 59200.32 | 21.29 (0.29) | ZTF-c09 | |
| 2021-01-04 | 59218.45 | 2021-01-04 | 59218.45 | 59218.45 | 21.32 (0.30) | ZTF-c09 | |
| 2021-01-01 | 59215.44 | 2021-01-05 | 59219.36 | 59219.42 | 21.32 (0.42) | ZTF-c12 | |
| 2021-01-01 | 59215.44 | 2021-01-17 | 59231.47 | 59222.68 | 21.29 (0.37) | ZTF-c12 | |
| 2021-01-07 | 59221.40 | 2021-01-11 | 59225.41 | 59223.43 | 21.31 (0.30) | ZTF-c12 | |
| 2021-01-08 | 59222.44 | 2021-01-12 | 59226.49 | 59224.47 | 21.34 (0.26) | ZTF-c09 | |
| 2021-01-13 | 59227.40 | 2021-01-17 | 59231.47 | 59229.43 | 21.36 (0.34) | ZTF-c12 | |
| 2021-01-14 | 59228.47 | 2021-01-18 | 59232.42 | 59230.45 | 21.35 (0.28) | ZTF-c09 | |
| 2018-04-24 | 58232.30 | 2018-05-28 | 58266.22 | 58251.60 | 20.98 | ZTF-c12 | |
| 2018-04-24 | 58232.30 | 2018-05-28 | 58266.22 | 58251.97 | 21.06 | ZTF-c09 |
Appendix B Instruments used in the spectroscopic campaigns
The spectra of AT~2018bwo, which cover four months of the LRN evolution, were taken with the m Southern African Large Telescope (SALT) with the Robert Stobie Spectrograph (RSS; hosted near Sutherland, South Africa); the 8.1 m Gemini South Telescope equipped with FLAMINGOS2 and the 4.1 m Southern Astrophysical Research (SOAR) Telescope plus the Goodman spectrograph (both located on Cerro Pachón, Chile); the 6.5 m Magellan-Baade Telescope with the Folded-port InfraRed Echelette (FIRE)414141FIRE data were reduced following the prescriptions detailed by Hsiao et al. (2019). spectrometer at the Las Campanas Observatory (Chile); and the 10 m Keck-I Telescope with the Low Resolution Imaging Spectrograph (LRIS; Oke et al., 1995) on Maunakea (Hawaii, USA). GTC, equipped with OSIRIS, was used for a late-time spectrum of AT~2018bwo, and all spectra of AT~2018bwo.
The following instruments were used in the spectroscopic campaign of AT~2021blu: the 2.0 m Faulkes North Telescope (FNT) with FLOYDS of the Las Cumbres Observatory node on Haleakalä (Hawaii, USA); the 3.05 m Shane telescope equipped with the Kast spectrograph (hosted at Lick Observatory, near San Jose, California, USA); Keck-I plus LRIS and Keck-II with NIRES; the 1.82 m Copernico Telescope plus AFOSC; the DOT plus ADFOSC; the GTC with OSIRIS; the NOT with ALFOSC; and the 3.58 m Telescopio Nazionale Galileo (TNG) with the Device Optimized for the LOw RESolution (DOLORES, or LRS).