Wave-Front Reconstruction via Single-Pixel Homodyne Imaging
We combine single-pixel imaging and homodyne detection to perform full object recovery (phase and amplitude). Our method does not require any prior information about the object or the illuminating fields. As a demonstration, we reconstruct the optical properties of several semi-transparent objects and find that the reconstructed complex transmission has a phase precision of 0.02 radians and a relative amplitude precision of 0.01.
1 Introduction
Full object recovery (i.e. amplitude and phase) is extremely useful in multiple applications. The intrinsic limitation of light detectors – sensitivity to only incoming light energy – makes it impossible to infer both amplitude and phase with only one measurement. Several numerical methods were developed to infer the full wavefront [1], they generally require several measurements via scanning the distance and observing the modified intensity profile and then coupling it with iterative approximation routine for the reconstructed wavefront. Such methods are usually computationally intensive [2] and often requires some a priori information about the wavefront modifying object. For example, holography [3, 4, 5] and ptychography [6, 3, 7] assume only small modification of wavefront amplitude.
Reconstruction of the spatial object complex transmission coefficient, i.e. wavefront modification right behind the object requires either object raster or collecting speckle patterns with images. This makes it time consuming, and thus sensitive to illumination instabilities, or increase data storage demand to collect multiple images of the speckle pattern. Use of cameras makes the reconstruction method suitable only for a subset of wavelengths, dimming the use of the speckle pattern method at X-ray or THz wavelengths. These problems are circumvented by the use of single-pixel imaging (SPI) techniques [8] where the object illuminated (or sampled at the detector) with multiple spatial light profiles allowing to reconstruct its 2D shape [6, 9]. Expansion of SPI ideas to the phase shifting holography [10] allows to reconstruct full wavefront with the assumption that a reference beam is spatially uniform in amplitude and phase [4, 11, 12]. The SPI method alongside with the compressive sampling techniques [13, 14, 15, 9, 12] can significantly reduce the required the number of measurements.
We present an alternative method for the reconstruction of an object’s spatial complex transmission (amplitude and phase) that relies on using phase-sensitive amplification from homodyne detection and the spatial information reconstruction of single-pixel imaging. Unlike previously reported scanning homodyning [16] our method does not have physical motion of either sample or probing beams. Our treatment of the system is more general and does not rely on the commonly used assumption of the spatial uniformity [16, 12, 11] of reference or local oscillator (LO) beams. An additional benefit of our method is the ability to work with extremely small probe light intensity (theoretically down to a single photon level) owing to excellent LO noise suppression and amplification by homodyning. Such ability to image with a weak probe is extremely useful for bioimaging which is sensitive to the photo-induced damage of biosamples.
2 Theory of single-pixel imaging via homodyne detection
In traditional single-pixel imaging (SPI), a light source illuminates a scene and is then collected onto a photodiode using a form of structured detection [8]. Structured detection involves projecting your sampled scene onto a set of spatial basis elements, , and then measuring the intensity transmitted with a photodiode (single-pixel camera), . The scene can then be reconstructed, pixel by pixel, based on the intensity measured for each basis element, . SPI works well to reconstruct the image intensity. However, if we desire to reconstruct the full wavefront (i.e. phase information), we will need to include another layer of detection that is sensitive to phase. The digital holography uses a 4-step phase shift technique, to obtain phase-dependent (complex) weights required for the full wavefront reconstruction [9, 10, 12], but it works only in the assumption of the spatially uniform reference beam. We have chosen to combine SPI with homodyne detection – single-pixel homodyne imaging – to circumvent such limitations.
Phase-sensitive homodyne detection allows us to probe optical depth while also amplifying a weak probe beam. Homodyning requires another beam as a phase reference, traditionally called the local oscillator (LO). The LO and interrogating probe (which illuminates our sample) are mixed on a 50/50 beam splitter and the resulting fields are measured with balanced photodiodes. The two beams are required to be phase-locked. For our imaging method, it is important to consider a general EM field shape of the LO () and interrogating probe field (), where and are the spatial positions, is the complex amplitude of the field, and is the relative phase between the LO and probe.
Using the standard homodyning formalism [17], with the assumption , we can write the differential current from the balanced photodiode, , as
| (1) |
where we define the overlap, , as
| (2a) | ||||
| (2b) | ||||
Here and are phases of the interrogating probe and LO fields. In the homodyne detection scheme, the probe field is amplified by the LO, only contributing to the final signal when the LO and input field are spatially overlapped.
The balance photodiode zeroes the large DC component proportional to the LO or reference intensity which is present in holography method [10, 4]. Thus, homodyning eases the requirement of the high dynamic range of the detector acquisition, since the interfering term of eq. 1 can be quite small in comparison to DC term. Combined with homodyning, we are also insensitive to the noise of the LO while amplifying the weak input field .
By utilizing the phase-dependent nature of homodyne detection in conjunction with single-pixel imaging, we can reconstruct the field and move beyond simple intensity reconstruction. Single-pixel imaging alone relies on sampling an image with a known structured basis and then reconstructing based on the intensities measured at a single photodiode. In the same way, our method relies on sampling the object of interest by using structured detection, i.e. we shape the LO in the set of the orthogonal modes and amplify portions of our probe beam based on the overlap with the LO.
It is possible to reconstruct with any complete sampling basis. We choose to use the Hadamard matrices as our basis, which are formed with a tiling where the rows of each matrix are orthogonal to the others. The differential homodyne signal (Eq. 1) is governed by the overlap with each of the basis modes of the LO (see Fig. 1 a and b). The overlap in the real space can be approximated in the pixels space as the sum, , where
| (3) |
where is the overlap of the LO, probe, and th Hadamard mode, and goes over the pixels of the Hadamard mask. When the masked LO has a strong overlap with the input field, the differential signal will increase. In the experiment, we find by sweeping through all possible LO phases and fitting the observed differential current to modified Eq. 1 which is now LO mode specific:
| (4) |
We can extract both the overlap, , and phase, , which allows full reconstruction of the wavefront product, , by the following formula, similar to intensity-based single-pixel imaging:
| (5) |
where is the pixel of the Hadamard mask, is the Hadamard mode, is the overlap between the LO and probe field, and is the relative phase of the shaped LO and probe field. See Fig. 1 for a visual depiction of the image reconstruction process. It is worth mentioning that, our method is compatible with compressive sensing techniques, which allow fewer samples than required for completeness. We performed numerical simulations to confirm this.
We define object complex transmission, , as the ratio of the reconstructed wavefront, , that has probed an object and a reference, , which did not,
| (6) |

3 Experimental Methods

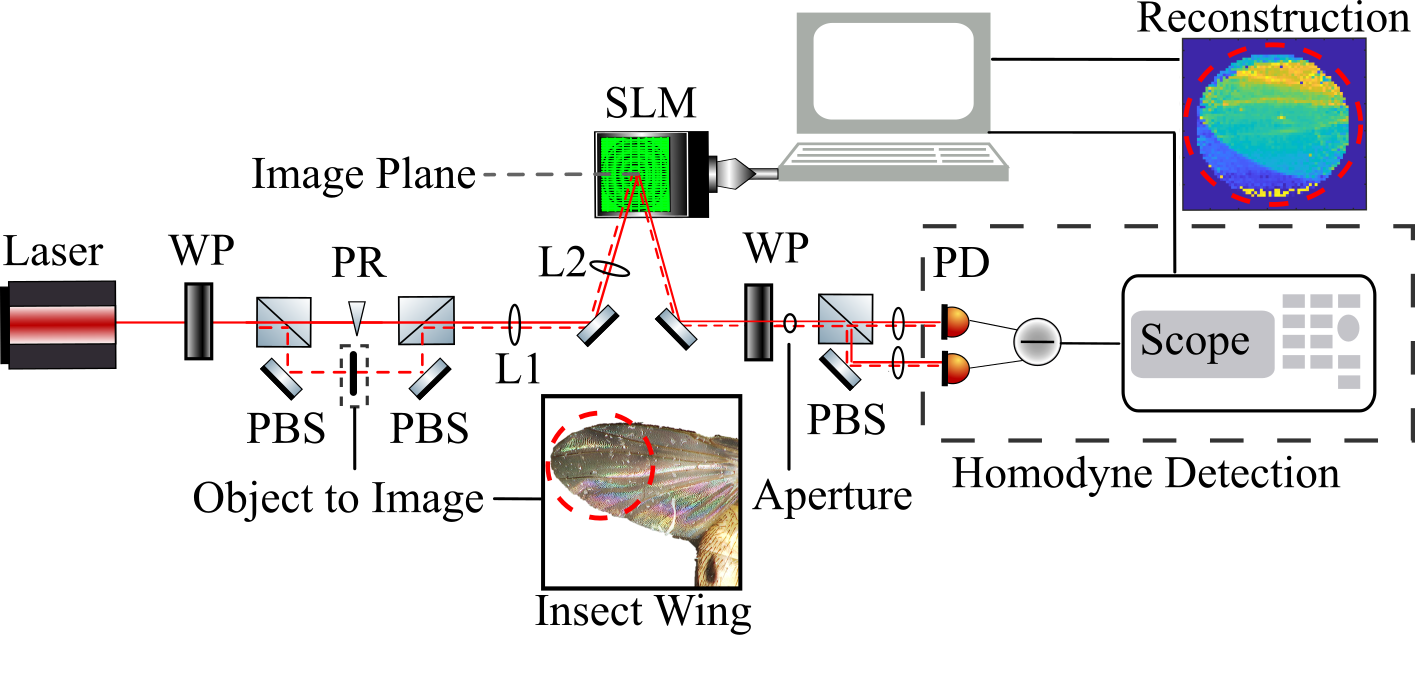
A schematic of our experimental setup can be found in Fig. 2. The beam used in our setup is produced by a 795 nm laser. We spatially filter the beam to have a predominately Gaussian spatial profile and then use a beam splitter to separate a small amount of light which acts as our interrogating probe beam, . The rest of the beam is utilized as the LO, . The probe samples an object and is then spatially overlapped with the LO (Eq. 2a).
The two beams travel collinearly through a 4-f imaging system, which moves the imaging plane of the object onto a spatial light modulator (SLM) plane. Although both beams reflect off the SLM, only the LO’s spatial profile is modified, because the SLM is polarization sensitive and the beams are in orthogonal polarizations. Having both beams travel together through most of the optical path allows us to maintain the relative phase stability of the probe and LO.
To modify the overlap between the LO and probe, and extract information about our object according to Eq. 3, we place a series of Hadamard masks () onto our LO using the SLM (Meadowlark Optics SLM with 512x512 pixels). This SLM only modifies the phase of our beam, but by applying a blazed grating [18] to a group of least 5x5 pixels, we were able to generate required intensity mask with effective 64x64 pixels. The Hadamard matrices, which we use as the detection basis, consist of tiling, the SLM cannot physically generate a negative intensity pixel. To work around this technical hurdle, we break our true Hadamard mask into a linear combination of two masks containing only 1s and 0s, and then subtract the weighted pairs similar to [8].
We controllably change the path length (phase) between the LO and the probe by driving a piezoelectric (PZT) mounted mirror in the interferometric path. This effectively acts as a phase retarder (PR). We sweep the phase between the LO and probe and record the interference fringe for each of the Hadamard masks applied by the SLM.
After a mask is applied to the LO the two beams are mixed on a beamsplitter and propagate to the far field where they are collected onto two balanced photodiodes. The differential current (Eq. 1) allows us to extract the phase of each Hadamard mask. By fitting the fringe, we can extract the amplitude and relative phase information for a specific mask (see Eq. 4 and Fig. 1a) which is used to construct the weight defined in Eq. 5. We use a reference phase to correct for any slow interferometric drifts.
4 Results


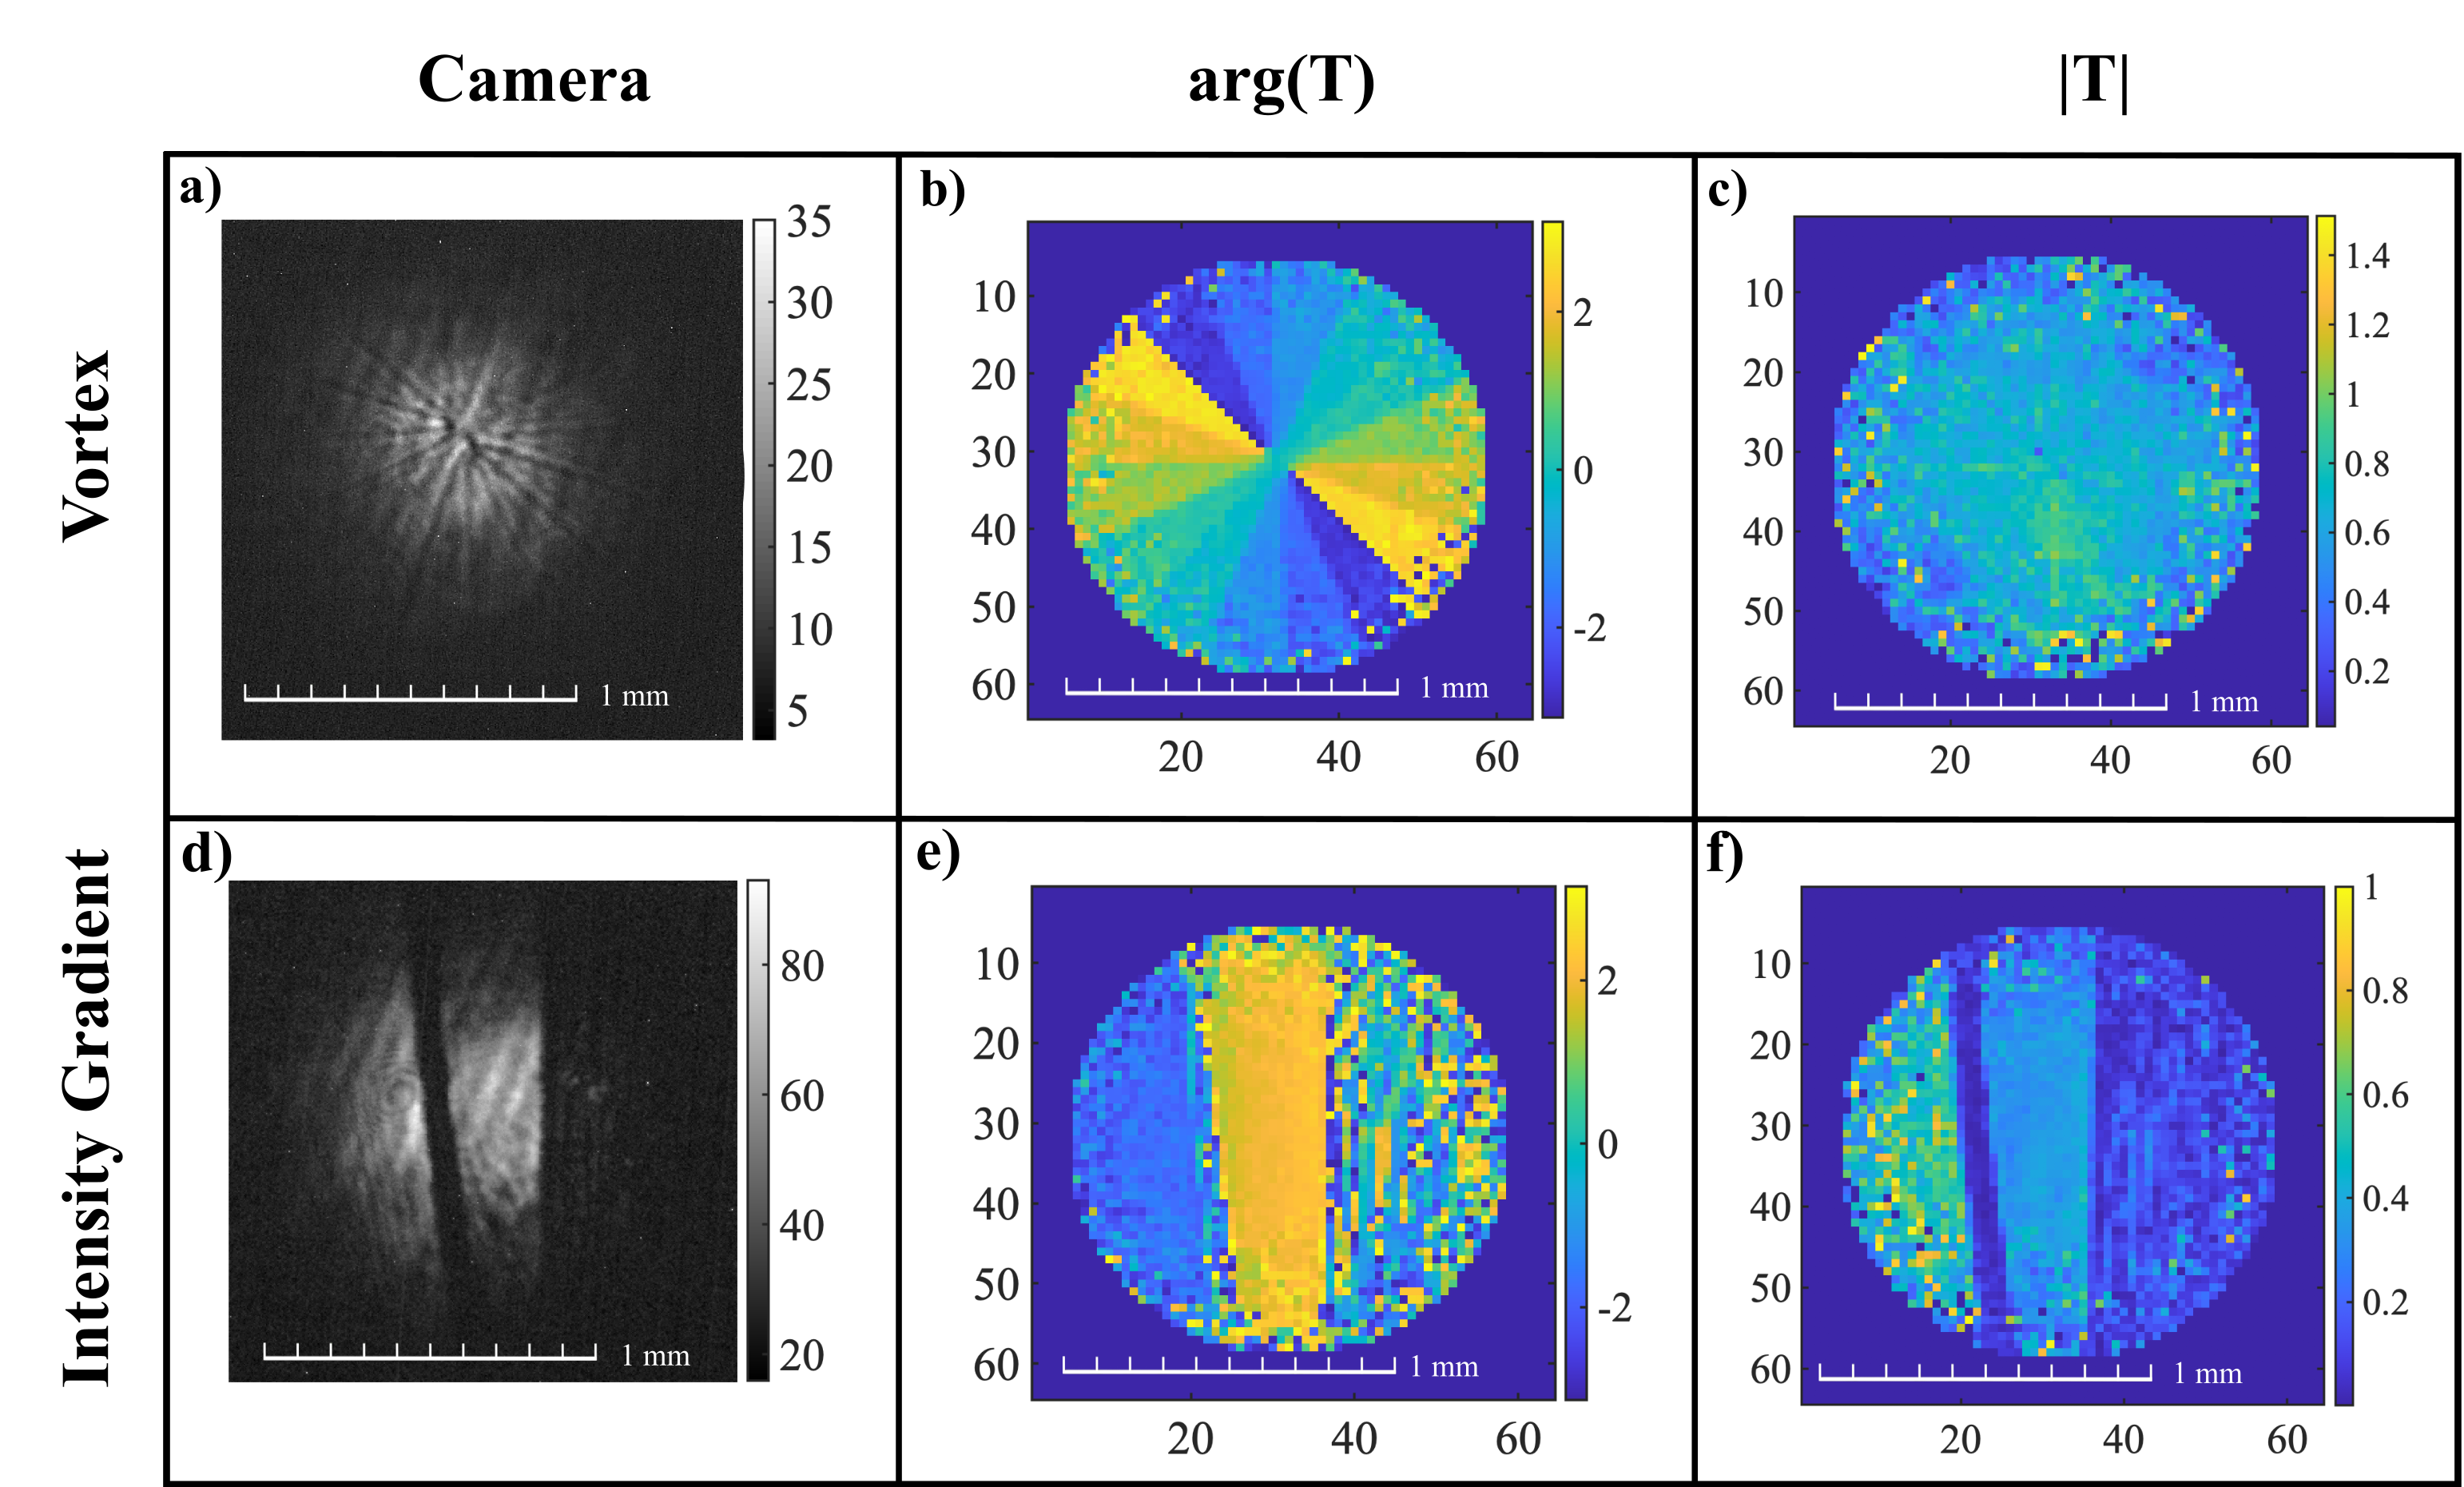
To demonstrate the phase sensitivity of our method, we choose to reconstruct several transparent objects with variable optical depths (see Fig. 3). The background of each object reconstruction is removed by dividing out an empty beam from the object, resulting in a phase and amplitude transmission masks (Eq. 6).
The top row of Fig. 3 shows experimentally reconstructed images of an optical vortex mask which is a glass plate with sector-wise variable thickness spanning 850nm (Fig. 3(b,c) ). In our phase transmission reconstruction (Fig. 3b), we observe clear phase steps corresponding to the sectors of the phase plate. Notice that no such information is available in the direct camera image (Fig. 3a), which is sensitive only to changes in intensity. As expected, the amplitude transmission reconstruction shows a flat profile with an approximate transmission of 1 (Fig. 3c). Due to the noise around the edges of the beam, the maximum transmission is scaled larger than 1.
Fig. 3d shows a traditional camera image of the intensity gradient mask where the left-hand side is empty, the center contains one absorptive filter, and the right-hand side contains two overlaid absorptive filters. The empty left side and the center filter object appear to be very similar to the traditional camera image (Fig. 3d ) but the reconstructed amplitude transmission (Fig. 3f) shows less light is transmitted through the center. Our reconstructed phase transmission profile (Fig. 3e) clearly shows a distinction between the left and center sections but is undefined on the right side due to low light as the light transmission is small.
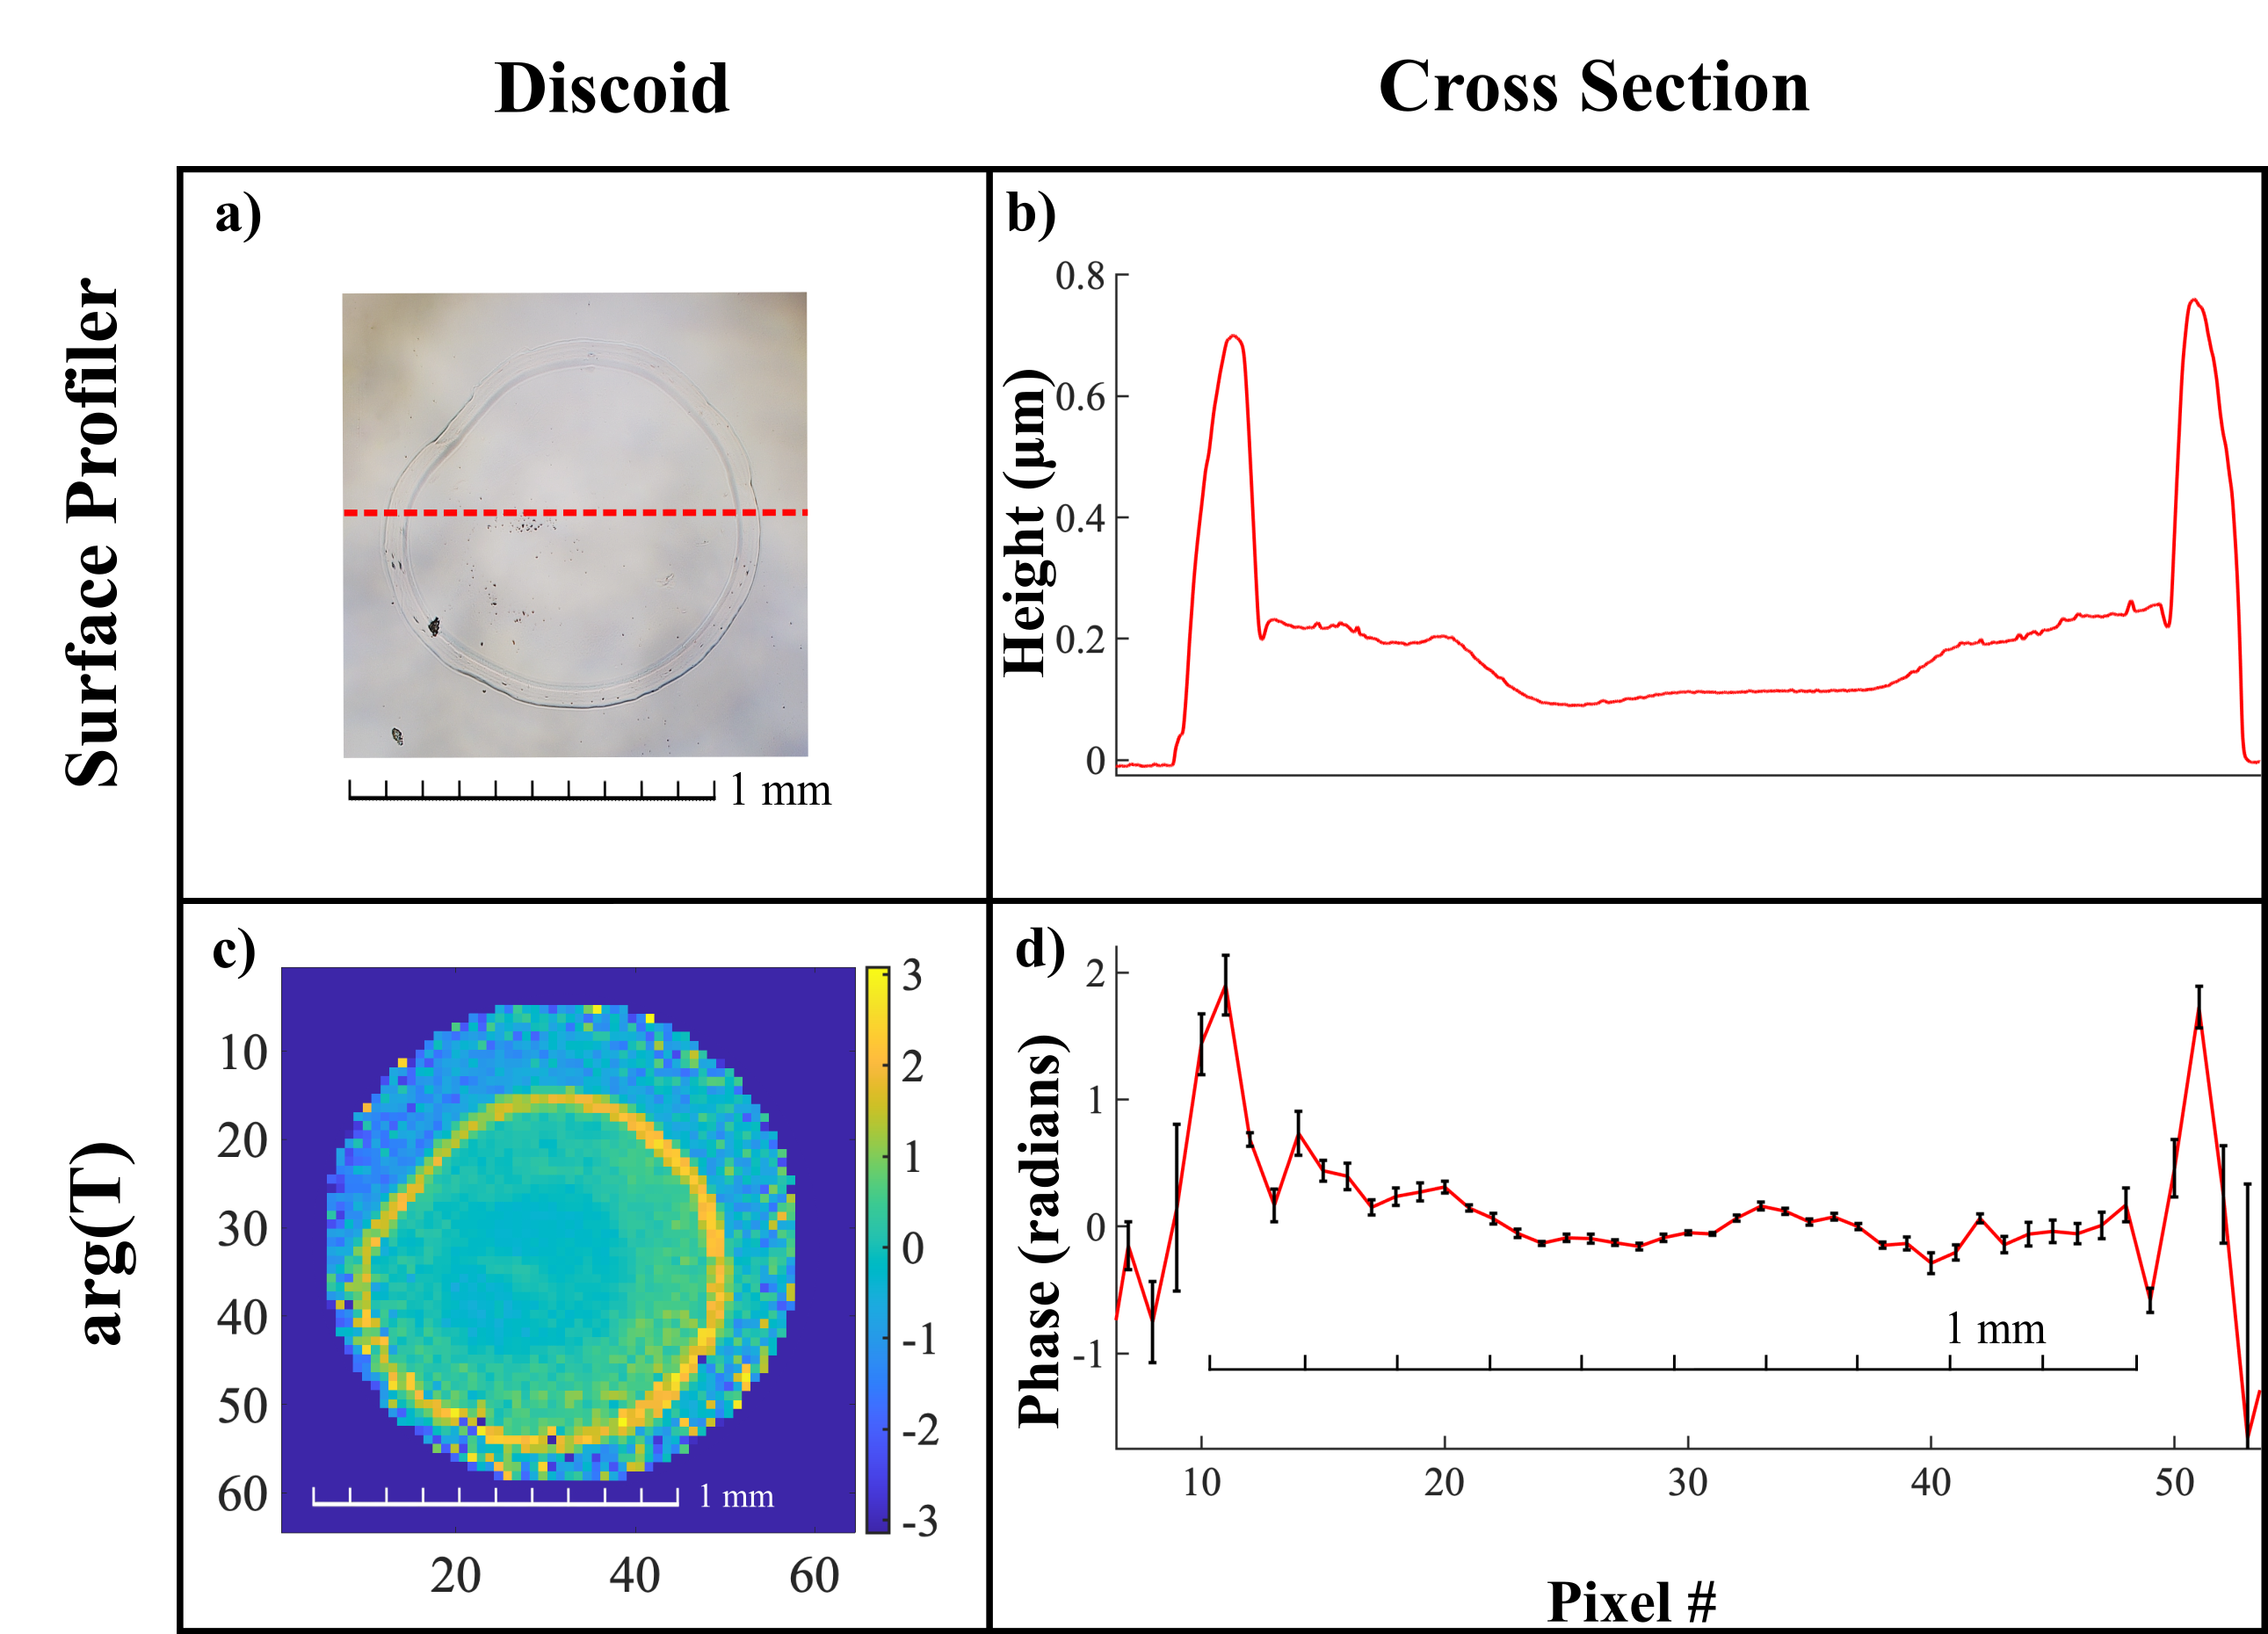
To qualitatively analyze the depth resolution of our phase transmission reconstructions, we take several data sets of the same object, a drop of sanitizer which after the alcohol evaporation has a discoid shape. This is compared to a traditional surface measurement method (Fig. 4). Using a Bruker Dektak Surface Profiler, a diamond-tip stylus sweeps across the surface of the discoid to record the height differences between the ridge circumference boundaries, showing a crater-like depth shape. Fig. 4b shows the cross section result of this method with a vertical resolution of 0.1 nm. The Bruker Profiler performs a standard scan over a 2 mm length for a total of 20 seconds. The stylus has a 2 radius and uses a force equivalent to 3 mg. The phase transmission (Fig. 4c) of the discoid is reconstructed multiple times and a similar cross-section (Fig. 4d) is taken across the crater-like shape. The uncertainty of the phase transmission reconstruction comes from the statistics of the multiple runs.
Although slightly different cross-sections are taken of the microscope image and the reconstructed phase, there is a general agreement of the discoid shape and the perimeter locations.
Based on multiple data sets of discoid phase reconstruction (Fig. 3c) the experimental phase reconstruction uncertainty is radians in the center of the image where we have the strong LO. We can reconstruct the amplitude of transmission with a statistical uncertainty of . However, the phase and amplitude sensitivity of our method is ultimately limited by the shot noise level, though in our case we were limited by the phase stability, quantization noise of our analog to digital converter, and the dark noise of our detector. Spatially we can reconstruct images with 64x64 pixels with the physical size of the pixel corresponding to . But, no physical limitations are keeping our method from approaching the Rayleigh limit, in terms of spatial resolution.
5 Conclusion
We demonstrate how the use of single-pixel imaging with homodyne detection can expose full transmission information (amplitude and phase) about the object. This method is simple in design yet requires no assumptions about the objects’ characteristics or illuminating light before imaging. The ability to use very weak probe light makes our method attractive for bioimaging. Additionally, it is worth mentioning that, our method is compatible with compressive sensing techniques.
6 Funding
Air Force Office of Scientific Research (FA9550-19-1-0066).
7 Acknowledgments
We thank Olga Trofimova and Doug Beringer from William & Mary Applied Research Center (ARC) Core Labs for assisting us with the characterization of our samples with Bruker Dektak XT Surface Profiler and HIROX RH-2000 High Resolution Digital-Video Microscopy System.
References
- [1] D. R. Luke, J. V. Burke, R. G. Lyon, SIAM Review 44, 169 (2002).
- [2] C. Wang, Q. Fu, X. Dun, W. Heidrich, Scientific Reports 9 (2019).
- [3] F. Wittwer, J. Hagemann, D. Brückner, S. Flenner, C. G. Schroer, Optica 9, 295 (2022).
- [4] P. Clemente, et al., Opt. Lett. 38, 2524 (2013).
- [5] G. Indebetouw, J. Opt. Soc. Am. A 23, 2657 (2006).
- [6] M. Li, et al., Optics Letters 46, 1624 (2021).
- [7] P. Sidorenko, O. Cohen, Optica 3, 9 (2016).
- [8] G. M. Gibson, S. D. Johnson, M. J. Padgett, Optics Express 28, 28190 (2020).
- [9] K. Lee, J. Ahn, Applied Physics Letters 97 (2010).
- [10] I. Yamaguchi, T. Zhang, Opt. Lett. 22, 1268 (1997).
- [11] A. Santos-Amador, et al., Appl. Opt. 60, 6935 (2021).
- [12] H.-Y. Hou, et al., Opt. Express 29, 41827 (2021).
- [13] E. J. Candes, T. Tao, IEEE Transactions on Information Theory 52, 5406 (2006).
- [14] M. F. Duarte, et al., IEEE Signal Processing Magazine 25, 83 (2008).
- [15] D. Donoho, IEEE Transactions on Information Theory 52, 1289 (2006).
- [16] S. H. Eang, S. Yoon, J. G. Park, K. Cho, Optics Letters 40, 2457 (2015).
- [17] H.-A. Bachor, T. C. Ralph, A Guide to Experiments in Quantum Optics (Wiley-VCH, USA, 2004), second edn.
- [18] E. Bolduc, N. Bent, E. Santamato, E. Karimi, R. W. Boyd, Opt. Lett. 38, 3546 (2013).