Relict landslide detection using Deep-Learning architectures for image segmentation in rainforest areas: A new framework
Abstract
Landslides are destructive and recurrent natural disasters on steep slopes and represent a risk to lives and properties. Knowledge of relict landslides’ location is vital to understand their mechanisms, update inventory maps and improve risk assessment. However, relict landslide mapping is complex in tropical regions covered with rainforest vegetation. A new CNN framework is proposed for semi-automatic detection of relict landslides, which uses a dataset generated by a k-means clustering algorithm and has a pre-training step. The weights computed in the pre-training are used to fine-tune the CNN training process. A comparison between the proposed and the standard framework is performed using CBERS-04A WPM images. Three CNNs for semantic segmentation are used (Unet, FPN, Linknet) with two augmented datasets. A total of 42 combinations of CNNs are tested. Values of precision and recall were very similar between the combinations tested. Recall was higher than 75% for every combination, but precision values were usually smaller than 20%. False positives (FP) samples were addressed as the cause for these low precision values. Predictions of the proposed framework were more accurate and correctly detected more landslides. This work demonstrates that there are limitations for detecting relict landslides in areas covered with rainforest, mainly related to similarities between the spectral response of pastures and deforested areas with Gleichenella sp. ferns, commonly used as an indicator of landslide scars.
keywords:
landslides; deep learning; CNN; k means; CBERS-4ACite as: Garcia, G.P.B., Soares, L.P., Espadoto, M., Grohmann, C.H. 2023. Relict landslide detection using deep-learning architectures for image segmentation in rainforest areas: a new framework. International Journal of Remote Sensing, 44(7): 2168–2195. doi:10.1080/01431161.2023.2197130
1 Introduction
Landslides are destructive and recurrent natural disasters that represent a risk to lives and properties when near urban areas (Metternicht, Hurni, and Gogu, 2005; Kasai et al., 2009; Netto et al., 2011; Jebur, Pradhan, and Tehrany, 2014; Nohani et al., 2019)). They are responsible for expressive human and economic losses worldwide, costing millions of dollars each year (Tominaga, Santoro, and do Amaral, 2009; Netto et al., 2011). The Sendai framework for disaster risk reduction 2015-2030 (UNISDR, 2015) stated that natural hazards affected more than 25 million people and caused economic losses up to US$ 1.3 trillion between 2008 and 2012. Landslides occur on steep slopes and are essential agents in landscape evolution by promoting changes through successive events that shape the hillsides (Wolle, 1988; Summerfield, 1991; Tominaga, Santoro, and do Amaral, 2009; Guzzetti et al., 2012). Deforestation, inadequate urban growth, and climate change are increasing the occurence of mass movements, mainly water-related landslides such as earthflows and mudflows (Tominaga, Santoro, and do Amaral, 2009; Gariano and Guzzetti, 2016; Nohani et al., 2019).
In recent years, ongoing technological development provided new tools for researchers which are faster, better, and more accurate than conventional ones, making data easier to gather and handle which significantly changed the methods of landslide studies (Mantovani, Soeters, and VAn Westen, 1996; Metternicht, Hurni, and Gogu, 2005; Scaioni et al., 2014). Conventional methods consist of extensive fieldwork, scanning of topographic maps and visual photo-interpretation of stereo images, which are costly, time consuming and have limitations that affect the quality of the data (Nilsen and Brabb, 1973; Guzzetti et al., 1999; Roering, Kirchner, and Dietrich, 2005; Van Den Eeckhaut et al., 2005; Booth, Roering, and Perron, 2009; Burns and Madin, 2009; Guzzetti et al., 2012; Roering et al., 2013; Scaioni et al., 2014). Use of lidar (Light Detection and Ranging) (McKean and Roering, 2004; Glenn et al., 2006; Ardizzone et al., 2007; Van Den Eeckhaut et al., 2007; Baldo et al., 2009; Burns and Madin, 2009; Kasai et al., 2009; Ventura et al., 2011; Jaboyedoff et al., 2012; Chen et al., 2013; Wang et al., 2013; Jebur, Pradhan, and Tehrany, 2014), RPA (Remotely Piloted Aircraft) SfM-MVS (Structure from Motion Multi-view stereo) (Niethammer et al., 2010; Lucieer, de Jong, and Turner, 2014; Turner, Lucieer, and de Jong, 2015; Lindner et al., 2016; Yu et al., 2017; Mozas-Calvache, Pérez-garcia, and Fernandez-del Castillo, 2017; Menegoni, Giordan, and Perotti, 2020; Devoto et al., 2020; Samodra et al., 2020; Xu et al., 2020; Godone et al., 2020) and process automation (Van Den Eeckhaut et al., 2007; Guzzetti et al., 2012; Van Den Eeckhaut et al., 2012; Scaioni et al., 2014; Knevels et al., 2019) are the hot spot in landslide studies that are replacing the traditional methods quickly. High resolution (HR) and very high resolution (VHR) data from both remote sensing imagery (satellite, RPA) and topographic data (lidar, SfM-MVS) became mandatory tools in landscape studies (Metternicht, Hurni, and Gogu, 2005; Jaboyedoff et al., 2012; Scaioni et al., 2014)).
Satellite multi-spectral imagery and airborne photographs are generally collected soon after the landslide events, which makes visual identification easier due to removal of material and vegetation (Guzzetti et al., 1999; Du and Teng, 2007; Booth, Roering, and Perron, 2009; Liu et al., 2009; Burns et al., 2010; Sameen and Pradhan, 2019). Landslide mapping enables the generation and update of inventory maps that are essential input data for risk assessment studies and landslide prediction (Sameen and Pradhan, 2019; Yu et al., 2021; Dias, Hölbling, and Grohmann, 2021). The knowledge of the exact landslide location allows specific analysis for emergency response and precautions actions(Chen et al., 2018), so a continuous monitoring of landslides and update of inventory maps is recommended. Nonetheless, these are not practicable for many government agencies due to lack of resources, personal or technology, where inventory maps do not exist or those that do exist are outdated (Dias, Hölbling, and Grohmann, 2021). In this case, inventory maps can be created or updated by identification of relict landslides, but only those which have been preserved in landscape since the day of occurrence.
Identification of relict landslides is important to enhance understanding of landslide causative factors and mechanisms (Sameen and Pradhan, 2019; Li et al., 2021), to predict future events, design preventive frameworks (Schulz, 2007) and for quick landslides hazard emergency response (Chen et al., 2018). Also, landslide susceptibility is higher in surrounding areas of relict landslides due to terrain conditions that makes the slope more likely to landslides occurence (Shahabi and Hashim, 2015; Zhong, Hu, and Zhou, 2019). Relict landslide detection is most needed where there is a lack of data, no historical records or outdated inventory maps, such as in many states of Brazil (Dias, Hölbling, and Grohmann, 2021). However, identification of relict landslides by remote sensing data is not an easy task. In natural steep slopes, vegetation growth covers devastated areas making landslide identification and monitoring harder over time (Lehmann, 2008; Portela, 2014; Scaioni et al., 2014). Furthermore, relict landslide may suffer from surface erosion processes, such as runoff (Fiori and Carmignani, 2015) or swell factor (Dewitte and Demoulin, 2005; Pedrazzini et al., 2010; Schulz et al., 2018), which disturbs the terrain and degrades landslide boundaries making them unrecognizable.
The post-event visual identification is commonly performed by experts in GIS (Geographic Information System) software and is an exhaustive, time-consuming task (Van Den Eeckhaut et al., 2007; Burns and Madin, 2009; Burns et al., 2010). In the last couple of decades, semi-automatic and automatic detection of landslides started to be exploited from different sources and tools, mainly using very-high-resolution (VHR) topographic data, such as lidar DEMs (Digital Elevation Models), and multispectral imagery (McKean and Roering, 2004; Glenn et al., 2006; Ardizzone et al., 2007; Van Den Eeckhaut et al., 2007; Baldo et al., 2009; Burns and Madin, 2009; Kasai et al., 2009; Ventura et al., 2011; Jaboyedoff et al., 2012; Chen et al., 2013; Wang et al., 2013; Jebur, Pradhan, and Tehrany, 2014). Automatic landslide detection is important because it allows rapid mapping procedures with potential applications for hazard assessments, risk mitigation, and post-event recovery efforts (Guzzetti et al., 2012). Methods such as OBIA (Object-based Identification Analysis) (Petropoulos, Kalaitzidis, and Prasad Vadrevu, 2012; Van Den Eeckhaut et al., 2012; Scaioni et al., 2014; Knevels et al., 2019), pixel-based classification (Li et al., 2020; Wang et al., 2020), machine learning algorithms (Pal and Mather, 2006; Maxwell, Warner, and Fang, 2018; Ghorbanzadeh et al., 2019; Zhong, Hu, and Zhou, 2019) and Deep Learning (Luus et al., 2015; Ding et al., 2016; Scott et al., 2017; Kussul et al., 2017; Chen et al., 2018; Ma et al., 2019; Sameen and Pradhan, 2019; Ji et al., 2020; Li et al., 2020; Prakash, Manconi, and Loew, 2020; Li et al., 2021; Yu et al., 2021; Soares et al., 2022; Xu et al., 2022; Meena et al., 2022) are the most prominent techniques in landslide semi-automatic and automatic detection studies.
Machine Learning algorithms and, more recently, Deep Learning neural networks showed excellent performance in remote sensing analysis, although deep networks were not designed to process high-resolution images (Audebert, Le Saux, and Lefèvre, 2016; Cheng, Han, and Lu, 2017). Convolutional Neural Networks (CNN) is probably the most successful network architecture in deep learning and have been widely used to extract spatial features for object detection and image segmentation of high-resolution images (Krizhevsky, Sutskever, and Hinton, 2012; Castelluccio et al., 2015; Zhang, Zhang, and Kumar, 2016; Kussul et al., 2017; Zhao, Du, and Emery, 2017; Cheng et al., 2018; Ma et al., 2019; Zhong, Hu, and Zhou, 2019; Hoeser and Kuenzer, 2020; Li et al., 2020; Yu et al., 2021; Bai et al., 2022).
Studies for automatic landslide detection using CNN are still incipient, but the results are promising, and the interest of geoscientists in these techniques is increasing significantly (Ji et al., 2020). Although landslide detection studies share the same final goal, the methods and data used are quite different. Studies for comparison, evaluation of existing machine learning methods (Sameen and Pradhan, 2019; Ghorbanzadeh et al., 2019; Prakash, Manconi, and Loew, 2020; Wang et al., 2020; Li et al., 2021) and proposal of new CNN methods (Ding et al., 2016; Ji et al., 2020; Yu et al., 2021; Soares et al., 2022) are the most outstanding. Usually, new CNN models are proposed to solve specific problems that standard CNN models had difficulties with or achieved inappropriate results. Introduction to new networks architecture, modification of CNN framework, pre-processing of input data and image post-processing steps are the most common topics of the CNN models proposal studies.
Input data such as multispectral imagery, topographical data, or a combination of both is selected according to data availability and the study area characteristics. Also, the amount of data used for CNN training is essential for obtaining satisfactory results, mainly labeled data (Ronneberger, Fischer, and Brox, 2015). Most landslide detection studies focus on identifying recently triggered landslides using mainly multispectral images collected soon after the occurrence when landslide are more clearly visible in the landscape, which facilitates the classification process by the CNN.
On the other hand, identification of relict landslides has difficulties, such as preservation of landslide boundaries and degree of vegetation cover, and is usually performed using as input a DTM (Digital Terrain Model) generated from VHR topographical data that is able to filter out the vegetation cover (Guth et al., 2021; Wang et al., 2020). However, in addition to VHR topographical data not existing or not being available for most countries, results from landslide detection studies that added topographical data as an input band in the CNN’s training process did not achieved better results than using only spectral bands (Ghorbanzadeh et al., 2019; Sameen and Pradhan, 2019; Ji et al., 2020; Soares et al., 2022).
The main objective of this paper is to perform a semi-automatic detection of relict landslide using CNN for an area in southeastern Brazil that has preserved landslides on its slopes for several decades due to an specific fern species. A new framework for CNN semantic segmentation using transfer learning is proposed as an attempt to overcome difficulties such as lack of labeled landslide data, and improve the model’s classification ability. A comparison between the proposed and the standard framework will be performed. The focus is on taking advantage of the visual contrast between the ferns and the native vegetation to perform the detection of relict landslides using CBERS-04A WPM multispectral images as input to the CNN training process. Detection of relict landslides will help updating the inventory map of the region that is dated from the 1970s and did not suffer great reviews (Correa et al., 2017; Dias, Hölbling, and Grohmann, 2021). This study is novel in terms of using CBERS4A multispectral images as input for semi-automatic relict landslide detection and for proposing a new framework for CNN semantic segmentation that performs a pre-training step which is later used to fine tune the neural network, compared to previous studies that attempted to detect landslides in tropical regions.
2 Methods
2.1 Study Area
The study area is within the Serra do Mar mountain range, southeastern Brazil (Fig. 1). It includes the majority of Caraguatatuba municipality, encompassing coastal and mountainous portions. This region is known for the preserved Atlantic rainforest and has a long history of landslides occurrences in the hillsides, mainly shallow landslides and flows (Fúlfaro et al., 1976; Guidicini and Nieble, 1984; Augusto Filho, 1992). An inventory map is available for a major event that occurred in 1967, when almost 600 landslides of various sizes were identified, which caused destruction and human losses (Fúlfaro et al., 1976). Despite the high landslide occurrence rate in the region, there is a lack of landslide documentation, with few studies updating the previously inventory map and monitoring the landslides (Correa et al., 2017; Dias, Hölbling, and Grohmann, 2021).
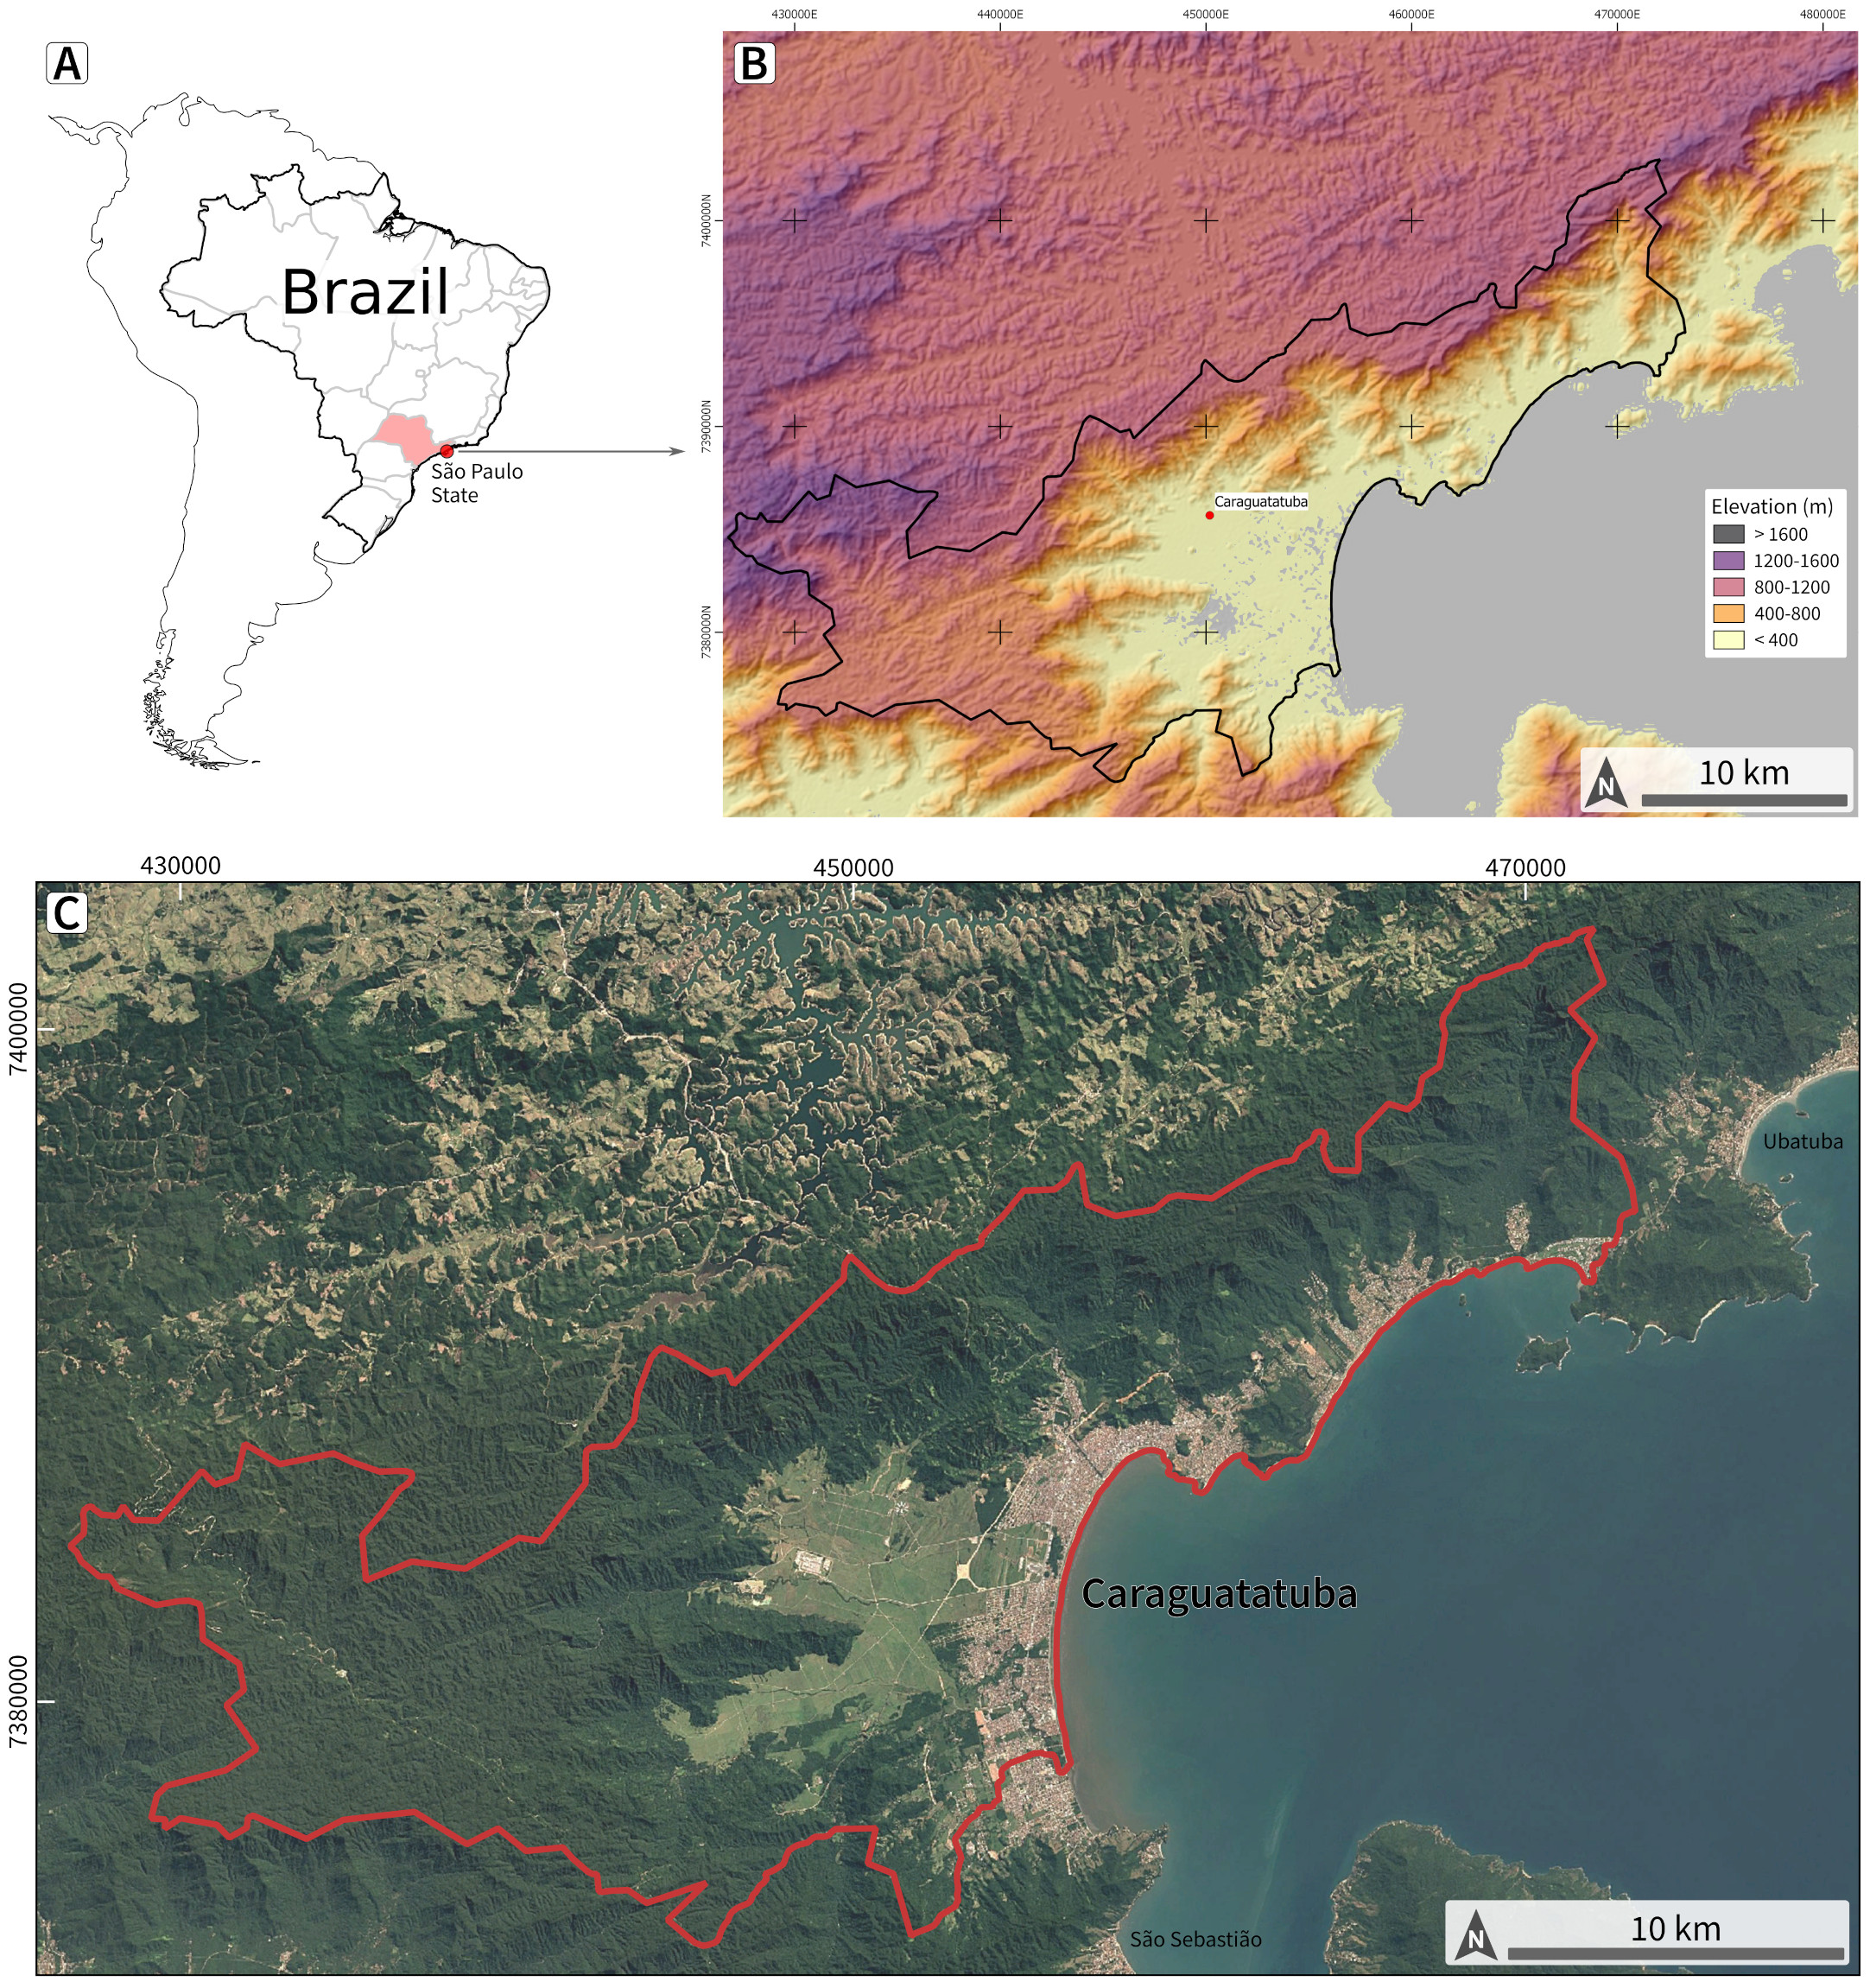
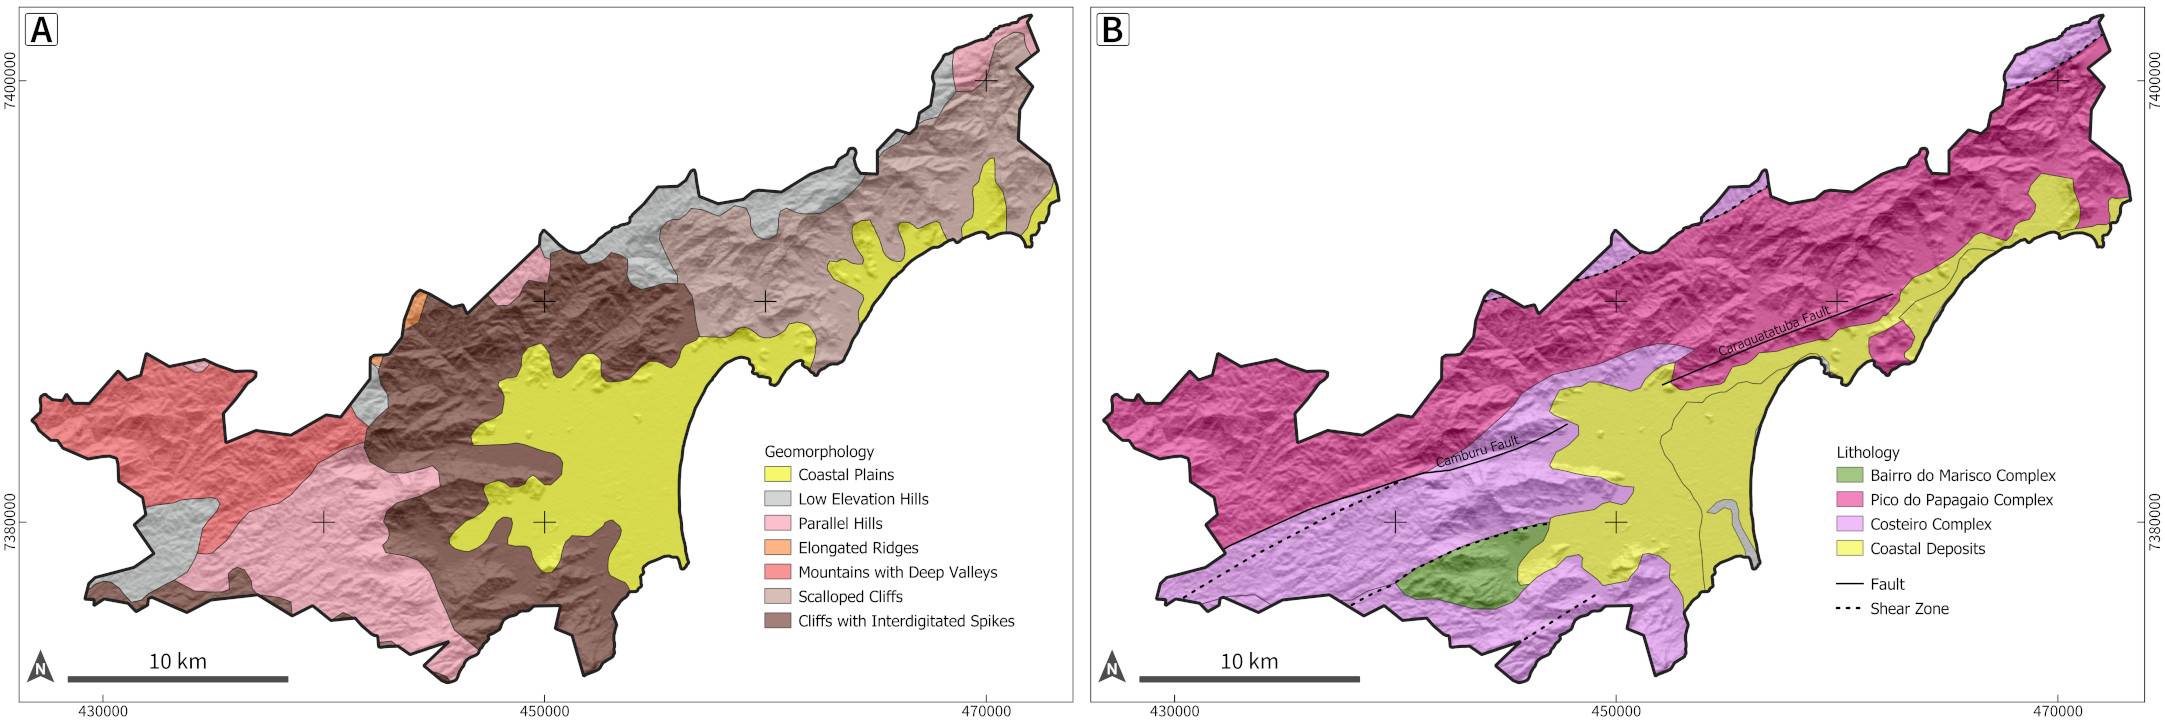
A mountainous landscape marks the study area in the west and the coastal areas with sand beaches and plains in the east (Ponçano, 1981) (Fig. 2A). The mountains are characterized as rugged relief with high slope gradients and valleys with amplitudes higher than 100 m, defined as Costeira Province (Almeida, 1964; Ponçano, 1981). The landslides usually occur in this section due to its favorable conditions for mass movements.
The geological setting is within the Mantiqueira Province, specifically in Serra do Mar Domain (Perrota et al., 2005), mainly composed of granites and gneisses from the Costeiro Complex and Pico do Papagaio Complex, which occurs as intercalated lenses controlled by shear zones (Fig. 2B). Several faults and shear zones oriented towards SW-NE comprising the structural framework of the study area (Perrota et al., 2005). The principal structure is the shear zone that occurs in the N-NW portion of the study area, namely the Bairro Alto Shear zone; other important structures are the Caraguatatuba fault and the Camburu fault. These structures control lithology. There is also the presence of mafic intrusions related to the Araçuaí - Rio Doce orogen, quaternary deposits occur in river banks and coastal plans.
The local climate also contributes to landslide occurrence with rainy summers that usually trigger landslides and other mass movements (Conti and Furlan, 1996). Climate regime in Caraguatatuba is defined as Cwa, or altitude tropical climate Koeppen (1948). The annual average rainfall is up to 1830 mm, with August as the driest month (60 mm) and January as the rainiest (300 mm).
Most of the study area is within the Atlantic rainforest biome, which covers almost all Brazilian coastal region and presents great biodiversity. The Dense Ombrofile Forest is the predominant vegetation cover, distinguished by high indices of temperature and rainfall during the year (Ellenberg and Mueller Dombois, 1967; Veloso, Rangel-Filho, and Lima, 1991), evergreen vegetation cover with several layers, a canopy that can reach up to 50 m in height, and dense shrubbery detaching ferns, bromeliads, and palm trees (Portela, 2014). Forest formation is controlled by elevation due to its mountainous context and can be divided into Dense Ombrofile Forest, Arboreal Forest, and Secondary vegetation (Kronka et al., 2007).
Despite the preserved vegetation in most of the study area, the landslides occur on natural steep slopes but are more common in deforested areas and close to roads and urban areas.
2.1.1 Gleichenella sp.
Ferns are common plants in the Atlantic rainforest of Serra do Mar being pioneers and efficient in regenerating degraded forest (Lehmann, 2008). The hillsides degraded by landslides in the study area are usually covered by a specific fern species named Gleichenella sp. while others are almost totally recovered by the forest (Lehmann, 2008; Portela, 2014) (Fig. 3). Gleichenella sp. usually prevents complete forest regeneration in the degraded areas, maintaining the landslide scar and boundaries distinguishable from adjacent areas.

2.2 Data
2.2.1 CBERS-04A
CBERS-04A is a mid-resolution remote sensing satellite in a sun-synchronous orbit launched in December 2019, with the first images released for download in January 2020. The satellite is operated by the Brazilian National Institute of Spatial Research (INPE) and the images are available for free download on their website (http://www2.dgi.inpe.br/catalogo/explore). It is equipped with three cameras: MUX (Multispectral Camera), WFI (Wide Field Imager), and WPM (Wide Panchromatic Multispectral). MUX and WFI have four optical bands (R, G, B, and NIR) with spatial resolution of 16.5 m and 55.5 m, respectively. WPM has five bands (R, G, B, NIR, and Panchromatic) with spatial resolution of 8 m for the optical bands and 2 m for the panchromatic. The revisit period is 31 days for the WPM and MUX and five days for the WFI. The swath width for each camera is 92 km (WPM), 95 km (MUX), and 684 km (WFI).
In this project five CBERS4A images were used with the four optical bands of the WPM camera, namely blue (0,45 - 0,52 m), green (0,52 - 0,59 m), red (0,63 - 0,69 m) and near-infrared (0,77 - 0,89 m). All the images were used without radiometric or atmospheric corrections and with no cloud cover.
2.3 Convolutional Neural Networks
CNN has shown impressive performance in many applications, including remote sensing analysis, with fast growth in the use of this network in the last few years (Krizhevsky, Sutskever, and Hinton, 2012; Castelluccio et al., 2015; Cheng et al., 2018; Bai et al., 2022). The typical architecture of a CNN is composed of multiple feature-extraction stages where each stage consists of a series of layers, including convolutional layers, pooling layers, and fully connected layers (Castelluccio et al., 2015; Cheng et al., 2018). CNN is designed to take advantage of the two-dimensional structure of the input image and focus on bridging the low-level features to high-level semantics of the image scene, automatically extracting intrinsic features from remote sensing imagery (Zhang, Zhang, and Kumar, 2016; Zhong et al., 2017). For Zhao et al. (2015) a limitation for using CNN in remote sensing image classification is that it requires many labeled training samples, which is not always available.
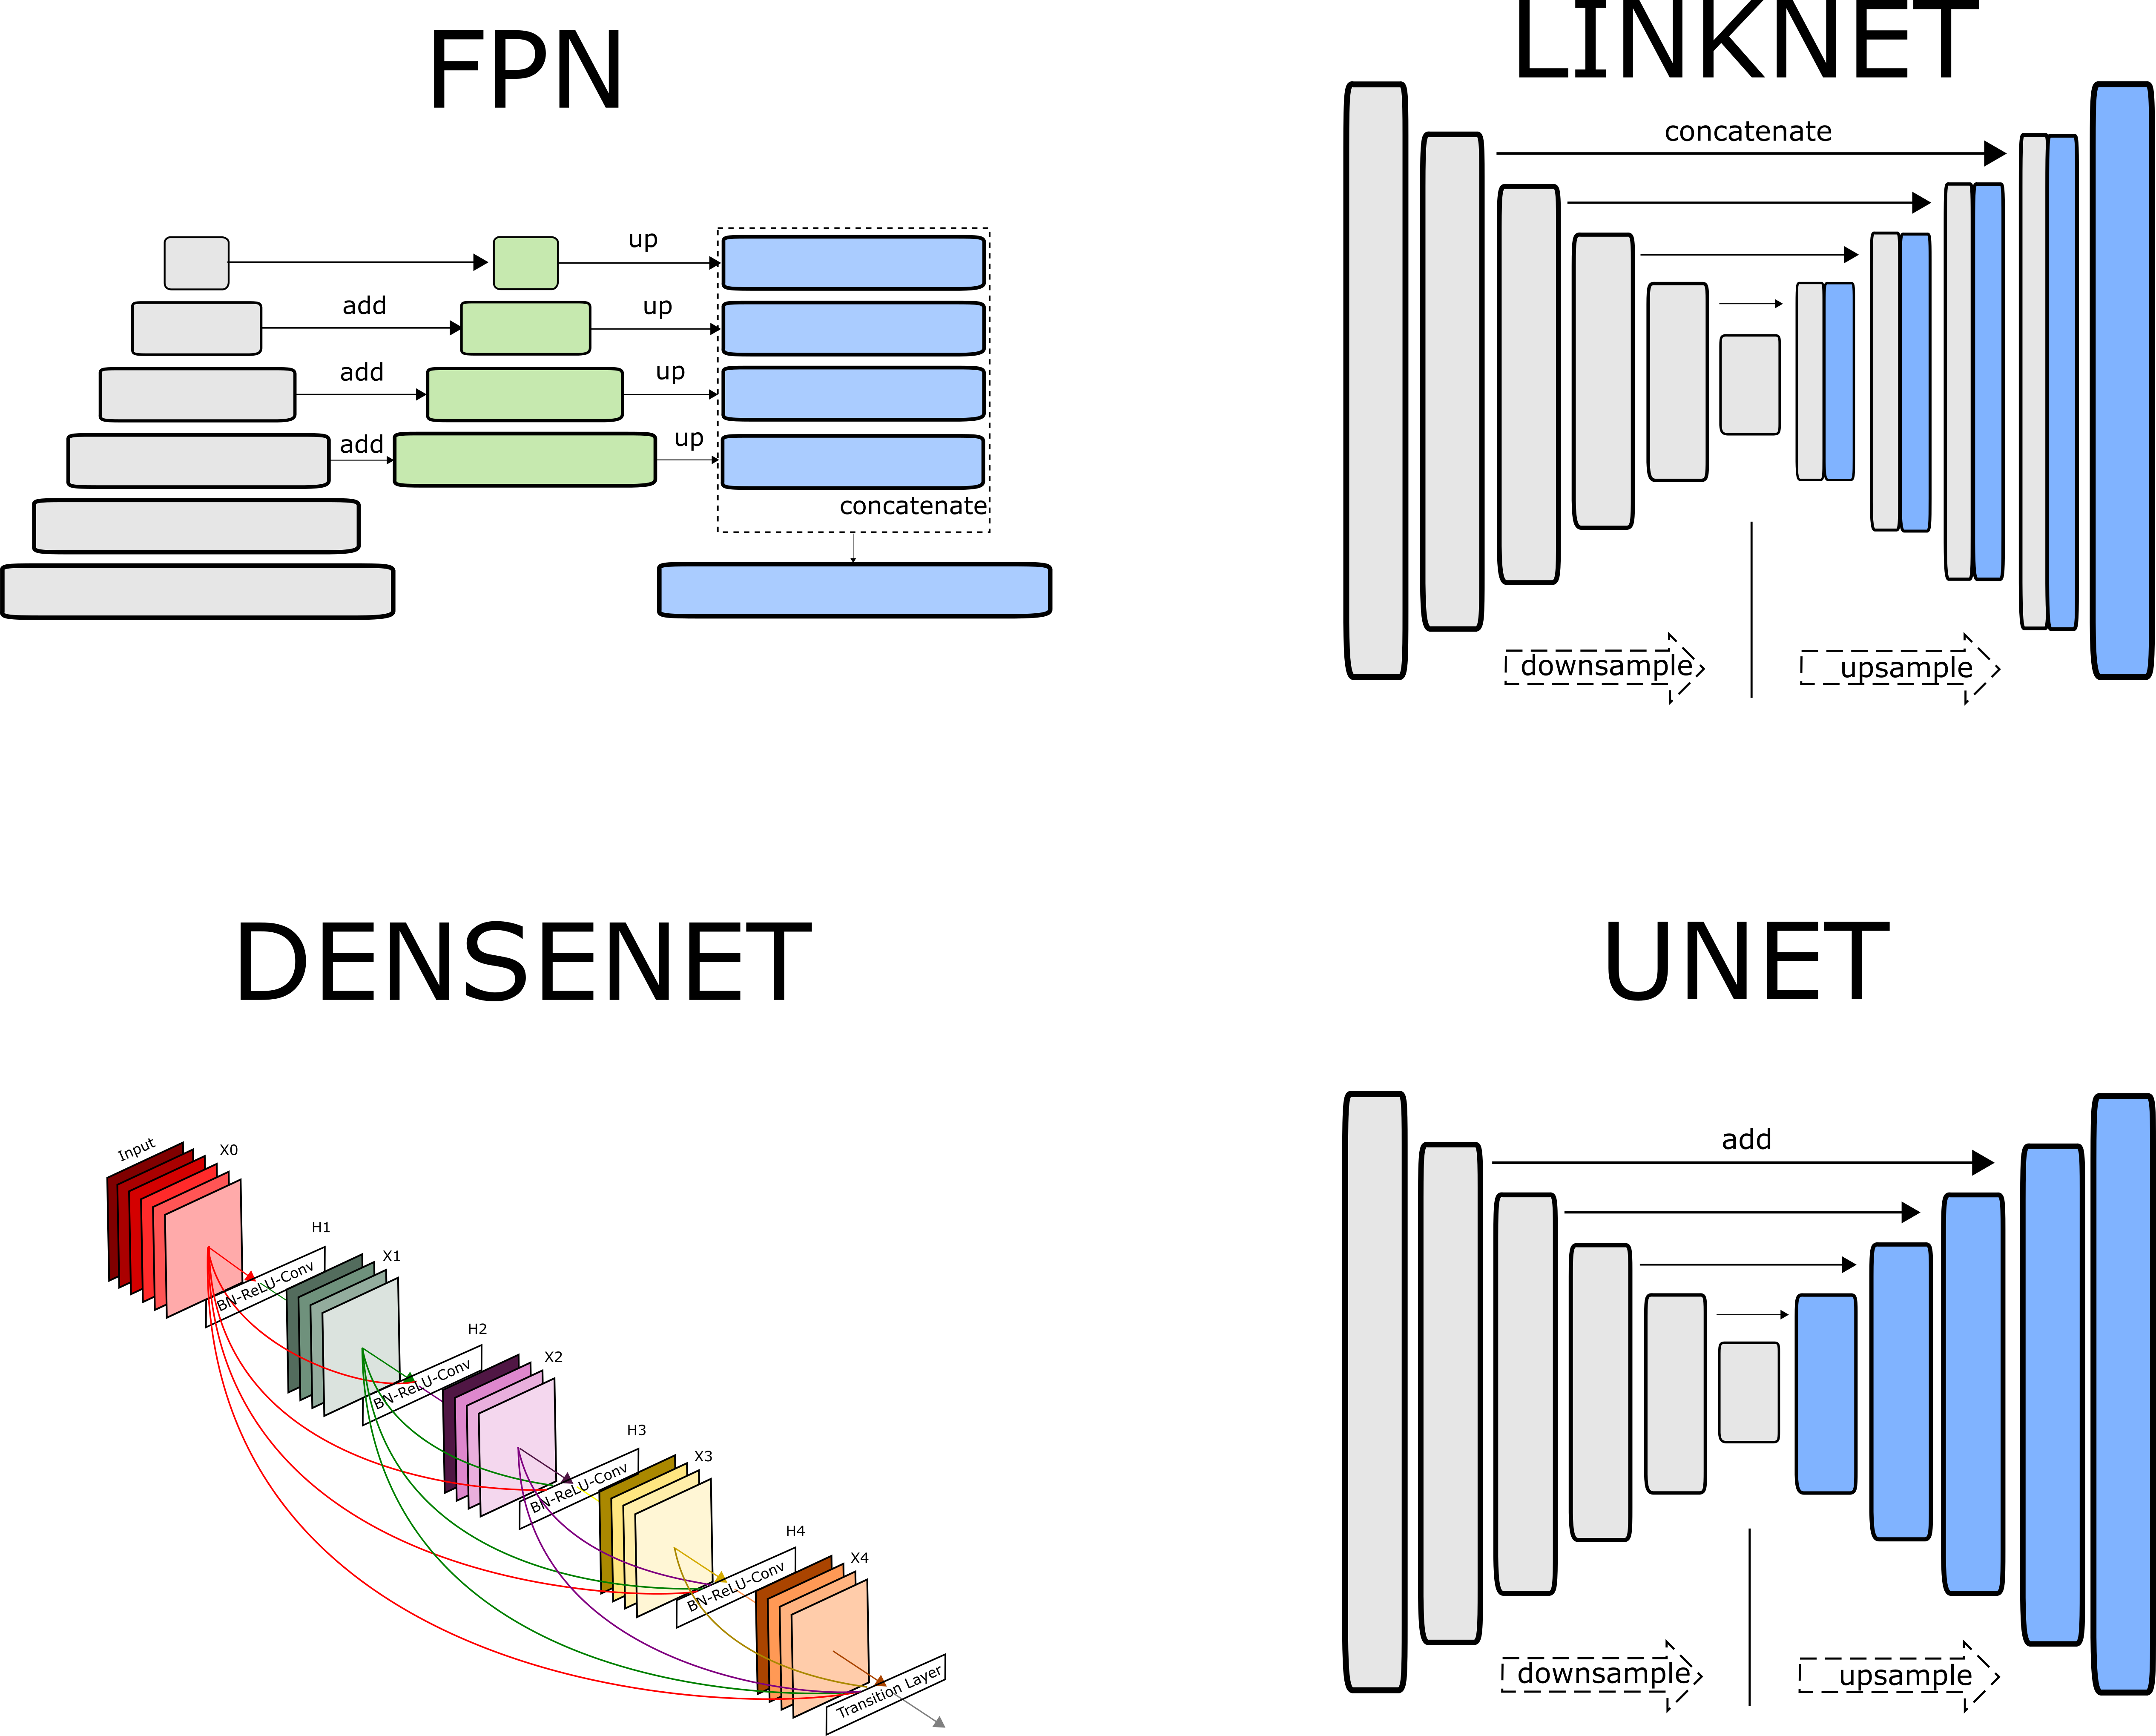
In this study, the focus was not to propose a new CNN architecture, but to explore the capabilities of the existing CNN models in the Segmentation Models python library (Yakubovskiy, 2019). The CNNs in these library are built explicitly for semantic segmentation tasks rather than classification, which means that the classification task aims to assign one label to each pixel in the images (Bai et al., 2022). U-Net (Ronneberger, Fischer, and Brox, 2015), FPN (Lin et al., 2017) and Linknet (Chaurasia and Culurciello, 2017) were the CNN models chosen for landslide detection in this project (Fig. 4).
2.3.1 Deep Learning Architectures for Image Segmentation
Image segmentation models are considered to be a multi-scale context problem, i.e., to predict the class of a single pixel they use contextual information, so the areas around the pixel of interest help in its identification, based on some factors like the size and continuity of the element, and the amount of neighbouring segments of other classes (Hoeser and Kuenzer, 2020). Landslide detection studies benefit from contextual information since landslides, particurlaly shallow landslides, have a distinctive color and long, narrow shapes that distinguishes them from their surroundings, both in natural slopes and urban areas, which facilitates the identification through image segmentation (Ghorbanzadeh et al., 2019; Sameen and Pradhan, 2019; Prakash, Manconi, and Loew, 2020; Soares et al., 2022).
The Unet architecture was introduced by Ronneberger, Fischer, and Brox (2015), modifying and extending FCN (Fully Convolutional Network) by working with very few training images, with more accurate segmentation and preserving image localization. The main difference from traditional CNN lies in its architecture of the expanding path. Unet consists of two paths: a constructive path and an expansive path (Fig. 4). The constructive path follows the typical CNN architecture with convolution and pooling layers for downsampling. The expansive path consists of upsampling the feature map and replacing the fully connected layers.
Feature pyramids are a primary component in recognition systems for detecting objects at different scales. The Feature Pyramid Network (FPN) was introduced by Lin et al. (2017) as a feature pyramid with rich semantics at all levels, is built quickly from a single input image scale, and is a generic solution built inside a deep CNN. Their architecture combines low-resolution, semantically strong features, with high-resolution, semantically weak features, by a top-down pathway and lateral connections (Fig. 4). The pyramid’s construction involves two parts: a bottom-up pathway and a top-down pathway, and the lateral connections between them.
LinkNet is a neural network architecture proposed by Chaurasia and Culurciello (2017) designed specifically for semantic segmentation (Fig. 4). It comprises an encoder-decoder pair containing residual blocks and linking each encoder with a decoder to avoid losing spatial information. The input of each encoder layer is bypassed by the output of its corresponding decoder so that the decoder and the upsampling operations can use the spatial information. LinkNet results were more efficient compared to existing state-of-the-art segmentation networks that have an order of magnitude larger computational and memory requirements.
DenseNet (Huang et al., 2017) was used as a backbone for the pre-training step and it is available as standard backbone in the segmentation models python library (Yakubovskiy, 2019). It was proposed as a network with a different connectivity pattern that connects each layer to every other layer in a feed-forward fashion, namely Dense Convolutional Network (DenseNet) (Fig. 4). A remarkable difference between DenseNet and other networks, such as ResNet (He et al., 2016), is that it yields condensed models by feature reuse that are easy to train and more efficient. It also concatenates feature maps learned by different layers, which increases variation and efficiency. The DenseNet architecture comprises dense blocks and transition layers, with a convolution at the beginning and a softmax classifier at the end.
2.3.2 Proposed Deep Learning framework
This study proposes a new deep learning framework for semi-automatic relict landslide detection that uses transfer learning for accuracy improvement, and the results are compared to a standard CNN framework. The standard framework is usually performed in three steps: data processing, training, and validation, while the proposed framework has one more step, pre-training (Fig. 5).

-
1.
Data Processing
Two datasets were created in the data processing step, the Labeled dataset and the Cluster Dataset. The Labeled Dataset comprises images labeled in two classes, with or without landslide scars. It uses the CBERS4A 201/143 (path/row) image from August of 2020 as input with a dimension of 14210 x 14592 pixels which was clipped in tiles of 32x32 pixels. A zero-padding process was used to enable the creation of the tiles. Each tile received a label due the existence of landslides (label = 1) or not (label = 0) according to a landslide mask. The landslide mask was created by rasterizing a landslide vector composed by 384 landslides that were identified from Fúlfaro et al. (1976) inventory map and visual interpretation of current images. If a tile has at least 1 pixel in intersection with the landslide mask, it is labeled as landslide. The CBERS4A 201/143 image that encompasses the study area was split in train/test areas so that the landslide mask was split into a nearly 70/30 ratio, where 276 (70%) landslides belong to the train area and were used to create the labeled dataset (LD) and 108 (30%) belong to the test area and were used for evaluation of model’s accuracy (Fig. 6). The Labeled Dataset has a total of 202464 tiles of which only 422 tiles were labeled as landslides (Table 1).
The Cluster dataset (CD) used the k-means algorithm to cluster data by trying to automatically separate samples into k groups based on pixel color similarity which is expected to be able to segregate major land cover areas (Pedregosa et al., 2011). Images covering the full extension of the Serra do Mar mountain range were used in this step, almost encompassing the whole coast of São Paulo state. Five CBERS4A images were used as input (path/row): 200/142, 200/143, 201/142, 201/143 and 202/143. The images were clipped in tiles with 32 x 32 pixels, also using the zero-padding process for the borders of the images. Each tile receives a label with the predominant class according to the k-means clustering results. Since the number of clusters has to be specified for the k-means algorithm, the clustering was performed with values 2, 4, 6, 8, 10, and 12. To enhance the clustering process, pixels representing ocean and urban coastal areas were removed from input images, so the k-means algorithm used only highland and mountain features. Lastly, a class balancing process was performed with the tiles assigned to each cluster (Table 2).

Figure 6: A) CBERS-04A image 201/143 with the location of the test area. B) Image with ocean and urban areas clipped. C) Image with the test area clipped, used for the training process. D) Landslide scars in the train area and test area. E) Test area with landslide scars. -
2.
Augmentation
Usually, a massive amount of data is necessary for training a neural network such as CNN, which is not always available (Zhao et al., 2015). To overcome this lack of training samples, researchers can use data augmentation techniques to increase these numbers (Ronneberger, Fischer, and Brox, 2015). This study performed three types of data augmentation techniques: horizontal flip, vertical flip, and a combination of both (horizontal-vertical flip). To avoid unbalancing data, the augmentation was performed only for the positive class of the Labeled Dataset, i.e., tiles labeled as landslide. In total 390 tiles were labeled as landslides and were splitted in train/test sets in a ratio of 60/40, 241 labeled landslides in the train area and 149 labeled landslides in the test area (Table 1). The 241 labeled landslide in the train area were augmented by a factor of 30 (7230 tiles) and 50 (12050 tiles); these augmented datasets are referred to as LD30 and LD50, respectively, and were used in the training process for both the standard and the proposed CNN framework.
-
3.
Pre Training
Densenet121 was chosen for this pre-training step, and the input was the Cluster dataset, which was explicitly created to pre-train the backbone network. The pre-training step intends to initialize the CNN, i.e., enable the CNN to learn how to segregate objects through the image bands automatically. As spectral features of landslides are usually different from adjacent areas, the pre-training step may help to identify these areas. The weights computed in this process will be used for transfer learning, i.e., fine-tuning the training process of the CNNs. Transfer learning is usually used when there is a lack of training dataset which is case with labeled landslide data for the study area (Liu et al., 2018).
Labeled Dataset Augmentation Negative Class Positive class 202,042 tiles 422 tiles LD30 - 12,660 tiles LD50 - 21,100 tiles Table 1: Details of Labeled Dataset. Cluster Dataset Classes /Clusters 2 4 6 8 10 12 0 497474 tiles 165743 99447 71004 55195 45147 1 497474 18084 5360 3713 3540 3064 2 - 206833 20703 20277 19473 17781 3 - 272312 259210 253449 251040 13156 4 - - 85145 35873 22875 255105 5 - - 126818 93978 39922 28676 6 - - - 29688 25174 49795 7 - - - 60050 58609 26133 8 - - - - 29999 42012 9 - - - - 46127 9913 10 - - - - - 19052 11 - - - - - 31932 Table 2: Detail of cluster dataset with the number of tiles for each class created. -
4.
Training
Three CNNs were used for landslide detection: FPN, Linknet, and Unet. These CNNs are available in the Segmentation Models python library based on Keras(Tensorflow) (Yakubovskiy, 2019) and are specific for semantic segmentation tasks. All three CNN models have a downsample and an upsample path and use the Densenet121 as a backbone. The weights from these CNNs are evaluated in the test area by validation indices and prediction of landslides. The standard framework used both LD30 and LD50 as input to train each CNN and compute the weights for later validation. A total of 6 combinations were made, and the results were used to predict landslides. In the proposed framework, the weights learned in the pre-training step were used to fine-tune the training process. The CNNs were trained for every cluster with LD30 and LD50 as input, resulting in 12 combinations for each CNN (FPN, Linknet, Unet), 36 in total, used for model evaluation. All CNN training process were made with a learning rate of 0.00001 and for 300 epochs.
-
5.
Validation/Accuracy Assessment
Precision and Recall were used to validate the models. These statistical methods are based on three kinds of classified pixels: True Positives (TP), False Positive (FP), and False Negative (FN) (Ghorbanzadeh et al., 2019). Precision (Eq. 1) is used to quantify the rate of positive samples (TP) among predicted positive samples (TP + FP). The higher the precision of the model, the better the probability of correctly classifying positive samples. In other words, precision determines how many of the classified areas are really landslides. Recall (Eq. 2) represents the ratio of correctly predicted landslides to the ground truth (Ji et al., 2020). It means that recall can determine how much of the landslide areas defined by visual interpretation were classified in the images (Ghorbanzadeh et al., 2019).
| (1) |
| (2) |
3 Results and Discussion
The results were evaluated by Precision and Recall validation indices and by landslide predictions that enable visual interpretation. All the combinations of CNNs and parameters were trained and validated in the train area, while the results were obtained from the test area. Table 3 show the values of precision and recall for every combination tested in the proposed framework. Table 4 show the values of precision and recall for the standard CNN framework.
Validation Indices
The results between the standard and the proposed CNN frameworks are similar, with a difference between the validation results generally around 5%. The combinations of parameters and clusters also had similar results. Recall achieved relevant outcomes, with values higher than 75% for every combination tested. U-Net neural network is commonly used for semantic segmentation of landslides in other studies with relevant outcomes (Prakash, Manconi, and Loew, 2020; Li et al., 2021; Soares et al., 2022), therefore, it was expected that U-Net combinations would produce the best results in this project, which did not necessarily happen. Although U-Net achieved the best recall and precision results for the standard framework, it was surpassed by FPN and Linknet in the proposed framework.
The best recall result for the standard framework was 79.52% (Unet with LD30), while for the proposed framework the best recall result was 81.09% (Linknet with 4 clusters and LD50). In contrast with recall results, precision values were unexpectedly low for all combinations usually between 10% and 20%. The higher values of precision were 15.83% for Unet with LD50 in the standard framework and 20.47% of FPN with 8 clusters and LD30 for the proposed framework. These low precision values may indicate that the models have a high false positive rate, i.e., non-landslide pixels classified as landslides (Eq. 1).
In the studies of semi-automatic landslide detection using CNN, the values of recall and precision are both commonly above 70% (Chen et al., 2018; Ding et al., 2016; Ghorbanzadeh et al., 2019; Ji et al., 2020; Li et al., 2021; Yu et al., 2021; Zhong, Hu, and Zhou, 2019). These high rates of recall and precision are probably related to the ease of identifying recently occurred landslides trough images collected right after the event when vegetation cover is removed and the soil is exposed. Nonetheless, maximizing both evaluation indices may be challenging as they are inversely correlated, i.e., increases in recall often come at the expense of decreases in precision.
These results (high recall/low precision) mean that the CNNs tested in this study identifieid, or predicted, more relict landslides than actually exist on the ground truth, which generated many false positives samples, thus decreasing precision. High recall/low precision models are considered less conservative, which means that for landslide detection, the model will try to identify as many landslides as possible at the expense of generating many false positive samples.
Although these results seem may flawed (inappropriate or unsatisfactory) at first, they are consistent with the primary objective of detecting relict landslides. Landslide detection studies are valuable in creating and updating inventory maps with the inclusion of new landslides after they occur. Thus, in areas with few landslide historical data or outdated inventory maps, it is a good sign that landslide detection methods are able to predict more landslides than it exist on ground truth. In other words, false positive samples may indicate new relict landslides identified in the study area that were previously undetected.
| Precision | Recall | ||||||
|---|---|---|---|---|---|---|---|
| Dataset | Clusters | FPN | Unet | Linknet | FPN | Unet | Linknet |
| LD30 | 2 | 0.1144 | 0.1270 | 0.1367 | 0.7618 | 0.7824 | 0.7749 |
| 4 | 0.1755 | 0.0537 | 0.1902 | 0.7669 | 0.7965 | 0.7828 | |
| 6 | 0.1425 | 0.1875 | 0.1779 | 0.7820 | 0.7914 | 0.7866 | |
| 8 | 0.2047 | 0.1644 | 0.0555 | 0.7710 | 0.7944 | 0.7795 | |
| 10 | 0.0687 | 0.1655 | 0.1732 | 0.7602 | 0.7956 | 0.8056 | |
| 12 | 0.1328 | 0.1676 | 0.1674 | 0.7696 | 0.7775 | 0.7815 | |
| LD50 | 2 | 0.0473 | 0.1431 | 0.1366 | 0.7581 | 0.7782 | 0.7828 |
| 4 | 0.0876 | 0.0621 | 0.1752 | 0.7788 | 0.7886 | 0.8109 | |
| 6 | 0.1542 | 0.1585 | 0.1546 | 0.7765 | 0.7798 | 0.7832 | |
| 8 | 0.1836 | 0.1428 | 0.0612 | 0.7750 | 0.7800 | 0.7996 | |
| 10 | 0.1786 | 0.0627 | 0.0471 | 0.7853 | 0.8095 | 0.7906 | |
| 12 | 0.1323 | 0.1723 | 0.1613 | 0.7692 | 0.7877 | 0.7970 | |
| Precision | Recall | |||||
|---|---|---|---|---|---|---|
| Dataset | FPN | Unet | Linknet | FPN | Unet | Linknet |
| LD30 | 0.1337 | 0.1405 | 0.1212 | 0.7845 | 0.7952 | 0.7774 |
| LD50 | 0.1264 | 0.1583 | 0.1240 | 0.7750 | 0.7925 | 0.7892 |
Predictions
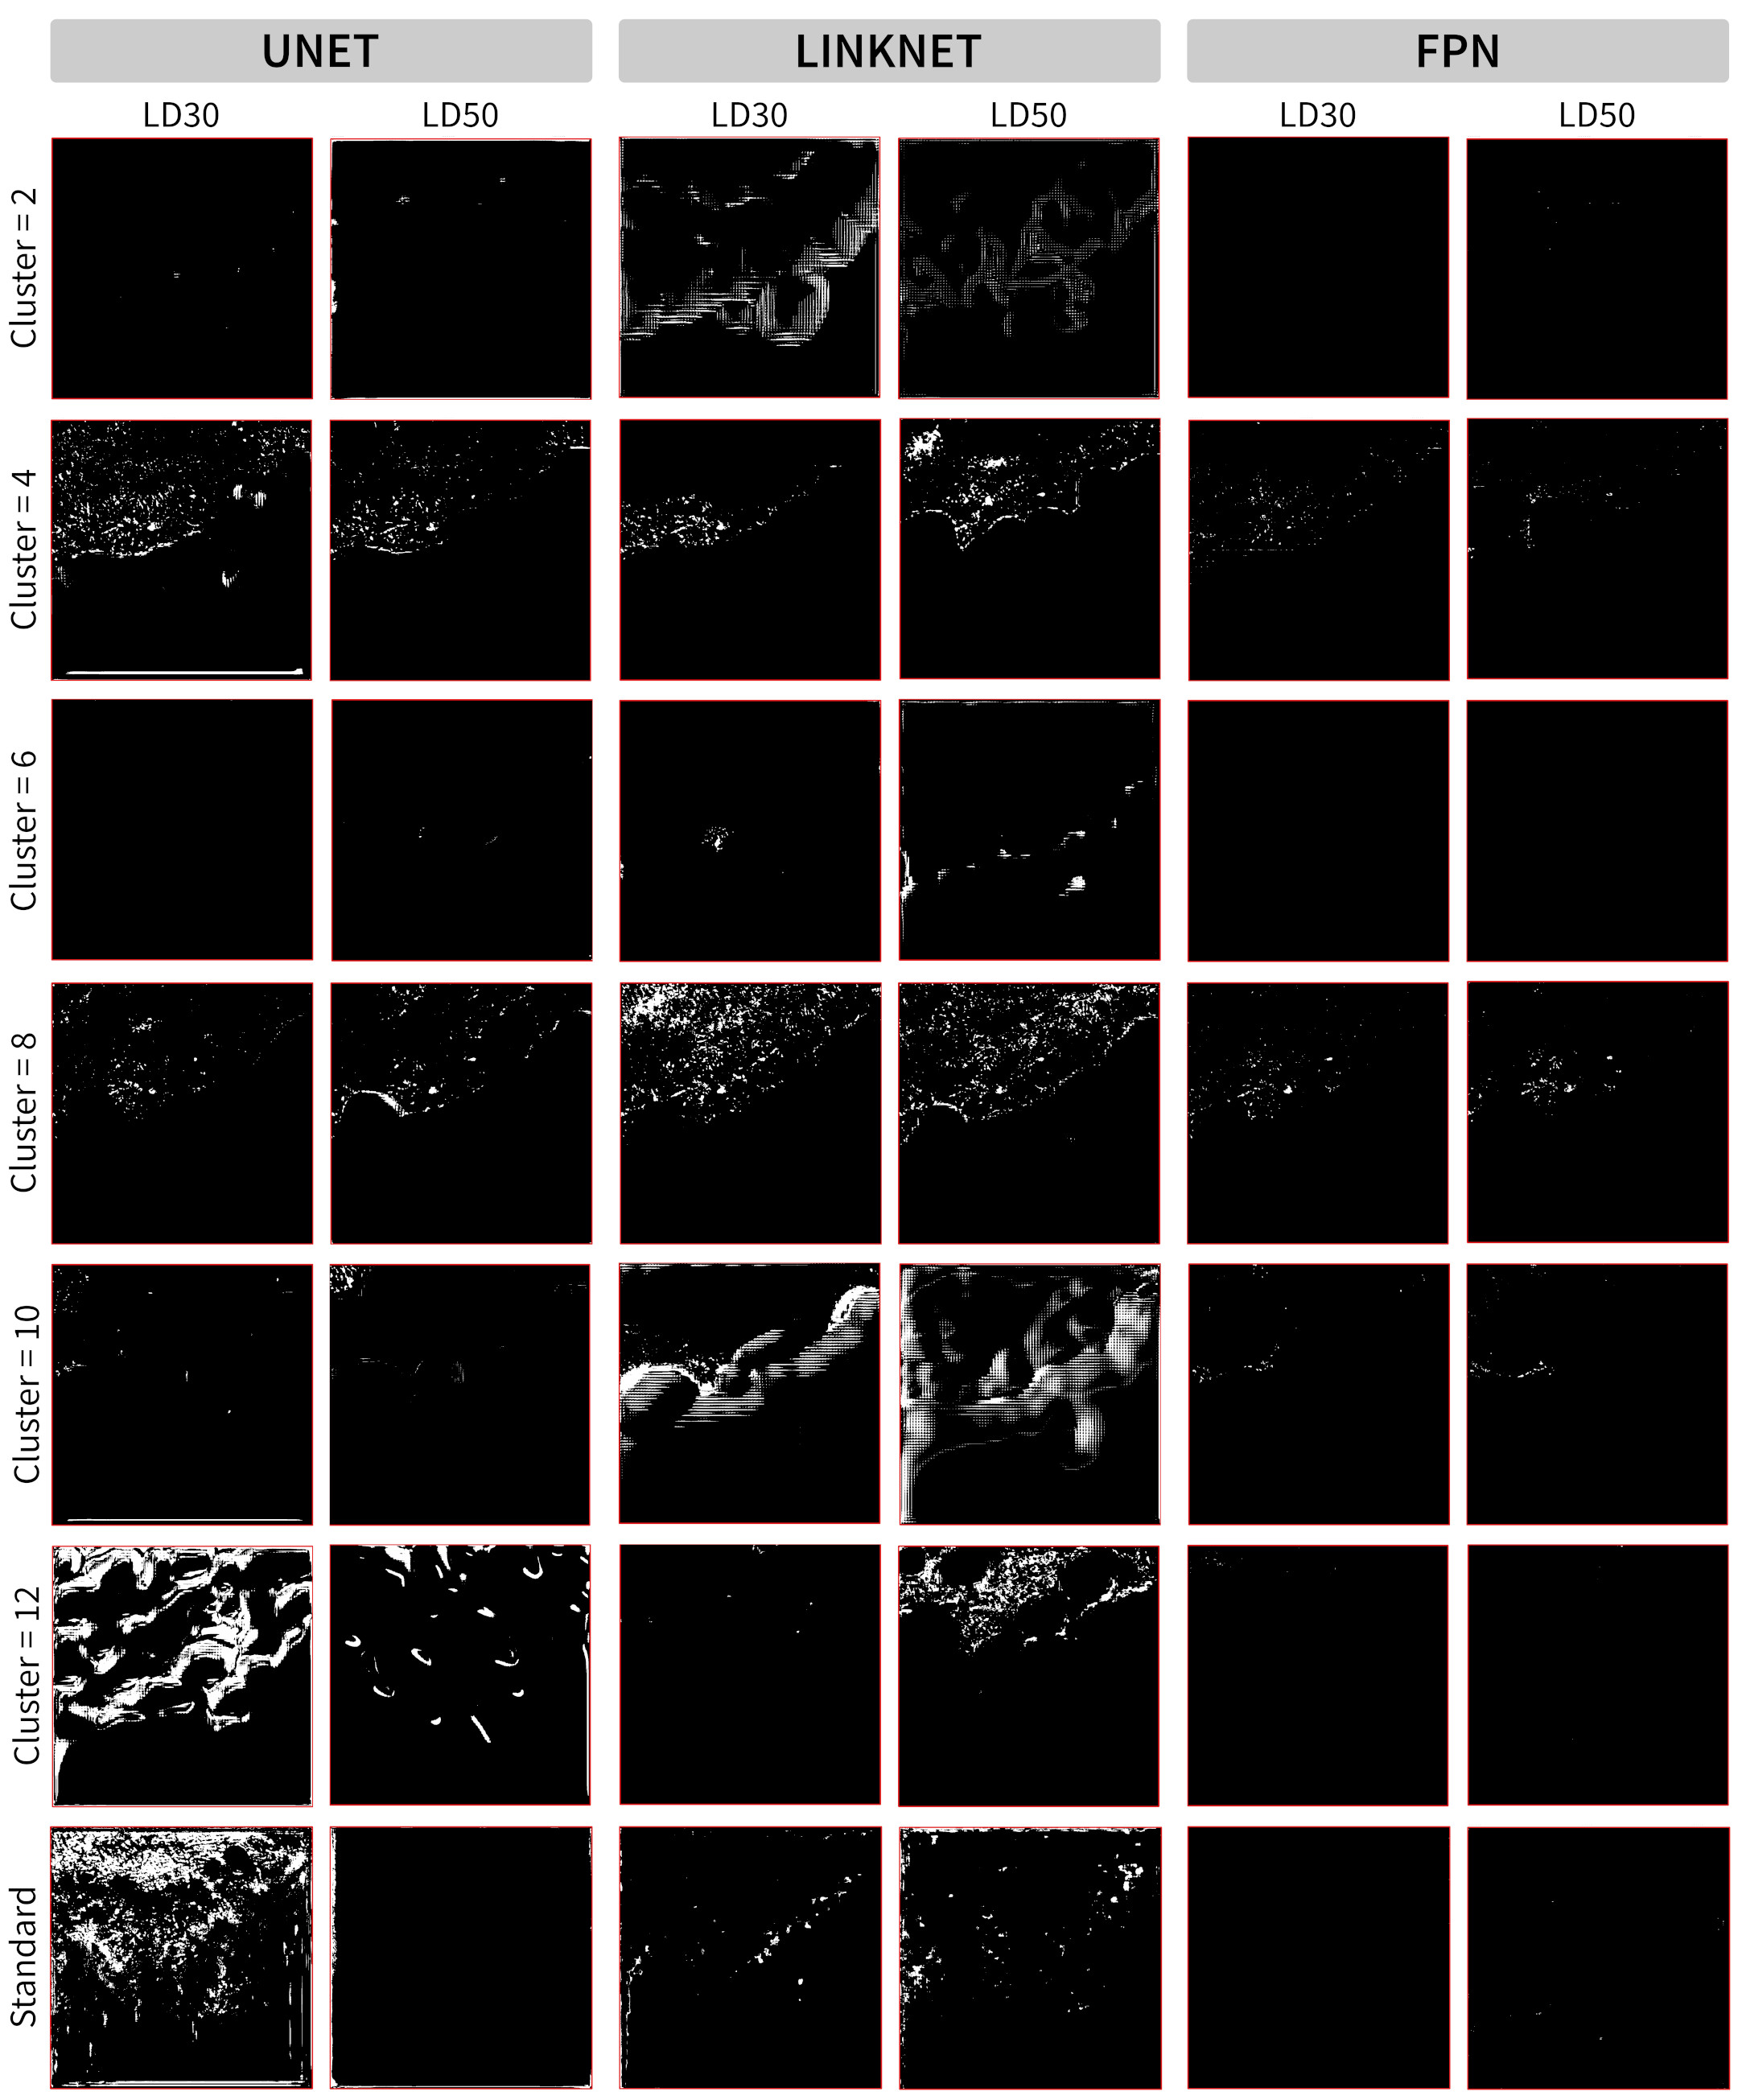
The landslides prediction maps enable visually evaluating the CNNs ability to detect landslides. All the predictions were performed with a threshold of 0.5, i.e., cell values above 0.5 are classified as landslide. Predictions were very heterogeneous across all tested combinations, with some models correctly detecting relict landslides, while predictions from other models were very noisy, with many errors and unable to detect any relict landslides. Predictions that correctly detected most relict landslides did so with errors and misclassifications, mostly false positive samples.
Although recall assessment showed high results for all the combinations from both frameworks, mainly above 75%, predictions showed that only 18 of 42 (36 + 6) combinations were able to detect relict landslides more or less accurately (Fig. 7). Most of the predictions did not detected any relict landslide or had a coarse aspect with many false positive samples.
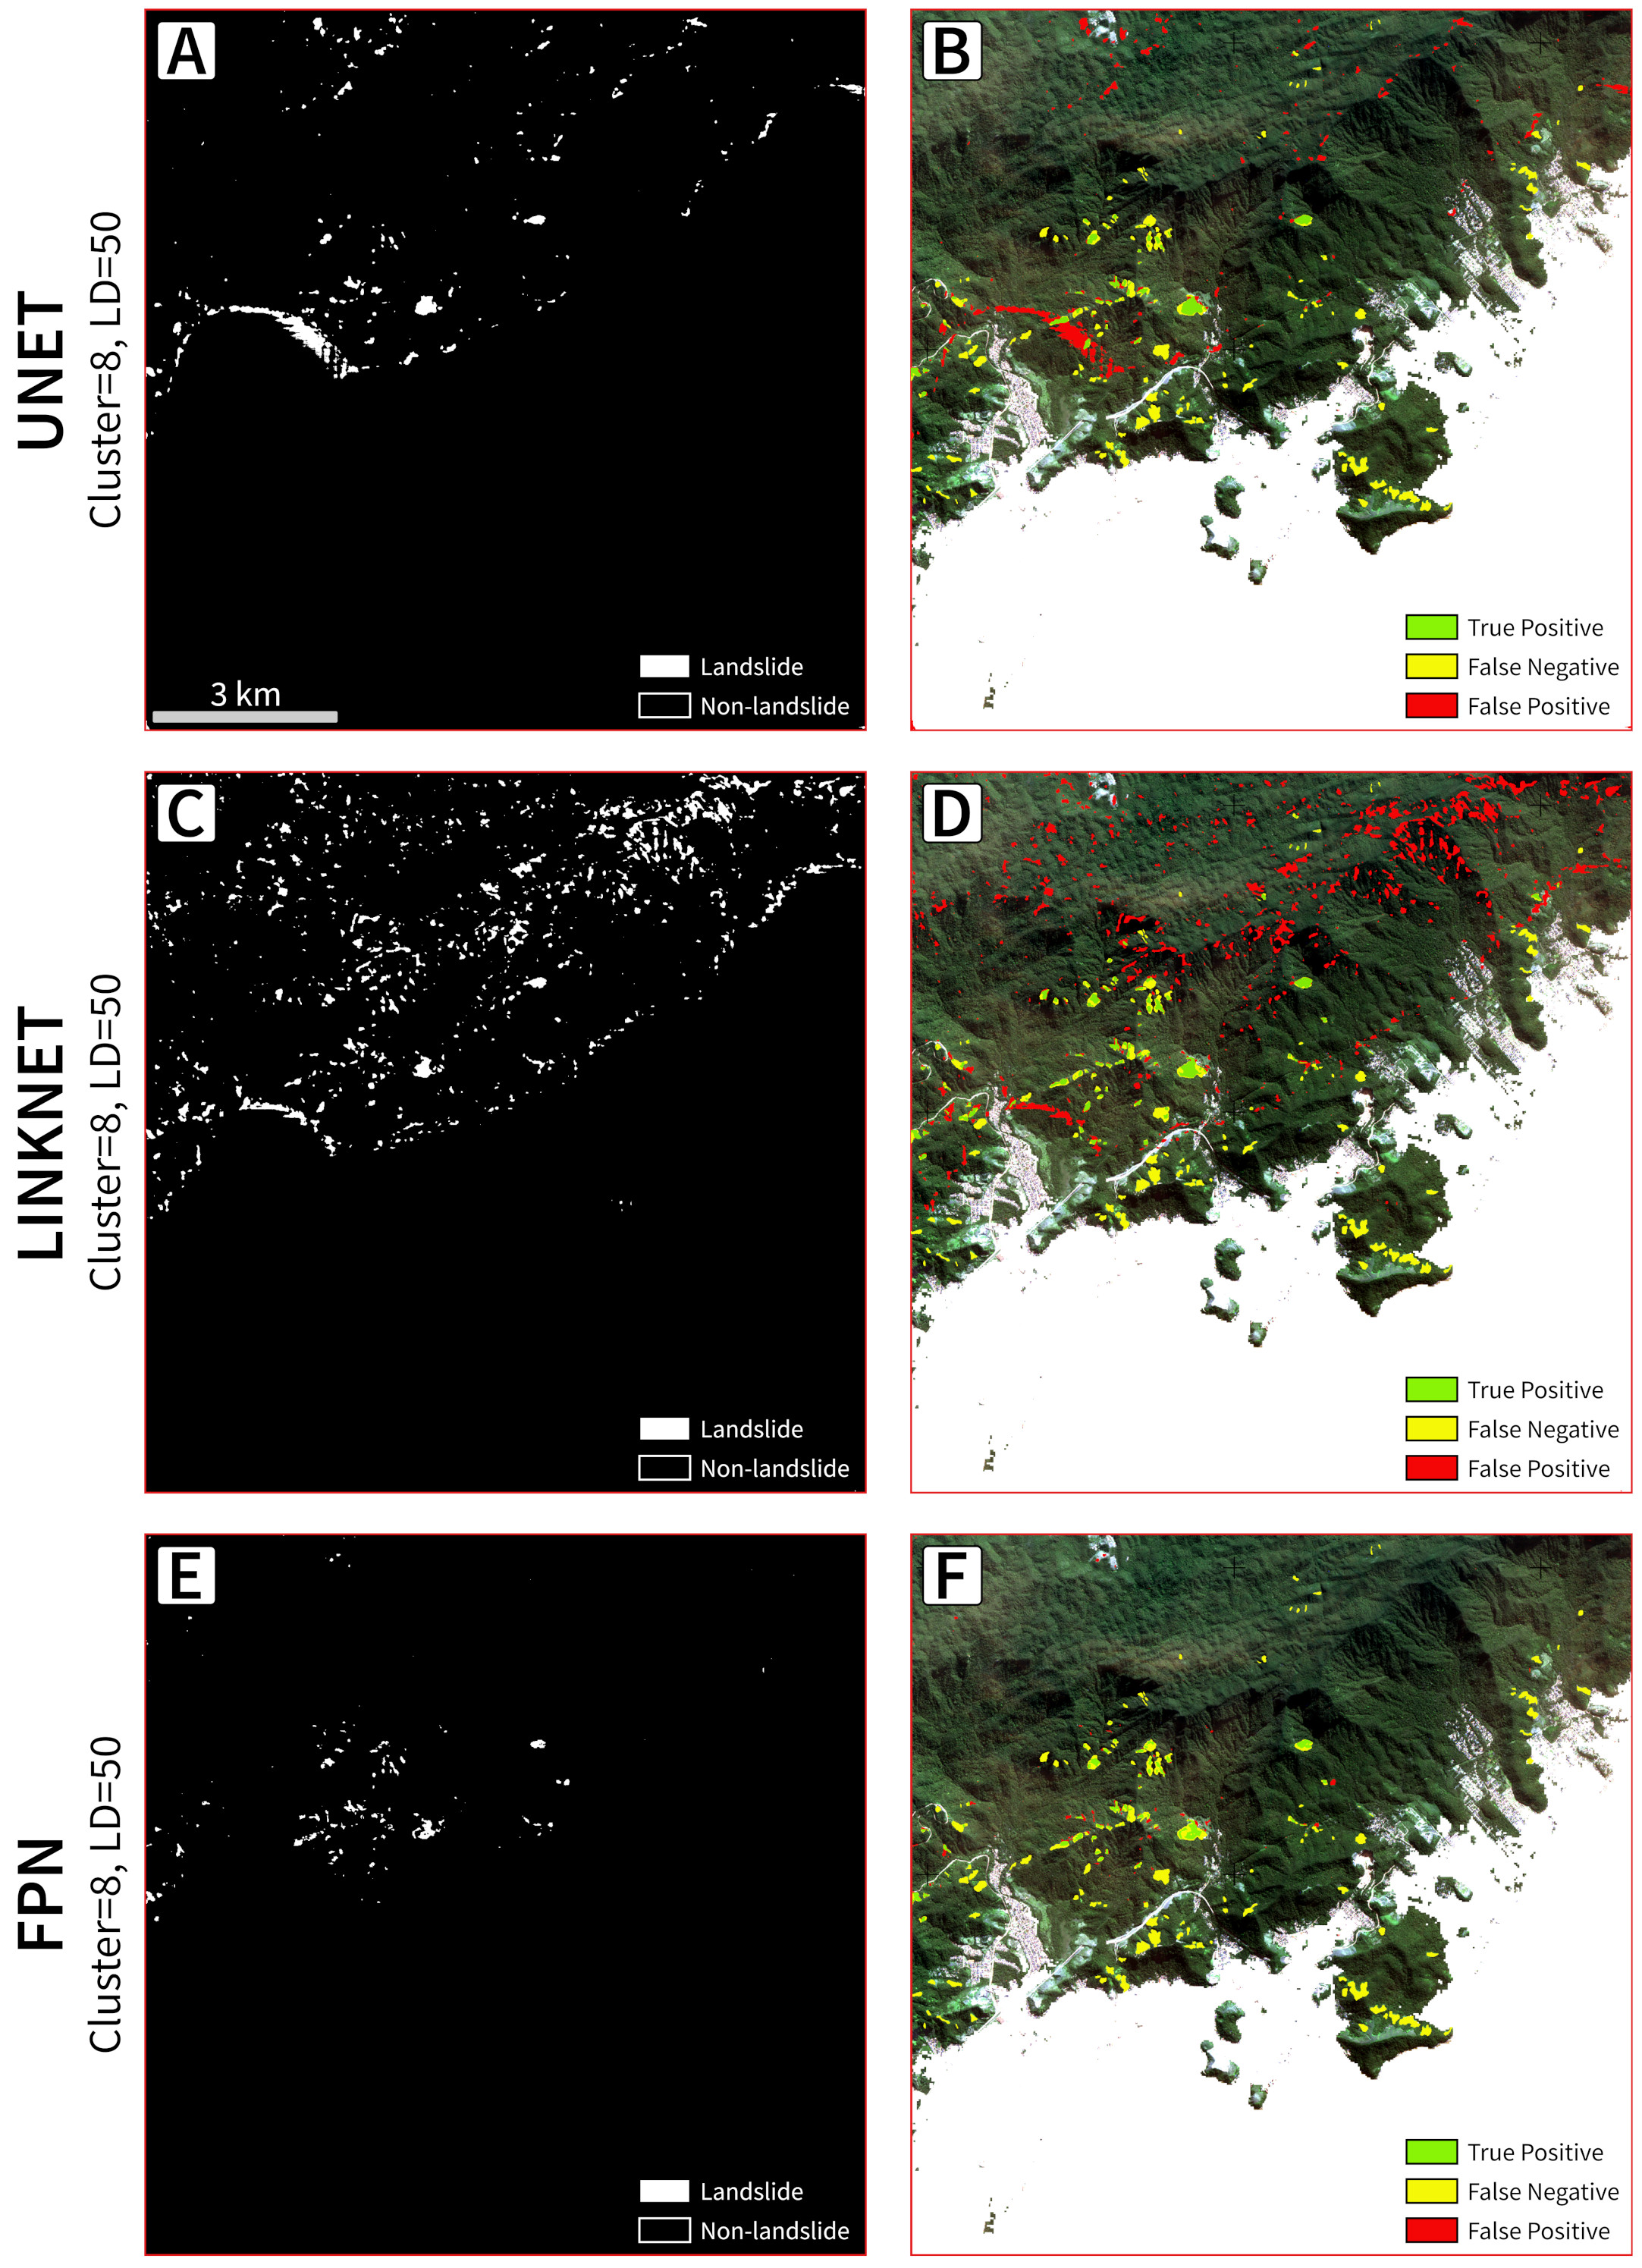
Predictions of the proposed framework were more acurrate than those of the standard framework. 15 of the 36 (41.7%) predictions of the proposed framework detected relict landslide in the test area, but always with the presence of false positive samples. Figure 8 shows predictions of the CNNs with 8 clusters and LD50, as well as TP, FP and FN results. The supplementary material presents all 15 predictions that correctly detected landslides with TP, FP and FN results.
In general, these predictions managed to delineate the relict landslides mainly located in the center-north portion of the test area. Predictions of Unet (6 clusters and LD50) and Linknet (6 clusters with LD30 and LD50) identified only the relict landslides in the center-south portion (Fig. 7).
It is not clear why this difference in classification per regions occurs. The southern portion of the study area represents mainly urban and ocean areas that were removed from the original image in the data processing step, and the voids were labeled as ’no data.’ The image tiles used as input for the CNN were generated from this clipped image. The tile size (32 x 32 pixels) and the tile cutting pattern may have affected the accuracy for relict landslide detection of the CNN. That may help explain why the landslides in the southern portion were more complex to detect than those from the center-north portion of the study area.
For the standard framework 3 of 6 (50%) predictions (Linknet with LD30/LD50 and Unet with LD30) correctly detected relict landslides, but the latter also showed a high number of false positives and had a noisy representation similar to salt-and-pepper effect. However, despite being less accurate than the proposed framework predictions, these predictions were able to detect relict landslides in the whole study area.
Notably, there is a clear difference in the number of false positive samples in the landslide predictions of each method. FPN predictions are those with fewer false positive samples, which means that FPN is the most conservative method, but also with fewer true positive samples. The best FPN predictions are those with 8 clusters and both LD30 and LD50, that can detect almost all the major relict landslides in the area with very few errors.
U-Net and Linknet predictions are less conservative models, i.e., predicted many false positive samples, in an attempt to detect more relict landslide than it exist on the ground truth. The problem in the less conservative models is that they are subject to many errors, some of those very rude. There are some false positive samples in standardized, rectilinear or symmetrical positions, which are very strange and unatural positions. The combinations of (CNN/Cluster/LD) Linknet/4/LD50, Linknet/8/LD50, Linknet/Standard/LD30, Linknet/Standard/LD50, U-Net/4/LD30, U-Net/4/LD50 and U-Net/8/LD50 depict these kind of errors. But the most outstanding errors occur with the U-Net/Standard/LD30 predictions which are smeared with false positive samples across the entire test area.
Correlation
Although 42 combinations of parameters were performed it was not possible to determine an optimal combination for relict landslide detection. Type of CNN (U-Net, FPN, Linknet), augmented dataset (LD30 or LD50) and number of clusters (2, 4, 6, 8, 10, 12) did not show a consistent and significant correlation with the results. Recall and precision results were very similar for all 42 combinations whereas the predictions were very divergent. The combinations that detected relict landslides in the predictions were not necessarily the same combinations that achieved the best results of recall and precision (Table 5).
The combinations of FPN and Linknet parameters that achieved better recall and precision results were able to detect relict landslides in the predicitons, unlike what happens with the combinations of U-Net parameters where the predictions that detected relict landslide are not the same than those with better recall and precision results. Thus, it demonstrates that one cannot rely only on validation results to evaluate the CNNs, but that visual inspection of landslide predictions is also of paramount importance.
| Type of CNN | Clusters | Dataset | Recall | Precision |
|---|---|---|---|---|
| FPN | 4 | LD30 | 0.7669 | 0.1755 |
| LD50 | 0.7788 | 0.0876 | ||
| 8 | LD30 | 0.7710 | 0.2047 | |
| LD50 | 0.7750 | 0.1836 | ||
| 10 | LD30 | 0.7602 | 0.0687 | |
| LD50 | 0.7853 | 0.1786 | ||
| Linknet | 4 | LD30 | 0.7828 | 0.1902 |
| LD50 | 0.8109 | 0.1752 | ||
| 6 | LD30 | 0.7866 | 0.1779 | |
| 8 | LD30 | 0.7795 | 0.0555 | |
| LD50 | 0.7996 | 0.0612 | ||
| Standard | LD30 | 0.7774 | 0.1212 | |
| LD50 | 0.7892 | 0.1240 | ||
| U-Net | 4 | LD30 | 0.7965 | 0.0537 |
| LD50 | 0.7886 | 0.0621 | ||
| 8 | LD30 | 0.7944 | 0.1644 | |
| LD50 | 0.7800 | 0.1428 | ||
| Standard | LD30 | 0.7952 | 0.1405 |
3.1 Discussion
This study found significant limitations in the semi-automatic detection of relict landslides in vegetation-covered areas using multispectral images as input to the CNN semantic segmentation process. The lack of labeled data for training the CNNs and the spectral similarities of the land cover units are probably the main reasons that prevented the CNNs to achieve more accurate results.
The efficiency of the CNN classification ability relies mainly on the amount of labeled data used as input in the training process (Ronneberger, Fischer, and Brox, 2015). Usually, labeled landslide data is directly obtained from inventory maps that shows all landslides that have occurred over a period of time, however the inventory map of the study area is outdated and incomplete. It was fisrt created in the late 1970s to map a major landslide event that occurred in 1967 (Fúlfaro et al., 1976), and there have been no relevant updates since (Correa et al., 2017). Thus, labeled landslide data is sparse for the study area which made it necessary to perform data augmentation to enable CNN training even if augmentation may skew the data and decrease CNN’s accuracy.
The semi-automatic detection of relict landslides was only possible in this project due to the presence of Gleichenella sp. ferns that cover degraded areas, prevent forest restoration, and preserve the boundaries of landslides (Section 2.1.1). As shown in Fig. 3, the relict landslides can be distinguished from surroundings by the light green color of Gleichenella sp. while native vegetation has a dark green color in general. However, there are spectral similarities between Gleichenella sp. ferns and other land cover features such as pasture, agricultural fields, or deforested areas. Thus, the spectral characteristics are not enough to enable accurate detection of relict landslides and the occurrence of misclassification is somewhat expected. In areas covered by dense vegetation, such as the Atlantic rainforest, landslide detection is usually performed using multispectral images acquired soon after the event. In those images, landslides are easily recognizable due to the removal of material and soil exposure (Guzzetti et al., 1999; Du and Teng, 2007; Booth, Roering, and Perron, 2009; Burns et al., 2010; Sameen and Pradhan, 2019). In multispectral images, the soil has a brown-orange color that contrasts with the surroundings’ green color of vegetation cover, making identification easier for the CNNs, but even in these cases errors and misclassifications are common (Soares et al., 2022).
These findings are essential to demonstrate that the accuracy of CNNs for landslide detection is closely related to the technical specificities of input data, availability of labeled landslide data and the study area characteristics, instead of the CNN’s semantic segmentation process itself. For the best of the authors’ knowledge this is the first project that uses CBERS4A images for landslide detection. The mid to high spatial resolution (8 m) and 4 spectral bands (R, G, B and NIR) were insufficient to accurately differentiate relict landslides from surroundings. Despite the adequate results of recall for all combinations ( 75%) and that 18 of 42 predictions correctly identified relict landslides, the majority of the results were inaccurate.
Also, a new CNN framework was proposed in an attempt to enhance landslide detection accuracy. The results demonstrate that the predictions of the proposed framework are better than those of the standard framework, although the values of precision and recall were quite similar. The k-means clustering process used to create the cluster dataset for the pre-training step computed weights to fine-tune the CNN training process, enhancing its predictions ability. Another finding is that it was not possible to address an optimal correlation of parameters that maximizes the accuracy of landslide detection (Section 3).
Most landslide detection studies are in areas partially covered with vegetation and focus on detecting recent landslides using post-event multispectral images when the landslides are clearly visible in the landscape (Chen et al., 2018; Ghorbanzadeh et al., 2019; Ji et al., 2020; Li et al., 2021). Few studies occur in areas covered with rainforest vegetation (Sameen and Pradhan, 2019; Soares et al., 2022) or for detecting relict landslides (Wang et al., 2020). Also, many studies use a combination of topographic and spectral information as input for the CNNs, which achieved worse results than using only spectral bands as input (Ghorbanzadeh et al., 2019; Ji et al., 2020; Sameen and Pradhan, 2019; Wang et al., 2020; Soares et al., 2022).
Thus, there is a lack of investigation in areas of tropical environments where landslides are common, and the monitoring is impaired by vegetation growth. The present study findings demonstrated the complexity of performing semi-automatic detection of relict landslides in rainforest areas using only multispectral imagery and highlighted the importance of the input data specifications for the CNN models. It also showed the relevance of a continuous update of inventory maps that increase labeled landslide data which may improve CNN landslide detection accuracy.
This study has several specificities that prevent directly comparing the results with other works. However, many studies of landslide detection using CNNs also showed that both the input data and the study area are directly related to model accuracy (Chen et al., 2018; Ghorbanzadeh et al., 2019; Wang et al., 2020; Yu et al., 2021; Soares et al., 2022). The CBERS4A multispectral images are the newer and best free data available for the mapping and monitoring of the brazilian territory. Despite the great advance promoted in the area of remote sensing for Brazil, the CBERS4A images were inappropriate for the detection of relict landslides in the specific conditions of this project. Nonetheless, they may be very useful and yield better results if used for recent landslide detection with images taken soon after the events.
Although the results were generally inaccurate and the limitations of using multispectral images for relict landslide detection were exposed, the proposed framework had interesting results mainly from landslide predictions that outperformed the standard framework results. Even with all the limitations addressed previously, the CNN proposed framework could correctly predict relict landslides more or less accurately in almost half of the combinations (41.7%) and achieved recall values higher than 75% for every combination. The low precision values ( 20%) are related to the high rate of false positive samples predicted by the CNNs, but this is not necessarily inappropriate since it is suitable for relict landslide detection studies to predict more landslides than occur in the ground truth (Section 3).
4 Conclusion
This work proposed a new CNN framework for semi-automatic relict landslide detection using CBERS4A multispectral imagery, and the results were compared with a standard CNN framework. The proposed framework is an attempt to improve CNN image segmentation ability and consenquently its accuracy by using transfer learning. It is composed by a pre-training step that uses a dataset generated by a k-means algorithm clustering process as input. The weights computed in the pre-training step are later used to fine-tune the CNN training process. Two augmentation factors of 30 and 50 were used to increase the dataset since labeled landslide data are sparse for the study area, and three CNNs (U-Net, Linknet and FPN) were used for image segmentation. Six combinations of CNN and parameters were generated for the standard framework and 36 combinations for the proposed framework.
The validation indices showed that the results of recall were 75% for every combination and the precision results were generally between 10% and 20%. For the standard framework the higher recall value was 79.53% (Unet/LD30) and the higher precision was 15.83% (Unet/LD50) while for the proposed framework the higher values were 81.09% (Linknet/4/LD50) for recall and 20.47% (FPN/8/LD30) for precision.
Predictions of the landslides for every combination tested were performed in a test area to enhance the evaluation process by visual interpretation of the relict landslides. 18 of 42 total combinations were able to correctly identify relict landslide more or less accurately. Predictions from the proposed framework were more accurate but they still showed many misclassifications mainly because of the amount of false positive samples. FPN was the more conservative model with less FP samples while U-Net and Linknet were less conservative and predicted more FP samples. In landslide detection studies, less conservative predictions models are adequate, since it is expected to detect more landslides than occur in ground truth and, thus, allow the detection of new landslides.
Therefore, despite the recall and precision results were very similar for both frameworks, the predictions of the proposed framework were more accurate for the detection of relict landslides in the study area. Also, the results of validation indices and landslide predictions demonstrate that there is not an optimal correlation of parameters (type of CNN, number of clusters, augmentation factor), which increases the difficulties for the detection of relict landslides since the higher recall/precision values are not necessarily the most accurate in predicting relict landslides.
Further investigation is needed to improve the proposed framework’s accuracy, and the authors expect better results in areas with more visible landslides or using this framework for the detection of recent landslides. To improve detection of relict landslides, it is expected that using high to very high spatial resolution multispectral images, or even hyperspectral images, may overcome the limitations found in this study. Also, it is worthy testing if using DTMs from VHR topographic data as a single band, or as an additional band to RGB input data, in the CNN training process could enhance the accuracy of the models for relict landslide detection since DTMs do not contain the vegetation cover.
5 Acknowledgments
The authors acknowledge the support provided by the Institute of Energy and Environment, the Institute of Geosciences and the Graduate Program in Mineral Resources and Hydrogeology (PPG-RMH). Acknowledgements are extended to the Guest Editors, the Editor-in-Chief and the anonymous reviewers for their criticism and suggestions, which have helped to improve this paper.
6 Disclosure Statement
The authors report there are no competing interests to declare.
7 Funding details
This study was supported by the Sao Paulo Research Foundation (FAPESP) under grants #2016/06628-0, #2019/26568-0 and by Brazil’s National Council of Scientific and Technological Development, CNPq grant #311209/2021-1 to C.H.G. This study was financed in part by CAPES Brasil - Finance Code 001.
8 Supplementary Data
The supplementary material presents all 15 predictions that correctly detected landslides with TP, FP and FN results.
9 Data Availability Statement
Data Availability Statement: The code used in this research is available at the following link: https://github.com/SPAMLab/data_sharing/tree/main/Relict_landslides_CNN_kmeans (accessed on 15 December 2022).
10 ORCID
Guilherme Pereira Bento Garcia https://orcid.org/0000-0003-1209-7842
Carlhos Henrique Grohmann de Carvalho https://orcid.org/0000-0001-5073-5572
Lucas Pedrosa Soares https://orcid.org/0000-0002-6980-597X
Mateus Espadoto https://orcid.org/0000-0002-1922-4309
References
- Almeida (1964) Almeida, F. F. M. 1964. “Fundamentos geológicos do relevo paulista.” Boletim do IGG 41: 169–263.
- Ardizzone et al. (2007) Ardizzone, F, M Cardinali, M Galli, F Guzzetti, and P Reichenbach. 2007. “Identification and mapping of recent rainfall-induced landslides using elevation data collected by airborne Lidar.” Natural Hazards and Earth System Science 7 (6): 637–650.
- Audebert, Le Saux, and Lefèvre (2016) Audebert, Nicolas, Bertrand Le Saux, and Sébastien Lefèvre. 2016. “How useful is region-based classification of remote sensing images in a deep learning framework?” International Geoscience and Remote Sensing Symposium (IGARSS) 2016-November: 5091–5094.
- Augusto Filho (1992) Augusto Filho, O. 1992. “Caracterização geológico-geotécnica voltada à estabilização de encostas: uma proposta metodológica.” In conferência brasileira sobre estabilidade de encostas, Vol. 1, 721–733.
- Bai et al. (2022) Bai, Yang, Xiyan Sun, Yuanfa Ji, Jianhua Huang, Wentao Fu, and Huien Shi. 2022. “Bibliometric and visualized analysis of deep learning in remote sensing.” International Journal of Remote Sensing 43: 5534–5571.
- Baldo et al. (2009) Baldo, Marco, Claudio Bicocchi, Ugo Chiocchini, Daniele Giordan, and Giorgio Lollino. 2009. “LIDAR monitoring of mass wasting processes: The Radicofani landslide, Province of Siena, Central Italy.” Geomorphology 105 (3-4): 193–201. http://dx.doi.org/10.1016/j.geomorph.2008.09.015.
- Booth, Roering, and Perron (2009) Booth, Adam M., Josh J. Roering, and J. Taylor Perron. 2009. “Automated landslide mapping using spectral analysis and high-resolution topographic data: Puget Sound lowlands, Washington, and Portland Hills, Oregon.” Geomorphology 109 (3-4): 132–147. http://dx.doi.org/10.1016/j.geomorph.2009.02.027.
- Burns et al. (2010) Burns, William J., Jeffrey A. Coe, Basak Sener Kaya, and Lina Ma. 2010. “Analysis of elevation changes detected from multi-temporal LiDAR surveys in forested landslide terrain in western Oregon.” Environmental and Engineering Geoscience 16 (4): 315–341.
- Burns and Madin (2009) Burns, William J, and Ian P Madin. 2009. “Protocol for Inventory Mapping of Landslide Deposits from Light Detection and Ranging (lidar) Imagery.” 1–36.
- Castelluccio et al. (2015) Castelluccio, Marco, Giovanni Poggi, Carlo Sansone, and Luisa Verdoliva. 2015. “Land Use Classification in Remote Sensing Images by Convolutional Neural Networks.” 1–11. http://arxiv.org/abs/1508.00092.
- Chaurasia and Culurciello (2017) Chaurasia, Abhishek, and Eugenio Culurciello. 2017. “LinkNet: Exploiting encoder representations for efficient semantic segmentation.” In IEEE Visual Communications and Image Processing (VCIP), 4.
- Chen et al. (2013) Chen, Weitao, Xianju Li, Yanxin Wang, and Shengwei Liu. 2013. “Landslide susceptibility mapping using LiDAR and DMC data: A case study in the Three Gorges area, China.” Environmental Earth Sciences 70 (2): 673–685.
- Chen et al. (2018) Chen, Zhong, Yifei Zhang, Chao Ouyang, Feng Zhang, and Jei Ma. 2018. “Automated landslides detection for mountain cities using multi-temporal remote sensing imagery.” Sensors 18 (821): 18.
- Cheng, Han, and Lu (2017) Cheng, Gong, Junwei Han, and Xiaoqiang Lu. 2017. “Remote sensing image scene classification: Benchmark and state of the art.” arXiv 105 (10).
- Cheng et al. (2018) Cheng, Gong, Ceyuan Yang, Xiwen Yao, Lei Guo, and Junwei Han. 2018. “When Deep Learning Meets Metric Learning: Remote Sensing Image Scene Classification via Learning Discriminative CNNs.” IEEE Transactions on Geoscience and Remote Sensing 56 (5): 2811–2821.
- Conti and Furlan (1996) Conti, J. B., and Sueli Angelo Furlan. 1996. Geoecologia: o clima, os solos e a biota. EDUSP.
- Correa et al. (2017) Correa, Claudia Vanessa dos Santos, Fabio Augusto Gomes Vieira Reis, Lucilia Carmo Giordano, Camila Jardinetti Chaves, Beatriz Marquez Gabelini, and Rodrigo Irineu Cerri. 2017. “Movimentos de massa na região de Caraguatatuba e São Sebastião (SP) entre 1967 e 2011: utilização de cicatrizes de escorregamento como subsídio a estudos de retro-análise.” In XVII Simpósio Brasileiro de Geografia Física Aplicada/ I Congresso Nacional de Geografia Física, Campinas, São Paulo, 4162–4173.
- Devoto et al. (2020) Devoto, Stefano, Vanja Macovaz, Matteo Mantovani, Mauro Soldati, and Stefano Furlani. 2020. “Advantages of using UAV digital photogrammetry in the study of slow-moving coastal landslides.” Remote Sensing 12 (21): 3566–3594.
- Dewitte and Demoulin (2005) Dewitte, O., and A. Demoulin. 2005. “Morphometry and kinematics of landslides inferred from precise DTMs in West Belgium.” Natural Hazards and Earth System Sciences 5: 259–265.
- Dias, Hölbling, and Grohmann (2021) Dias, Helen Cristina, Daniel Hölbling, and Carlos Henrique Grohmann. 2021. “Landslide Susceptibility Mapping in Brazil: A Review.” Geosciences 11: 425.
- Ding et al. (2016) Ding, Anzi, Qingyong Zhang, Xinmin Zhou, and Bicheng Dai. 2016. “Automatic recognition of landslide based on CNN and texture change detection.” In 31st Youth Academic Annual Conference of Chinese Association of Automation, Wuhan, China, 444 – 448.
- Du and Teng (2007) Du, Jia Chong, and Hung Chao Teng. 2007. “3D laser scanning and GPS technology for landslide earthwork volume estimation.” Automation in Construction 16 (5): 657–663.
- Ellenberg and Mueller Dombois (1967) Ellenberg, Heinz, and Dieter Mueller Dombois. 1967. “A key to Raunkiaer plant life forms with revised subdivisions.” Ber. geobot. Inst. eidg. tech. Hochschule Rubel 37: 56–73.
- Fiori and Carmignani (2015) Fiori, Alberto Pio, and Luigi Carmignani. 2015. Fundamentos de mecânica dos solos e das rochas: aplicações na estabilidade de taludes. 3rd ed. Oficina dos Textos.
- Fúlfaro et al. (1976) Fúlfaro, VJ, WL Ponçano, CA Bistrichi, and DP Stein. 1976. “Escorregamentos de Caraguatatuba: expressão atual, e registro na coluna sedimentar da planície costeira adjacente.” In Congresso brasileiro de geologia de engenharia, Vol. 2, 341–350.
- Gariano and Guzzetti (2016) Gariano, Stefano Luigi, and Fausto Guzzetti. 2016. “Landslides in a changing climate.” Earth-Science Reviews 162: 227–252.
- Ghorbanzadeh et al. (2019) Ghorbanzadeh, Omid, Thomas Blaschke, Khalil Gholamnia, Sansar Raj Meena, Dirk Tiede, and Jagannath Aryal. 2019. “Evaluation of different machine learning methods and deep-learning convolutional neural networks for landslide detection.” Remote Sensing 11 (196): 21.
- Glenn et al. (2006) Glenn, Nancy F., David R. Streutker, D. John Chadwick, Glenn D. Thackray, and Stephen J. Dorsch. 2006. “Analysis of LiDAR-derived topographic information for characterizing and differentiating landslide morphology and activity.” Geomorphology 73 (1-2): 131–148.
- Godone et al. (2020) Godone, Danilo, Paolo Allasia, Luigi Borrelli, and Giovanni Gulla. 2020. “UAV and structure from motion approach to monitor the Maierato landslide evolution.” Remote Sensing 12 (6): 1039–1057.
- Guidicini and Nieble (1984) Guidicini, Guido, and Carlos Manoel Nieble. 1984. “Estabilidade de Taludes Naturais e de Escavação.” Editora Edgard Blücher. 2ª. Ed. São Paulo .
- Guth et al. (2021) Guth, P. L., A. Van Niekerk, C. H. Grohmann, J.-P. Muller, L. Hawker, I. V. Florinsky, D. Gesch, et al. 2021. “Digital Elevation Models: Terminology and Definitions.” Remote Sensing. 13 (18): 3581.
- Guzzetti et al. (1999) Guzzetti, Fausto, Alberto Carrara, Mauro Cardinali, and Paola Reichenbach. 1999. “Landslide hazard evaluation: a review of current techniques and their application in a multi-scale study, Central Italy.” Geomorphology 31 (1-4): 181–216. https://www.sciencedirect.com/science/article/pii/S0169555X99000781?via{%}3Dihub.
- Guzzetti et al. (2012) Guzzetti, Fausto, Alessandro Cesare Mondini, Mauro Cardinali, Federica Fiorucci, Michele Santangelo, and Kang Tsung Chang. 2012. “Landslide inventory maps: New tools for an old problem.” Earth-Science Reviews 112 (1-2): 42–66. http://dx.doi.org/10.1016/j.earscirev.2012.02.001.
- He et al. (2016) He, Kaiming, Xiangyu Zhang, Shaoqing Ren, and Jian Sun. 2016. “Deep residual learning for image recognition.” 770–778.
- Hoeser and Kuenzer (2020) Hoeser, Thorsten, and Claudia Kuenzer. 2020. “Object Detection and Image Segmentation with Deep Learning on Earth Observation Data: A Review-Part I: Evolution and Recent Trends.” Remote Sensing 12: 1667.
- Huang et al. (2017) Huang, G., Z. Liu, L. Van Der Maaten, and K. Q. Weinberger. 2017. “Densely Connected Convolutional Networks.” In 2017 IEEE Conference on Computer Vision and Pattern Recognition (CVPR), Los Alamitos, CA, USA, jul, 2261–2269. IEEE Computer Society. https://doi.ieeecomputersociety.org/10.1109/CVPR.2017.243.
- Jaboyedoff et al. (2012) Jaboyedoff, Michel, Thierry Oppikofer, Antonio Abellán, Marc Henri Derron, Alex Loye, Richard Metzger, and Andrea Pedrazzini. 2012. “Use of LIDAR in landslide investigations: A review.” Natural Hazards 61 (1): 5–28.
- Jebur, Pradhan, and Tehrany (2014) Jebur, Mustafa Neamah, Biswajeet Pradhan, and Mahyat Shafapour Tehrany. 2014. “Optimization of landslide conditioning factors using very high-resolution airborne laser scanning (LiDAR) data at catchment scale.” Remote Sensing of Environment 152: 150–165. http://dx.doi.org/10.1016/j.rse.2014.05.013.
- Ji et al. (2020) Ji, Shunping, Dawen Yu, Chaoyong Shen, and Qiang Xu. 2020. “Landslide detection from an open satellite imagery and digital elevation model dataset using attention boosted convolutional neural networks.” Landslides 17: 1337 – 1352.
- Kasai et al. (2009) Kasai, Mio, Manabu Ikeda, Toshihiro Asahina, and Kazunori Fujisawa. 2009. “LiDAR-derived DEM evaluation of deep-seated landslides in a steep and rocky region of Japan.” Geomorphology 113 (1-2): 57–69. http://dx.doi.org/10.1016/j.geomorph.2009.06.004.
- Knevels et al. (2019) Knevels, Raphael, Helene Petschko, Philip Leopold, and Alexander Brenning. 2019. “Geographic Object-Based Image Analysis for Automated Landslide Detection Using Open Source GIS Software.” International Journal of Geo-Information 8 (551): 21.
- Koeppen (1948) Koeppen, Wilhelm. 1948. “Climatologia: con un estudio de los climas de la tierra.” 478 p.
- Krizhevsky, Sutskever, and Hinton (2012) Krizhevsky, Alex, Ilya Sutskever, and Geoffrey E. Hinton. 2012. “ImageNet Classification with Deep Convolutional Neural Networks.” In Conf. Adv. Neural Inf. Process, 1097–1105.
- Kronka et al. (2007) Kronka, JN, et al. 2007. “Inventario florestal da vegetacao natural do Estado de Sao Paulo. Regioes administrativas de Sao Jose dos Campos (litoral), Baixada Santista e Registro.” .
- Kussul et al. (2017) Kussul, Nataliia, Mykola Lavreniuk, Sergii Skakun, and Andrii Shelestov. 2017. “Deep Learning Classification of Land Cover and Crop Types Using Remote Sensing Data.” IEEE Geoscience and Remote Sensing Letters 14 (5): 778–782.
- Lehmann (2008) Lehmann, D.R.M. 2008. “Estudos Sobre a Propagação De Gleichenella Pectinata (Willd.) Ching (Pteridófita - Gleicheniaceae).” Dissertação de Mestrado.
- Li et al. (2021) Li, Chang, Bangjin Yi, Peng Gao, Hui Li, Jixing Sun, Xueye Chen, and Cheng Zhong. 2021. “Valuable clues for DCNN-Based landslide detection from a comparative assessment in the Wenchuan earthquake area.” Sensors 21 (5191): 14.
- Li et al. (2020) Li, S., L. Xiong, G. Tang, and J. Strobl. 2020. “Deep learning-based approach for landform classification from integrated data sources of digital elevation model and imagery.” Geomorphology 354: 1–14.
- Lin et al. (2017) Lin, Tsung-Yi, Piotr Dollar, Ross Girshick, Kaiming He, Bharath Harihraran, and Serge Belongie. 2017. “Feature Pyramid Networks for Object Detection.” In IEEE Conference on Computer Vision and Pattern Recognition (CVPR), 2117 – 2125.
- Lindner et al. (2016) Lindner, Gerald, Klaus Schraml, Reinfried Mansberger, and Johannes Hubl. 2016. “UAV monitoring and documentation of a large landslide.” Applied Geomatics 8: 1–11.
- Liu et al. (2018) Liu, Bing, Xuchu Yu, Anzhu Yu, and Gang Wan. 2018. “Deep convolutional recurrent neural network with transfer learning for hyperspectral image classification.” Journal of Applied Remote Sensing 12: 1.
- Liu et al. (2009) Liu, Jin-King, Kuan-Tsung Chang, Jiann-Yeou Rau, Wei-Cheng Hsu, Zu-Yi Liao, Chi-Chung Lau, and Tian-Yuan Shih. 2009. “The geomorphometry of rainfall-Induced landslides in Taiwan obtained by airborne LiDAR and digital photography.” In Geoscience and Remote Sensing, InTech.
- Lucieer, de Jong, and Turner (2014) Lucieer, Arko, Steven M. de Jong, and Darren Turner. 2014. “Mapping landslide displacements using Structure from Motion (SfM) and image correlation of multi-temporal UAV photography.” Progress in Physical Geography 38 (1): 97–116.
- Luus et al. (2015) Luus, F. P. S., B. P. Salmon, F. van den Bergh, and B. T. J. Maharaj. 2015. “Multiview Deep Learning for Land-Use Classification.” IEEE GEOSCIENCE AND REMOTE SENSING LETTERS 12 (12): 2448–2452.
- Ma et al. (2019) Ma, Lei, Yu Liu, Xueliang Zhang, Yuanxin Ye, Gaofei Yin, and Brian Alan Johnson. 2019. “Deep learning in remote sensing applications: A meta-analysis and review.” ISPRS Journal of Photogrammetry and Remote Sensing 152 (November 2018): 166–177. https://doi.org/10.1016/j.isprsjprs.2019.04.015.
- Mantovani, Soeters, and VAn Westen (1996) Mantovani, Franco, Robert Soeters, and C. J. VAn Westen. 1996. “Remote sensing techniques for landslide studies and hazard zonation in Europe.” Geomorphology 15: 213–225. https://ac.els-cdn.com/0169555X9500071C/1-s2.0-0169555X9500071C-main.pdf?{_}tid=e636cc36-64b3-45b5-9b18-41c5724cc837{&}acdnat=1547762487{_}51f2ebff6e0f6d1e2568d0e647e7d2e1.
- Maxwell, Warner, and Fang (2018) Maxwell, Aaron E., Timothy A. Warner, and Fang Fang. 2018. “Implementation of machine-learning classification in remote sensing: an applied review.” International Journal of Remote Sensing2 39 (9): 2784–2817.
- McKean and Roering (2004) McKean, J., and J. Roering. 2004. “Objective landslide detection and surface morphology mapping using high-resolution airborne laser altimetry.” Geomorphology 57 (3-4): 331–351.
- Meena et al. (2022) Meena, Sansar Raj, Lucas Pedrosa Soares, Carlos H. Grohmann, Cees van Westen, Kushanav Bhuyan, Ramesh P. Singh, Mario Floris, and Filippo Catani. 2022. “Landslide detection in the Himalayas using machine learning algorithms and U-Net.” Landslides 19. https://doi.org/10.1007/s10346-022-01861-3.
- Menegoni, Giordan, and Perotti (2020) Menegoni, Niccolo, Daniele Giordan, and Cesare Perotti. 2020. “Reliability and uncertainties of the analysis of an unstable rock slope performed on RPAS digital outcrop models: The case of the Gallivaggio landslide (Western Alps, Italy).” Remote Sensing 12 (10): 1635–1660.
- Metternicht, Hurni, and Gogu (2005) Metternicht, Graciela, Lorenz Hurni, and Radu Gogu. 2005. “Remote sensing of landslides: An analysis of the potential contribution to geo-spatial systems for hazard assessment in mountainous environments.” Remote Sensing of Environment 98 (2-3): 284–303.
- Mozas-Calvache, Pérez-garcia, and Fernandez-del Castillo (2017) Mozas-Calvache, A. T., J. L. Pérez-garcia, and T. Fernandez-del Castillo. 2017. “Monitoring of landslides displacements using UAS and control methods based on lines.” Landslides 14: 2115–2128.
- Netto et al. (2011) Netto, A. L. C., A. M. Sato, A. S. Avelar, L. G. G. Vianna, I. S. Araújo, D. L. C. Ferreira, P. H. Lima, A. P. A. Silva, and R. P. Silva. 2011. “January 2011: the extreme landslide disaster in Brazil.” In Proceedings of the 2nd Worl landslide Forum, 6.
- Niethammer et al. (2010) Niethammer, Uwe, Sabrina Rothmund, M. R. James, J. Travelletti, and M. Joswig. 2010. “UAV-Based Remote Sensing of Landslides.” In International Archives of Photogrammetry, Remote Sensing and Spatial Information Sciences, 496–501.
- Nilsen and Brabb (1973) Nilsen, Tor H., and Earl E. Brabb. 1973. “Current slope stability studies in the San Francisco bay region.” Journal Research U.S. Geological Survey 1 (4): 431–437.
- Nohani et al. (2019) Nohani, Ebrahim, Meisam Moharrami, Samira Sharafi, Khabat Khosravi, Biswajeet Pradhan, Binh Thai Pham, Saro Lee, and Assefa M. Melesse. 2019. “Landslide Susceptibility Mapping Using Different GIS-Based Bivariate Models.” Water 11 (1402): 1–22.
- Pal and Mather (2006) Pal, M., and M. Mather. 2006. “Support vector machines for classification in remote sensing.” Internation Journal of Remote Sensing 26 (5): 1007–1011.
- Pedrazzini et al. (2010) Pedrazzini, A, A Abellán, T Oppikofer, C Ambrosi, A Spataro, and M Jaboyedoff. 2010. “Retrogressive landslide monitoring by TLS: precursory displacements and final collapse. Case study at Val Canaria (Ticino, Switzerland).” Geophysical Research Abstracts, EGU General Assembly 2010 12. http://meetingorganizer.copernicus.org/EGU2010/EGU2010-12160.pdf.
- Pedregosa et al. (2011) Pedregosa, F., G. Varoquaux, A. Gramfort, V. Michel, B. Thirion, O. Grisel, M. Blondel, et al. 2011. “Scikit-learn: Machine Learning in Python.” Journal of Machine Learning Research 12: 2825–2830.
- Perrota et al. (2005) Perrota, M. M., E. D. Salvador, R. C. Lopes, L. Z. D’Agostino, N. Peruffo, S. D. Gomes, L. L. B. Sachs, V. T. Meira, M. G. M. Garcia, and J. V. Lacerda Filho. 2005. Mapa Geológico do Estado de São Paulo. Technical Report. São Paulo, Brasil: CPRM.
- Petropoulos, Kalaitzidis, and Prasad Vadrevu (2012) Petropoulos, George P., Chariton Kalaitzidis, and Krishna Prasad Vadrevu. 2012. “Support vector machines and object-based classification for obtaining land-use/cover cartography from Hyperion hyperspectral imagery.” Computers and Geosciences 41: 99–107. http://dx.doi.org/10.1016/j.cageo.2011.08.019.
- Ponçano (1981) Ponçano, Waldir Lopes. 1981. Mapa geomorfológico do estado de São Paulo. Vol. 1. Instituto de Pesquisas Tecnológicas do Estado de São Paulo, Divisão de Minas ….
- Portela (2014) Portela, Viviane Dias Alves. 2014. “Avaliação da vegetação como indicadora de areas suscetiveis a escorregamentos na Serra do Mar em Caraguatatuba (SP). áreas suscetíveis a escorregamentos na Serra do Mar em Caraguatatuba ( SP ) Viviane Dias Alves Portela Avaliação da vegetação como indicad.” Dissertação de mestrado.
- Prakash, Manconi, and Loew (2020) Prakash, Nikhil, Andrea Manconi, and Simon Loew. 2020. “Mapping Landslides on EO Data: Performance of Deep Learning vs. Traditional Machine Learning Models.” Remote Sensing 12 (346): 24.
- Roering, Kirchner, and Dietrich (2005) Roering, Joshua J, James W Kirchner, and William E Dietrich. 2005. “Characterizing structural and lithologic controls on deep-seated landsliding : Implications for topographic relief and landscape evolution in the Oregon Coast Range , USA.” (5): 654–668.
- Roering et al. (2013) Roering, Joshua J., Benjamin H. Mackey, Jill A. Marshall, Kristin E. Sweeney, Natalia I. Deligne, Adam M. Booth, Alexander L. Handwerger, and Corina Cerovski-Darriau. 2013. “‘You are HERE’: Connecting the dots with airborne lidar for geomorphic fieldwork.” Geomorphology 200: 172–183. https://linkinghub.elsevier.com/retrieve/pii/S0169555X13002031.
- Ronneberger, Fischer, and Brox (2015) Ronneberger, Olaf, Philipp Fischer, and Thomas Brox. 2015. “U-Net: Convolutional Networks for Biomedical Image Segmentation.” In Medical Image Computing and Computer-Assisted Intervention, 234–241.
- Sameen and Pradhan (2019) Sameen, Maher Ibrahim, and Biswajeet Pradhan. 2019. “Landslide detection using residual networks and the fusion of spectral and topographic information.” IEEE Access 7: 114363 – 114373.
- Samodra et al. (2020) Samodra, Guruh, Muhammad Fauzan Ramadhan, Junun Sartohadi, Muhammad Anggri Setiawan, Nugroho Christanto, and Adhera Sukmawijaya. 2020. “Characterization of displacement and internal structure of landslides from multitemporal UAV and ERT imaging.” Landslides 17: 2455–2468.
- Scaioni et al. (2014) Scaioni, Marco, Laura Longoni, Valentina Melillo, and Monica Papini. 2014. “Remote Sensing for Landslide Investigations: An Overview of Recent Achievements and Perspectives.” Remote Sensing 6: 53.
- Schulz (2007) Schulz, William H. 2007. “Landslide susceptibility revealed by LIDAR imagery and historical records, Seattle, Washington.” Engineering Geology 89 (1-2): 67–87.
- Schulz et al. (2018) Schulz, William H., Joel B. Smith, Gonghui Wang, Yao Jiang, and Joshua J. Roering. 2018. “Clayey Landslide Initiation and Acceleration Strongly Modulated by Soil Swelling.” Geophysical Research Letters 45: 1888–1896.
- Scott et al. (2017) Scott, Grant J., Matthew R. England, William A. Starms, Richard A. Marcum, and Curt H. Davis. 2017. “Training Deep Convolutional Neural Networks for Land-Cover Classification of High-Resolution Imagery.” IEEE Geoscience and remote sensing letters 14 (4): 549–553.
- Shahabi and Hashim (2015) Shahabi, Himan, and Mazlan Hashim. 2015. “Landslide susceptibility mapping using GIS-based statistical models and remote sensing data in tropical environment.” Scientific Reports 5 (9899): 15.
- Soares et al. (2022) Soares, Lucas Pedrosa, Helen Cristina Dias, Guilherme Pereira Bento Garcia, and Carlos Henrique Grohmann. 2022. “Landslide Segmentation with Deep Learning: Evaluating Model Generalization in Rainfall-Induced Landslides in Brazil.” Remote Sensing 14: 2237.
- Summerfield (1991) Summerfield, Michael A. 1991. Global Geomorphology. 1st ed. Edinburgh: Pearson Education Limited.
- Tominaga, Santoro, and do Amaral (2009) Tominaga, Lídia Keiko, Jair Santoro, and Rosangela do Amaral. 2009. Desastres naturais: conhecer para prevenir. Instituto geológico.
- Turner, Lucieer, and de Jong (2015) Turner, Darren, Arko Lucieer, and Steven M. de Jong. 2015. “Time series analysis of landslide dynamics using an Unmanned Aerial Vehicle (UAV).” Remote Sensing 7: 1736–1757.
- UNISDR (2015) UNISDR. 2015. Sendai framework for disaster risk reduction 2015-2030. Technical Report. Geneva, Switzerland: The United Nations Office for Disaster Risk Reduction.
- Van Den Eeckhaut et al. (2007) Van Den Eeckhaut, M, J. Poesen, G. Verstraeten, V. Vanacker, J. Nyssen, J. Moeyersons, L. P H van Beek, and Liesbeth Vandekerckhove. 2007. “Use of LIDAR-derived images form mapping old landslides under forest.” Earth Surface Processes and Landforms 32 (September): 754–769. http://doi.wiley.com/10.1002/esp.1730.
- Van Den Eeckhaut et al. (2012) Van Den Eeckhaut, Miet, Norman Kerle, Jean Poesen, and Javier Herv??s. 2012. “Object-oriented identification of forested landslides with derivatives of single pulse LiDAR data.” Geomorphology 173-174: 30–42. http://dx.doi.org/10.1016/j.geomorph.2012.05.024.
- Van Den Eeckhaut et al. (2005) Van Den Eeckhaut, Miet, J. Poesen, G. Verstraeten, V. Vanacker, J. Moeyersons, J. Nyssen, and L. P H van Beek. 2005. “The effectiveness of hillshade maps and expert knowledge in mapping old deep-seated landslides.” Geomorphology 67 (3-4): 351–363.
- Veloso, Rangel-Filho, and Lima (1991) Veloso, Henrique Pimenta, Antonio Lourenço Rosa Rangel-Filho, and Jorge Carlos Alves Lima. 1991. Classificação da vegetação brasileira, adaptada a um sistema universal. IBGE.
- Ventura et al. (2011) Ventura, Guido, Giuseppe Vilardo, Carlo Terranova, and Eliana Bellucci Sessa. 2011. “Tracking and evolution of complex active landslides by multi-temporal airborne LiDAR data: The Montaguto landslide (Southern Italy).” Remote Sensing of Environment 115 (12): 3237–3248. http://dx.doi.org/10.1016/j.rse.2011.07.007.
- Wang et al. (2013) Wang, Guoquan, James Joyce, David Phillips, Ramesh Shrestha, and William Carter. 2013. “Delineating and defining the boundaries of an active landslide in the rainforest of Puerto Rico using a combination of airborne and terrestrial LIDAR data.” Landslides 10 (4): 503–513.
- Wang et al. (2020) Wang, H., L. Zhang, K. Yin, H. Luo, and J. Li. 2020. “Landslide identification using machine learning.” Geoscience Frontiers 1–14.
- Wolle (1988) Wolle, C. M. 1988. “Análise de escorregamentos translacionais numa região da Serra do Mar no contexto de uma classificação de mecanismos de instabilização de encostas.” Tese de Doutorado, Universidade de São Paulo.
- Xu et al. (2022) Xu, Guosen, Yi Wang, Lizhe Wang, Lucas Pedrosa Soares, and Carlos Henrique Grohmann. 2022. “Feature-based constraint deep CNN method for mapping rainfall-induced landslides in remote regions with mountainous terrain: An application to Brazil.” IEEE Journal of Selected Topics in Applied Earth Observations and Remote Sensing 15.
- Xu et al. (2020) Xu, Qiang, Wei-le Li, Yuan-zhen Ju, Xiu-jun Dong, and Da-lei Peng. 2020. “Multitemporal UAV-based photogrammetry for landslide detection and monitoring in a large area: a case study in the Heifangtai terrace in the Loess Plateau of China.” Journal of Mountain Science 14: 1826–1839.
- Yakubovskiy (2019) Yakubovskiy, Pavel. 2019. “Segmentation Models.” https://github.com/qubvel/segmentation_models.
- Yu et al. (2021) Yu, Bo, Fang Chen, Chong Xu, Lei Wang, and Ning Wang. 2021. “Matrix SegNet: A practical deep learning framework for landslide mapping from images of different areas with different spatial resolutions.” Remote Sensing 13 (3158): 16.
- Yu et al. (2017) Yu, Miao, Yu Huang, Jiamin Zhou, and Liya Mao. 2017. “Modeling of landslide topography based on micro-unmanned aerial vehicle photography and structure-from-motion.” Environmental Earth Sciences 76 (520): 9.
- Zhang, Zhang, and Kumar (2016) Zhang, L., L. Zhang, and V. Kumar. 2016. “Deep learning for Remote Sensing Data.” IEEE Geoscience and Remote Sensing Magazine 4 (2): 22–40.
- Zhao, Du, and Emery (2017) Zhao, Wenzhi, Shihong Du, and William J. Emery. 2017. “Object-Based Convolutional Neural Network for High-Resolution Imagery Classification.” IEEE Journal of Selected Topics in Applied Earth Observations and Remote Sensing 10 (7): 3386–3396.
- Zhao et al. (2015) Zhao, Wenzhi, Zhou Guo, Jun Yue, Xiuyuan Zhang, and Liqun Luo. 2015. “On combining multiscale deep learning features for the classification of hyperspectral remote sensing imagery.” International Journal of Remote Sensing 36 (13): 3368–3379. http://dx.doi.org/10.1080/2150704X.2015.1062157.
- Zhong, Hu, and Zhou (2019) Zhong, Liheng, Lina Hu, and Hang Zhou. 2019. “Deep learning based multi-temporal crop classification.” Remote Sensing of Environment 221 (November 2018): 430–443. https://doi.org/10.1016/j.rse.2018.11.032.
- Zhong et al. (2017) Zhong, Yanfei, Feng Fei, Yanfei Liu, Bei Zhao, Hongzan Jiao, and Liangpei Zhang. 2017. “SatCNN: satellite image dataset classification using agile convolutional neural networks.” Remote Sensing Letters 8 (2): 136–145. http://dx.doi.org/10.1080/2150704X.2016.1235299.