Solar-like oscillations and ellipsoidal variations in TESS observations of the binary 12 Boötis
Abstract
Binary stars in which oscillations can be studied in either or both components can provide powerful constraints on our understanding of stellar physics. The bright binary 12 Boötis (12 Boo) is a particularly promising system because the primary is roughly 60 per cent brighter than the secondary despite being only a few per cent more massive. Both stars have substantial surface convection zones and are therefore, presumably, solar-like oscillators. We report here the first detection of solar-like oscillations and ellipsoidal variations in the TESS light curve of 12 Boo. Though the solar-like oscillations are not clear enough to unambiguously measure individual mode frequencies, we combine global asteroseismic parameters and a precise fit to the spectral energy distribution (SED) to provide new constraints on the properties of the system that are several times more precise than values in the literature. The SED fit alone provides new effective temperatures, luminosities and radii of , and for 12 Boo A and , and for 12 Boo B. When combined with our asteroseismic constraints on 12 Boo A, we obtain an age of , which is consistent with that of 12 Boo B.
keywords:
stars: oscillations (including pulsations); stars: individual (12 Boo); stars: binaries; asteroseismology1 Introduction
Binary stars have long provided important tests of widely-used one-dimensional stellar models. Great attention is usually given to double-lined eclipsing binaries, in which masses and radii can be measured, but astrometric double-lined binaries also provide stellar masses, which are arguably stars’ most important initial physical parameter.
Independently, the study of stellar oscillations—asteroseismology—also provides important tests of stellar physics. When we can identify multiple modes and measure their frequencies, each mode provides a slightly different average of some interior properties, which allows very precise measurements of certain characteristics (e.g., the mean density) and potentially tests to distinguish between theories of the stars’ interior physics (see e.g. Aerts, 2021, for a recent review). In cool stars like the Sun (), near-surface convection drives and damps oscillations across a wide range of frequencies. These oscillations are known as solar-like oscillations; stars that show these oscillations are solar-like oscillators. The modes in solar-like oscillators can easily be identified by the regular patterns they follow (see e.g. García & Ballot, 2019, for a recent review). Their study has recently been revolutionised by space-based photometry from CoRoT (Auvergne et al., 2009; CoRot Team, 2016), Kepler (Borucki et al., 2010) and K2 (Howell et al., 2014).
The asteroseismology of binary stars is thus particularly promising for testing stellar models but solar-like oscillations have been measured in very few main-sequence or early subgiant binary systems. Miglio et al. (2014) predicted that Kepler would detect solar-like oscillations in both components of only a few main-sequence binaries, which has been borne out. Main-sequence binaries in which Kepler observed solar-like oscillations in both components include 16 Cyg (KIC 12069424, KIC 12069449; Metcalfe et al., 2012; Davies et al., 2015), HD 177412 (KIC 7510397; Appourchaux et al., 2015) and HD 176465 (KIC 10124866; White et al., 2017). Halbwachs (1986) identified HIP 92961 & 92962 (KIC 9139151 & KIC 9139163) as a pair with common proper motions and Silva Aguirre et al. (2017) included both stars in their survey of solar-like oscillators observed by Kepler. Aside from these main-sequence binaries observed by Kepler, ground-based radial velocity campaigns have also observed solar-like oscillations in both components of Cen (Bouchy & Carrier, 2001; Kjeldsen et al., 2005).
With the launch of the Transiting Exoplanet Survey Satellite (TESS; Ricker et al., 2015), we can now reverse the selection process and search for solar-like oscillations in known main-sequence or subgiant binaries. TESS is less sensitive than Kepler, so detecting solar-like oscillations in main-sequence and subgiant stars is limited to very bright stars with (see, e.g., the non-detection of solar-like oscillations in AI Phe, Maxted et al., 2020). For example, solar-like oscillations have been detected in TESS observations of HD 221416 (Huber et al., 2019), Ind (Chaplin et al., 2020), For (Nielsen et al., 2020) 94 Aqr Aa (Metcalfe et al., 2020), HD 38529 (Ball et al., 2020), HD 19916 (Addison et al., 2021), CrB (Metcalfe et al., 2021), Men A (Chontos et al., 2021), Pav, Tuc and Men (Huber et al., 2022).
We report here the results of our search for solar-like oscillations in the TESS light curve of 12 Boötis (d Boötis, HR 5304, HD 123999, TIC 418010485; hereafter 12 Boo), a bright () binary system comprising two roughly stars in a slightly eccentric (), orbit. Campbell & Wright (1900) originally discovered the radial velocity variations in 12 Boo and Harper (1914) subsequently measured more radial velocities and fit orbital parameters. Merrill (1922) conducted an interferometric survey of a number of binary stars but could not resolve the orbit of 12 Boo. The binary nature of the system was not revisited until Abt & Levy (1976) computed new orbital elements. de Medeiros & Udry (1999) measured new radial velocities as part of a survey of evolved stars.
Boden et al. (2000) presented the first interferometric observations of the orbit of the system and noted that the primary is about magnitudes brighter in than the secondary despite being of about the same mass. They recognised that this probably meant the primary has recently left the main-sequence and the secondary is near the end of its main-sequence life. Boden et al. (2005) refined their previous result and Tomkin & Fekel (2006) independently derived consistent orbital parameters. Konacki et al. (2010) presented an even more precise simultaneous fit of the interferometric measurements combined with the radial velocities they measured as part of the TATOOINE search for circumbinary planets. More recently, Behr et al. (2011) reported more independent radial velocities and Kervella et al. (2017) made a limited set of measurements of 12 Boo as a calibrator for their study of Cen.
Miglio et al. (2007) highlighted potential of 12 Boo as a test for stellar models. In particular, they investigated how the detection of mixed modes, which have oscillating components in the core and envelope, would distinguish different possibilities for the extent of extra mixing at the boundary of the main-sequence convective core. Miglio et al. (2007) also pointed out that even the more modest goal of measuring the stars’ large frequency separations would provide more precise radius estimates.
We present here our analysis of TESS light curve of 12 Boo, which includes the first detection of solar-like oscillations and ellipsoidal variations in this system. In Sec. 2, we detail our new analyses of the TESS light curve and provide an updated fit of the spectral energy distribution incorporating new photometry and parallax data from Gaia. In Sec. 3, we summarise our results from fitting multiple sets of stellar models to the new constraints, including asteroseismic constraints on 12 Boo A. We close in Sec. 4 with some speculation on the future seismic potential of 12 Boo.
2 Observations
2.1 Light curve
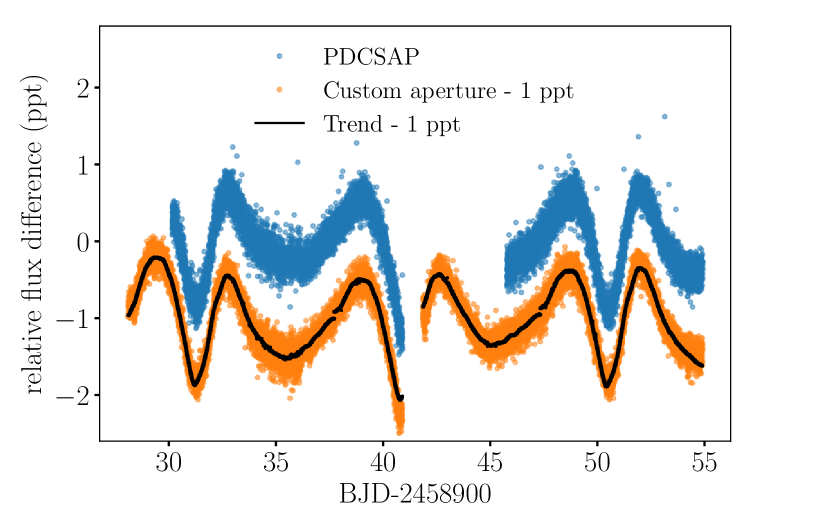
TESS observed 12 Boo on Camera 2 during Sector 23 (2020-03-19 to 2020-04-15) at a cadence of 2 min (i.e., TESS’s original short cadence). Our initial inspection of the pipeline-reduced aperture photometry (Pre-search Data Conditioning Simple Aperture Photometry, PDCSAP), shown by the blue points in Fig. 1, immediately showed mmag-level variations matching the orbital period of the system. These are ellipsoidal variations caused by the gravity of each star slightly distorting its companion. As far as we know, this is the first time ellipsoidal variations have been reported for 12 Boo.
The PDCSAP light curve, shown in blue in Fig. 1, offered only a marginal detection of solar-like oscillations in 12 Boo A, so we experimented with custom light curves, reduced from the short-cadence imagettes. The imagettes include many cadences that were excluded from the PDCSAP reduction when scattered light left too little data to derive cotrending basis vectors, which the pipeline uses to remove systematic effects (Fausnaugh et al., 2021, quality bit 16). We selected all pixels with a median flux greater than , including one line of pixels above and below the saturated columns as well as the columns before and after the saturated ones. We then removed all data points taken while the spacecraft was in safe mode (quality bit 2), pointing to Earth (quality bit 4) or desaturating the reaction wheels (quality bit 32). We also removed data points marked as impulsive outliers (quality bit 10). Finally, small gaps were filled using the inpainting techniques described by García et al. (2014) and Pires et al. (2015). Our custom light curve is shown in orange in Fig. 1, offset downwards by for visibility. The ellipsoidal variations remain clear and we recovered several days of data near the beginnings of TESS’s orbits. These are the data that the PDCSAP pipeline excluded because the scattered light prevents it from deriving cotrending basis vectors.
To produce the seismic light curve, we applied a triangular filter with a window function of 5 days (). To reduce the border effects at the beginning and the end of the series, the filter was computed for the times covered in the original light curve after reflecting the original light curve at each end by 2.5 days. The trend is shown by the black line in Fig. 1 and effectively removes the ellipsoidal variations, as well as slow systematic drifts at the beginnings and ends of each of TESS’s orbits.
| Team | ||
|---|---|---|
| Benomar | ||
| Jiang | ||
| Mathur | ||
| Combined |
| 12 Boo A | 12 Boo B | Source | |
| Literature values | |||
| Boden et al. (2005) | |||
| Boden et al. (2005) | |||
| Boden et al. (2005) | |||
| Constraints | |||
| Konacki et al. (2010) | |||
| Sec. 2.3 | |||
| Sec. 2.3 | |||
| Sec. 2.3 | |||
| Sec. 2.4 | |||
| Stellar modelling results | |||
| Sec. 3 | |||
| Sec. 3 | |||
| Sec. 3 | |||
| Sec. 3 | |||
2.2 Asteroseismic parameters
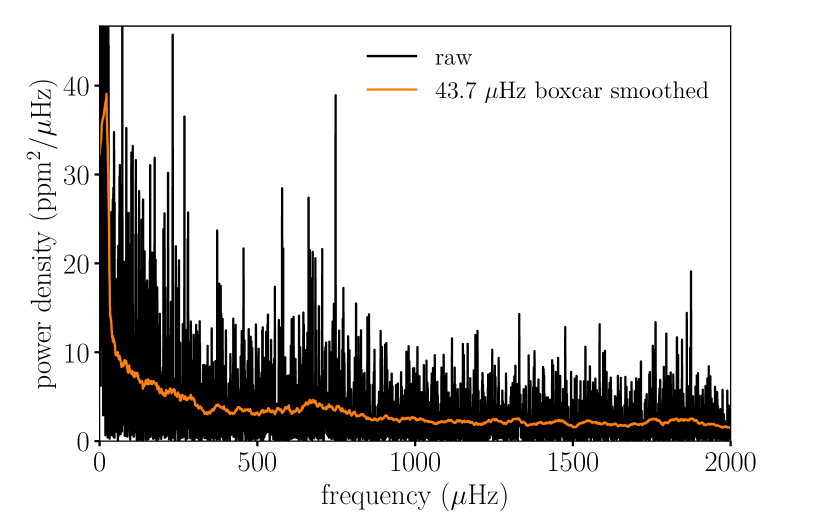
Fig. 2 shows the power spectrum of our detrended custom light curve after subtracting the trend determined above. There is a clear excess of power around , where the oscillations of the primary are expected based on its previously measured mass, luminosity and radius (see Table 2) combined with the scaling relation (Brown et al., 1991). There is no clear excess for the secondary, whose oscillations should peak roughly around based on a similar calculation using its properties from the literature.
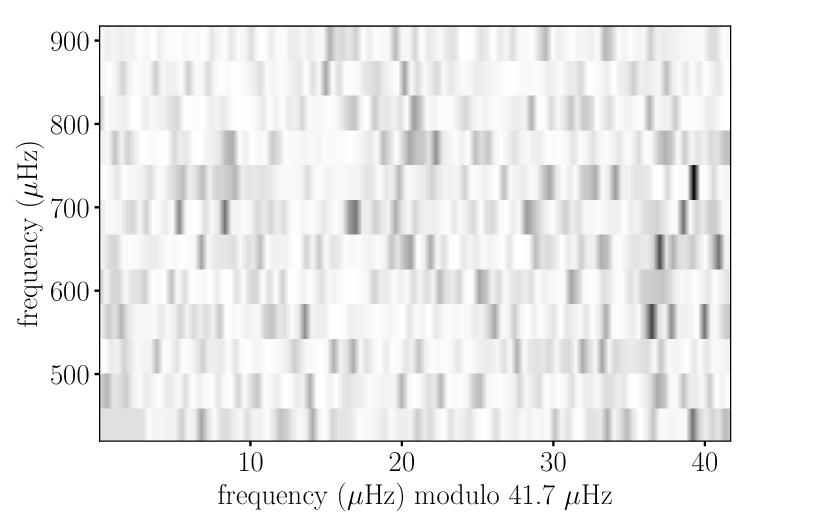
Fig. 3 shows the echelle diagram around the obvious power excess, folded on a large separation . This produces a roughly vertical ridge, which is characteristic of solar-like oscillations, around . Three teams (Benomar et al., 2012; Jiang et al., 2011; Mathur et al., 2010) independently analysed the power spectrum to measure the properties of the oscillations. The teams reported mutually consistent values for the frequency of maximum oscillation power and large separation , shown in Table 1.
The teams did not, however, reach a consensus on the identity of any individual mode frequencies, at least partly because the properties of 12 Boo A place it where empirical relations for identifying the angular degrees, which use their horizontal offset in the echelle diagram , are uncertain (e.g. White et al., 2012). The identification is further confounded by the potentially mixed modes, which would deviate from the simple asymptotic spacing of high-order pressure modes, and the rotational splitting, which would be around if 12 Boo A’s rotation is aligned and synchronised with its orbit. Boden et al. (2000) noted that, if the rotation axes are aligned with the orbit, the rotation periods are slightly shorter than the orbital period, presumably because the tidal torques are strongest at periastron, when the stars are moving relatively quickly (see e.g. Hut, 1981).
We therefore proceeded to analyse 12 Boo A using and but no individual frequencies. Our combined mean values for and are the means of the three estimates. Our consolidated variance is the mean of the variances plus the variance of the means. We symmetrized the slightly asymmetric results by Benomar by taking the mean of the limits as the central value. This gives and , as shown in Table 1.
2.3 Spectral energy distribution
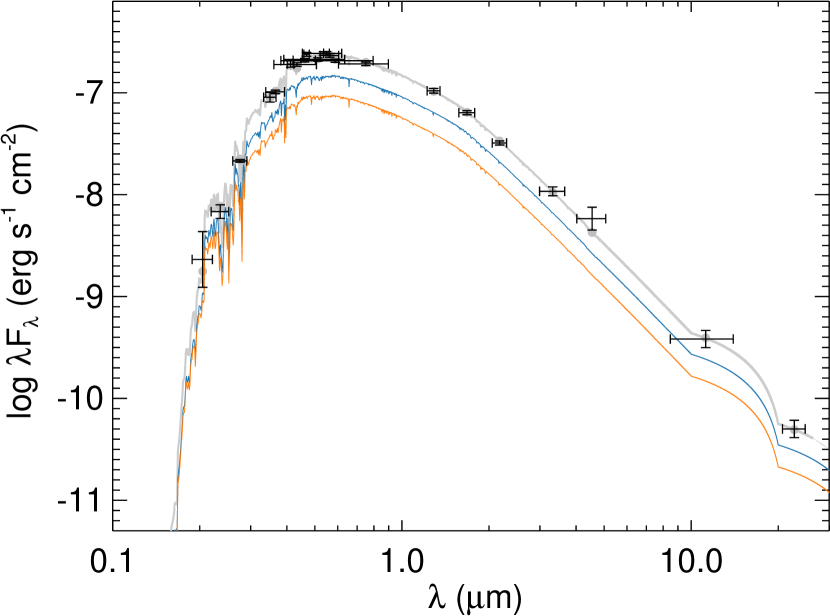
Reported luminosities of 12 Boo A and B pre-date the precise magnitudes and parallaxes from Gaia. We therefore computed a new fit to the total spectral energy distribution (SED) to determine the individual luminosities and effective temperatures, using the methods described by Stassun & Torres (2016) and Stassun et al. (2017); Stassun et al. (2018). The photometry comprises fluxes in the , and (ultraviolet) passbands of TD-1 (Thompson et al., 1978), magnitudes from Mermilliod (2006), magnitudes from Tycho-2 (Høg et al., 2000a, b) Strömgren magnitudes from Paunzen (2015), magnitudes from 2MASS (Skrutskie et al., 2006), – magnitudes from WISE (Wright et al., 2010), and Gaia , and magnitudes from Early Data Release 3 (EDR3; Gaia Collaboration et al., 2016, 2021; Riello et al., 2021). The two stars were distinguished by using flux ratios derived from the -band magnitude difference in Boden et al. (2005) and the -band magnitude difference in Kervella et al. (2017).
The best fitting radii and effective temperatures are shown in Table 2, along with the luminosities derived using the Stefan–Boltzmann law. Fig. 4 shows the observed photometry along with the total SED and the SEDs of the two stars. Because both stars are fit simultaneously and are spectrally so similar, the fit parameters are strongly correlated. We have included the correlation coefficients of the radii and effective temperatures in Table 3.
2.4 Existing complementary data
We choose to use the masses measured by Konacki et al. (2010), whose radial velocities have the smallest residuals (about and for 12 Boo A and B) and whose interferometry has the greatest phase coverage. The composition of a star—usually expressed through its metallicity —is an important constraint on its evolution. For 12 Boo, we use the spectroscopic measurements by Balachandran (1990) and Lèbre et al. (1999) of and , respectively, which we combine (as we did and above) to obtain . We assume both stars have surface abundances that are the same within this uncertainty.
3 Stellar modelling
Four teams computed best-fitting stellar models of the primary using a number of established methods (Ball et al., 2020; Jiang & Gizon, 2021; Çelik Orhan et al., 2021) that fit predictions by various stellar models (Christensen-Dalsgaard, 2008b; Demarque et al., 2008; Paxton et al., 2019) and stellar oscillation programs (Antia & Basu, 1994; Christensen-Dalsgaard, 2008a; Townsend & Teitler, 2013; Townsend et al., 2018) to the specified constraints. Three of the teams also modelled the secondary. As constraints for both stars, they used the masses , metallicities , luminosities and effective temperatures in Table 2. For 12 Boo A, they also used the consolidated and from Table 1.
We combined the results from each team using a linear opinion pool (Stone, 1961),111Though this is the usual modern reference for the idea, Bacharach (1979) attributes the concept to LaPlace (1814). where the overall probability distribution is taken as the equally-weighted sum of the probability distribution from each modeller. Some teams reported strongly asymmetric uncertainties, so we fit the results from each team using the lognormal distribution defined by Hosking & Wallis (1997, Sec. A.8), which allows arbitrary skewness and has the normal distribution as the limit when the shape parameter is zero. We then interpolated the total cumulative distribution function at the percentiles that correspond to the median and limits of a normal distribution, and report these as our central results and (asymmetric) uncertainties.
The modelling results are also shown in Table 2. We note that the stars’ ages are constrained to within about 6 per cent. This is principally because the masses are very precisely known. Ages are often imprecise because of the correlation with other parameters, including the mass. Because main-sequence lifetimes scale roughly like , one naïvely expects fractional age uncertainties at least about times larger than the fraction mass uncertainties. This precision on the ages is not typical of asteroseismology of individual stars, whose masses are less tightly constrained.
4 Discussion and conclusions
We have analysed the TESS light curve of the binary star 12 Boo, with the aim of combining individual seismic frequencies with the precise masses from the stars’ observed mutual orbit. We were unable to robustly identify individual frequencies but have used new photometric constraints, the parallax measurement from Gaia and the global oscillation properties— and —of 12 Boo A to revise the properties of the system. Crucially, this includes the radius, which is otherwise only weakly constrained in this non-eclipsing system.
The SED fit alone significantly improves the precision of the individual components’ properties. We compare our results to those of Boden et al. (2005), who appear to have most recently evaluated the total SED, and whose values are also reported in Table 2. The dramatic improvement is driven by the precise photometry from Gaia and the additional differential -band magnitude by Kervella et al. (2017). There is little improvement through the Gaia EDR3 parallax of , which is only slightly more precise than the orbital parallax of that Boden et al. (2005) derived. For 12 Boo B, Boden et al. (2005) estimated a radius of , compared to our from the SED fit. That is, our new radius is three times as precise. Our radius of from detailed stellar modelling reflects this constraint. For 12 Boo A, our SED fit gives a radius of , which is about twice as precise as the estimate of given by Boden et al. (2005).
Correspondingly, we have improved the bolometric luminosity estimates for 12 Boo A and B from and to and . The new luminosities are about three and seven times more precise.
The radius of 12 Boo A is further constrained by our measurements of the asteroseismic parameters and . If we simply use the scaling relation (Ulrich, 1986; Kjeldsen & Bedding, 1995)
| (1) |
we obtain a radius , which is slightly more precise than the SED fit. The stellar modelling result, which has asymmetric uncertainties, is more precise still. The mean density and, to a lesser extent, surface gravity of 12 Boo A are much better constrained than 12 Boo B. This is a natural consequence of the seismic data for 12 Boo A: tightly constrains ; constrains .
Our results thus significantly improve the properties of the system that have been reported in the literature. A more sophisticated analysis of the light curve and power spectrum might allow the identification of individual mode frequencies. Furthermore, 12 Boo is scheduled to be re-observed during TESS’s Sector 50 (2022-03-26 to 2022-04-22), and additional data at a cadence of 120 or 20 seconds might allow for a mode identification through which the Sector 23 data can be better exploited.
12 Boo might also be an interesting target for the Stellar Oscillation Network Group (SONG; Grundahl et al., 2014; Fredslund Andersen et al., 2019), which aims to become a worldwide network of telescopes with which to measure radial velocity variations in bright solar-like oscillators. The signal will be complicated by the stars’ orbital motions but the scientific value of measuring the individual mode frequencies remains, for now, unexplored.
Acknowledgements
WHB and WJC thank the UK Science and Technology Facilities Council (STFC) for support under grant ST/R0023297/1. AM acknowledges support from the ERC Consolidator Grant funding scheme (project ASTEROCHRONOMETRY, https://www.asterochronometry.eu, G.A. n. 772293). RAG acknowledges the support from PLATO and GOLF CNES grants. LGC thanks the support from grant FPI-SO from the Spanish Ministry of Economy and Competitiveness (MINECO) (research project SEV-2015-0548-17-2 and predoctoral contract BES-2017-082610). SM acknowledges support from the Spanish Ministry of Science and Innovation (MICINN) with the Ramón y Cajal fellowship no. RYC-2015-17697 and grant no. PID2019-107187GB-I00, and through AEI under the Severo Ochoa Centres of Excellence Programme 2020–2023 (CEX2019-000920-S). DLB acknowledges support from the TESS GI Program under NASA awards 80NSSC18K1585 and 80NSSC19K0385. JC is supported by a grant from the Max Planck Society to prepare for the scientific exploitation of the PLATO mission. CK is supported by Erciyes University Scientific Research Projects Coordination Unit under grant number DOSAP MAP-2020-9749.
This paper includes data collected by the TESS mission, which are publicly available from the Mikulski Archive for Space Telescopes (MAST). Funding for the TESS mission is provided by the NASA Explorer Program.
This work has made use of data from the European Space Agency (ESA) mission Gaia (https://www.cosmos.esa.int/gaia), processed by the Gaia Data Processing and Analysis Consortium (DPAC, https://www.cosmos.esa.int/web/gaia/dpac/consortium). Funding for the DPAC has been provided by national institutions, in particular the institutions participating in the Gaia Multilateral Agreement.
Data availability
Original TESS light curves and pixel-level data are available from the Mikulski Archive for Space Telescopes at http://mast.stsci.edu/. Other data underlying this article will be shared on reasonable request to the corresponding author.
References
- Abt & Levy (1976) Abt H. A., Levy S. G., 1976, ApJS, 30, 273
- Addison et al. (2021) Addison B. C., et al., 2021, MNRAS, 502, 3704
- Aerts (2021) Aerts C., 2021, Reviews of Modern Physics, 93, 015001
- Antia & Basu (1994) Antia H. M., Basu S., 1994, A&AS, 107, 421
- Appourchaux et al. (2015) Appourchaux T., et al., 2015, A&A, 582, A25
- Auvergne et al. (2009) Auvergne M., et al., 2009, A&A, 506, 411
- Bacharach (1979) Bacharach M., 1979, Journal of the American Statistical Association, 74, 837
- Balachandran (1990) Balachandran S., 1990, ApJ, 354, 310
- Ball et al. (2020) Ball W. H., et al., 2020, MNRAS, 499, 6084
- Behr et al. (2011) Behr B. B., Cenko A. T., Hajian A. R., McMillan R. S., Murison M., Meade J., Hindsley R., 2011, AJ, 142, 6
- Benomar et al. (2012) Benomar O., Baudin F., Chaplin W. J., Elsworth Y., Appourchaux T., 2012, MNRAS, 420, 2178
- Boden et al. (2000) Boden A. F., Creech-Eakman M. J., Queloz D., 2000, ApJ, 536, 880
- Boden et al. (2005) Boden A. F., Torres G., Hummel C. A., 2005, ApJ, 627, 464
- Borucki et al. (2010) Borucki W. J., et al., 2010, Science, 327, 977
- Bouchy & Carrier (2001) Bouchy F., Carrier F., 2001, A&A, 374, L5
- Brown et al. (1991) Brown T. M., Gilliland R. L., Noyes R. W., Ramsey L. W., 1991, ApJ, 368, 599
- Campbell & Wright (1900) Campbell W. W., Wright W. H., 1900, ApJ, 12, 254
- Chaplin et al. (2020) Chaplin W. J., et al., 2020, Nature Astronomy, 4, 382
- Chontos et al. (2021) Chontos A., et al., 2021, ApJ, 922, 229
- Christensen-Dalsgaard (2008a) Christensen-Dalsgaard J., 2008a, Ap&SS, 316, 113
- Christensen-Dalsgaard (2008b) Christensen-Dalsgaard J., 2008b, Ap&SS, 316, 13
- CoRot Team (2016) CoRot Team 2016, The CoRoT Legacy Book: The adventure of the ultra high precision photometry from space, by the CoRot Team. EDP Sciences, doi:10.1051/978-2-7598-1876-1
- Davies et al. (2015) Davies G. R., et al., 2015, MNRAS, 446, 2959
- Demarque et al. (2008) Demarque P., Guenther D. B., Li L. H., Mazumdar A., Straka C. W., 2008, Ap&SS, 316, 31
- Fausnaugh et al. (2021) Fausnaugh M. M., et al., 2021, TESS Data Release Notes: Sector 20, DR27, NASA/TM—2019––220500, %****␣12_boo.bbl␣Line␣150␣****https://archive.stsci.edu/missions/tess/doc/tess_drn/tess_sector_20_drn27_v03.pdf
- Fredslund Andersen et al. (2019) Fredslund Andersen M., et al., 2019, A&A, 623, L9
- Gaia Collaboration et al. (2016) Gaia Collaboration et al., 2016, A&A, 595, A1
- Gaia Collaboration et al. (2021) Gaia Collaboration et al., 2021, A&A, 649, A1
- García & Ballot (2019) García R. A., Ballot J., 2019, Living Reviews in Solar Physics, 16, 4
- García et al. (2014) García R. A., et al., 2014, A&A, 568, A10
- Grundahl et al. (2014) Grundahl F., et al., 2014, in Guzik J. A., Chaplin W. J., Handler G., Pigulski A., eds, IAU Symposium Vol. 301, IAU Symposium. pp 69–75, doi:10.1017/S1743921313014117
- Halbwachs (1986) Halbwachs J. L., 1986, A&AS, 66, 131
- Harper (1914) Harper W. E., 1914, Publications of the Dominion Observatory Ottawa, 1, 301
- Høg et al. (2000a) Høg E., et al., 2000a, A&A, 355, L27
- Høg et al. (2000b) Høg E., et al., 2000b, A&A, 357, 367
- Hosking & Wallis (1997) Hosking J. R. M., Wallis J. R., 1997, Regional Frequency Analysis. Cambridge Univ. Press, Cambridge
- Howell et al. (2014) Howell S. B., et al., 2014, PASP, 126, 398
- Huber et al. (2019) Huber D., et al., 2019, AJ, 157, 245
- Huber et al. (2022) Huber D., et al., 2022, AJ, 163, 79
- Hut (1981) Hut P., 1981, A&A, 99, 126
- Jiang & Gizon (2021) Jiang C., Gizon L., 2021, Research in Astronomy and Astrophysics, 21, 226
- Jiang et al. (2011) Jiang C., et al., 2011, ApJ, 742, 120
- Kervella et al. (2017) Kervella P., Bigot L., Gallenne A., Thévenin F., 2017, A&A, 597, A137
- Kjeldsen & Bedding (1995) Kjeldsen H., Bedding T. R., 1995, A&A, 293, 87
- Kjeldsen et al. (2005) Kjeldsen H., et al., 2005, ApJ, 635, 1281
- Konacki et al. (2010) Konacki M., Muterspaugh M. W., Kulkarni S. R., Hełminiak K. G., 2010, ApJ, 719, 1293
- LaPlace (1814) LaPlace P. S., 1814, Essai philosophique sur les probabilités. Courcier
- Lèbre et al. (1999) Lèbre A., de Laverny P., de Medeiros J. R., Charbonnel C., da Silva L., 1999, A&A, 345, 936
- Mathur et al. (2010) Mathur S., García R. A., Régulo C., et al. 2010, A&A, 511, A46
- Maxted et al. (2020) Maxted P. F. L., et al., 2020, MNRAS, 498, 332
- Mermilliod (2006) Mermilliod J. C., 2006, VizieR Online Data Catalog, p. II/168
- Merrill (1922) Merrill P. W., 1922, ApJ, 56, 40
- Metcalfe et al. (2012) Metcalfe T. S., et al., 2012, ApJ, 748, L10
- Metcalfe et al. (2020) Metcalfe T. S., et al., 2020, ApJ, 900, 154
- Metcalfe et al. (2021) Metcalfe T. S., et al., 2021, ApJ, 921, 122
- Miglio et al. (2007) Miglio A., Montalbán J., Maceroni C., 2007, MNRAS, 377, 373
- Miglio et al. (2014) Miglio A., Chaplin W. J., Farmer R., Kolb U., Girardi L., Elsworth Y., Appourchaux T., Handberg R., 2014, ApJ, 784, L3
- Nielsen et al. (2020) Nielsen M. B., et al., 2020, A&A, 641, A25
- Paunzen (2015) Paunzen E., 2015, A&A, 580, A23
- Paxton et al. (2019) Paxton B., et al., 2019, ApJS, 243, 10
- Pires et al. (2015) Pires S., Mathur S., García R. A., Ballot J., Stello D., Sato K., 2015, A&A, 574, A18
- Ricker et al. (2015) Ricker G. R., et al., 2015, Journal of Astronomical Telescopes, Instruments, and Systems, 1, 014003
- Riello et al. (2021) Riello M., et al., 2021, A&A, 649, A3
- Silva Aguirre et al. (2017) Silva Aguirre V., et al., 2017, ApJ, 835, 173
- Skrutskie et al. (2006) Skrutskie M. F., et al., 2006, AJ, 131, 1163
- Stassun & Torres (2016) Stassun K. G., Torres G., 2016, AJ, 152, 180
- Stassun et al. (2017) Stassun K. G., Collins K. A., Gaudi B. S., 2017, AJ, 153, 136
- Stassun et al. (2018) Stassun K. G., Corsaro E., Pepper J. A., Gaudi B. S., 2018, AJ, 155, 22
- Stone (1961) Stone M., 1961, Ann. Math. Statist., 32, 1339
- Thompson et al. (1978) Thompson G. I., Nandy K., Jamar C., Monfils A., Houziaux L., Carnochan D. J., Wilson R., 1978, Catalogue of stellar ultraviolet fluxes : a compilation of absolute stellar fluxes measured by the Sky Survey Telescope (S2/68) aboard the ESRO satellite TD-1 /. Science Research Council
- Tomkin & Fekel (2006) Tomkin J., Fekel F. C., 2006, AJ, 131, 2652
- Townsend & Teitler (2013) Townsend R. H. D., Teitler S. A., 2013, MNRAS, 435, 3406
- Townsend et al. (2018) Townsend R. H. D., Goldstein J., Zweibel E. G., 2018, MNRAS, 475, 879
- Ulrich (1986) Ulrich R. K., 1986, ApJ, 306, L37
- White et al. (2012) White T. R., et al., 2012, ApJ, 751, L36
- White et al. (2017) White T. R., et al., 2017, A&A, 601, A82
- Wright et al. (2010) Wright E. L., et al., 2010, AJ, 140, 1868
- Çelik Orhan et al. (2021) Çelik Orhan Z., Yıldız M., Kayhan C., 2021, MNRAS, 503, 4529
- de Medeiros & Udry (1999) de Medeiros J. R., Udry S., 1999, A&A, 346, 532