Collision centrality and energy dependence of strange hadron production
in Au + Au collisions at 7.7-54.4 GeV
Yan-ting Feng
School of Physics and Physical Engineering, Qufu Normal University,
Shandong 273165, China
Zi-yao Song
School of Physics and Physical Engineering, Qufu Normal University,
Shandong 273165, China
Feng-lan Shao
shaofl@mail.sdu.edu.cnSchool of Physics and Physical Engineering, Qufu Normal University,
Shandong 273165, China
Jun Song
songjun2011@jnxy.edu.cnSchool of Physical Science and Intelligent Engineering, Jining University,
Shandong 273155, China
Abstract
We apply an equal-velocity quark combination model to systematically
study the transverse momentum () spectra of strange hadrons
, , , ,
, , and
at mid-rapidity in Au+Au collisions at 7.7, 11.5,
19.6, 27, 39, 54.4 GeV. Relative deviation between the model calculation
and experimental data of these eight hadrons is generally about 2-3%
at 27, 39, 54.4 GeV and in central collisions at
7.7, 11.5, 19.6 GeV. The deviation slightly increases up to about
4% in the semi-central and peripheral collision at
7.7, 11.5, 19.6 GeV. We systematically explain the dependence of two
baryon-to-meson ratios and
on , collision centrality and collision energy by the property
of quark spectra at hadronization. We derive the analytic
relations between of hadrons and those of quarks, and we
use them to naturally explain the species and dependence
of of those strange hadrons.
I Introduction
Strange hadrons are excellent probes of high-energy collisions. The
enhancement of strange hadrons was proposed as a signal of quark-gluon
plasma (QGP) formation (Rafelski and Muller, 1982), and it was widely
observed in relativistic heavy-ion collisions at SPS, RHIC and LHC
(Abelev et al., 2008, 2014; Alt et al., 2008). In recent years,
Beam Energy Scan (BES) experiments of STAR collaboration at RHIC have
obtained rich experimental data of yield and transverse momentum ()
spectra of strange hadrons in Au+Au collisions at
7.7-54.4 GeV (Adam et al., 2020a; Adamczyk et al., 2016a; Ashraf, 2019; Huang, 2021, 2022).
These experimental data contain valuable information on the property
of hot nuclear matter and QCD phase transition at the finite baryon
chemical potential, the mechanism of hadron production at hadronization,
etc.
Existing theoretical studieson these newest data of strange
hadrons at STAR are mainly of the global information on hadron freeze-out.
Statistical model analysis on yield data of strange hadrons obtain
the temperature and baryon chemical potential at the chemical freeze-out
of hadrons (Adam et al., 2020a; Flor et al., 2021). Analysis on
spectra data of strange hadrons provide the kinematic freeze-out temperature
and collective radial flow at kinetic freeze-out of hadrons (Adam et al., 2020a).
There also exist phenomenological extension by introducing Tsallis
statistics at kinetic freeze-out to obtain a non-equilibrium parameter
besides the temperature and radial velocity (Chen et al., 2021; Li et al., 2022; Waqas et al., 2020).
On the other hand, the microscopic mechanism of strange hadrons production
from the final-state parton systems created in heavy-ion collisions
at STAR BES energies is also necessary to be studied in details. For
example, we have known from the early heavy-ion collision experiments
at RHIC (Greco et al., 2003; Fries et al., 2003; Molnar and Voloshin, 2003; Hwa and Yang, 2003; Chen and Ko, 2006)
that the quark combination mechanism at hadronization is an effective
mechanism to explain the hadron production in relativistic heavy-ion
collisions. How about the performance of this mechanism at STAR BES
energies? The answer is not completely clear since the existing theoretical
studies and comparison with the newest STAR data are relatively lack
(Jin et al., 2018; Song et al., 2021a; Ye et al., 2017). Further studies are
necessary for deeply understanding the hadron production in heavy-ion
collisions at STAR BES energies, which can also serve as the basis
to better understand the hadron production in heavy-ion collisions
at lower energies in fixed target experiments of STAR collaboration.
In this paper, we apply a quark combination model (Song et al., 2017, 2021a, 2018)
to carry out a systematic study on spectra of strange hadrons
, , , , , ,
and at mid-rapidity in Au+Au
collisions in different centralities at 7.7, 11.5,
19.6, 27, 39, 54.4 GeV. By a global fit to experimental data for
spectra of eight hadrons, we study the performance of equal-velocity
combination (EVC) mechanism of constituent quark and antiquarks at
hadronization, and we study the significance of the hadronization
process imprinted in the final observation of strange hadrons. We
also study two baryon-to-meson ratios and
as the function of , where we focus on the
self-consistent explanation on the collision centrality and energy
dependence of two ratios by the properties of quark distributions
at hadronization. In study of the nuclear modification factor
of strange hadrons, we drive several analytic relations between
of hadrons and those of quarks, and we use them to naturally explain
the species dependence of of different hadrons.
The paper is organized as follows. In Sec. II,
we briefly introduce the model we used in this paper. In Sec. III,
we show the global description of spectra of strange hadrons
in different centralities at 7.7-54.4 GeV. In Sec. IV,
we discuss the centrality and collision energy dependence of baryon-to-meson
ratios. In Sec. V, we study the nuclear modification
factor of strange hadrons. The summary is given in Sec. VI.
II A QUARK COMBINATION MODEL WITH EVC
In this section, we briefly introduce a quark combination model used
in this paper. The model was firstly proposed in (Song et al., 2017)
based on the finding of the quark number scaling property of hadronic
spectra in Pb collisions at LHC energy. Subsequently,
this scaling property was further found in and AA collisions
at both RHIC and LHC energies and the model was systematically tested
by the experimental data of hadronic spectra and elliptic
flow in those collisions (Song et al., 2018; Li et al., 2018; Zhang et al., 2020; Song et al., 2020, 2021a; Li et al., 2021; Wang et al., 2020).
In the framework of quark combination mechanism, the inclusive momentum
distribution of baryon and meson
can be obtained by
(1)
(2)
Here, is the
joint momentum distribution function for and
is that for .
denotes
the probability density for a given with momenta
, and forming a baryon with momentum
. denotes
the probability density for a given with momenta
and forming a meson with momentum .
The hadronization is a non-perturbative process and the combination
kernel functions and
are hard to determine from the first principle calculation at the
moment. Inspired by the quark number scaling property for hadronic
spectra at LHC (Song et al., 2017; Gou et al., 2017; Song et al., 2020),
we can take the equal-velocity combination of constituent quarks and
antiquarks as the main feature of hadron formation. In this case,
we have
(3)
(4)
Momentum fraction in baryon formula is
and that in meson formula is .
is the constituent mass for quark of flavor , and we take 0.5
GeV, 0.3 GeV. and
are coefficients and independent of the momentum.
For the joint momentum distribution of quarks and antiquarks, we take
the factorization approximation,
(5)
(6)
Substituting Eqs. (3)-(6) into Eqs. (1)
and (2), we obtain
(7)
(8)
We see that the momentum spectrum of hadron is simply the product
of those of quarks at hadronization. This simple form yields some
interesting flavor correlation among momentum distribution of different
hadrons, e.g, those at spectra (Song et al., 2017, 2020)
and elliptic flows of different hadrons (Song et al., 2021b).
Coefficient and are independent
of momentum but dependent on quark numbers. To determine them and
clarify their physical meaning and importance, we write Eqs. (7)
and (8) as
(9)
(10)
by introducing the normalized quark distribution .
At the same time, we write hadron distribution as
Clearly, in Eq. (13) serves
as the momentum-integrated probability of forming
a baryon . in Eq. (14)
denotes that of forming a meson . Supposing
that quark system doubles in size, i.e., doubles, then
after hadronization should also double. However
in Eq. (13) increases 8 times and
in Eq. (14) increases 4 times. Therefore, probability
in Eq. (13) and
in Eq. (14) should also play the role of the re-normalization
to guarantee the unitarity of the hadronization. Following this argument,
we can parameterize them as
(17)
(18)
Here, with
in heavy-ion collisions is the combination number of all .
is the average number of all baryons. Then,
can denote the average probability of three quarks forming a baryon.
The factor is the permutation number of ,
and equals to 1, 3, 6 for with identical flavors,
two identical flavors, and three different flavors, respectively.
is a refined parameter to account for the probability
of forming different spin state at quark combination. The meson formula
is similar. denotes the average
probability of a pair forming a meson. account
for the probability of forming the meson with given spin state.
In this paper, we only consider the production of ground state meson
and baryon
in flavor SU(3) group. We introduce a parameter to denote
the relative probability of forming decuplet baryon to octet baryon
with the same quark flavor, and introduce a parameter to
denote the relative probability of vector meson to pseudo-scalar meson
with same quark flavor. Then and can be
written as
(19)
except , ,
and
(20)
Here, we take to reproduce the experimental
data of yield ratios and in high energy
and Pb collisions (Adam et al., 2016; Acharya et al., 2020). We take
by fitting the experimental data of yield ratios
and in high-energy collisions
(Adamova et al., 2017).
For global production of baryons and mesons, i.e.,
and , we have obtained their empirical solution
(Song and Shao, 2013),
(21)
(22)
(23)
where and .
characterizes
the production competition of baryon to meson at and is tuned
to be in relativistic heavy-ion collisions (Shao et al., 2017).
When quark distributions are given, momentum
distributions of hadrons and their integrated
yields can be directly calculated using the model. In order
to compare with experimental data, the decay contribution of short-life
resonance should be also considered,
(24)
The decay function is determined by the
decay kinematics and decay branch ratios (Olive et al., 2014).
III TRANSVERSE MOMENTUM SPECTRUM OF STRANGE HADRONS
In this section, we use the above EVC model to calculate
spectra of strange hadrons at mid-rapidity in Au + Au collisions at
7.7, 11.5, 19.6, 27, 39 and 54.4 GeV, and make systematic
comparison with the experimental data (Adam et al., 2020b; Adamczyk et al., 2016b; Huang, 2021, 2022; Ashraf, 2019).
First, we reduce the formulas in the model to those in one-dimensional
space at mid-rapidity . The momentum distribution function
reduces to and momentum integration
in Eqs. (15) and (16) reduce to integration.
The model needs spectra of quarks and antiquarks at hadronization
as the input, which are difficult to obtain from first
principle calculations. Here, we take the following parametrization
form for the normalized quark spectrum
(25)
where is a normalized constant to assure .
Parameters , , , , control
the shape of the spectrum. We also need the numbers of quarks and
antiquarks so that
can be used to calculate spectra of hadrons in our model.
For hadron production at mid-rapidity at the studied collision energies,
we take the approximate isospin symmetry between up and down quarks,
i.e., and .
We also assume the strangeness neutrality
according to our previous work (Song et al., 2021a). Finally, we
need three inputs , and
to calculate spectra of light-flavor hadrons. They are fixed
by fitting experimental data of identified hadrons in our model. Specifically,
experimental data of spectrum of are used to fix
, i.e., quark number and spectra parameters
, , , and . Because experimental
data for spectra of proton and antiproton are available only
at GeV/c (Adamczyk et al., 2017), they can only constrain
spectra of up quarks in a narrow range (
GeV/c) and therefore we alternatively use experimental data for
spectra of and which cover a wider
range to fix and , respectively.
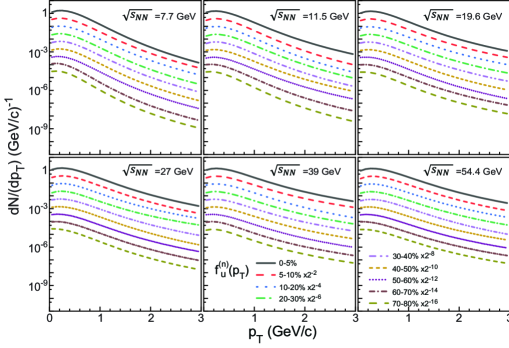
Results for quark spectra at mid-rapidity in Au+Au collisions
in different centralities at 7.7, 11.5, 19.6, 27,
39, 54.4 GeV are shown in Figs. 1-3.
Their properties are discussed latter in studying the baryon-to-meson
ratios in Sec. IV and nuclear modification
factors of hadrons in Sec. V.
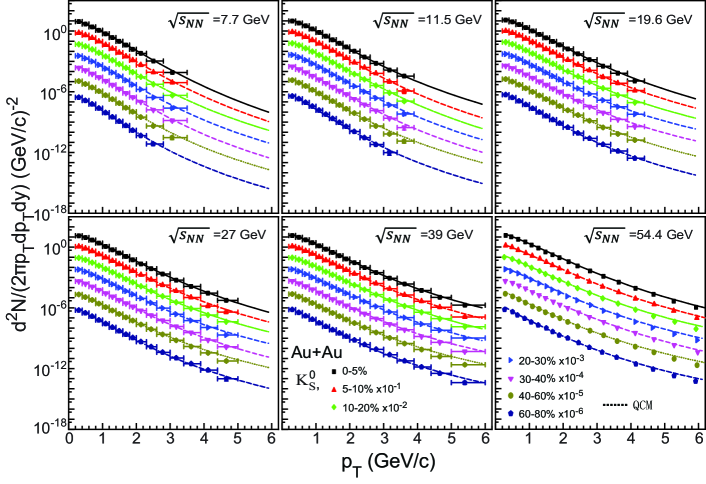
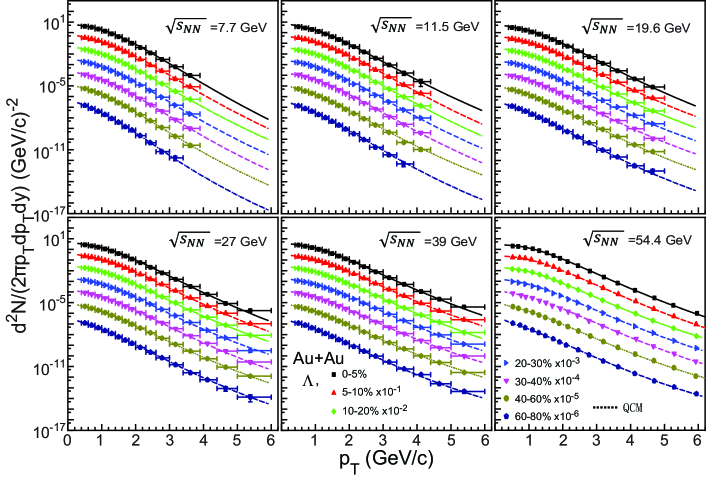
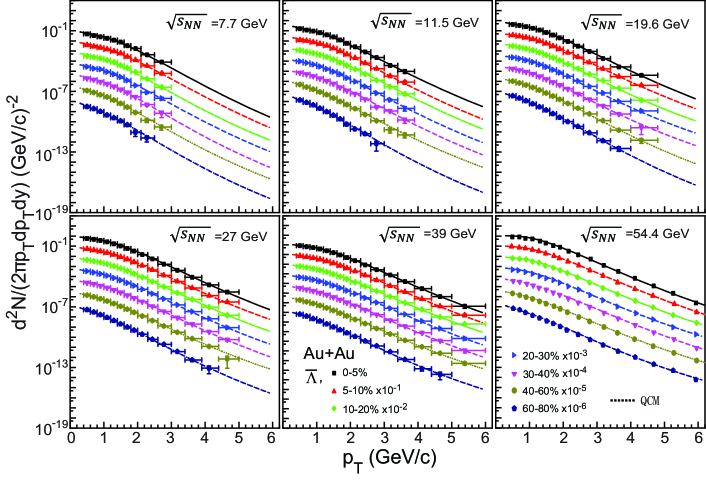
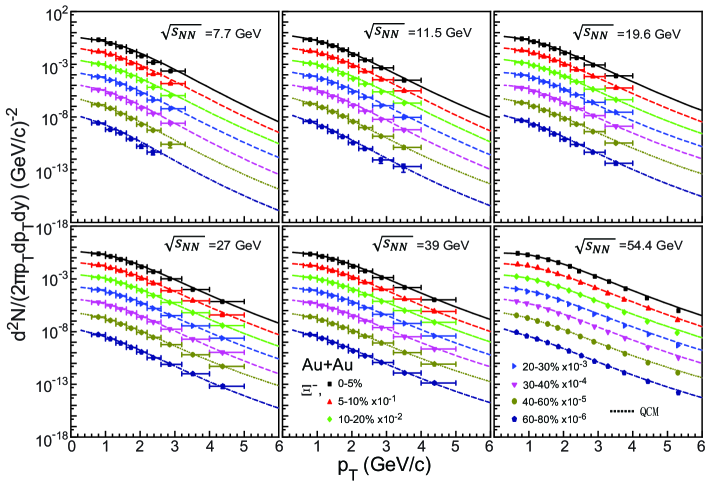
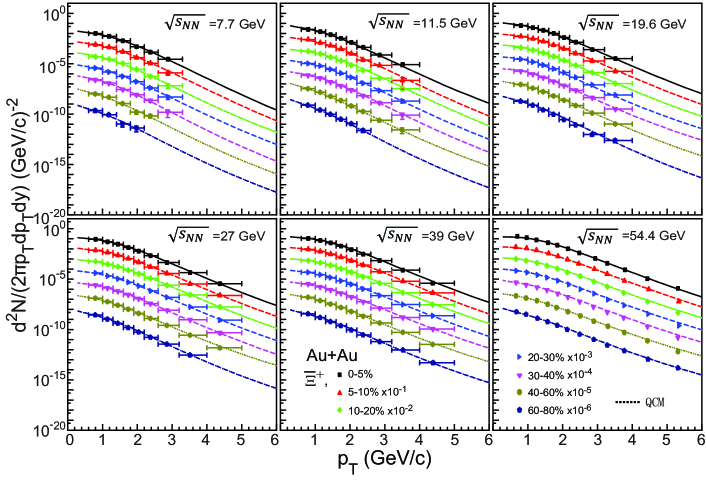
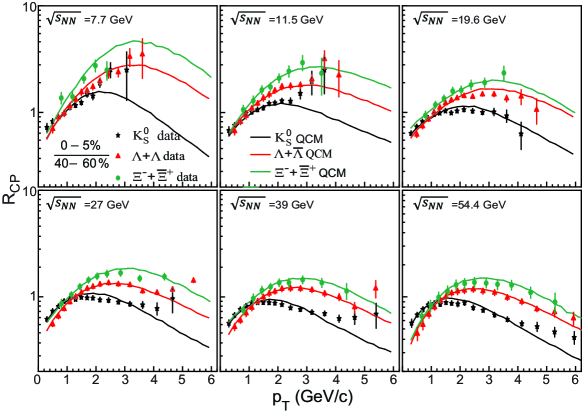
Figs. 4-11 show model results for
spectra of different strange hadrons and their comparison with experimental
data (Adam et al., 2020b; Adamczyk et al., 2016b; Huang, 2021; Ashraf, 2019).
Besides three hadrons , , which
are used to constrain quark spectra, results of other hadrons
, , , as
well as 111The spectrum of is calculated as the equal weight
mixing of that of and . In addition, because
kaon mass is smaller than the sum of constituent masses of down and
strange quarks used in this paper, the direct combination of down
and strange (anti-)quark is difficult to directly form the on-shell
kaon. Therefore, we modify the kaon formation in EVC mechanism as
follows: The combination of up/down and strange quark has a large
probability () to firstly form an intermediate resonance like
and then decays into the on-shell kaon and pion; it
has a small probabilities () to directly from the on-shell
kaon. Here, we take and so that
GeV approximately equals to and approximately satisfies
energy conservation. are shown as theoretical prediction. In addition, we also calculate
spectra of proton and antiproton and find they are in good
agreement with the available data at GeV/c, which are not
shown here since we focus on strange hadrons in this paper. The systematic
comparison between model results of eight strange hadrons and their
experimental data can effectively test our model.
Considering that the coverage and statistical uncertainties
of experiment data of these hadrons are different in different centralities
and/or at different collision energies, here in stead of the standard
evaluation, we use the relative deviation
(26)
to quantify our model description. Here, is the
central value of experimental data. Index runs over all datum
points of eight hadrons presented in Figs. 4-11
in the given collision centrality and at the given collision energy.
Results of are shown in Table. 1.
We see that the relative deviation in the studied
collision centralities and collision energy range is generally a few
percentages. at 19.6, 27, 39 and
54.4 GeV is about 0.02 in all collision centralities.
in semi-central and peripheral collisions at7.7 and
11.5 GeV is about 0.03-0.04, which is larger than, to a certain extent,
that in peripheral collisions at the two energies and those at higher
collision energies.
Figure 1: The spectra of quark in different centrality in Au +
Au collisions at =7.7, 11.5, 19.6, 27, 39, 54.4 GeV.
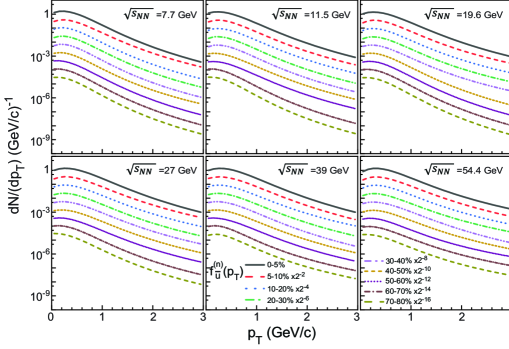
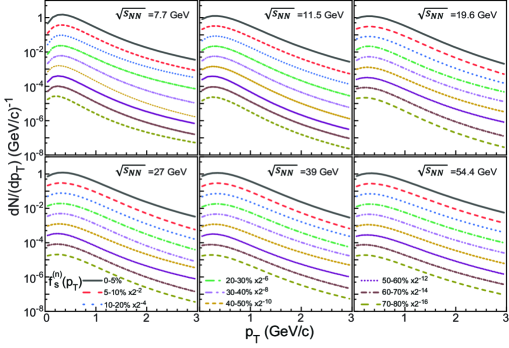
Figure 2: The same as 1 but for . Figure 3: The same as 1 but for .
Table 1: Relative deviation of theory and experiment for various
collision centralities and energy in Au+Au collisions at
7.7-54.4 GeV (Adam et al., 2020b; Adamczyk et al., 2016b; Huang, 2021, 2022; Ashraf, 2019).
Centrality
7.7
11.5
19.6
27
39
54.4
0 − 5%
0.0279
0.0170
0.0189
0.0166
0.0167
0.0214
5 − 10%
0.0442
0.0341
0.0265
0.0308
0.0240
0.0243
10 − 20%
0.0263
0.0226
0.0129
0.0121
0.0167
0.0226
20 − 30%
0.0265
0.0286
0.0174
0.0138
0.0120
0.0305
30 − 40%
0.0236
0.0285
0.0197
0.0134
0.0193
0.0248
40 − 60%
0.0412
0.0325
0.0159
0.0224
0.0181
0.0241
60 − 80%
0.0436
0.0411
0.0256
0.0205
0.0209
0.0228
The small values of indicate that experimental data
of spectra of these eight hadrons in Au+Au collisions at
=7.7-54.4 GeV can be self-consistently described by
our model. Such a global agreement therefore indicates the important
role of EVC mechanism at hadron production in these collisions. In
the following two sections, we further test our model by the baryon-to-meson
ratios and nuclear modification factors of identified hadrons, which
are more sensitive to hadron production mechanism in heavy-ion collisions.
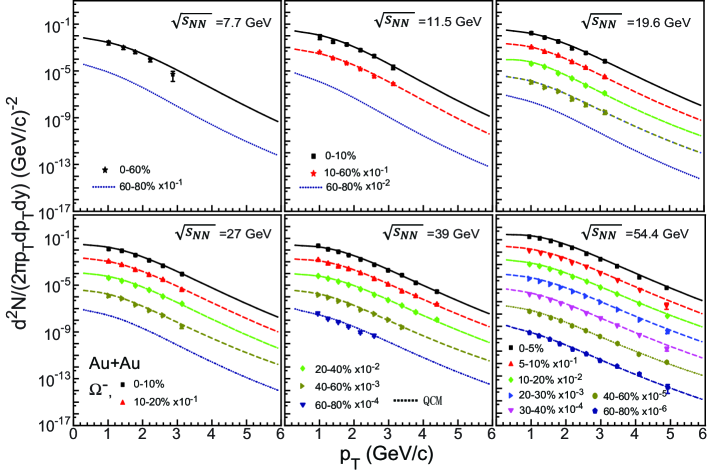
Figure 4: The spectra of at mid-rapidity ()
from Au + Au collisions at =7.7-54.4 GeV. Symbols
are the experimental data (Adam et al., 2020b; Huang, 2021; Ashraf, 2019)
and lines are the results of our model. Spectra of some hadrons are
scaled by factors 10 from central to peripheral collisions for clarity.
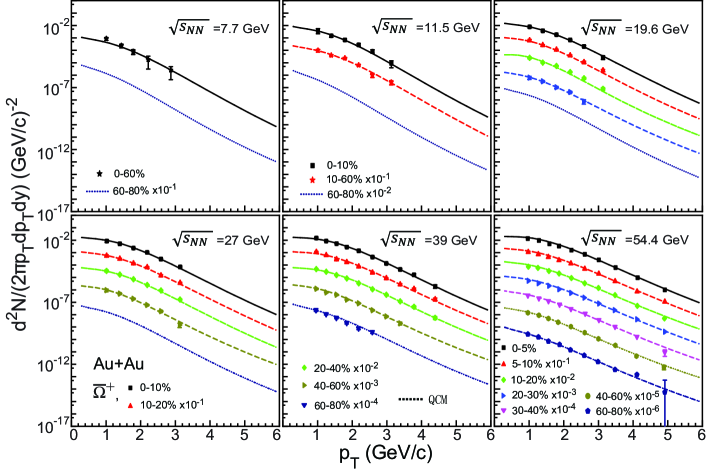
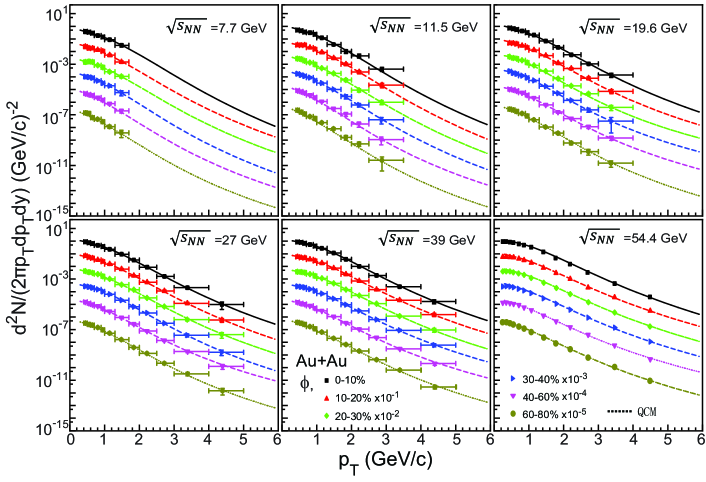
Figure 5: The same as Fig. 4 but for .Figure 6: The same as Fig. 4 but for .Figure 7: The same as Fig. 4 but for .Figure 8: The same as Fig. 4 but for .Figure 9: The same as Fig. 4 but for . Experimental
data are from (Adamczyk et al., 2016b; Huang, 2021). Figure 10: The same as Fig. 9 but for .Figure 11: The same as Fig. 9 but for .
IV BARYON TO MESON RATIOS
Baryon-to-meson ratio is a sensitive physical quantity to check the
hadronization mechanism. RHIC experiments at the early years had shown
an enhancement of baryon-to-meson ratios at the intermediate
in heavy-ion collisions. This enhancement is difficultly understood
in traditional fragmentation mechanism but can be naturally described
in quark (re-)combination mechanism. In this section, we study
and ratios at/in different collision energies and/or
centralities.
In Fig. 12, we show the results of
as the function of in Au+Au collisions with different centralities
at GeV and compare them with experimental
data (Adam et al., 2020b; Ashraf, 2019). Experiment data of
ratio exhibit an obvious dependence on
the collision energy and centrality. We see an obvious decrease of
the ratio with the decrease of collision energy. From central collisions
to peripheral collisions, we also see the decrease of the ratio. The
decrease magnitude of with collision centrality
is generally slower than that with collision energy. For experimental
data of the central and semi-central collisions which have rich data
points and cover broad range, we always see a non-monotonic
dependence of the ratio. The solid
lines are our model results. They are generally in good agreement
with experimental data. In the following text, we explain the underlying
physics for the , collision energy and centrality dependence
of the ratio.
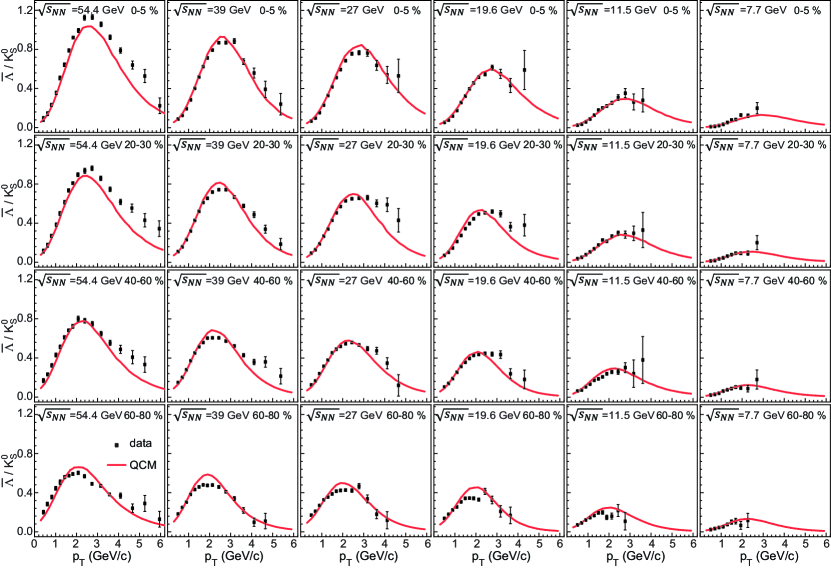
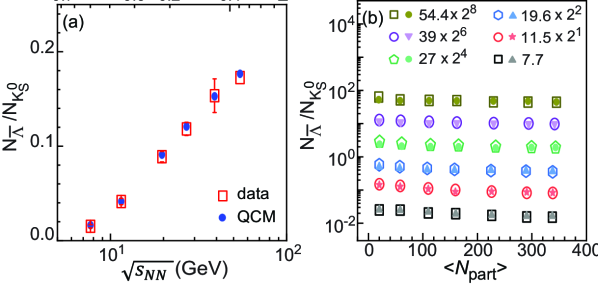
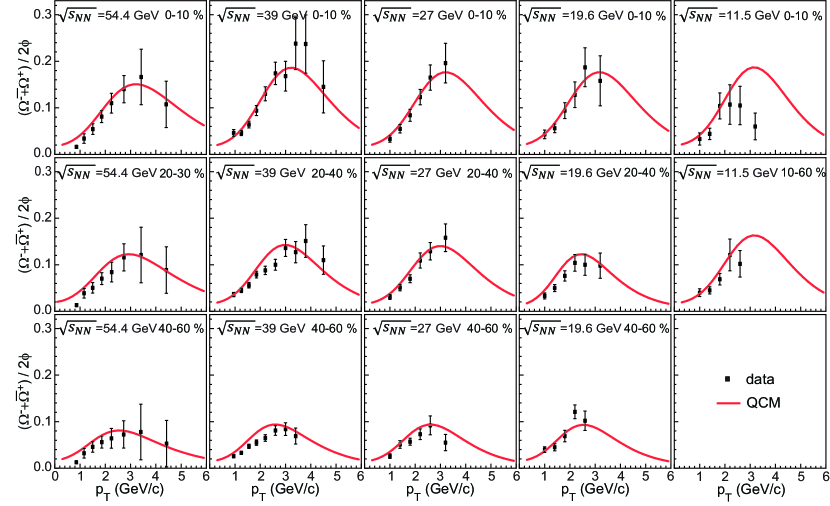
Figure 12: / ratio as a function of at mid-rapidity
() for various collision centralities in Au + Au collisions
at =7.7-54.4 GeV. Symbols are experimental data (Adam et al., 2020b; Ashraf, 2019)
and lines are results of our model.
Firstly, we explain the non-monotonic dependence of the
ratio. We examine the property of quark spectra shown in
Figs. 1-3 which is parameterized in Eq. (25).
In the range GeV/c (i.e., at low for
quarks), quark spectrum behaves approximately as
(27)
where the exponent parameter and slop parameter .
Then ratio in the low range (
3 GeV/c)
(28)
where we use to simplify the
expression. Because the exponential terms change weakly with ,
the behavior of ratio in the low
range is therefore mainly determined by , which
is a rapidly increasing function.
In the range GeV/c, quark spectrum behaves
approximately as
(29)
where the stretch parameter and and indices parameter .
In the studied collision energies and centralities, is about
1-5 and is about 6-20. ratio in
the range ( 3 GeV/c)
(30)
where with and
with . Clearly, is the
dominant term to drive ratio decrease with
and terms
and
only weaken the influence of the first term to a certain. Combining
the effect of property of quark spectra in the low
range in Eq. (28) and that in the
range in Eq. (30), we now can understand
the increase of in the range
GeV/c and subsequently its decrease in the range
GeV/c.
Secondly, we explain that the energy dependence of the
ratio shown in Fig. 12, see the model calculation and
experimental data in a row. There are two main physical ingredients
that influence the ratio. The first is
the relatively rapid increase of baryon chemical potential with the
decrease of collision energy. In our model, an asymmetry factor of
quark-antiquark number is defined as
(31)
which closely relates to baryon chemical potential. causes the
production asymmetry between particles and antiparticles in our model
(Song and Shao, 2013). At intermediate and low RHIC energies,
is positive and is about . This will suppress the production
of anti-baryons. Therefore, the yield of is largely
suppressed and this the main reason for the decrease of
with the decrease of collision energy shown in Fig. 12.
To illustrate it, we calculate the yield ratio of
to and after considering the resonance decays we obtain
(32)
where
(33)
with leading to
in high energy collisions (Song and Shao, 2013; Shao et al., 2017). According
to the quark spectra in Figs. 1-3,
we can calculate in at different collision energies and the results
of yield ratio are shown in Fig. 13(a)
and compared with experimental data (Adam et al., 2020b; Ashraf, 2019).
We see that it decrease rapidly with the decrease of collision energy
(i.e., the increase of ). This is the main reason for the globally
rapid decrease of ratio as the function
of shown in Fig. 12. Another reason that influences
the behavior of ratio as the function of
is the shape change of quark spectra, which might
not be clearly seen from Figs. 1-3. Actually,
the extended range of thermal behavior of quark
spectra in Eq. 27 shrink with the decrease of
collision energy. This will also weaken the increasing trend of
ratio in the low range.
Figure 13: (a) The collision energy dependence of
ratios at mid-rapidity () in central Au + Au collisions
at =7.7-54.4 GeV. The upper horizontal axis show
of quarks; (b) as functions of
from Au+Au collisions at=7.7-54.4
GeV. Open symbols are experimental data (Adam et al., 2020b; Ashraf, 2019)
and solid symbols are model results .
Thirdly, we understand the centrality dependence of
ratio shown in Fig. 12, see the calculation results
and experimental data in a column. As shown in Fig. 13(b),
the yield ratio changes weakly with collision
centrality at the studied collision energies. Therefore, the weak
change of contributes small centrality dependence to
ratio as the function of . Actually, the main influence ingredient
comes from the change of quark spectra at different collision
centralities. From Figs. 1-3, we see
a clear shrink of thermal component for quark spectra in
peripheral collisions. This will cause the increase of
ratio in the low range stops at smaller in peripheral
collisions than that in central collisions. The maximum value of
ratio can reach in peripheral collisions also smaller than that in
central collisions.
Figure 14: ratio as a function of at mid-rapidity ()
for various collision centralities in Au + Au collisions at =11.5-54.4
GeV. Symbols are experimental data (Adamczyk et al., 2016b; Huang, 2021, 2022)
and lines are results of our model.
Fig. 14 show ratio as the function of
in Au+Au collisions. Here, denotes .
Symbols are experimental data (Adamczyk et al., 2016b; Huang, 2021, 2022)
and lines are model results. We see that our model results are generally
in good agreement with the experimental data.
The underlying physics for the non-monotonic dependence of
ratio in our model is quite similar with that discussed
in above ratio. The difference in property
between quark spectra in the small range 1
GeV/c and that in range 1 GeV/c leads to the
ratio firstly increases with and then decrease with .
Because the production of and involves only strange
(anti-)quarks, dependence of ratio can be
seen more clear by the slope of the ratio
(34)
with , which is obtained in our recent work
(Li et al., 2021). This equation means that the second derivative
of the logarithm of strange quark spectrum determine the increase
or decrease of the ratio. In Fig. 3
with logarithmic vertical coordinate, we can intuitively see the sign
of is negative in the range
GeV/c and is positive as GeV/c, which directly
causes the increase of ratio in the range
GeV/c and the decrease of the ratio as further increases.
The collision energy dependence of ratio in Fig. 14,
see results and data in a row, is not strong. This is mainly because
the yield ratio, as shown in Fig. 15(a),
change weakly at the studied collision energies. The centrality dependence
of ratio in Fig. 14, see results and
data in a column, is relatively obvious. This is mainly because of
the shape change of strange quark spectrum in different collision
centralities. From Fig. 3, we see a clear shrink of
thermal component for strange quark spectra in peripheral
collisions. This leads to the relatively weak increase of the
ratio in the low range and the relatively smaller
at which ratio begins to decrease in the peripheral
collisions. The centrality dependence of yield ratio
is shown in Fig. 15(b). We see that
yield ratio in central collisions is larger than that in peripheral
collisions to a certain extent. This is because of the increase of
strange quarks fraction in central collisions. This
will cause the global increase of as the function of
in central collisions, in comparison with the
ratio in peripheral collisions.
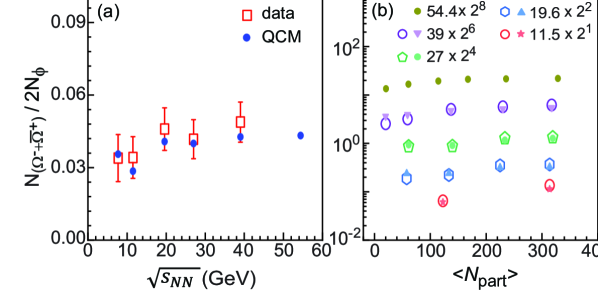
Figure 15: (a) The collision energy dependence of
ratios at mid-rapidity () in Au + Au collisions at =7.7-54.4
GeV; (b) as functions
of from Au+Au collisions at
=11.5-54.4 GeV. Open symbols are experimental data (Adamczyk et al., 2016b; Huang, 2021, 2022)
and solid symbols are model results.
V NUCLEAR MODIFICATION FACTOR
The nuclear modification factor () of the final hadrons is
an important physical observable to quantify the difference between
hadron production in central collisions and that in peripheral collisions.
is defined as
(35)
Here is the number of binary nucleon-nucleon collisions
determined from Glauber model (Miller et al., 2007). In general,
of hadrons in relativistic heavy-ion collisions has a
dependence. The property of at high is driven by
jet quenching physics. In this paper, we focus on the property of
of hadrons in the low and intermediate range, i.e.,
GeV/c for mesons and 6 GeV/c for
baryons. The formation of hadrons in this range in our EVC mechanism
is by the combination of soft quarks and antiquarks with low transverse
momenta GeV/c.
Because spectra of hadrons in EVC mechanism exhibit relatively
simple relationship with those of quarks and antiquarks at hadronization,
of hadrons can also exhibit some interesting properties
relating to quark flavor composition of hadron. Substituting Eq. (7)
into Eq. (35), we obtain
(36)
In the third line, we have used Eq. (17).
In the last line, we extend Eq. (35) to quarks at
hadronization. By rewriting
(37)
we finally obtain
(38)
We see that of baryons directly relates to the product of
those of quarks. is only slightly smaller
than one because in central collisions is slightly greater
than in peripheral collisions. Coefficient
is slightly smaller than one because quark spectra become
steeper to a certain extend when collision impact factor becomes large.
Coefficient
is slightly greater than one because
in Glauber model (Miller et al., 2007) and
in our model. Therefore, coefficients in right hand side of Eq. (38)
is about one and the product of of quarks dominates
of baryons.
Fig. 16 show of and between
centrality and centrality . Symbols are experimental
data (Adamczyk et al., 2016b; Huang, 2021, 2022) and
lines are model results which are directly calculated from the numerical
results of spectra of and in Figs. 9-11.
We see that model results in Au+Au collisions at
19.6, 27, 39 and 54.4 GeV are in good agreement with experimental
data.
Figure 16: (0-10%)/(40-60%) of ,
, at mid-rapidity () in Au+Au collisions at =7.7-54.4
GeV. Symbols are experimental data (Adamczyk et al., 2016b; Huang, 2021, 2022)
and lines are results of our model.
Applying Eqs. (39) and (40), we can
naturally explain the different dependence of experimental
data for of and . As shown by Eqs.
(39) and (40),
and in the EVC mechanism relate to the third
and second power of . Now, we examine the behavior
of strange quark , which can be calculated with
Eq. (35) by strange quark spectra in Fig. 17
and the results are shown in Fig. 17. We see that
increases with in the range GeV/c and
turns to decrease with in the range GeV/c.
Because , should increase
with in the range GeV/c and then turns
to decrease with as GeV/c. Because ,
should increase with in the range
GeV/c and turns to decrease with as
GeV. Moreover, because relates to the third
power of but relates to the
square of , can not only
keep the increase trend in the larger range but also reach
higher magnitude, which are just seen in experimental data.
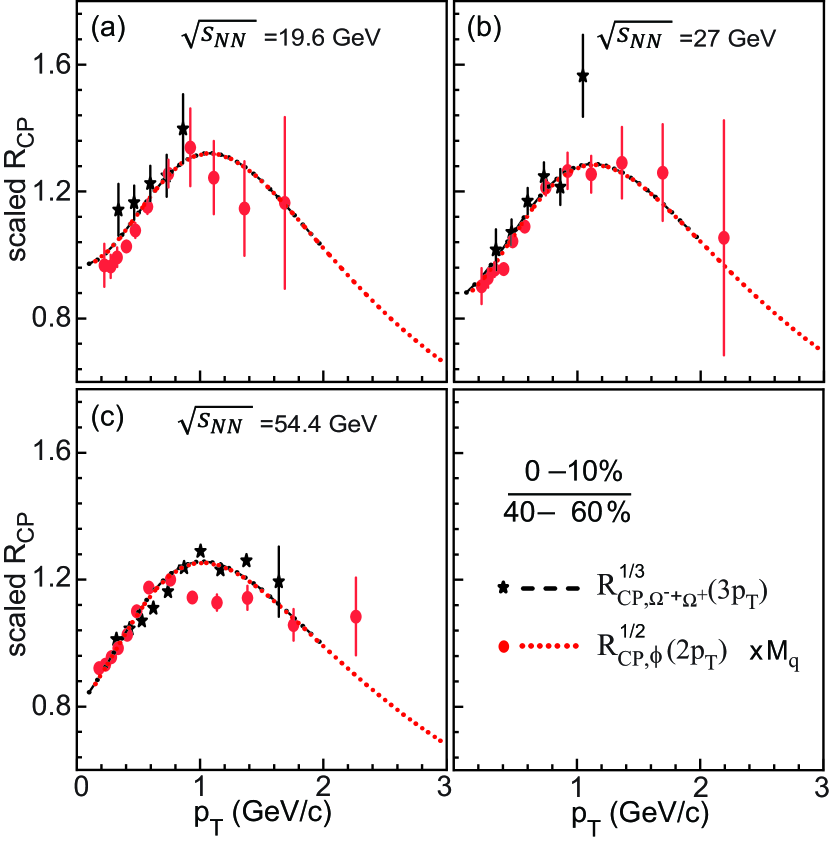
In view of this good agreement and simple expressions for
and in Eqs. (39) and (40),
we can further build a correlation
(41)
where
(42)
is close to one. Fig. 18 show the results of Eq. (41)
for experimental data of and . The coefficient
is 1.16, 1.15, 1.18 at three collisional energies, respectively. The
deviation of the from 1 is due to the influence of three
parts. Numerical calculations give the
is 1.03, 1.02, 1.06, the
is 1.05, 1.04, 1.01, and the
is 1.07, 1.08, 1.10, respectively.
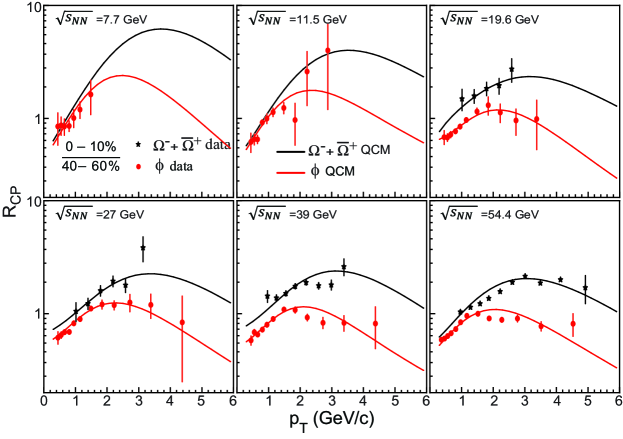
Figure 17: (0-5%)/(40-60%) of , and (0-10%)/(40-60%)
of at mid-rapidity () in Au+Au collisions at =7.7-54.4
GeV.Figure 18: The scaling property for (0-10%)/(40-60%) of
and at mid-rapidity () in Au+Au collisions at =7.7-54.4
GeV. Symbols are experimental data (Adamczyk et al., 2016b; Huang, 2021, 2022)
and lines are results of our model. The coefficient is 1.16,
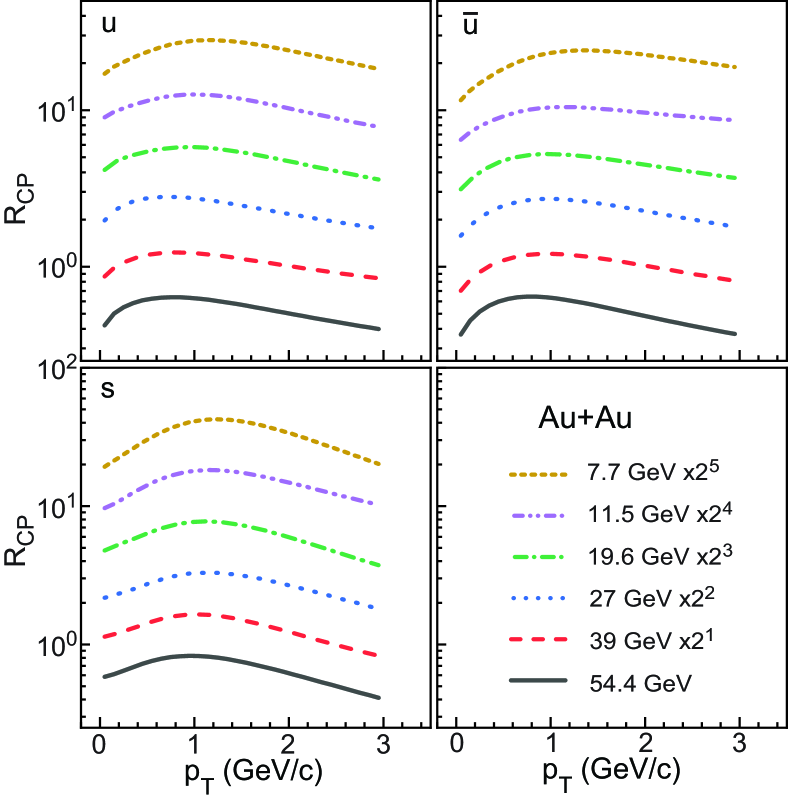
1.15 and 1.18, respectively. Figure 19: of , and
(0-5%)/(40-60%) at mid-rapidity () in Au+Au collisions
at =7.7-54.4 GeV. Symbols are experimental data (Adam et al., 2020b; Ashraf, 2019)
and lines are results of our model.
of , and in the EVC mechanism
are
(43)
(44)
(45)
of these hadrons not only depend on the of strange
quarks but also depend on that of up/down quarks.
Fig. 19 shows of , and
in Au+Au collisions at six collisional energies. Symbols are experimental
data (Adam et al., 2020b; Ashraf, 2019). Lines of different
kinds are our model results which are calculated from their model
results of inclusive spectra shown in Figs. 4-8.
We see that the experimental data of three hadrons exhibit some hierarchy
properties. Compared with of and ,
of at GeV reach the maximum
at a smaller (i.e., GeV/c) and is lower
than those of and as GeV/c.
of is smaller in magnitude than that of to a certain
extent but is quite similar with the latter in the global
dependence. Our model reproduce these hierarchy properties. The last
few points of for at 7.7
and 11.5 GeV in range GeV/c are close to those of
baryons, which is beyond the model expectation.
Using Eqs. (43)-(45) and of
quarks shown in Fig. 18, we can naturally explain the
experimental data of of , and .
We see that of , and are all dependent
on . of (anti-)quark increases with at
low and turns to decrease with as
1 GeV/c. of relates to the product of two quark
, and therefore of reaches the maximum
at GeV/c. of and relate
to the product of three quark , therefore they reaches the
maximum at GeV/c and the maximum values are higher
than that of . This is quite similar to the case of
and discussed above. We also see from Fig. 18
that of strange quarks has a stronger non-monotonic
dependence than that of and . In addition, because
the fraction of strange quarks (i.e., )
in central collisions is higher than that in peripheral collisions,
of strange quarks is globally higher than that of or
to a certain extent. Since has two strange quarks,
of has a stronger dependence than that of
and is globally higher than that of .
VI Summary
In this paper, we have applied an equal-velocity quark combination
to systematically study spectra of strange hadrons ,
, , , , ,
and at mid-rapidity in Au+Au
collisions at 7.7, 11.5, 19.6, 27, 39 and 54.4 GeV.
The model was proposed in (Song et al., 2017; Gou et al., 2017) by inspiration
of the quark number scaling property of hadronic spectra
in and Pb collisions at LHC energies and has a series of
successful applications in describing hadron production in and
Pb collisions at LHC as well as AA collisions at both RHIC and
LHC (Song et al., 2018; Li et al., 2018; Zhang et al., 2020; Song et al., 2020, 2021a; Li et al., 2021; Wang et al., 2020).
Application of this model to STAR BES energies can further test the
universal property of the hadronization in different collisions. In
the study, we focus on the self-consistent explanation on
spectra of strange hadrons at STAR BES energies. Therefore we not
only carried out the global comparison with spectra data
of these hadrons but also concentrated on baryon-to-meson ratios and
nuclear modification factor in the low and intermediate range
which are sensitive to hadronization mechanism.
We firstly carried out a global fit to experimental data of
spectra of strange hadrons. The model has three quark inputs, i.e.,
, and . We used
the data of , and to fix them and
subsequently calculated spectra of , ,
, , and compared
them with experimental data. We evaluated the relative deviation between
model calculation and experimental data of these eight hadrons. We
found that the relative deviation is generally about 2-3% at
27, 39, 54.4 GeV and in central collisions at 7.7, 11.5, 19.6 GeV.
The deviation slightly increases up to about 4% in semi-central and
peripheral collision at 7.7, 11.5, 19.6 GeV. These
results indicate that our model can give a globally consistent explanation
on spectra of these strange hadrons at the studied collision
energies.
We studied the dependence of two baryon-to-meson ratios
and on , collision centrality and collision
energy. By classifying the property of quark spectra in the
range GeV/c and that in the range
GeV/c, we provided an intuitive explanation on the increase of two
ratios in the range GeV/c and their subsequent
decrease at larger . Combining the extracted quark
spectra at hadronization, we further discussed the quark level origin
of the change of global magnitude and the movement of peak position
of two ratios in different collision centrality and at different collision
energies.
We studied the nuclear modification factor of strange hadrons.
Taking advantage of the analytic feature of EVC mechanism, we derived
the analytic expression for of hadrons and found that
of hadrons can be written as the product of those of quarks at hadronization
besides some -independent coefficients. Using these analytic
formulas, we gave an intuitive explanation on the difference between
of meson and that of baryon, including the difference in
peak position and peak value of the . In addition, the hadron
species dependence of of , , can
be also naturally understood by considering the property of
of quarks at hadronization.
VII Acknowledgments
This work is supported in part by the National Natural Science Foundation
of China under Grant No. 11975011 and 12175115, Shandong Provincial
Natural Science Foundation (Grant No. ZR2019YQ06, ZR2019MA053), and
Higher Educational Youth Innovation Science and Technology Program
of Shandong Province (Grant No. 2019KJJ010).
References
Rafelski and Muller (1982)J. Rafelski and B. Muller, Phys. Rev. Lett. 48, 1066 (1982), [Erratum: Phys.Rev.Lett. 56, 2334 (1986)].