Multi-Feature Vision Transformer via Self-Supervised Representation Learning for Improvement of COVID-19 Diagnosis††thanks: Supported by organization x.
Abstract
The role of chest X-ray (CXR) imaging, due to being more cost-effective, widely available, and having a faster acquisition time compared to CT, has evolved during the COVID-19 pandemic. To improve the diagnostic performance of CXR imaging a growing number of studies have investigated whether supervised deep learning methods can provide additional support. However, supervised methods rely on a large number of labeled radiology images, which is a time-consuming and complex procedure requiring expert clinician input. Due to the relative scarcity of COVID-19 patient data and the costly labeling process, self-supervised learning methods have gained momentum and has been proposed achieving comparable results to fully supervised learning approaches. In this work, we study the effectiveness of self-supervised learning in the context of diagnosing COVID-19 disease from CXR images. We propose a multi-feature Vision Transformer (ViT) guided architecture where we deploy a cross-attention mechanism to learn information from both original CXR images and corresponding enhanced local phase CXR images. We demonstrate the performance of the baseline self-supervised learning models can be further improved by leveraging the local phase-based enhanced CXR images. By using 10% labeled CXR scans, the proposed model achieves 91.10% and 96.21% overall accuracy tested on total 35,483 CXR images of healthy (8,851), regular pneumonia (6,045), and COVID-19 (18,159) scans and shows significant improvement over state-of-the-art techniques. Code is available https://github.com/endiqq/Multi-Feature-ViT
Keywords:
Self-supervised Learning Vision Transformer Cross-Attention COVID-19 Chest X-ray.1 Introduction
The rapid spread of COVID-19 outbreak caused a surge of patients to emergency departments and hospitalization. Compared to CT, chest X-ray (CXR) has several advantages such as its wide availability, exposure to less radiation, and faster image acquisition times. Due to this CXR has become the primary diagnostic tool for improved management of COVID-19. However, the interpretation of CXR images, compared to CT, is more challenging due to low image resolution and COVID-19 image features being similar to regular pneumonia. Computer-aided diagnosis via deep learning has been investigated to help mitigate these problems and help clinicians during the decision-making process [21, 20, 24]. Most supervised deep learning methods rely on a large number of labeled radiology images. Medical image labeling is a time-consuming and complex procedure requiring expert clinician input.
Semi-supervised learning methods have been proposed to provide a solution to the costly labeling process in the context of COVID-19 diagnosis. [22] proposed a multi-feature guided teacher-student distillation approach. Most recently self-supervised learning methods, which utilize all the unlabeled data during learning, have been investigated for COVID-19 diagnosis [8, 9, 19]. [8] achieved 79.5% accuracy and 86.6% area under the receiver operating characteristic curve (AUC) on 426 COVID-19 scans while using 1% of the labeled data for the pretext task. [9] reported a mean average precision of 41.6% for 1,214 COVID-10 test data. [19] reported 99.5% accuracy using 607 COVID-19 scans. While these initial results on self-supervised learning are promising most of the prior work was evaluated on limited COVID-19 scans.
In order to break the challenges associated with scarcity of training data and to boost classification performance, local phase-based CXR image enhancement has been proposed in [21, 22]. Motivated by this, in this work, we propose a new self-supervised learning approach where the proposed framework exploits local phase enhanced CXR image features to significantly improve the learning performance. Our contributions and findings include the following: 1) We developed MoCo-COVID, a Vision Transformer(ViT) with modified Momentum Contrast (MoCo) pretraining on CXR images for self-supervised learning. This is the first study pretraining a ViT using MoCo for COVID-19 diagnosis from CXR images. 2) We demonstrated the performance of MoCo-COVID can be significantly improved by leveraging the local phase-based enhanced CXR scans specially in low data regime. 80.27% and 93.24% overall accuracy were achieved tested on 799 and 14,123 COVID-19 scans while using 1% of the labeled local phase-based enhanced data for the training. 3) A novel objective function was proposed using knowledge distillation to provide better generalization. 4) We developed a multi-feature ViT architecture based on cross-attention mechanism (MF-ViT CA) to further improve accuracy. The proposed MF-ViT CA achieves 95.03% and 97.35% mean accuracy on two large-sale test datasets including 14,922 COVID-19 scans and outperforms state-of-the-art semi-supervised learning and fully supervised learning methods.
2 Methods
Datasets: All images were collected from six public data repositories, which are BIMCV [12], COVIDx [30], COVID-19-AR[6], MIDRC-RICORD-1c[28], COVID-19 Image Repository[31] and COVID-19-NY-SBU[5]. Our dataset consists of a total of 33,055 CXR scans from 18,252 patients with three classes: normal, pneumonia, and COVID-19. These images were split into two datasets: 1) Dataset-1: A subset containing 12,108 CXR scans with a balanced distribution of classes (Fig. 1(b)). Dataset-1 was split into 60% training, 20% as validation, and 20% as testing dataset. No subject overlaps among train, validation, and test datasets. The test data in this dataset is referred to as Test-1. 2) Dataset-2: Includes 20,947 CXR scans from 8,181 patients and has a larger number of scans in COVID-19 class. Dataset-2 only serves as an additional test dataset, referred to as Test-2, for evaluating the robustness of the proposed methods.
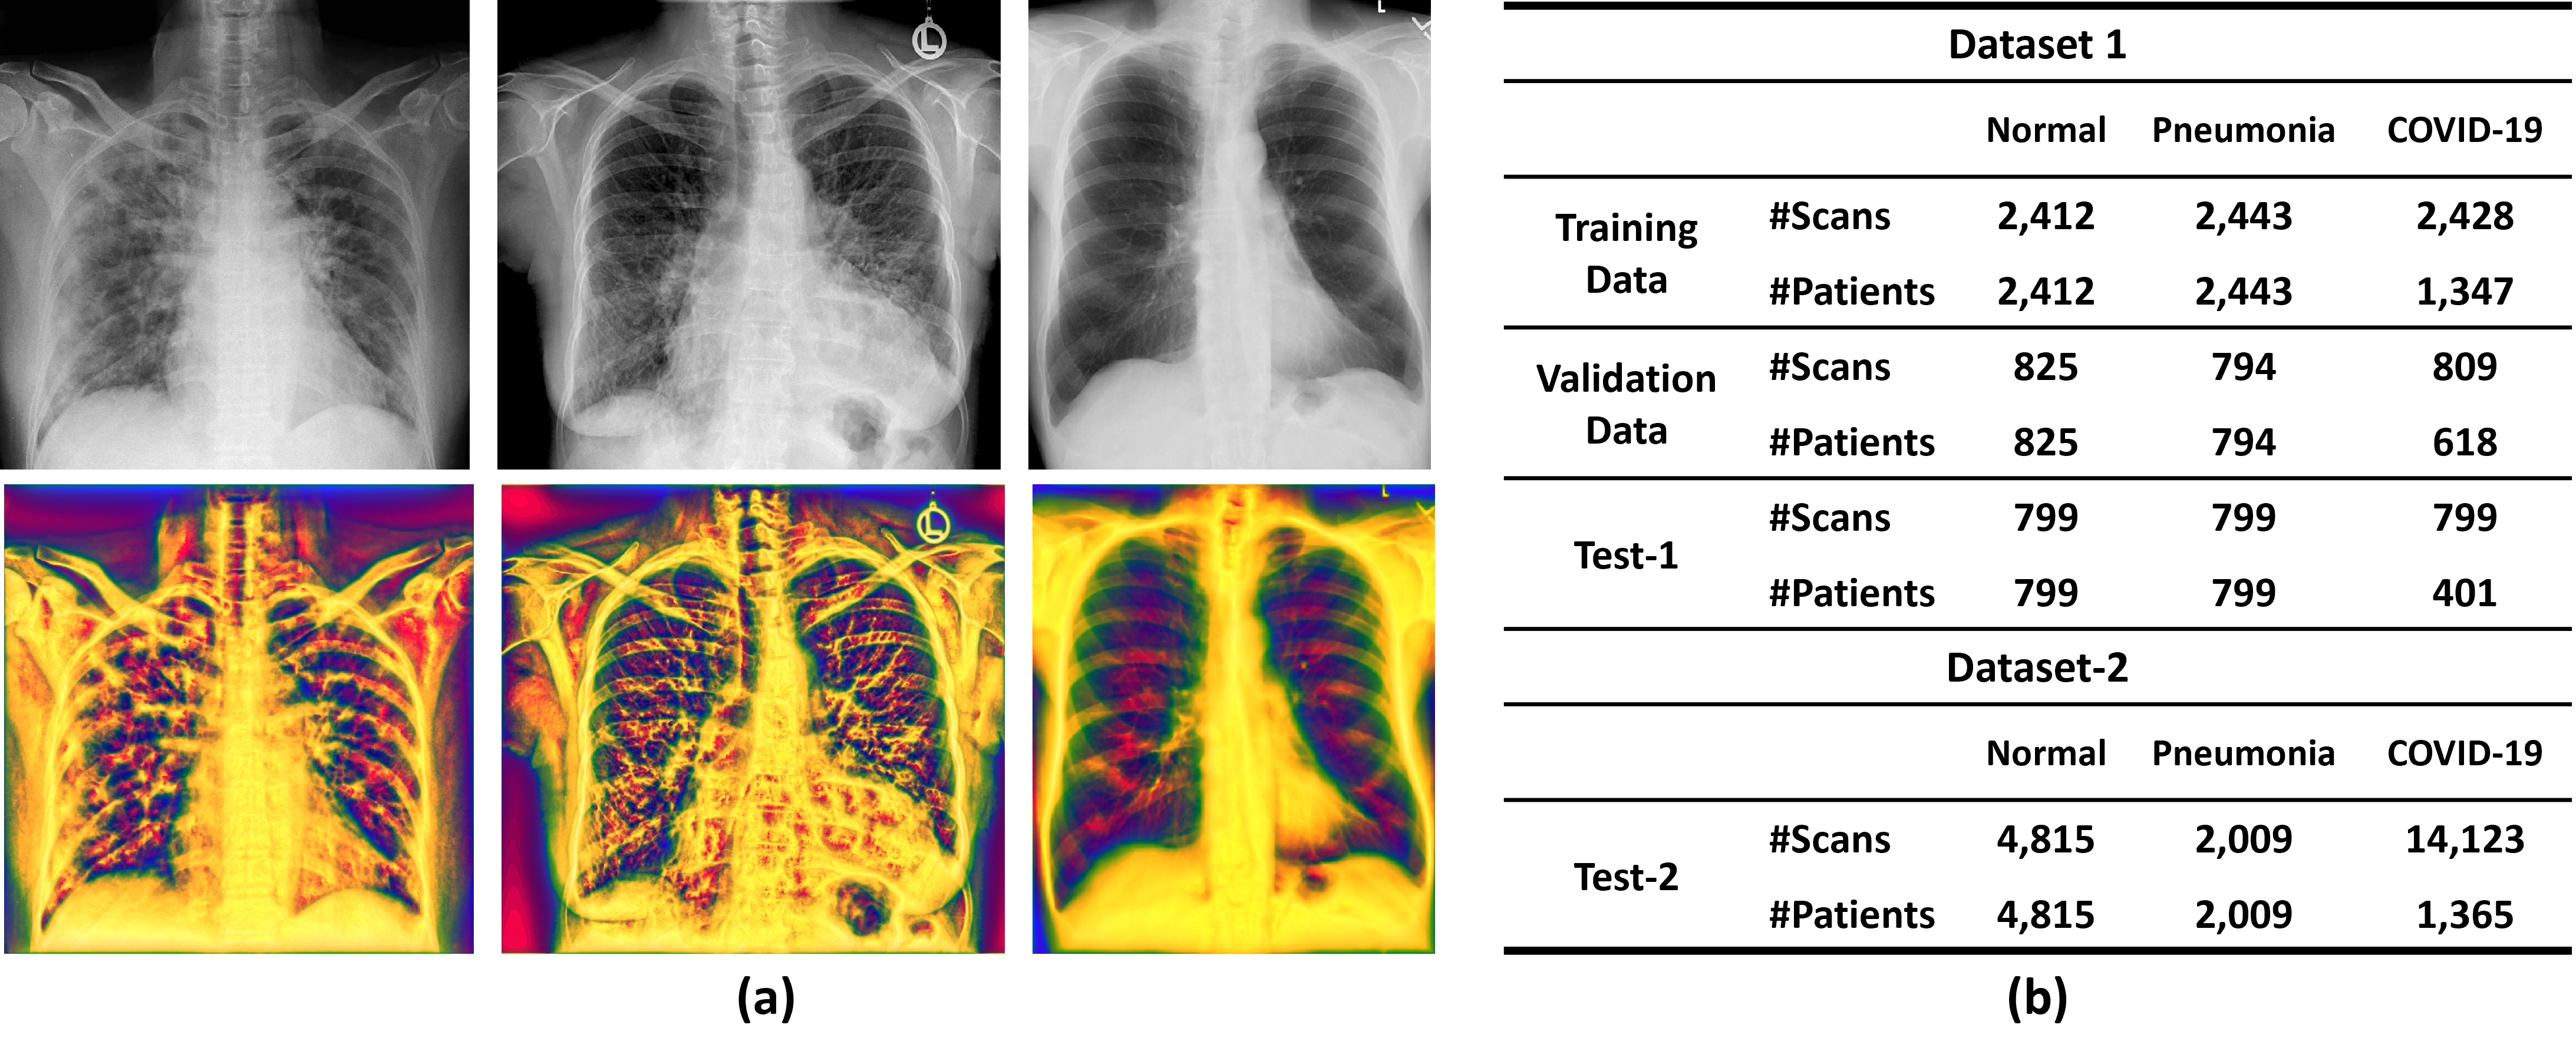
Image Enhancement: Local phase-based image analysis methods are more robust to intensity variations, usually arising from patient characteristics or image acquisition settings, and have been incorporated into various medical image processing tasks[1, 15, 32]. The enhanced local phase CXR image, denoted as , is obtained by combining three different local phase image features: 1-Local weighted mean phase angle (), 2- Weighted local phase energy (), and 3- Enhanced local energy attenuation image (). and image features are extracted by filtering the CXR image in frequency domain using monogenic filter and -scale space derivative (ASSD) bandpass quadrature filters [21]. image is extracted, processing the image, by modeling the scattering and attenuation effects of lung tissue inside a local region using L1 norm-based contextual regularization method [21]. We have used the filter parameters reported in [21] for enhancing all the CXR images. Investigating Figure. 1(a) we can see that structural features inside the lung tissue are more dominant for COVID-19 CXR images compared to healthy lung (last column Fig.1(a)). The enhanced local phase CXR images () and the original CXR images are used to train proposed self-supervised learning methods explained in the next sections.
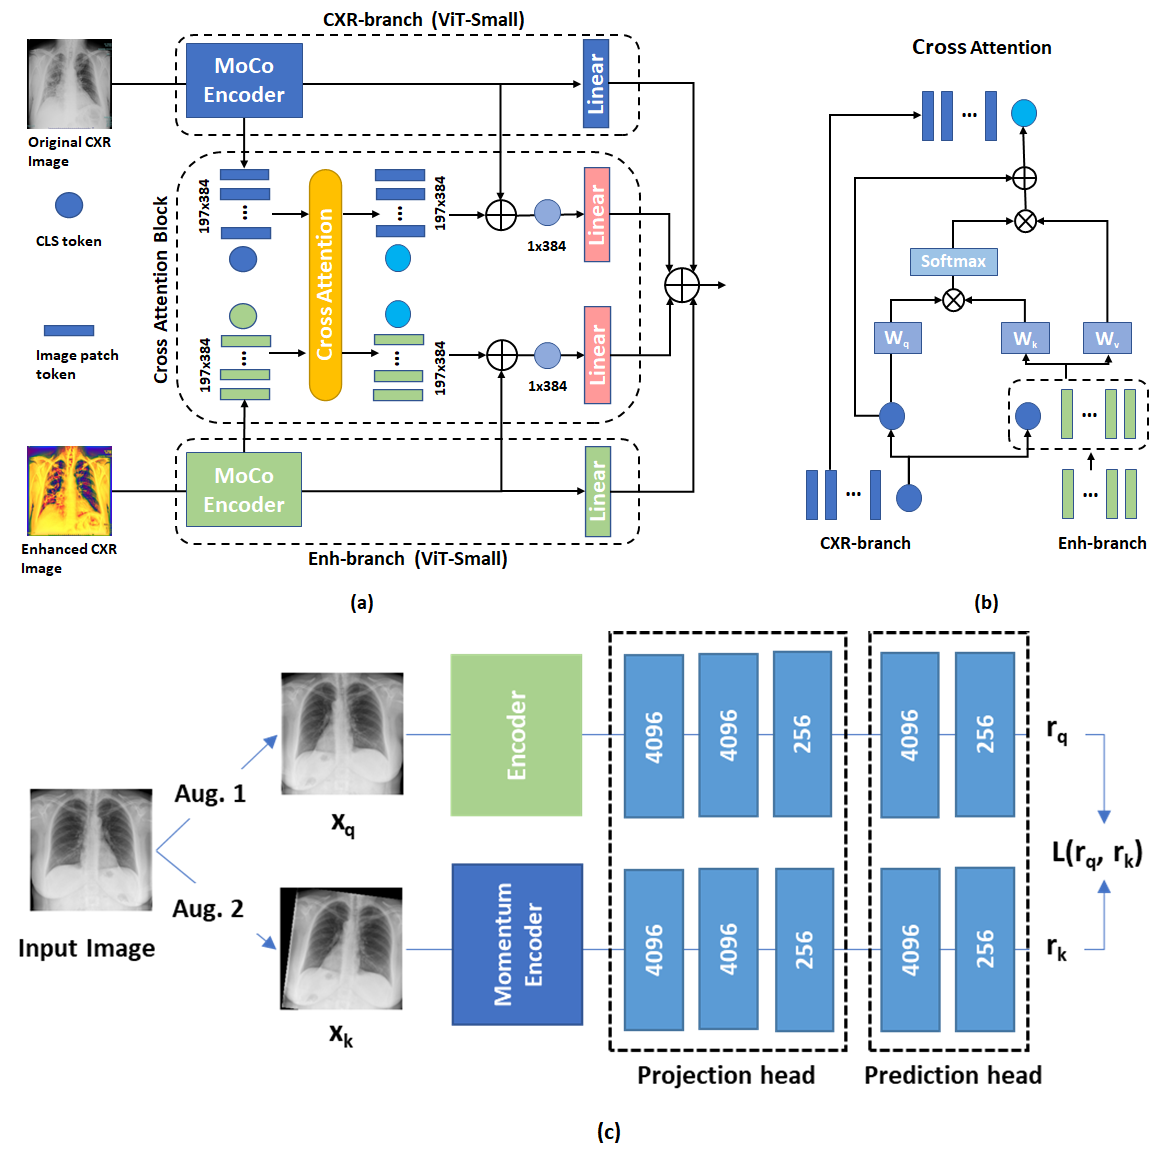
MoCo-COVID-Self-Supervised Pretraining using MoCo: We introduce a MoCo-COVID framework (Fig.2(c)). During the self-supervised training, a CXR image is first transformed via two random augmentations(Aug.1 and Aug.2) into images and . is passed through an encoder network, while is passed through a momentum encoder network. We choose ViT-Small (ViT-S) [7] with 6 heads as the backbone, instead of 12 heads used by MoCo v3, to have a lower parameter count, and a faster throughput [3]. Sine-cosine variant [29] is added to the sequence as positional embedding. The representations generated by each network are then passed into the projection head followed by a prediction head. The projection head has three layers and the prediction head has two layers. Each layer follows with batch normalization (BN) and a rectified linear unit (ReLU) except the last layer of both projection head and prediction head. Then the InfoNCE contrastive loss function [18] is adopted to promote the similarity between the representations and :
| (1) |
, where is a temperature hyperparameter and K is the number of currently stored representations. The momentum coefficient follows a cosine schedule changing from 0.9 to 0.999 during the MoCo-COVID pretraining.
Multi-Feature Fusion Vision Transformer via Cross Attention: Figure.2-(a) illustrates the architecture of our proposed Multi-Feature Vision Transformer with cross-attention (CA) block (MF-ViT CA), which consists of two branches and a CA block. CXR-branch is used for processing the original CXR image, Enh-branch is used for processing the local phase enhanced CXR image (), and CA block for extracting information from both branches. During the forward pass, an original CXR image and corresponding image is first passed to the pretrained MoCo encoder in parallel to obtain a tensor of dimension 197 384 for each image. These two tensors are then fed as inputs to our CA block. In the CA block, the CLS token of one branch fuses with patch tokens of the other branch using CA mechanism, and after fusion the CLS token concatenates with its own patch tokens again to produce an output in the same dimension of input tensor for each branch, described more details in below. The outputs of cross-attention and MoCo encoder are then combined via element-wise summation for each branch. The CLS token of dimension 1 384 from each branch as a compact representation, which encodes the information from both the original CXR image and image, is fed into a linear projection layer with three units. After that, the outputs of the two projection functions are fused using an element-wise summation.
Loss Function: We used hard-label distillation, which is a variation of distillation introduced by [27], for training CA block. In our study, CXR-branch and Enh-branch, which are obtained with the MoCo-COVID-pretrained ViT-S by using original and enhanced CXR scans(denoted as and in Eq.2), are considered as the teacher models. The CA block is considered the student model. The objective function with this hard-label distillation is:
| (2) |
where is the logits of the student model and is the softmax function. The idea is to use both the real target and the target generated by the teachers , where is the logits of the teacher models. For a given image, the predicated label associated with the teacher may change due to data augmentation during the forward pass. Thus, the teacher model is aiming at producing predicted labels that are similar but not identical to true label.
The major benefit of the proposed hard label distillation is being parameter-free compared to soft distillation in [11]. In our study, the probability distribution has the correct class at a very high probability, with all other class probabilities close to 0. The problem with these weak probabilities is they do not capture desirable information for the student model to learn effectively. To address this issue, we proposed this hard label distillation loss function by adding two distillation losses, which are losses between the predicted label of teacher model and logits of student model. Distillation loss would soften the distributions predicted by the teacher model so that the student model can learn more information, and this is especially useful when dealing with small datasets [11]. And the proposed objective function ensures the student model inherits better quality from the teacher model and mitigates the over-confidence issue of neural networks by improving the generalization.
Cross-Attention (CA) Mechanism: The proposed CA mechanism is inspired by [2], which is designed for fusing multi-scale features from two branches. In our study, we intend to extract information from two types of images via cross-attention, and thus we removed projection function used in [2] for changing the dimension of feature maps. Figure-2(b) presents the structure of our proposed cross-attention. Similar to [2], we utilize the CLS token at each branch to fuse with patch tokens from the other branch and then project it back to its own branch in order to exchange information among the patch tokens from the other branch. Since the CLS token already learns the extracted information from all patch tokens in its own branch, interacting with the patch tokens from the other branch helps to include information from different feature inputs. In the following section, we provide a detailed explanation about the CA mechanism for the CXR-branch. Enh-branch follows the same process.
CXR-branch-CA: An illustration of CA for CXR-branch is presented in the Figure 2(b). Firstly, the CLS tokens from CXR-branch, denoted as , concatenates the patch tokens from the Enh-branch to form shown as Eq.3.
| (3) |
Then, the CA is performed between and using linear projections to computer queries, keys and values (Q, K and V), where CLS token is the only information used in query. And it uses the scaled dot product for calculating the attention weights between Q and K and then aggregates V. The CA can be expressed as below:
| (4) |
In the Eq.4, ,, are learnable parameters, where C and h are the embedding dimension and number of heads. We use the three heads in the cross attention in this study. In the end, the new CLS token of CXR-branch, which is obtained by cross attention and residual shortcut, concatenates with patch tokens from CXR-branch as the output of CXR-branch shown as below:
| (5) |
3 Experiments and Results
MoCo-COVID Pretraining: We pretrained our MoCo-COVID end-to-end for both original CXR image (denoted as CXR-ViT-S) and (denoted as Enh-ViT-S), on all training dataset without label information.
MoCo-COVID pretraining initialization was performed using the weights obtained on ImageNet-initialized models for a faster convergence [23]. Data augmentation included resizing to a 224 224 gird, random rotation (10 degrees), and horizontal flipping similar to [25]. We maintained hyperparameters related to momentum, weight decay, and feature dimension from MoCo v3 [3]. To be specific, the model was optimized by AdamW [17], a weight decay parameter of 0.1 and batch size of 16 on 2 NVIDIA GTX 1080 using PyTorch’s DistributedDataParallel framework [14]. We pretrained for 300 epochs (40 warm-up epochs) with a cosine linear-rate scheduler and set the initial learning rate as BatchSize , where is .
We fine-tuned models with different fractions of labeled data. Label fraction represents the percentage of labeled data retained during fine-tuning. For example, a model fine-tuned with 1 label fraction meaning the model will only have access to 1 of the training dataset as labeled dataset, and the remaining 99 are hidden from the model as unseen data. The label fractions of training dataset are 0.25(18 scans), 1 (72 scans), 10(728 scans), 30(2184 scans), and 100. Fine-tuning was repeated five times for each label fraction. Label fractions less than 100 are random samples from the training dataset.
We conducted two fine-tuning ablations, which are linear probing (LP) and end-to-end fine-tuning (FT). LP means the pretrained weight values of the MoCo-COVID encoder were frozen and, after removing the projection and prediction heads, a new linear classifier with randomly reinitialized weights was added and fine-tuned using labeled data. FT allowed the entire model including MoCo-COVID encoder to fine-tune not just the newly added classifier. The models were fine-tuned using 90 epochs. All fine-tunings used the cosine annealing learning rate decay[16] and SGD [13] optimizer.
Ablations of Multi-Feature ViT using cross-attention mechanism (MF-ViT CA): The weights of the CXR-branch and Enh-branch are initialized to the MoCo-COVID pretrained weight values of CXR-ViT-S FT and Enh-ViT-S FT respectively, and the weights of the CA block are randomly reinitialized with a uniform distribution [10]. The CA block was fine-tuned using labeled data with hard-label distillation. We compared the proposed MF-ViT CA with a model, where it also has two MoCo-COVID pretrained branches (CXR branch and Enh branch) without using cross-attention block, denoted as MF-ViT LP. During the fine-tuning, we only fine-tuned the linear layers of CXR-branch and Enh-branch.
Baselines: As baseline comparison we report results from MoCo-CXR [25], which uses MoCo v2 pretrained Dense121, when trained using original CXR and local phase enhanced CXR images (). We report end-to-end fine-tuning protocol (FT) results for MoCo-CXR [25] and the network architecture was optimized to achieve the best results using our dataset to provide a fair comparison. Finally, we also compare our results against [22] semi-supervised, and fully supervised methods where were used.
Quantitative Results: Quantitative results are displayed in Table 1. The proposed MF-ViT CA architecture achieved the best accuracy compared to the rest of the self-supervised learning models when label fractions were more than 1%. MF-ViT CA performed significantly better (paired t-test p0.05) when tested on Test-2 data compared to Test-1 data proving the robustness of the method when tested on large scale COVID-19 data (14,123 images). The proposed Enh-ViT-S FT model had the highest accuracy for label fraction less than 10%. We can also observe that end-to-end fine-tuning protocol (FT) results are significant improvements over linear probing (LP) protocol in the proposed MoCo-COVID model. The accuracy of the baseline architecture MoCo-CXR [25] and all the proposed architectures improve when enhanced local phase CXR images () were used as an input. Finally, we have also observed that the CA mechanism significantly improves the results of the proposed MF-ViT LP model(paired t-text p0.05) (Table 1). From the results, we observe that the MF-ViT CA yields a statistically significant gain (paired t-text p0.05) compared to MF-TS [22] at 0.25% (18 scans) and 1% label fractions (72 scans). This indicates that the proposed models provide high-quality representations, better generalization capability, and transferable initialization for COVID-19 interpretation for minimal label fractions and when evaluated on large test data.
| Method | 0.25% | 1% | 10% | 30% | 100% | |||||
|---|---|---|---|---|---|---|---|---|---|---|
| Test1 | Test2 | Test1 | Test2 | Test1 | Test2 | Test1 | Test2 | Test1 | Test2 | |
| MoCo-CXR[25]-pretrained end-to-end Dense121 | ||||||||||
| FT CXR | 65.16 | 73.85 | 78.85 | 77.52 | 90.23 | 84.57 | 92.86 | 90.62 | 94.74 | 93.70 |
| FT Enh | 73.60 | 81.85 | 83.12 | 90.87 | 90.40 | 95.84 | 91.57 | 95.95 | 93.73 | 96.50 |
| MoCo-COVID Pretrained (ours) | ||||||||||
| CXR-ViT-S LP | 72.64 | 74.18 | 77.35 | 78.33 | 83.76 | 81.71 | 85.10 | 83.88 | 86.93 | 86.15 |
| Enh-ViT-S LP | 79.97 | 91.71 | 84.06 | 94.00 | 87.81 | 94.87 | 89.10 | 95.85 | 90.51 | 94.14 |
| CXR-ViT-S FT | 73.00 | 73.37 | 78.23 | 81.13 | 88.59 | 85.94 | 91.66 | 89.48 | 93.26 | 92.19 |
| Enh-ViT-S FT | 80.27 | 93.24* | 84.10 | 94.00 | 89.09 | 95.33 | 91.43 | 96.23 | 92.62 | 96.57 |
| Multi-Feature Model (ours) | ||||||||||
| MF-ViT LP | 69.01 | 65.22 | 67.20 | 69.72 | 86.72 | 85.20 | 91.06 | 92.02 | 92.53 | 95.01 |
| MF-ViT CA | 79.88 | 89.91 | 82.72 | 92.57 | 91.10* | 96.21 | 93.27 | 96.84* | 95.03 | 97.35* |
| Semi-Supervised Learning | ||||||||||
| MF-TS[22] | 77.13 | 80.93 | 82.27 | 86.57 | 90.73 | 95.65 | 92.68 | 96.35 | - | - |
| Fully-Supervised Learning | ||||||||||
| XNet[4] | - | - | - | - | - | - | - | - | 94.38 | 89.20 |
| InceptionV4[26] | - | - | - | - | - | - | - | - | 93.98 | 88.92 |
4 Conclusion
Our large quantitative evaluation results obtained using the largest COVID-19 data collected from different sites, show the significant improvements achieved using the local phase image features for self-supervised learning. Although we did not have access to the CXR machine type and non-image patient information (BMI, age, sex) we believe the large data used in this work represents images with varying image acquisition settings and intensity variations. Our quantitative results show significantly improved accuracy values over the investigated baselines proving the robustness of our proposed methods. Future work will include the extension of the method for diagnosing different lung diseases from CXR images.
5 Appendix
5.1 Quantitative evaluation: Additional results and comparison against fully-supervised learning and semi-supervised learning
Precision, recall and F1-scores for Test-1 and Test-2 data for all the investigated methods are shown in Table 2. Table 1 displays accuracy results for all the investigated methods. Investigating the results it can be observed that the proposed Enh-ViT-S FT self-supervised learning method achieves best performance when the label fraction of training dataset are %0.25 (18 scans) and %1 (72 scans). When trained in %100 label fraction our MF-ViT CA method also outperforms fully supervised baselines (Tables 1-2).
| Method | Metrics | 0.25% | 1% | 10% | 30% | 100% | |||||
|---|---|---|---|---|---|---|---|---|---|---|---|
| Test1 | Test2 | Test1 | Test2 | Test1 | Test2 | Test1 | Test2 | Test1 | Test2 | ||
| ImageNet Pretrained ViT | |||||||||||
| ViT-S[7] LP | Precision | 0.58 | 0.71 | 0.75 | 0.86 | 0.83 | 0.90 | 0.85 | 0.89 | 0.86 | 0.91 |
| Recall | 0.56 | 0.55 | 0.74 | 0.69 | 0.82 | 0.80 | 0.84 | 0.83 | 0.86 | 0.86 | |
| F1-Score | 0.55 | 0.60 | 0.74 | 0.74 | 0.82 | 0.83 | 0.84 | 0.85 | 0.86 | 0.87 | |
| ViT-S[7] FT | Precision | 0.61 | 0.76 | 0.77 | 0.87 | 0.88 | 0.91 | 0.92 | 0.93 | 0.93 | 0.94 |
| Recall | 0.59 | 0.62 | 0.76 | 0.70 | 0.88 | 0.82 | 0.92 | 0.89 | 0.93 | 0.92 | |
| F1-Score | 0.58 | 0.66 | 0.76 | 0.75 | 0.88 | 0.85 | 0.92 | 0.90 | 0.93 | 0.93 | |
| MoCo-CXR[25]-end-to-end pretrained DenseNet121 | |||||||||||
| FT CXR | Precision | 0.66 | 0.81 | 0.79 | 0.88 | 0.90 | 0.92 | 0.93 | 0.93 | 0.95 | 0.95 |
| Recall | 0.65 | 0.74 | 0.79 | 0.78 | 0.90 | 0.85 | 0.93 | 0.91 | 0.95 | 0.94 | |
| F1-Score | 0.65 | 0.77 | 0.79 | 0.81 | 0.90 | 0.87 | 0.93 | 0.91 | 0.95 | 0.94 | |
| FT Enh | Precision | 0.74 | 0.86 | 0.84 | 0.94 | 0.91 | 0.96 | 0.92 | 0.96 | 0.94 | 0.97 |
| Recall | 0.74 | 0.82 | 0.83 | 0.91 | 0.90 | 0.96 | 0.92 | 0.96 | 0.94 | 0.97 | |
| F1-Score | 0.74 | 0.84 | 0.83 | 0.92 | 0.90 | 0.96 | 0.92 | 0.96 | 0.94 | 0.97 | |
| MoCo-COVID Pretrained - Ours | |||||||||||
| CXR-ViT-S LP | Precision | 0.73 | 0.84 | 0.77 | 0.88 | 0.84 | 0.89 | 0.85 | 0.90 | 0.87 | 0.90 |
| Recall | 0.73 | 0.74 | 0.77 | 0.78 | 0.84 | 0.82 | 0.85 | 0.84 | 0.87 | 0.86 | |
| F1-Score | 0.73 | 0.77 | 0.77 | 0.81 | 0.84 | 0.84 | 0.85 | 0.86 | 0.87 | 0.87 | |
| CXR-ViT-S FT | Precision | 0.81 | 0.92 | 0.85 | 0.95 | 0.88 | 0.95 | 0.89 | 0.96 | 0.90 | 0.94 |
| Recall | 0.80 | 0.92 | 0.84 | 0.94 | 0.88 | 0.95 | 0.89 | 0.96 | 0.90 | 0.91 | |
| F1-Score | 0.80 | 0.92 | 0.84 | 0.94 | 0.88 | 0.95 | 0.89 | 0.96 | 0.90 | 0.92 | |
| Enh-ViT-S LP | Precision | 0.84 | 0.84 | 0.88 | 0.88 | 0.89 | 0.92 | 0.92 | 0.93 | 0.93 | 0.94 |
| Recall | 0.73 | 0.73 | 0.78 | 0.81 | 0.89 | 0.86 | 0.92 | 0.89 | 0.93 | 0.94 | |
| F1-Score | 0.77 | 0.77 | 0.81 | 0.83 | 0.89 | 0.88 | 0.92 | 0.91 | 0.93 | 0.94 | |
| Enh-ViT-S FT | Precision | 0.81 | 0.93 | 0.85 | 0.95 | 0.89 | 0.96 | 0.92 | 0.97 | 0.93 | 0.97 |
| Recall | 0.80 | 0.93 | 0.84 | 0.94 | 0.89 | 0.95 | 0.91 | 0.96 | 0.93 | 0.97 | |
| F1-Score | 0.80 | 0.93 | 0.84 | 0.94 | 0.89 | 0.95 | 0.91 | 0.96 | 0.93 | 0.97 | |
| Multi-Feature Model - Ours | |||||||||||
| MF-ViT LP | Precision | 0.70 | 0.78 | 0.73 | 0.87 | 0.88 | 0.93 | 0.91 | 0.94 | 0.93 | 0.96 |
| Recall | 0.69 | 0.65 | 0.67 | 0.70 | 0.87 | 0.85 | 0.91 | 0.92 | 0.93 | 0.95 | |
| F1-Score | 0.69 | 0.70 | 0.66 | 0.75 | 0.87 | 0.87 | 0.91 | 0.93 | 0.93 | 0.95 | |
| MF-ViT CA | Precision | 0.80 | 0.91 | 0.83 | 0.94 | 0.91 | 0.97 | 0.93 | 0.97 | 0.95 | 0.98 |
| Recall | 0.80 | 0.90 | 0.83 | 0.93 | 0.91 | 0.96 | 0.93 | 0.97 | 0.95 | 0.97 | |
| F1-Score | 0.80 | 0.90 | 0.83 | 0.93 | 0.91 | 0.96 | 0.93 | 0.97 | 0.95 | 0.97 | |
| Fully-Supervised Learning | |||||||||||
| XNet[4] | Precision | - | - | - | - | - | - | - | - | 0.94 | 0.93 |
| Recall | - | - | - | - | - | - | - | - | 0.94 | 0.89 | |
| F1-Score | - | - | - | - | - | - | - | - | 0.94 | 0.90 | |
| InceptionV4[26] | Precision | - | - | - | - | - | - | - | - | 0.94 | 0.93 |
| Recall | - | - | - | - | - | - | - | - | 0.94 | 0.89 | |
| F1-Score | - | - | - | - | - | - | - | - | 0.94 | 0.90 | |
| Semi-Supervised Learning | |||||||||||
| MF-TS[22] FT | Precision | 0.77 | 0.86 | 0.83 | 0.92 | 0.91 | 0.96 | 0.93 | 0.97 | - | - |
| Recall | 0.77 | 0.81 | 0.82 | 0.87 | 0.91 | 0.96 | 0.93 | 0.96 | - | - | |
| F1-Score | 0.77 | 0.83 | 0.82 | 0.88 | 0.91 | 0.96 | 0.93 | 0.96 | - | - | |
5.2 Comparison between MoCo-COVID pretrained ViT and ImageNet pretrained ViT
We evaluated whether MoCo-COVID pretrained ViT-S using original CXR images (CXR-ViT-S) have a better performance compared with model via transfer learning from ImageNet (ImageNet-ViT-S). In the linear probing (LP) protocol, CXR-ViT-S LP (pretrained with MoCo-COVID, only fine-tuning classification layer) with all label fractions achieved statistical significance compared with its ImageNet pretrained counterparts (ImageNet-ViT-S LP), except using 100% label fraction in the Test-2 (<0.05 with paired t-test). In the end-to-end fine-tuning protocol (FT), we found CXR-ViT-S FT (MoCo-COVID pretrained end-to-end ViT-S) outperforms its ImageNet pretrained counterparts (ImageNet-ViT-S FT) more at small label fractions than at large label fractions. With label fraction less than 10%, CXR-ViT-S FT is statistically better than ImageNet-ViT-S FT (<0.05 with paired t-test). These observation supports the hypothesis that representations learned in same domain by self-supervised learning are superior than those learned from natural images, and are more significant with scarce of labeled data.
5.3 Confusion Matrix for MF-ViT CA
Figure.3 and Figure.4 shows the confusion matrix of Multi-feature cross-attention model (MF-ViT CA) tested on the Test-1 and Test-2 datasets respectively. We found the COVID-19 class has the best performance compared with normal and pneumonia classes across all label fraction.


References
- [1] Alessandrini, M., Basarab, A., Liebgott, H., Bernard, O.: Myocardial motion estimation from medical images using the monogenic signal. IEEE transactions on image processing 22(3), 1084–1095 (2012)
- [2] Chen, C.F.R., Fan, Q., Panda, R.: Crossvit: Cross-attention multi-scale vision transformer for image classification. In: Proceedings of the IEEE/CVF International Conference on Computer Vision. pp. 357–366 (2021)
- [3] Chen, X., Xie, S., He, K.: An empirical study of training self-supervised vision transformers. CoRR abs/2104.02057 (2021), https://arxiv.org/abs/2104.02057
- [4] Chollet, F.: Xception: Deep learning with depthwise separable convolutions. In: Proceedings of the IEEE conference on computer vision and pattern recognition. pp. 1251–1258 (2017)
- [5] Clark, K., Vendt, B., et al.: The cancer imaging archive (tcia): Maintaining and operating a public information repository. Journal of digital imaging 26 (07 2013). \hrefhttps://doi.org/10.1007/s10278-013-9622-7https://doi.org/10.1007/s10278-013-9622-7
- [6] Desai, S., Baghal, A., Wongsurawat, T., Jenjaroenpun, P., Powell, T., Al-Shukri, S., Gates, K., et al.: Chest imaging representing a covid-19 positive rural u.s. population. Scientific Data 7 (2020), https://doi.org/10.1038/s41597-020-00741-6
- [7] Dosovitskiy, A., Beyer, L., Kolesnikov, A., Weissenborn, D., Zhai, X., Unterthiner, T., Dehghani, M., Minderer, M., Heigold, G., Gelly, S., et al.: An image is worth 16x16 words: Transformers for image recognition at scale. arXiv preprint arXiv:2010.11929 (2020)
- [8] Gazda, M., Plavka, J., Gazda, J., Drotar, P.: Self-supervised deep convolutional neural network for chest x-ray classification. IEEE Access 9, 151972–151982 (2021)
- [9] Hao, Y., Wang, Y., Wang, X.: Self-supervised pretraining for covid-19 and other pneumonia detection from chest x-ray images. In: The International Conference on Natural Computation, Fuzzy Systems and Knowledge Discovery. pp. 1000–1007. Springer (2021)
- [10] He, K., Zhang, X., Ren, S., Sun, J.: Delving deep into rectifiers: Surpassing human-level performance on imagenet classification. CoRR abs/1502.01852 (2015), http://arxiv.org/abs/1502.01852
- [11] Hinton, G., Vinyals, O., Dean, J.: Distilling the knowledge in a neural network (2015). \hrefhttps://doi.org/10.48550/ARXIV.1503.02531https://doi.org/10.48550/ARXIV.1503.02531, https://arxiv.org/abs/1503.02531
- [12] de la Iglesia Vayá, M., Saborit, J.M., Montell, J.A., et al.: Bimcv covid-19+: a large annotated dataset of rx and ct images from covid-19 patients. arXiv preprint arXiv:2006.01174 (2020)
- [13] Kingma, D.P., Ba, J.: Adam: A method for stochastic optimization (2017)
- [14] Li, S., Zhao, Y., Varma, R., Salpekar, O., Noordhuis, P., Li, T., Paszke, A., Smith, J., Vaughan, B., Damania, P., Chintala, S.: Pytorch distributed: Experiences on accelerating data parallel training. CoRR abs/2006.15704 (2020), https://arxiv.org/abs/2006.15704
- [15] Li, Z., van Vliet, L.J., Stoker, J., Vos, F.M.: A hybrid optimization strategy for registering images with large local deformations and intensity variations. International Journal of Computer Assisted Radiology and Surgery 13(3), 343–351 (2018)
- [16] Loshchilov, I., Hutter, F.: SGDR: stochastic gradient descent with restarts. CoRR abs/1608.03983 (2016), http://arxiv.org/abs/1608.03983
- [17] Loshchilov, I., Hutter, F.: Fixing weight decay regularization in adam. CoRR abs/1711.05101 (2017), http://arxiv.org/abs/1711.05101
- [18] Van den Oord, A., Li, Y., Vinyals, O.: Representation learning with contrastive predictive coding. arXiv e-prints pp. arXiv–1807 (2018)
- [19] Park, J., Kwak, I.Y., Lim, C.: A deep learning model with self-supervised learning and attention mechanism for covid-19 diagnosis using chest x-ray images. Electronics 10(16), 1996 (2021)
- [20] Park, S., Kim, G., Oh, Y., Seo, J.B., Lee, S.M., Kim, J.H., Moon, S., Lim, J.K., Ye, J.C.: Multi-task vision transformer using low-level chest x-ray feature corpus for covid-19 diagnosis and severity quantification. Medical Image Analysis 75, 102299 (2022)
- [21] Qi, X., Brown, L.G., Foran, D.J., Nosher, J., Hacihaliloglu, I.: Chest x-ray image phase features for improved diagnosis of covid-19 using convolutional neural network. International journal of computer assisted radiology and surgery pp. 1–10 (2020)
- [22] Qi, X., Foran, D.J., Nosher, J.L., Hacihaliloglu, I.: Multi-feature semi-supervised learning for covid-19 diagnosis from chest x-ray images. In: International Workshop on Machine Learning in Medical Imaging. pp. 151–160. Springer (2021)
- [23] Raghu, M., Zhang, C., Kleinberg, J.M., Bengio, S.: Transfusion: Understanding transfer learning with applications to medical imaging. CoRR abs/1902.07208 (2019), http://arxiv.org/abs/1902.07208
- [24] Serena Low, W.C., Chuah, J.H., et al.: An overview of deep learning techniques on chest x-ray and ct scan identification of covid-19. Computational and Mathematical Methods in Medicine 2021 (2021)
- [25] Sowrirajan, H., Yang, J., Ng, A.Y., Rajpurkar, P.: Moco pretraining improves representation and transferability of chest x-ray models. CoRR abs/2010.05352 (2020), https://arxiv.org/abs/2010.05352
- [26] Szegedy, C., Ioffe, S., Vanhoucke, V., Alemi, A.: Inception-v4, inception-resnet and the impact of residual connections on learning (2016)
- [27] Touvron, H., Cord, M., Douze, M., Massa, F., Sablayrolles, A., Jégou, H.: Training data-efficient image transformers & distillation through attention. CoRR abs/2012.12877 (2020), https://arxiv.org/abs/2012.12877
- [28] Tsai, E.B., Simpson, S., Lungren, M., et al.: The rsna international covid-19 open annotated radiology database (ricord). Radiology 0(0), 203957 (0). \hrefhttps://doi.org/10.1148/radiol.2021203957https://doi.org/10.1148/radiol.2021203957, https://doi.org/10.1148/radiol.2021203957, pMID: 33399506
- [29] Vaswani, A., Shazeer, N., Parmar, N., Uszkoreit, J., Jones, L., Gomez, A.N., Kaiser, L., Polosukhin, I.: Attention is all you need. CoRR abs/1706.03762 (2017), http://arxiv.org/abs/1706.03762
- [30] Wang, L., Lin, Z.Q., Wong, A.: Covid-net: a tailored deep convolutional neural network design for detection of covid-19 cases from chest x-ray images. Scientific Reports 10(1), 19549 (Nov 2020). \hrefhttps://doi.org/10.1038/s41598-020-76550-zhttps://doi.org/10.1038/s41598-020-76550-z, https://doi.org/10.1038/s41598-020-76550-z
- [31] Winther, H.B., Laser, H., Gerbel, S., Maschke, S.K., Hinrichs, J.B., Vogel-Claussen, J., Wacker, F.K., Höper, M.M., Meyer, B.C.: Covid-19 image repository (5 2020). \hrefhttps://doi.org/10.6084/m9.figshare.12275009.v1https://doi.org/10.6084/m9.figshare.12275009.v1
- [32] Zhao, Y., Liu, Y., Wu, X., Harding, S.P., Zheng, Y.: Retinal vessel segmentation: An efficient graph cut approach with retinex and local phase. PloS one 10(4), e0122332 (2015)