Dusty Starbursts Masquerading as Ultra-high Redshift Galaxies in JWST CEERS Observations
Abstract
Lyman-break galaxy (LBG) candidates at are rapidly being identified in JWST/NIRCam observations. Due to the (redshifted) break produced by neutral hydrogen absorption of rest-frame UV photons, these sources are expected to drop out in the bluer filters while being well detected in redder filters. However, here we show that dust-enshrouded star-forming galaxies at lower redshifts () may also mimic the near-infrared colors of LBGs, representing potential contaminants in LBG candidate samples. First, we analyze CEERS-DSFG-1, a NIRCam dropout undetected in the F115W and F150W filters but detected at longer wavelengths. Combining the JWST data with (sub)millimeter constraints, including deep NOEMA interferometric observations, we show that this source is a dusty star-forming galaxy (DSFG) at . We also present a tentative SCUBA-2 detection at 850 around a recently identified LBG candidate in the same field and show that, if the emission is real and associated with this candidate, the available photometry is consistent with a dusty galaxy with strong nebular emission lines despite its blue near-IR colors. Further observations on this candidate are imperative to mitigate the low confidence of this tentative emission and its positional uncertainty. Our analysis shows that robust (sub)millimeter detections of NIRCam dropout galaxies likely imply redshift solutions, where the observed near-IR break would be the result of a strong rest-frame optical Balmer break combined with high dust attenuation and strong nebular line emission, rather than the rest-frame UV Lyman break. This provides evidence that DSFGs may contaminate searches for ultra-high redshift LBG candidates from JWST observations.
1 Introduction
The superb sensitivity of the JWST coupled with its high angular resolution and its near infrared (near-IR) detectors (Rigby et al., 2022) provides a unique view of the Universe previously invisible to other telescopes, from nearby star-forming regions to the farthest, faintest galaxies ever found. In the field of extragalactic astronomy, JWST allows us to extend the Lyman-break galaxy (LBG) selection technique beyond , the redshift at which the Lyman break is redshifted beyond the reach of Hubble Space Telescope coverage (Hubble serving as the previous workhorse instrument for the identification of such galaxies before the arrival of JWST; see reviews by Finkelstein 2016; Stark 2016; Robertson 2021 and references therein).
The identification of very high-redshift LBGs has strong implications for our understanding of galaxy formation and evolution. For example, the confirmation of large numbers of galaxies can provide strong constraints on the formation epoch of the first galaxies and their star formation efficiencies. Their existence can shed light on the dark matter halo mass function in the early Universe, particularly with the presence of very luminous sources found 400 Myr after the Big Bang (e.g. Behroozi et al. 2019).
In the first few days after the release of JWST observations, an increasing number of samples of LBG candidates at were identified (Adams et al. 2022; Atek et al. 2022; Castellano et al. 2022; Donnan et al. 2022; Finkelstein et al. 2022a; Harikane et al. 2022; Naidu et al. 2022; Yan et al. 2022). The abundance and masses of these sources start to be in tension with the predictions from most galaxy formation models (Boylan-Kolchin 2022; Finkelstein et al. 2022a; Lovell et al. 2022). Nevertheless, the observed colors for some of these very high-redshift candidates may be degenerated with other populations of galaxies at lower redshifts. This results from confusion between the Lyman- forest break at with the Balmer and the 4000 Å breaks combined with dust attenuation and/or strong nebular emission. This means that dusty star-forming galaxies (DSFGs) at significantly lower redshifts () can mimic the JWST/NIRCam colors of LBGs, particularly in the shortest-wavelength filters. While models tend to assume these galaxies are universally red in color, thus distinguishable from the typically very blue LBGs, the complex environments of the ISM within DSFGs plus contamination from nebular emission lines could lead to a mix of observed near-IR colors (Howell et al., 2010; Casey et al., 2014b), further obfuscating the secure identification of ultra-high redshift LBGs. The phenomenon of DSFGs contaminating high-redshift LBG searches is, in fact, not new to JWST, as often DSFGs were found to contaminate LBG samples selected by HST (e.g. Dunlop et al. 2007); here, both the contaminants (DSFGs at ) and LBG targets () for JWST have shifted to higher redshifts.
The secure identification of LBGs is thus important not only to quantify the contamination fraction in LBG samples (which could relax the observed tension between observations and model predictions) but also to constrain the volume density and physical properties of early massive quiescent galaxies and high-redshift DSFGs, an important step towards our ultimate goal of understanding galaxy formation and evolution. However, distinguishing these galaxies from other populations has proven challenging and requires spectroscopic or multi-wavelength observations probing the older stellar populations (for the quiescent systems) or the dust thermal emission (for DSFGs).
Here, we use JCMT/SCUBA-2 and NOEMA 1.1 mm interferometric observations, in combination with the JWST data from the Cosmic Evolution Early Release Science (CEERS) Survey (Finkelstein et al. 2017; Bagley et al. 2022; Finkelstein et al., in prep), to search for dust emission around galaxy candidates and NIRCam dropout sources. We report on a galaxy, CEERS-DSFG-1, that is undetected in the NIRCam F115W and F150W filters, but whose photometric redshift is well constrained to be around after including (sub)millimeter data. We also study the candidate, CEERS-93316, reported in Donnan et al. (2022), for which we find a tentative detection at , and show that, if this emission is real and associated with this source, it would imply a lower-redshift solution around . Finally, we examine all the available long-wavelength (mid-IR to millimeter) observations around the candidate known as Maisie’s galaxy (Finkelstein et al. 2022a), finding no evidence of continuum emission.
This Letter is organized as follows: §2 describes the new observations and the ancillary datasets. In §3 we describe the SED fitting methodology and the best-fit SED fitting for CEERS-DSFG-1 along with the inferred physical properties. Then, §4 introduces our search for potential contamination from other DSFGs in samples of LBGs candidates in the CEERS field including CEERS-93316 and Maisie’s galaxy. Finally, our conclusions are summarized in §5.
In this Letter, we assume , , and (Planck Collaboration et al. 2016).
2 Observations
2.1 NOEMA observations
We obtained NOEMA continuum observations on a sample of 19 DSFG candidates in the Extended Groth Strip (EGS) field in preparation for CEERS JWST data, as part of the NOEMA Program W20CK (PIs: Buat & Zavala). The targets were selected from the original sample reported in Zavala et al. (2017, 2018a) based on deep observations at both 450 and 850 obtained with the SCUBA-2 camera on the James Clerk Maxwell Telescope (JCMT). Here, we only focus on CEERS-DSFG-1 (known as 850.027 in Zavala et al. 2017, 2018a). The rest of the observations, along with a detailed description of the sample selection, will be presented elsewhere (Ciesla et al. in preparation).
NOEMA observations were performed using the wideband correlator Polyfix covering the frequency ranges (with the lower side band) and (with the upper side band). The on-source integration time varies from to minutes and was determined based on the 850 flux densities of each target. For the main target of this Letter, CEERS-DSFG-1, the on-source integration time was around minutes. Calibration and imaging of the uv visibilities were then performed with gildas111www.iram.fr/IRAMFR/GILDAS, producing continuum maps with pixels centered at . For CEERS-DSFG-1, the achieved RMS is measured to be mJy beam-1 and the beam size . The continuum flux density at 1.1 mm was extracted using an aperture of the beam size to recover any potential extended emission resolved by the beam.
Our NOEMA observations did not explicitly target the other two sources we include in this Letter, CEERS-93316 or Maisie’s galaxy, although the former is covered in a low sensitivity, outlying part of the primary beam of the observations of CEERS-DSFG-1. We discuss this further in § 4 below.
2.2 CEERS data
JWST/NIRCam observations were conducted as part of the CEERS (Finkelstein et al., in prep) Survey program, one of the early release science surveys (Finkelstein et al. 2017). Here, we only use data from CEERS pointing #2, which covers all three objects we study in seven filters: F115W, F150W, F200W, F277W, F356W, F410M, and F444W. After a three-dither pattern, the total exposure time was typically 47 minutes per filter, with the exception of F115W, whose integration time is longer (see details in Finkelstein et al. 2022a and Finkelstein in prep.).
We performed a detailed reduction as described in Bagley et al. (2022) and Finkelstein et al. (2022b). What follows is a brief summary of the main steps, and we refer the reader to these two papers for more details. We used version 1.7.2 of the JWST Calibration Pipeline222jwst-pipeline.readthedocs.io, with custom modifications. Raw images were processed through Stages 1 and 2 of the pipeline, which apply detector-level corrections, flat-fielding, and photometric flux calibration. We also applied a custom step to measure and remove noise. We align the F200W images to an HST/WFC3 F160W reference catalog created from mosaics in the EGS field with astrometry tied to Gaia-EDR3 (see Koekemoer et al., 2011, for more details about the methodology). We then aligned each NIRCam filter to F200W, achieving a median astrometric offset . Our steps represent an initial reduction that will be iteratively improved with updates to the Calibration Pipeline and reference files.
The flux extraction was done following Finkelstein et al. (in prep.). Briefly, we use a multiwavelength photometric catalog created with Source Extractor (Bertin & Arnouts, 1996), that was created with a sum of F277WF356W as the detection image, with colors measured in small Kron apertures on images PSF-matched to F444W. Total fluxes were estimated following an aperture correction based on a ratio between a large Kron (MAG_AUTO) flux and the small Kron flux in the F444W image, with an additional correction for missing light in the large aperture based on simulations. Finally, a systematic offset of 1-5% was applied based on comparing the colors of best-fitting model templates to the photometry for 800 spectroscopically confirmed galaxies.
2.3 Other ancillary data
Photometric constraints at 450 and 850 were obtained from Zavala et al. (2017), who reported deep observations with a central depth of mJy beam-1 and mJy beam-1, respectively, with a beam size of and .
We also make use of Spitzer IRAC 8m (Barro et al. 2011) and MIPS 24m (Magnelli et al., 2009) observations, as well as Herschel photometry from PACS (at 100 and 160; Lutz et al. 2011) and SPIRE (at 250, 350, and 500; Oliver et al. 2012). Note, however, that the sources studied here are not detected in the Spitzer or Herschel maps and so we adopt only upper limits. In addition, we use a 3 GHz mosaic of the EGS field (Dickinson, private communication) obtained using observations from the Karl G. Jansky Very Large Array (VLA) as part of the program 21B-292 (PI: M. Dickinson). It reaches a sensitivity of and angular resolution of .
The photometry extracted from these observations is summarized in Table 1.
3 A JWST/NIRCam dropout: A DSFG at redshift five
| Instrument/Filter | Wavelength | Flux Density |
|---|---|---|
| NIRCam/F115W | 1.15 m | 811 nJy |
| NIRCam/F150W | 1.50 m | 1813 nJy |
| NIRCam/F200W | 2.00 m | 4113 nJy |
| NIRCam/F277W | 2.77 m | 1378 nJy |
| NIRCam/F356W | 3.56 m | 2598 nJy |
| NIRCam/F410M | 4.10 m | 42015 nJy |
| NIRCam/F444W | 4.44 m | 43812 nJy |
| PACS/100 m | 100 m | 0.110.51 mJy |
| PACS/160 m | 160 m | 0.13.5 mJy |
| SPIRE/250 m | 250 m | 1.15.8 mJy |
| SPIRE/350 m | 350 m | 4.56.3 mJy |
| Scuba-2/450 m | 450 m | 2.51.7 mJy |
| SPIRE/500 m | 500 m | 1.06.8 mJy |
| Scuba-2/850 m | 850 m | 2.250.36 mJy |
| NOEMA/1.1 mm | 1.1 mm | 1.920.11 mJy |
Note. — AB magnitudes can be derived via . CEERS-DSFG-1 is formally not detected in F115W, all of the Herschel bands from 100 to 500 m, and SCUBA-2 450 m.
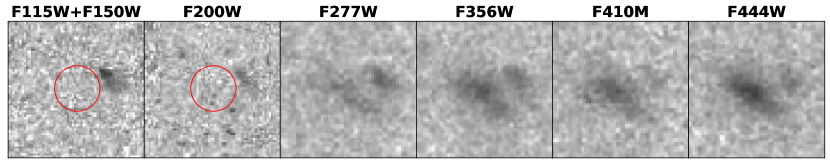
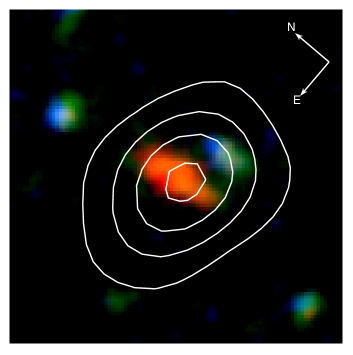
The subarcsecond positional accuracy of the NOEMA observations allows us to directly identify the submillimeter-selected galaxy, CEERS-DSFG-1, in the JWST/NIRCam observations (see Figure 1) without any ambiguity. Interestingly, CEERS-DSFG-1 is well detected in F200W and redder bands but abruptly drops out in F150W and F115W and in all the HST filters, as can be seen in Figure 2. The dropout nature of this source satisfies some of the color criteria to identify galaxy candidates. Indeed, it satisfies the criterion of used in Yan et al. (2022), and some (but not all) of the criteria used in Donnan et al. (2022), with a non-detection in F115W and F150W, and detections in redder filters (see Figure 2 and Table 1). However, the identification of this source as a DSFG calls into question such a very high-redshift scenario, given that the highest-redshift dust continuum detections ever reported are at (Laporte et al., 2017; Strandet et al., 2017; Marrone et al., 2018; Tamura et al., 2019; Inami et al., 2022). Moreover, the (sub)millimeter emission would imply an extreme infrared (IR) luminosity in excess of and a large dust mass in tension with current models. This is thoroughly discussed in Appendix A, where we show that relatively bright (sub)millimeter sources are unlikely to lie at .
Here we conduct a more thorough investigation as to the possible redshift of CEERS-DSFG-1 using JWST constraints alone, (sub-)millimeter constraints alone, and a combination of both JWST and long-wavelength millimeter data. The results are highly dependent on the available photometric constraints and the inferred redshifts differ significantly, as discussed below.
3.1 SED fitting procedure and redshift constraints
3.1.1 EAZY
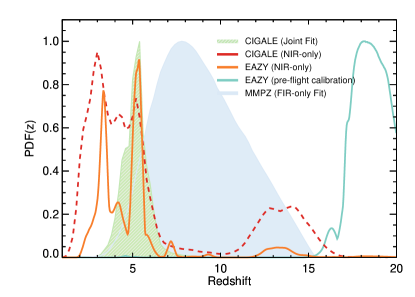
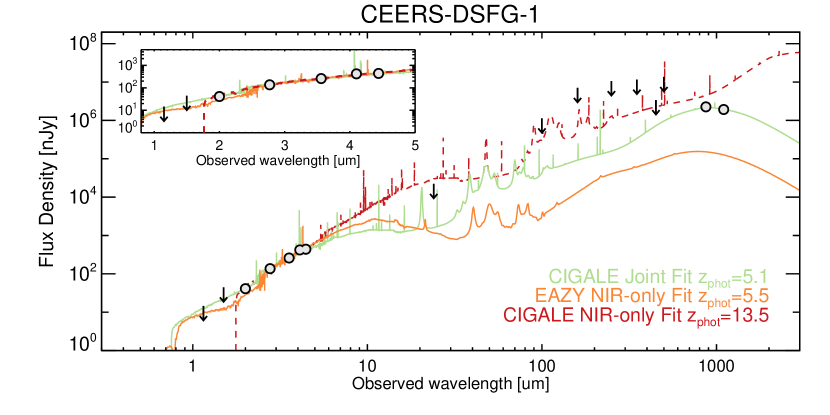
We first fit the SED of CEERS-DSFG-1 to JWST/NIRCam photometry alone using the eazy (Brammer et al. 2008) SED fitting code. The fitting was performed in an identical fashion as in Finkelstein et al. (2022a). To summarize, EAZY makes use of a user-supplied template set to generate linear combinations of stellar populations that fit the data and generate redshift probability distributions. The template set used in our case includes the “tweak_fsps_QSF_12_v3” set of 12 templates as well as 6 additional templates that span bluer colors (Larson et al. 2022). As shown in Figure 3, the redshift probability density distribution from EAZY shows two significant peaks at and , and a non-negligible probability () at . To put these fits in context with the (sub)millimeter data, we show in Figure 4 the best-fit SED from EAZY at , corresponding to the redshift with the maximum probability.
3.1.2 CIGALE
We also fit the photometry using CIGALE (Burgarella et al., 2005; Noll et al., 2009; Boquien et al., 2019) assuming a delayed star formation history (SFH): SFR(t) with stellar models from Bruzual & Charlot (2003) (BC03). A Calzetti et al. (2000) law is also adopted for the dust attenuation of the stellar continuum. On the other hand, the nebular emission (continuum and lines) is attenuated with a screen model and an SMC extinction curve (Pei 1992). Finally, the dust emission reemitted in IR is modeled with Draine et al. (2014) models.
Including only JWST/NIRCAM photometry in the fit results in a similar redshift distribution as the one obtained with EAZY, with significant probability at and a moderate probability of of being at . To illustrate how well the high-redshift solutions fit the available data, we include the best-fit SED at in Figure 4.
In addition, we fit the JWST data along with SCUBA-2 and NOEMA detections (Herschel upper limits were not included in the fit) using the same CIGALE configuration described above. The addition of the long-wavelength data significantly impacts the results, narrowing down the redshift probability distribution of CEERS-DSFG-1 (see Figure 3). The best-fit photometric redshift when using all the available photometric constraints is , where the error bars encompass the 68% confidence interval. As shown in Figure 4, the fitted SED from this analysis is in good agreement with all the available photometric constraints, including upper limits.
3.1.3 MMPz
Finally, though the long-wavelength data on CEERS-DSFG-1 are somewhat limited, we are able to calculate an independent photometric redshift for the source based on long-wavelength data alone using the MMPz package (Casey, 2020). MMPz presumes that sources with significant (sub)millimeter emission follow an empirically measured relationship between the rest-frame peak wavelength of emission, , which is inversely proportional to the characteristic luminosity-weighted dust temperature of the ISM, and the total emergent IR luminosity, . This relation is fairly well constrained out to (Casey et al., 2018; Drew & Casey, 2022) where more intrinsically luminous sources have warmer temperatures. MMPz generates a redshift probability distribution by computing the and at all possible redshifts, and contrasts that against the empirical distribution of measured SEDs. By design, redshift solutions found using MMPz are very broad (due to the degeneracy between ISM dust temperature, constrained via , and redshift). The best-fit redshift generated from the long wavelength data alone (including the only two detections and all the non-detections) is most consistent with the joint CIGALE fit, but shifted to higher values with a best-fit redshift of (see Figure 3).
3.1.4 The moral of the story
From the above analysis, it is clear that a single color (i.e. drop-out) selection criteria to identify high-redshift () candidates might include contamination from lower-redshift sources, such as CEERS-DSFG-1. This contamination could be more severe in studies using pre-flight calibrations since they render the colors of some galaxies more akin to those expected for very high-redshift systems (see discussion by Adams et al. 2022). This is clearly illustrated in Figure 3, where we have also included the photometric redshift constraints from EAZY using a pre-flight calibration. The fit suggests a very high redshift of with an almost negligible probability at . Careful selection criteria (with several conditions) are thus necessary to produce cleaner samples of high-redshift galaxies. Finkelstein et al. (2022b) and Harikane et al. (2022), for example, implemented a further criterion based on the significance of the high-redshift solution against secondary lower-redshift solutions (defined by the difference between the values of the high-redshift and low-redshift solutions) to select robust candidates (see also Donnan et al. 2022). Similarly, other studies used a two-color criterion to minimize contaminants (e.g. Adams et al. 2022; Atek et al. 2022; Castellano et al. 2022; Harikane et al. 2022) that would have prevented the selection of CEERS-DSFG-1 as a very high-redshift candidate given its red colors at longer wavelengths (e.g. ). Note, however, that despite these extra selection criteria, lower-redshift systems might still masquerade (and be misidentified) as very high-redshift galaxies as discussed in §4.
3.2 On the physical properties of CEERS-DSFG-1
As mentioned above, the joint fit of CIGALE using the JWST/NIRCam and the (sub)millimeter data provide tight constraints on the redshift of our target and its physical properties. Hence, here we adopt the these results as our fiducial values. The inferred physical properties are summarized in Table 2 and discussed below.
| Property | Value |
|---|---|
| Source ID | CEERSJ141938.19525613.9 |
| R.A. (J2000 [deg]) | 214.9091152 |
| Decl. (J2000 [deg]) | 52.9371977 |
| ) | |
| ) | |
| SFR ( yr-1) | |
| sSFR (Gyr-1) | |
| (mag) | |
| Age (Myr) | 490 |
| Mass-weighted age (Myr) | 170 |
Note. — The redshift and the listed physical properties were derived from the joint fit of CIGALE using the JWST/NIRCam data and the available (sub)millimeter constraints.
Assuming the best-fit redshift of , the stellar mass of CEERS-DSFG-1 is constrained to be . This is a factor of smaller than the average mass of DSFGs detected by single-dish telescopes (e.g. da Cunha et al. 2015), but is aligned with expectations since our source was selected from one of the deepest SCUBA-2 surveys and has a fainter 850 m flux density than typical galaxies identified in shallower single-dish telescope surveys. Indeed, the stellar mass of our target is in better agreement with other SCUBA-2 galaxies identified in this field, which have an average stellar mass of (Cardona-Torres et al. 2022), and with the masses derived for galaxies identified in recent deeper Atacama Large Millimeter/submillimeter Array (ALMA) surveys (e.g. Gómez-Guijarro et al. 2022; see also Khusanova et al. 2021). Similarly, the SFR of CEERS-DSFG-1 of (averaged over the past 10 Myr) lie between those from SMGs and fainter DSFGs identified in deeper ALMA observations (da Cunha et al. 2015; Zavala et al. 2018b; Aravena et al. 2020; Casey et al. 2021b; Khusanova et al. 2021; Gómez-Guijarro et al. 2022). These properties imply a specific star formation rate of , meaning that CEERS-DSFG-1 lies on the main-sequence of star forming galaxies, similar to the so-called population of “HST-dark" galaxies333CEERS-DSFG-1 is, by definition, an “HST-dark” galaxy. (e.g. Wang et al. 2019).
At , the NIRCam photometry samples rest-frame wavelengths from 0.2 to 0.7m, allowing us to constrain the stellar dust attenuation. The red spectral shape in the NIRCam bands implies a strong dust attenuation (as typically found for this kind of galaxies; e.g. Simpson et al. 2017) with , which results in a dust luminosity of .
4 Searching for DSFG contaminants in high-redshift LBG candidates identified with JWST
The SCUBA-2 observations from Zavala et al. (2017) partially overlap with the CEERS NIRCam survey and thus can be used to look for dust continuum emission around candidates in the field. Here we focus on two recently reported high-redshift candidates: CEERS-93316 reported to be at (Donnan et al., 2022) and Maisie’s galaxy at (Finkelstein et al. 2022a).
4.1 A deeper look into CEERS-93316
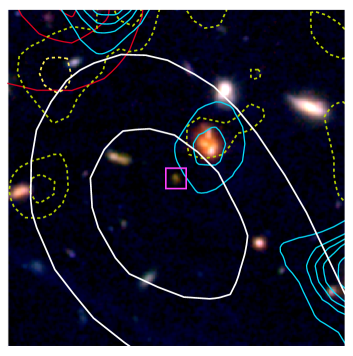
A tentative detection around the position of CEERS-93316 (Donnan et al. 2022; R.A.=214.91450, decl.=52.943033) was found in the SCUBA-2 map with a flux density of 0.650.26 mJy (see Figure 5). Unfortunately, this source was not formally targeted by our NOEMA observations and, although it is only away from CEERS-DSFG-1 and within the coverage of the NOEMA map described above, it lies on the edge of the map, where the sensitivity is very low (with a primary beam response of , implying an RMS of mJy beam-1).
4.1.1 Caveats of a Marginal SCUBA-2 Detection
We emphasize that there are two primary reasons why this marginal detection may not conclusively imply that CEERS-93316 is a significant thermal dust emitter. The first concern is the significance of the signal itself and the possibility of being spurious. At 2.6, simulations of blind detections, single-dish submillimeter sources indicate false-positive rates as high as % (Casey et al., 2013, 2014a). These rates of false positives are estimated by both searching SCUBA-2 maps for negative significance peaks at 2.6 as well as conducting source injection tests on SCUBA-2 jackknife maps (following the same methodology as Casey et al., 2013, see their Figure 7). To complement these results, we test the reliability of these low signal-to-noise ratio peaks by creating a catalog of to SCUBA-2 sources, and searching for counterparts in the deep VLA 3 GHz map (Dickinson, private communication). We find clear associations for at least of the SCUBA-2 sources444Given the surface density of radio and the SCUBA-2 sources, the probability of chance alignment is , implying a fidelity rate. A similar result is obtained using the 24 m map. Note, however, that this reliability fraction of should be considered a lower limit since it is well-known that a significant fraction (as high as 30-40%) of submm sources lack radio or mid-infrared counterparts (particularly those at ; Chapman et al. 2003; Barger et al. 2007; Pope et al. 2006; Dye et al. 2008). We thus conclude that the SCUBA-2 signal around CEERS-93316 has a probability of being real.
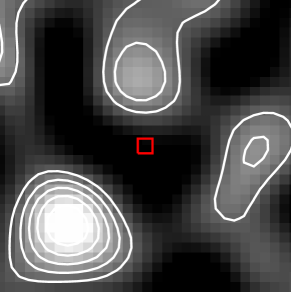
The second significant concern is that even if the detection is real, the SCUBA-2 beamsize is large enough that the 850m emission could arise from another galaxy at a close angular separation with CEERS-93316 on the sky. Figure 5 shows the neighboring sources within the beamsize of the SCUBA-2 tentative detection, with contours overlaid for Spitzer 8 m emission, 24m emission, and VLA 3 GHz continuum. Unfortunately, there is no secure emitter at these wavelengths to which we can definitively associate the 850m emission to unequivocally rule out association with CEERS-93316. Note that the lack of such a counterpart does not imply the tentative SCUBA-2 emission is spurious, since galaxies are usually undetected in these bands (this is indeed the case for CEERS-DSFG-1). This lack of detection rather means that it is not implausible to associate the 850 m emission with CEERS-93316, although it also does not confirm the association. Another possible counterpart could be the 8 m emitter (with a significance) to the northwest that has a photometric redshift of , though it is farther from the signal-to-noise peak in the SCUBA-2 map than CEERS-93316.
At present, we lack sufficient data to clearly associate the emission with CEERS-93316 or other neighboring sources. Follow-up interferometric observations would be necessary to provide both a confirmation of the emission and astrometric localization to CEERS-93316 or to a neighboring source. Nevertheless, given the remarkable properties of CEERS-93316 (being one of the highest-redshift candidates ever reported with a bright UV magnitude of ), below we explore the impact that the submillimeter tentative detection might have on its redshift solution if the dust emission is real and associated with it.
4.1.2 Implications if Dust Emission is associated with CEERS-93316
First, we consider what the implications would be if CEERS-93316 had significant dust emission at its proposed redshift of . The observed 850 m emission would probe the rest-frame 50 m regime; in this scenario, the IR luminosity would be above with a dust mass of 10. A system with such high dust mass found 230 Myr after the Big Bang would surely be extraordinary, likely implausibly so (e.g., Dwek et al. 2014). This is further discussed in Appendix A, where we show the predicted IR luminosity and dust mass as a function of redshift for a hypothetical submillimeter detection with a flux density similar to that of the tentative emission discussed here.
We alternatively explore if a lower-redshift solution would be plausible given the JWST/NIRCam photometric constraints and the observed blue colors in these bands (which contrasts with those from CEERS-DSFG-1). To do that, we fit the JWST/NIRCam data555Note that since we performed our own data reduction and followed our own source extraction procedure designed to measure accurate colors, the NIRCam fluxes for CEERS-93316 used in this Letter could differ from those in Donnan et al. (2022). We list the adopted fluxes for the SED fitting in Appendix B. along with the tentative flux density with CIGALE.
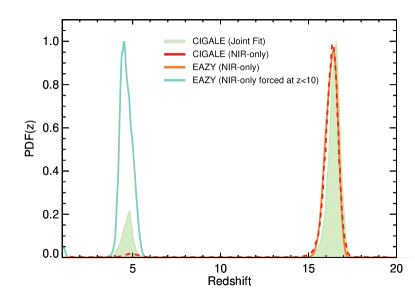
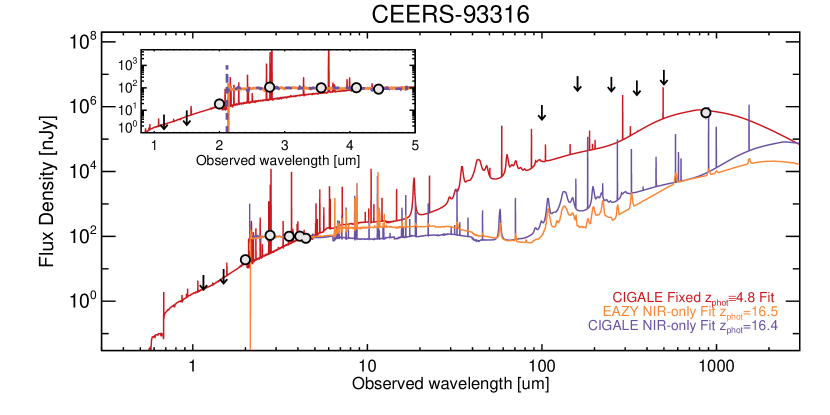
While the redshift distribution from this fitting strongly favors a high-redshift solution in agreement with the Donnan et al. (2022) result (with ; see Figure 6), the best-fit SED does not satisfactorily reproduce the tentative submillimeter flux density that is under-estimated by more than an order of magnitude (see Figure 7). Interestingly, the redshift probability distribution does show a secondary peak at , although with a low integrated probability of less than (see Figure 6). This peak is seen even without the inclusion of the long-wavelength emission and it is also seen in the redshift probability density distribution presented by Donnan et al. (2022, see their Figure A1). This lower redshift clearly dominates the probability distribution of the EAZY fitting when imposing a maximum redshift666The threshold was chosen based on the discussion presented in Appendix A. Note that other works have also followed this strategy to better assess the feasibility of low-redshift solutions (e.g. Finkelstein et al. 2022b). of , as shown in the Figure 6.
To further explore the feasibility of this alternative redshift solution, we re-run CIGALE but fix the redshift to . The resulting SED is shown in Figure 7 along with the best-fit SEDs from EAZY and CIGALE, for comparison. In the low-redshift scenario, the strong break seen between F200W and F277W in CEERS-93316 is attributable to strong [OIII] and H emission in the F277W band (see Figure 7). Similarly, the excess flux in F356W above the continuum, which produces a blue F356W-F410M color, would be attributable to H emission. The measured NIRCam photometry would thus require a young starburst with strong nebular line emission to satisfy a solution, but this would be within the realm of expectation for an early-stage DSFG in formation at these redshifts.
The best-fit SED would imply an SFR averaged over 10 Myr of and a stellar mass equal to , with a dust attenuation (for both continuum and lines) of and a dust luminosity of . These properties are in broad agreement with those derived for the relatively faint population of dusty galaxies in the REBELS survey (Bouwens et al. 2020; Inami et al. 2022). In addition, the line fluxes required to reproduce the given NIRCam photometry range from erg s-1 cm-2, which are within the range of those predicted for CEERS-DSFG-1.
While deep interferometric observations at millimeter wavelengths are required to confirm or refute dust continuum emission in this high-redshift candidate, here we show (see also Appendix A) that a scenario associated with a DSFG with strong nebular emission is plausible for CEERS-93316 and highly likely if the submillimeter emission is confirmed, despite its blue near-IR colors that are usually associated with the emission of dust-free systems (e.g. Finkelstein, 2016, and references therein). If this lower-redshift solution is true, it would contrast with the low probability of being at inferred from the different redshift probability distributions shown in Figure 6 (see also Donnan et al. 2022; Finkelstein et al. 2022b). The reason for this low probability might be related to the low significance of the tentative SCUBA-2 detection in the case of CIGALE or with the adopted templates and the fitting approach for EAZY. Interestingly, Pérez-González et al. (2022), who used a novel 2D fitting approach with a new set of SED templates, found a best-fit redshift of for this source (known as nircam2-2159 in Pérez-González et al. 2022) with a low probability of being at .
4.2 A deeper look into Maisie’s Galaxy
Given that the recently reported galaxy candidate from Finkelstein et al. (2022a) lies close to the two galaxies described above ( and away from CEERS-DSFG-1 and from CEERS-93316, respectively), we carefully examine the available long-wavelength observations to investigate any possible detection of dust emission.
Because this source is not covered by our NOEMA observations, we started by looking at the deep SCUBA-2 850 m map (Zavala et al. 2017). As shown in Figure 8 no significant detection is found (with a measured flux density of mJy at the position of the source). We also search for significant emission in the Spitzer 8 m and 24 m maps, Herschel 100, 160, 250, 350, and 500 m imaging; and SCUBA-2 450 m observations, finding only non-detections. We thus conclude that a lower-redshift scenario for Maisie’s galaxy in which the source is rather associated with a DSFG is unlikely. Given the lack of FIR-to-submillimeter detections, the best-fit SEDs and their associated redshift probability distributions for Maisie’s galaxy would be similar to those reported in Finkelstein et al. (2022a). Hence, to avoid duplication, they are not included in this Letter.
5 Conclusions
Using the available datasets from the JWST CEERS survey in combination with NOEMA and SCUBA-2 observations, we have demonstrated that DSFGs at can drop out in the bluest JWST/NIRCam filters while being well detected in the redder filters. This kind of galaxies could even show a significant probability of being at high redshifts when performing SED fittings. This is illustrated by studying the source CEERS-DSFG-1, a 850 m-selected galaxy with robust interferometric observations at 1.1 mm by NOEMA that is undetected in the F115W and F150W bands. A joint SED fitting analysis including the NIRCam constraints and the long-wavelength (sub)millimeter data implies a photometric redshift of , with physical properties that resemble other DSFGs: ; ; . Hence, searches of LBGs that rely only on a dropout selection could introduce significant contaminants from lower-redshift systems. This could be minimized by adopting multi-color selection criteria or by defining alternative conditions (such as a minimum redshift probability or goodness-of-fit; e.g. Adams et al. 2022; Castellano et al. 2022; Donnan et al. 2022; Finkelstein et al. 2022a; Harikane et al. 2022).
Taking advantage of the available submillimeter data in the field, we extended the search for dust continuum emission to two close LBG candidates recently reported, CEERS-93316 at (Donnan et al. 2022) and Maisie’s galaxy at (Finkelstein et al. 2022a). We found a tentative detection at 850 m around the position of CEERS-93316. A confirmation of this flux density measurement and a firm spatial association requires higher-resolution submillimeter imaging. This is particularly important given its high probability of being spurious and the large beam size () of the SCUBA-2 observations that encompass several galaxies.
While additional observations are required to corroborate this identification, we use this possible association to illustrate that DSFGs can also exhibit blue colors in the JWST/NIRCam bands when strong nebular emission lines are present (with line fluxes on the order of 10-18–10-17 erg s-1 cm-2), and conclude that (sub)millimeter emission in samples of LBGs likely implies misidentifications of DSFGs at lower redshifts (). Indeed, if CEERS-93316 is confirmed to be a dust emitter, our analysis suggests that it would rather lie at .
This work has illustrated both the importance and potential of combining JWST observations with submillimeter/millimeter data, a synergy that allows us to identify and characterize populations of galaxies that were previously unreachable, including both DSFGs as well as ultra-high redshift LBGs. In particular, it will become crucial for searches of ultra high-redshift LBGs to closely consider contamination from lower-redshift () dusty sources with significant nebular line emission that can mimic the colors of a higher-redshift Lyman break.
Despite sitting at lower redshift, new discoveries and characterizations of DSFGs will also shed new light on an otherwise mysterious population, where fewer than a few dozen systems are currently known. Such discoveries will enable a major step forward in our understanding of massive galaxy formation in the first 1 Gyr of the Universe’s history.
Appendix A Assessing the reliability of high-redshift galaxy candidates via dust emission
Continuum observations at submillimeter and millimeter wavelengths probe galaxies’ dust thermal emission for a wide range of redshifts. Here, adopting typical dust SEDs and relationships between dust continuum emission and other physical properties, we estimate the IR luminosity, SFR, and dust mass as a function of redshift implied by a dust continuum detection similar to the one reported in this work. Then, we compare these quantities with the expected galaxies’ properties at to assess whether or not they lie within the realm of high-redshift galaxies.
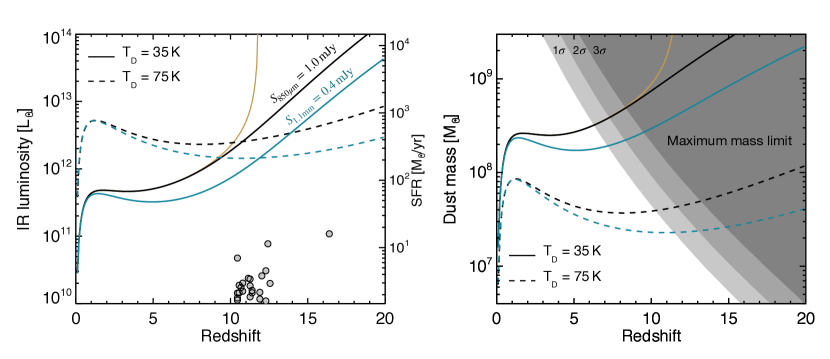
For these calculations, we adopt a modified blackbody distribution with a dust emissivity index of for the dust SED (e.g. Casey 2012). Two different dust temperatures of and K are explored. Then, the IR luminosity at a given redshift is estimated by, first, scaling the redshifted SED to the 850 m flux density and, second, integrating over 8–1000 m (in the rest frame). The CMB effects on the observed flux density are also taken into account following da Cunha et al. 2013. The inferred IR luminosity as a function of redshift for a mJy dust detection is shown in the left panel of Figure 9. The corresponding dust-obscured SFR estimated directly from the IR luminosity (Kennicutt & Evans 2012) is also indicated on the right axis. Then, we calculate the dust mass as follows. At a given redshift, we estimate the rest-frame 850 m flux density, , from the scaled SED described above (which takes into account the CMB effects) and use the following equation:
| (A1) |
where represents the dust mass absorption coefficient at a reference wavelength and represents the Planck function evaluated at the same frequency. We adopt (Li & Draine 2001) for this calculation. The implied dust mass as a function of redshift is plotted in the right panel of Figure 9.
.
As clearly seen in Figure 9, a dust continuum detection of mJy (or mJy) at would imply a SFR in excess of , rapidly reaching at (depending on the adopted temperature). This SFR is significantly higher than what is measured in any object and around two orders of magnitude higher than the SFRs inferred for JWST-selected candidates. In the right panel of Figure 9, the inferred dust mass is compared with the maximum mass limit allowed by a CDM universe (which depends on redshift and survey volume777The used survey area for the maximum halo mass calculation corresponds to 34.5 arcmin2, the covered area by the current CEERS/NIRCam observations.). To estimate this limit, we use the halo mass function from Harrison & Hotchkiss (2013) scaling; first, the halo mass down by a factor of 20 (following Marrone et al. 2018; see also Casey et al. 2021b) to approximate the corresponding galaxy ISM mass, and, second, by a factor of 100, which corresponds to the ISM-to-dust ratio typically measured in massive galaxies (e.g. Magdis et al. 2012; Rémy-Ruyer et al. 2014; Scoville et al. 2016). As shown in the figure, within the volume probed by the CEERS observations, a submillimeter detection at start to be in tension (at level) with the maximum mass limit inferred from the halo mass function (when adopting K). This could be slightly alleviated if the dust temperature is higher. Nevertheless, Scoville et al. (2016) argue that, even when the luminosity-weighted dust temperature could be higher at higher redshifts (e.g. Faisst et al. 2017; Bakx et al. 2020; Sommovigo et al. 2022), the mass-weighted temperature is usually cold (). Furthermore, even adopting the results from this relatively high dust temperature at face value, the implied dust masses exceed the expected mass limit at , implying that such a system is unlikely to exist.
While these estimates represent zero-order approximations and depend strongly on the adopted assumptions (which might not be valid at very high redshifts), it is clear that dust continuum detections (on the order of mJy) strongly disfavor high redshifts, , solutions for galaxies discovered in small surveys such as those conducted to date by the JWST. Submillimeter/millimeter surveys can thus be used to efficiently identify lower-redshift interlopers (i.e. dusty, star-forming galaxies) in samples of very high-redshift galaxy candidates.
Appendix B Extracted photometry for CEERS-93316
The photometry used during the SED fitting procedure on CEERS-93316 is listed in Table 3.Our fluxes are systematically brighter than those reported by Donnan et al. (2022) in all the detected bands, although the difference is small (with an average magnitude difference of mag). This could be related to the different processes used to reduce the data and the applied correction factors as discussed in Finkelstein et al. 2022b.
| Instrument/Filter | Wavelength | Flux Density |
|---|---|---|
| NIRCam/F115W | 1.15 m | -4.15.9 nJy |
| NIRCam/F150W | 1.50 m | 7.06.7 nJy |
| NIRCam/F200W | 2.00 m | 22.54.9 nJy |
| NIRCam/F277W | 2.77 m | 94.24.6 nJy |
| NIRCam/F356W | 3.56 m | 95.83.7 nJy |
| NIRCam/F410M | 4.10 m | 102.47.3 nJy |
| NIRCam/F444W | 4.44 m | 89.75.4 nJy |
| Scuba-2/850 m | 850 m | 0.650.26 mJy |
References
- Adams et al. (2022) Adams, N. J., Conselice, C. J., Ferreira, L., et al. 2022, arXiv e-prints, arXiv:2207.11217. https://arxiv.org/abs/2207.11217
- Aravena et al. (2020) Aravena, M., Boogaard, L., Gónzalez-López, J., et al. 2020, arXiv e-prints, arXiv:2006.04284. https://arxiv.org/abs/2006.04284
- Atek et al. (2022) Atek, H., Shuntov, M., Furtak, L. J., et al. 2022, arXiv e-prints, arXiv:2207.12338. https://arxiv.org/abs/2207.12338
- Bagley et al. (2022) Bagley, M. B., Finkelstein, S. L., Koekemoer, A. M., et al. 2022, arXiv e-prints, arXiv:2211.02495. https://arxiv.org/abs/2211.02495
- Bakx et al. (2020) Bakx, T. J. L. C., Tamura, Y., Hashimoto, T., et al. 2020, MNRAS, 493, 4294, doi: 10.1093/mnras/staa509
- Barger et al. (2007) Barger, A. J., Cowie, L. L., & Wang, W. H. 2007, ApJ, 654, 764, doi: 10.1086/509102
- Barro et al. (2011) Barro, G., Pérez-González, P. G., Gallego, J., et al. 2011, ApJS, 193, 13, doi: 10.1088/0067-0049/193/1/13
- Behroozi et al. (2019) Behroozi, P., Wechsler, R. H., Hearin, A. P., & Conroy, C. 2019, MNRAS, 488, 3143, doi: 10.1093/mnras/stz1182
- Bertin & Arnouts (1996) Bertin, E., & Arnouts, S. 1996, A&AS, 117, 393, doi: 10.1051/aas:1996164
- Boquien et al. (2019) Boquien, M., Burgarella, D., Roehlly, Y., et al. 2019, A&A, 622, A103, doi: 10.1051/0004-6361/201834156
- Bouwens et al. (2020) Bouwens, R., Gonzalez-Lopez, J., Aravena, M., et al. 2020, arXiv e-prints, arXiv:2009.10727. https://arxiv.org/abs/2009.10727
- Boylan-Kolchin (2022) Boylan-Kolchin, M. 2022, arXiv e-prints, arXiv:2208.01611. https://arxiv.org/abs/2208.01611
- Brammer et al. (2008) Brammer, G. B., van Dokkum, P. G., & Coppi, P. 2008, ApJ, 686, 1503, doi: 10.1086/591786
- Bruzual & Charlot (2003) Bruzual, G., & Charlot, S. 2003, MNRAS, 344, 1000, doi: 10.1046/j.1365-8711.2003.06897.x
- Burgarella et al. (2005) Burgarella, D., Buat, V., & Iglesias-Páramo, J. 2005, MNRAS, 360, 1413, doi: 10.1111/j.1365-2966.2005.09131.x
- Calzetti et al. (2000) Calzetti, D., Armus, L., Bohlin, R. C., et al. 2000, ApJ, 533, 682, doi: 10.1086/308692
- Cardona-Torres et al. (2022) Cardona-Torres, L., Aretxaga, I., Montaña, A., Zavala, J. A., & Faber, S. M. 2022, MNRAS, doi: 10.1093/mnras/stac2868
- Casey (2012) Casey, C. M. 2012, MNRAS, 425, 3094, doi: 10.1111/j.1365-2966.2012.21455.x
- Casey (2020) —. 2020, ApJ, 900, 68, doi: 10.3847/1538-4357/aba528
- Casey et al. (2014a) Casey, C. M., Narayanan, D., & Cooray, A. 2014a, Phys. Rep., 541, 45, doi: 10.1016/j.physrep.2014.02.009
- Casey et al. (2013) Casey, C. M., Chen, C.-C., Cowie, L. L., et al. 2013, MNRAS, 436, 1919, doi: 10.1093/mnras/stt1673
- Casey et al. (2014b) Casey, C. M., Scoville, N. Z., Sanders, D. B., et al. 2014b, ApJ, 796, 95, doi: 10.1088/0004-637X/796/2/95
- Casey et al. (2018) Casey, C. M., Zavala, J. A., Spilker, J., et al. 2018, ApJ, 862, 77, doi: 10.3847/1538-4357/aac82d
- Casey et al. (2021a) Casey, C. M., Zavala, J. A., Manning, S. M., et al. 2021a, ApJ, 923, 215, doi: 10.3847/1538-4357/ac2eb4
- Casey et al. (2021b) —. 2021b, ApJ, 923, 215, doi: 10.3847/1538-4357/ac2eb4
- Castellano et al. (2022) Castellano, M., Fontana, A., Treu, T., et al. 2022, arXiv e-prints, arXiv:2207.09436. https://arxiv.org/abs/2207.09436
- Chapman et al. (2003) Chapman, S. C., Barger, A. J., Cowie, L. L., et al. 2003, ApJ, 585, 57, doi: 10.1086/345980
- da Cunha et al. (2013) da Cunha, E., Groves, B., Walter, F., et al. 2013, ApJ, 766, 13, doi: 10.1088/0004-637X/766/1/13
- da Cunha et al. (2015) da Cunha, E., Walter, F., Smail, I. R., et al. 2015, ApJ, 806, 110, doi: 10.1088/0004-637X/806/1/110
- Donnan et al. (2022) Donnan, C. T., McLeod, D. J., Dunlop, J. S., et al. 2022, arXiv e-prints, arXiv:2207.12356. https://arxiv.org/abs/2207.12356
- Draine et al. (2014) Draine, B. T., Aniano, G., Krause, O., et al. 2014, ApJ, 780, 172, doi: 10.1088/0004-637X/780/2/172
- Drew & Casey (2022) Drew, P. M., & Casey, C. M. 2022, ApJ, 930, 142, doi: 10.3847/1538-4357/ac6270
- Dunlop et al. (2007) Dunlop, J. S., Cirasuolo, M., & McLure, R. J. 2007, MNRAS, 376, 1054, doi: 10.1111/j.1365-2966.2007.11453.x
- Dwek et al. (2014) Dwek, E., Staguhn, J., Arendt, R. G., et al. 2014, ApJ, 788, L30, doi: 10.1088/2041-8205/788/2/L30
- Dye et al. (2008) Dye, S., Eales, S. A., Aretxaga, I., et al. 2008, MNRAS, 386, 1107, doi: 10.1111/j.1365-2966.2008.13113.x
- Faisst et al. (2017) Faisst, A. L., Capak, P. L., Yan, L., et al. 2017, ApJ, 847, 21, doi: 10.3847/1538-4357/aa886c
- Finkelstein (2016) Finkelstein, S. L. 2016, PASA, 33, e037, doi: 10.1017/pasa.2016.26
- Finkelstein et al. (2017) Finkelstein, S. L., Dickinson, M., Ferguson, H. C., et al. 2017, The Cosmic Evolution Early Release Science (CEERS) Survey, JWST Proposal ID 1345. Cycle 0 Early Release Science
- Finkelstein et al. (2022a) Finkelstein, S. L., Bagley, M. B., Arrabal Haro, P., et al. 2022a, arXiv e-prints, arXiv:2207.12474. https://arxiv.org/abs/2207.12474
- Finkelstein et al. (2022b) Finkelstein, S. L., Bagley, M. B., Ferguson, H. C., et al. 2022b, arXiv e-prints, arXiv:2211.05792. https://arxiv.org/abs/2211.05792
- Gómez-Guijarro et al. (2022) Gómez-Guijarro, C., Elbaz, D., Xiao, M., et al. 2022, A&A, 659, A196, doi: 10.1051/0004-6361/202142352
- Harikane et al. (2022) Harikane, Y., Ouchi, M., Oguri, M., et al. 2022, arXiv e-prints, arXiv:2208.01612. https://arxiv.org/abs/2208.01612
- Harrison & Hotchkiss (2013) Harrison, I., & Hotchkiss, S. 2013, J. Cosmology Astropart. Phys, 2013, 022, doi: 10.1088/1475-7516/2013/07/022
- Howell et al. (2010) Howell, J. H., Armus, L., Mazzarella, J. M., et al. 2010, ApJ, 715, 572, doi: 10.1088/0004-637X/715/1/572
- Inami et al. (2022) Inami, H., Algera, H., Schouws, S., et al. 2022, MNRAS, doi: 10.1093/mnras/stac1779
- Kennicutt & Evans (2012) Kennicutt, R. C., & Evans, N. J. 2012, ARA&A, 50, 531, doi: 10.1146/annurev-astro-081811-125610
- Khusanova et al. (2021) Khusanova, Y., Bethermin, M., Le Fèvre, O., et al. 2021, A&A, 649, A152, doi: 10.1051/0004-6361/202038944
- Koekemoer et al. (2011) Koekemoer, A. M., Faber, S. M., Ferguson, H. C., et al. 2011, ApJS, 197, 36, doi: 10.1088/0067-0049/197/2/36
- Laporte et al. (2017) Laporte, N., Ellis, R. S., Boone, F., et al. 2017, ApJ, 837, L21, doi: 10.3847/2041-8213/aa62aa
- Larson et al. (2022) Larson, R. L., Hutchison, T. A., Bagley, M., et al. 2022, arXiv e-prints, arXiv:2211.10035. https://arxiv.org/abs/2211.10035
- Li & Draine (2001) Li, A., & Draine, B. T. 2001, ApJ, 554, 778, doi: 10.1086/323147
- Lovell et al. (2022) Lovell, C. C., Harrison, I., Harikane, Y., Tacchella, S., & Wilkins, S. M. 2022, MNRAS, doi: 10.1093/mnras/stac3224
- Lutz et al. (2011) Lutz, D., Poglitsch, A., Altieri, B., et al. 2011, A&A, 532, A90, doi: 10.1051/0004-6361/201117107
- Magdis et al. (2012) Magdis, G. E., Daddi, E., Béthermin, M., et al. 2012, ApJ, 760, 6, doi: 10.1088/0004-637X/760/1/6
- Magnelli et al. (2009) Magnelli, B., Elbaz, D., Chary, R. R., et al. 2009, A&A, 496, 57, doi: 10.1051/0004-6361:200811443
- Marrone et al. (2018) Marrone, D. P., Spilker, J. S., Hayward, C. C., et al. 2018, Nature, 553, 51, doi: 10.1038/nature24629
- Naidu et al. (2022) Naidu, R. P., Oesch, P. A., van Dokkum, P., et al. 2022, arXiv e-prints, arXiv:2207.09434. https://arxiv.org/abs/2207.09434
- Noll et al. (2009) Noll, S., Burgarella, D., Giovannoli, E., et al. 2009, A&A, 507, 1793, doi: 10.1051/0004-6361/200912497
- Oliver et al. (2012) Oliver, S. J., Bock, J., Altieri, B., et al. 2012, MNRAS, 424, 1614, doi: 10.1111/j.1365-2966.2012.20912.x
- Pei (1992) Pei, Y. C. 1992, ApJ, 395, 130, doi: 10.1086/171637
- Pérez-González et al. (2022) Pérez-González, P. G., Barro, G., Annunziatella, M., et al. 2022, arXiv e-prints, arXiv:2211.00045. https://arxiv.org/abs/2211.00045
- Planck Collaboration et al. (2016) Planck Collaboration, Ade, P. A. R., Aghanim, N., et al. 2016, A&A, 594, A13, doi: 10.1051/0004-6361/201525830
- Pope et al. (2006) Pope, A., Scott, D., Dickinson, M., et al. 2006, MNRAS, 370, 1185, doi: 10.1111/j.1365-2966.2006.10575.x
- Rémy-Ruyer et al. (2014) Rémy-Ruyer, A., Madden, S. C., Galliano, F., et al. 2014, A&A, 563, A31, doi: 10.1051/0004-6361/201322803
- Rigby et al. (2022) Rigby, J., Perrin, M., McElwain, M., et al. 2022, arXiv e-prints, arXiv:2207.05632. https://arxiv.org/abs/2207.05632
- Robertson (2021) Robertson, B. E. 2021, arXiv e-prints, arXiv:2110.13160. https://arxiv.org/abs/2110.13160
- Scoville et al. (2016) Scoville, N., Sheth, K., Aussel, H., et al. 2016, ApJ, 820, 83, doi: 10.3847/0004-637X/820/2/83
- Simpson et al. (2017) Simpson, J. M., Smail, I., Swinbank, A. M., et al. 2017, ApJ, 839, 58, doi: 10.3847/1538-4357/aa65d0
- Sommovigo et al. (2022) Sommovigo, L., Ferrara, A., Pallottini, A., et al. 2022, MNRAS, 513, 3122, doi: 10.1093/mnras/stac302
- Stark (2016) Stark, D. P. 2016, ARA&A, 54, 761, doi: 10.1146/annurev-astro-081915-023417
- Strandet et al. (2017) Strandet, M. L., Weiss, A., De Breuck, C., et al. 2017, ApJ, 842, L15, doi: 10.3847/2041-8213/aa74b0
- Tamura et al. (2019) Tamura, Y., Mawatari, K., Hashimoto, T., et al. 2019, ApJ, 874, 27, doi: 10.3847/1538-4357/ab0374
- Wang et al. (2019) Wang, T., Schreiber, C., Elbaz, D., et al. 2019, Nature, 572, 211, doi: 10.1038/s41586-019-1452-4
- Yan et al. (2022) Yan, H., Ma, Z., Ling, C., et al. 2022, arXiv e-prints, arXiv:2207.11558. https://arxiv.org/abs/2207.11558
- Zavala et al. (2017) Zavala, J. A., Aretxaga, I., Geach, J. E., et al. 2017, MNRAS, 464, 3369, doi: 10.1093/mnras/stw2630
- Zavala et al. (2018a) Zavala, J. A., Montaña, A., Hughes, D. H., et al. 2018a, Nature Astronomy, 2, 56, doi: 10.1038/s41550-017-0297-8
- Zavala et al. (2018b) Zavala, J. A., Aretxaga, I., Dunlop, J. S., et al. 2018b, MNRAS, 475, 5585, doi: 10.1093/mnras/sty217