A cloud platform for automating and sharing analysis of raw simulation data from high throughput polymer molecular dynamics simulations
Abstract
Open material databases storing hundreds of thousands of material structures and their corresponding properties have become the cornerstone of modern computational materials science. Yet, the raw outputs of the simulations, such as the trajectories from molecular dynamics simulations and charge densities from density functional theory calculations, are generally not shared due to their huge size. In this work, we describe a cloud-based platform to facilitate the sharing of raw data and enable the fast post-processing in the cloud to extract new properties defined by the user. As an initial demonstration, our database currently includes 6286 molecular dynamics trajectories for amorphous polymer electrolytes and 5.7 terabytes of data. We create a public analysis library at https://github.com/TRI-AMDD/htp_md to extract multiple properties from the raw data, using both expert designed functions and machine learning models. The analysis is run automatically with computation in the cloud, and results then populate a database that can be accessed publicly. Our platform encourages users to contribute both new trajectory data and analysis functions via public interfaces. Newly analyzed properties will be incorporated into the database. Finally, we create a front-end user interface at https://www.htpmd.matr.io/ for browsing and visualization of our data. We envision the platform to be a new way of sharing raw data and new insights for the computational materials science community.
I Introduction
In the past decade, the rapid development and application of computational theory, methodology, and infrastructure for high throughput materials discovery have generated huge amounts of data in the computational materials science community [1, 2, 3, 4]. Open databases like Materials Project [5], AFLOW [6], and Materials Cloud [7] store millions of material structures and computed properties, spanning inorganic crystals, metal organic frameworks, and many other types of materials. In addition, open source software such as pymatgen [8], atomate [9], FireWorks [10], and RDKit [11] have streamlined the analysis and visualization of materials data, significantly simplifying tasks like computing effective mass from band structures [12, 13, 14], calculating Li-ion conductivity from molecular dynamics (MD) trajectories [15, 16, 17, 18], and rendering chemical structures [19, 20, 21]. In the biophysics community, tools such as GPCRmd [22], BIGNASIM [23], Cyclo-lib [24], and Dynameomics [25] have enabled interactive analysis and visualization of MD data of proteins and small molecules.
Despite a push toward open science, a significant portion of computational materials data has not been shared publicly [26, 27, 28] – the raw outputs from the simulations, such as the trajectories from MD simulations and the charge densities from density functional theory (DFT) calculations. The raw data typically require gigabytes of storage for a single calculation and can easily accumulate to terabytes from a high throughput screening project. Due to the high cost of data storage and transfer, most open databases only store key properties extracted from the raw data[28, 29], while leaving the raw data in the local storage of large supercomputer centers where it is often left unattended or deleted after a period of time. Very recently, the Materials Project [5] has started to provide charge density distributions from DFT to users. However, the transfer of charge density data is not automated as users still need to communicate with the provider for access.
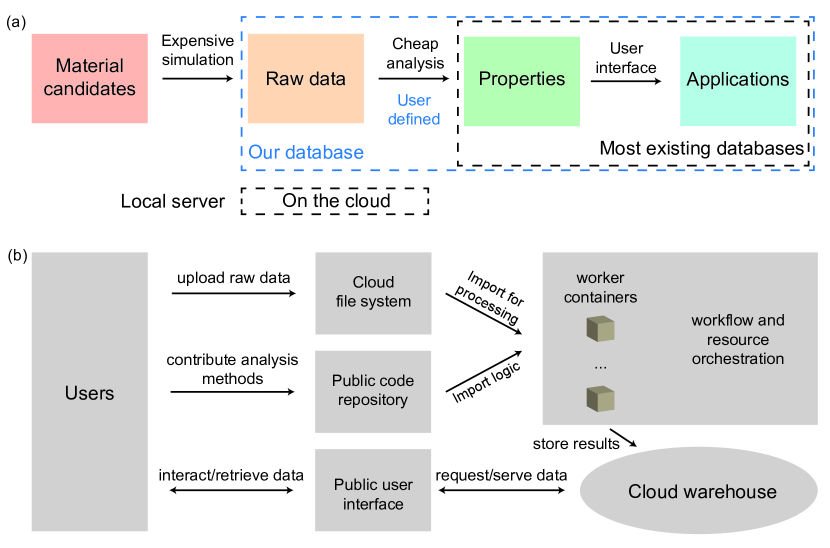
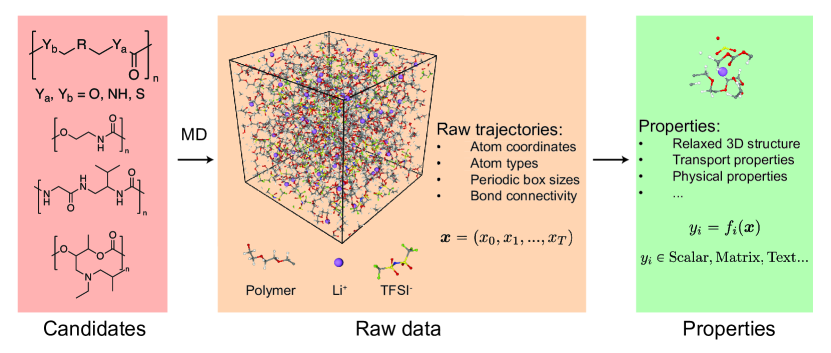
In this work, we aim to provide a cloud-based platform to facilitate the sharing of raw data from high throughput material screening. Our platform includes three components, as illustrated in Figure 1: 1) cloud storage on Amazon Web Services (AWS) that stores raw data from simulations; 2) an open codebase on github that analyzes raw data and extracts key properties; 3) a graphical interface that allows users to interact with and visualize analyzed properties. Users can access extracted properties like in other open databases, and they can also develop new analysis functions to extract new properties from the raw data via the open codebase. Our platform eliminates the high cost of transferring terabytes of raw data by running the analysis in the cloud but still allows the user to analyze raw data based on their needs. Finally, it also aims to create a standard data format and analysis software ecosystem for MD trajectories that can eventually be expanded to include other raw outputs from other simulation methods such as DFT. We demonstrate the effectiveness of this platform by creating an open database of MD trajectories for amorphous polymer electrolytes generated using the Large-scale Atomic/Molecular Massively Parallel Simulator (LAMMPS) program [30, 31], which includes 6286 trajectories and 5.7 terabytes of data.
II Software infrastructure and database
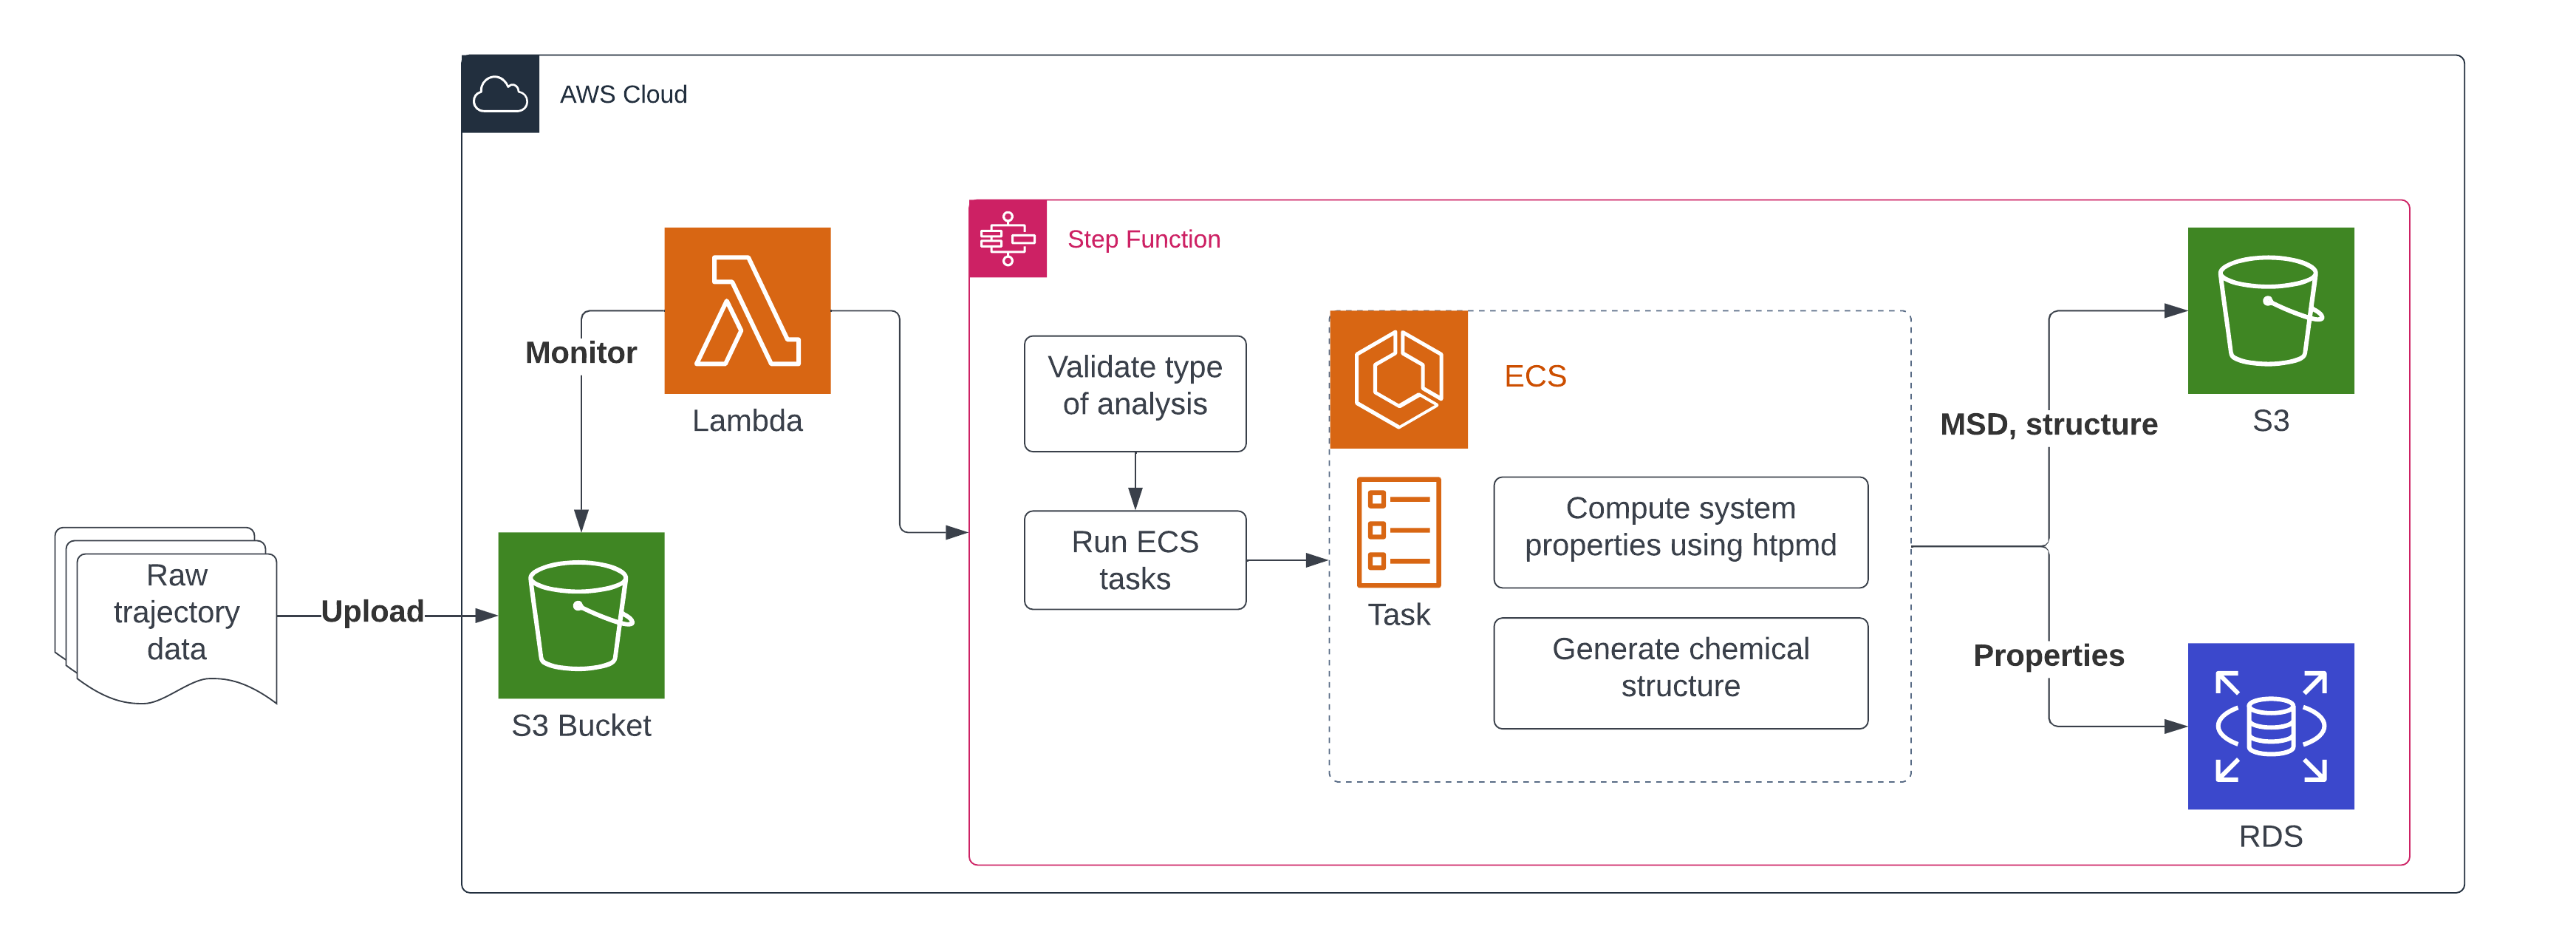
Our software infrastructure is hosted on Amazon Web Services (AWS) [32] and utilizes its serverless cloud services for data processing, analysis, storage, and flow management, as shown in Figure 2.
For processing, each raw trajectory data are expected to have the complete trajectory (in the ”custom” LAMMPS trajectory format [33] as well as a metadata file (in json format) that describes the input parameters of the data (SMILES, temperature, molality, length of simulations, force field, and ion types). When new trajectory data are uploaded to the platform, they are archived in an AWS Simple Storage Service (S3) bucket, which is a scalable cloud file system. The creation of the new data files in the bucket triggers an upload event, which is picked up by a serverless compute service AWS Lambda. The Lambda instance verifies the completeness of the trajectory data to ensure all files needed for the analysis are present. Afterwards, the Lambda instance initiates a workflow execution in a AWS StepFunction graph.
As part of the StepFunction workflow, containerized AWS Elastic Container Service (ECS) tasks are run to analyze the raw trajectory data and store the results. Analyzed properties, such as ionic conductivity, diffusion coefficients of cations, anions, and polymer chains, and transference number, as well as metadata – SMILES, molality, temperature, length of simulations, force field, and ion types – are stored in an AWS Relational Database Services (RDS) postgreSQL database. Other types of data, such as the mean squared displacement (MSD) time series for the ions, as well as the final structure file (.cif) and an image of the monomer chemical structure (.png) are uploaded to an S3 bucket and their URLs stored in the database.
The specific analysis steps which are run as ECS tasks are specified in the public htpmd github repository (https://github.com/tri-amdd/htp_md. The repository contains analysis code suited for polymer electrolytes based on an LiTFSI salt, and allows extracting property results such as Li-ion conductivity, diffusion coefficients of Li+, TFSI-, and polymer chains, and transference number. In addition, the code generates average mean squared displacement (MSD) time series for Li+ and TFSI- ions, as well as the final structure of the simulation box, which can also be retrieved from the UI. In addition, pre-trained machine learning models are applied to the existing trajectory data to provide predictions of a subset of the properties. More details are found in a later section. While there is a natural discrepancy between predicted and computed properties due to the variance in the machine learning models, predictions can be useful for making estimates of a property without having to run the full length of the simulation.
Members of the research community are encouraged to provide their specific analyses or prediction models to the github codebase via a pull request from a fork. Upon review and merging of new code, the application is containerized using Docker and provided to ECS to be run as an automated task in the workflow.
III frontend UI
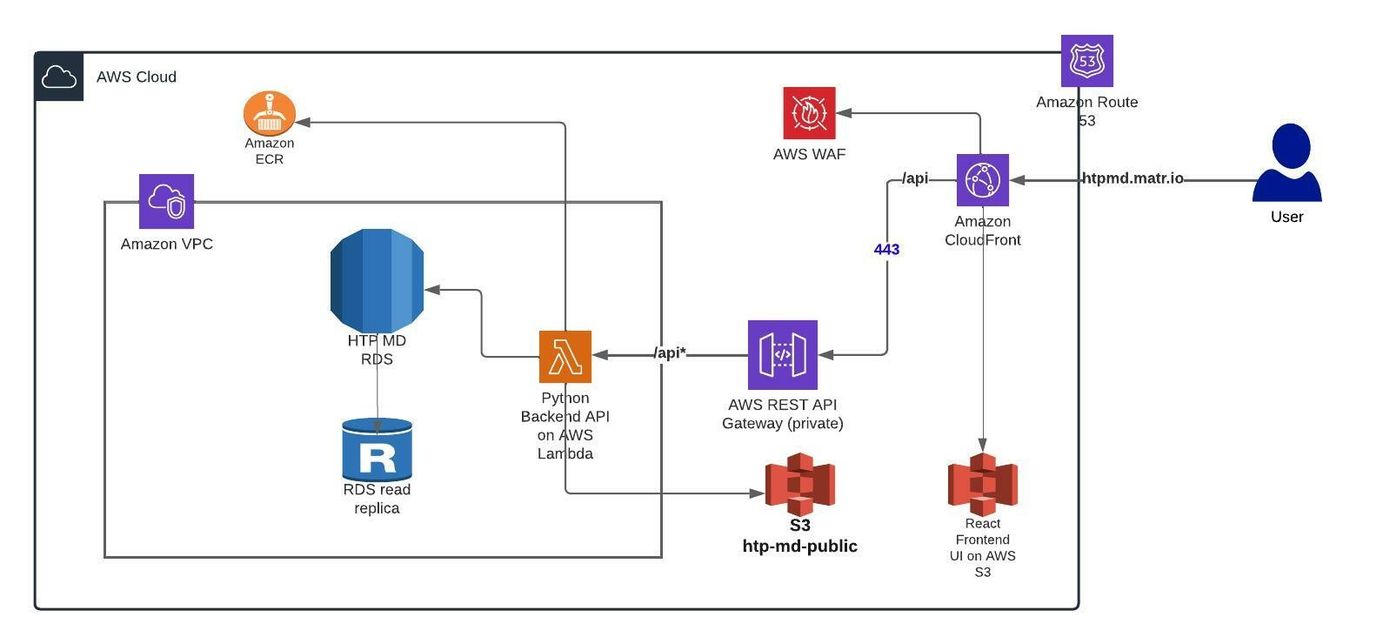
The platform provides a publicly accessible graphical user interface (GUI) that allows browsing through the available data. This web app is hosted at www.htpmd.matr.io and utilizes React framework [34] for the frontend and Python for the backend. The frontend communicates with the backend using RESTful API calls, as described in Figure 4. Plots are drawn using Plotly JS, which allows graphs to be zoomed in and exported to png.
On load of the application, the frontend makes an API call to fetch all trajectories available. This is used to populate the trajectories table and generate scatter plots of properties of interest. When filters are changed on the left panel, the cached data is filtered based on the user’s selected filters.
III.1 Simulation Data
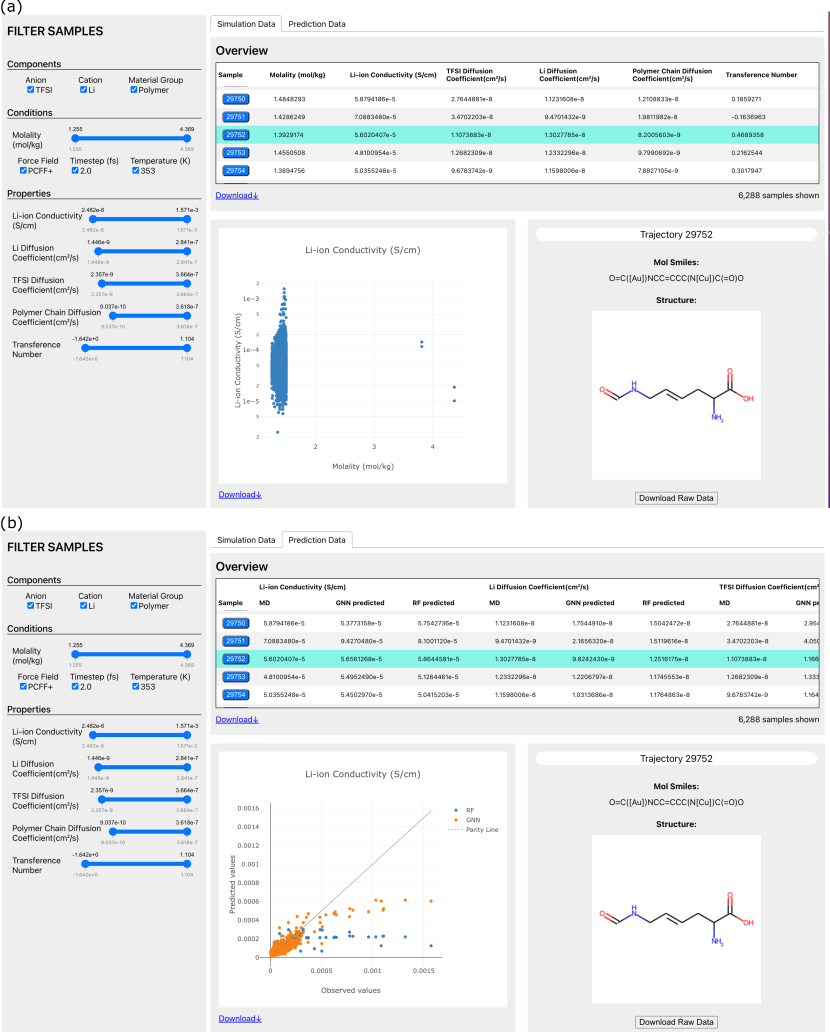
Frontend UI displays data in two available tabs. The default tab, Simulation Data, displays all data related to the MD simulations of polymers, such as extracted properties and simulation input parameters for individual trajectories. Properties, such as Li-ion conductivity, diffusion coefficients of Li+, TFSI-, and polymer chains, and the transference number, are extracted using analysis functions in the htpmd github repository.
This tab shows aggregate data in two ways: 1) scatter plots of Li-ion conductivity and diffusion coefficients of Li ion, TFSI ion, and polymer chains as a function of composition and 2) a table overview of all trajectories (named Sample) and their properties (molality and transference number, in addition to all plotted properties). By default, analyzed properties of all available MD trajectories are shown in the graphs and tables. A filter on the side bar allows the user to down-select data by material group, cation/anion types, as well as temperature and molality ranges. In addition, the user can filter by the range of the property of interest.
When a trajectory is selected via table row click or a plot data point click, additional API calls are made to fetch data specific to a single trajectory. These calls fetch monomer SMILES string, chemical structure, the conditions of simulations, and the Li+ and TFSI- MSD time series. If the user clicks on the “Download Raw Data” button, a pre-signed S3 url is opened for the user to download a zip file of the trajectory’s raw data.
Both table and graphs have a download button which allows the user to retrieve the displayed data as comma-separated values (csv) data files.
III.2 Prediction Data
Switching to the Prediction Data tab allows the user to view aggregate and trajectory-specific prediction data made using pre-loaded ML models, as shown in Figure 3b. The table shows Li-ion conductivity, diffusion coefficients of ions and polymers, and transference number that have been extracted from MD simulations, compared against predictions using RF and GNN models (details provided in a subsequent section).
Scattered plots show parity plots for conductivity and ion diffusion coefficients for predicted data against MD simulation data. The user can select a specific trajectory by clicking on a data point in the plots or by selecting a row in the tables. As with the Simulation Data tab, any aggregate data can be downloaded using the download button below the table or graphs.
IV Polymer Database and content
IV.1 Overview of the polymer database
As a demonstration of the platform, we upload the raw trajectories generated by a previous study [35] that uses molecular dynamics (MD) to screen polymer electrolytes for Li-ion battery applications. The database contains 6057 unique polymers that share the same structure template in Figure 5, which can be synthesized through a condensation polymerization route detailed in [35]. The initial 3D structures of the polymer electrolytes are generated by inserting 1.5 mol lithium bis(trifluoromethanesulfonyl)imide (LiTFSI) salt per kilogram of polymer into a mixture of polymer chains and performing a 5 ns MD equilibration at 353 K. Currently, the database contains 6152 MD trajectories for 5 ns simulations of polymer electrolytes at 353 K, recorded every 2 ps. This database is more comprehensive than the previous study [35], in which only 900 of these polymers were simulated with MD, the rest screened with ML property predictors. In addition, the database also contains 134 MD trajectories for 50 ns simulations of polymers, recorded every 2 ps, which provides better converged transport properties like diffusion coefficients and Li-ion conductivity.
IV.2 Properties computed and associated methods
Several properties are computed by default, mostly related to ion transport. Current methods rely on the identification of ion clusters, as shown in Figure 5 to calculate transport properties. An extensive list is given in Table 1, with the associated methods.
| Property | Symbol and units | Type | Method and comments |
|---|---|---|---|
| Molality | scalar | Number of ion pairs divided by the total polymer mass. | |
| Structure | string | Written out in the CIF file format [36] | |
| Atomic displacement | scalar | Can output either the mean or the maximum displacement along the trajectory. | |
| Mean squared displacement | vector | The average is performed on all atoms of the same species, and can be switched on for time origins. | |
| Ion diffusivity | scalar | ||
| Polymer diffusivity | scalar | Defined as the average of electronegative sites (N, S, O). | |
| Ionic conductivity | scalar | Cluster Nernst-Einstein approximation [37] | |
| Cation transference number | scalar | Cluster Nernst-Einstein approximation [37] |
IV.3 ML predictions
The dataset enables investigating through machine learning the transport properties of polymer electrolytes. In this work, we use two baseline machine learning models to learn the transport properties: 1) human-engineered descriptors + random forest model and 2) graph neural networks (GNNs). Twenty percent of the data points are randomly reserved at the very beginning as the test set, and the remaining data points are used to train and tune the hyper-parameters via a four-fold cross-validation. The human-engineered descriptors are generated using the package Mordred [38]. The random forest models are built using scikit-learn [39]. We adopt the GNN architecture used in our prior work [35] that builds Crystal Graph Convolutional Neural Networks (CGCNN) [40] on top of polymer graphs. Note that in this work, both models are based on 2D molecular information of the monomer; machine learning models making use of the 3D structure of polymers will be discussed in the future.
In Table 2, we show the performance of the machine learning models on five transport properties: Li-ion conductivity, Li+, TFSI-, and polymer chain diffusion coefficients, and transference number. We can see that the deep representation learning model (GNN) performs slightly better than the random forest model based on human-engineered descriptors for all transport properties, except for the transference number. Also, except for the polymer chain diffusion coefficient, the scores of prediction of transport properties from both machine learning models are lower than 0.8, which indicates the limitations of current two models. Model performance can be potentially further improved by including 3D features or even dynamical features.
| Property | RF + molecular features | GNN + molecule structures | ||
|---|---|---|---|---|
| MAE | R2 | MAE | R2 | |
| [S/cm] | ||||
| [cm2/s] | ||||
| [cm2/s] | ||||
| [cm2/s] | ||||
V User Scenario
We envision two broad user scenarios for the platform: 1) A user whose primary goal is to explore and visualize existing data (raw data and analyzed properties); 2) A user who wishes to develop and contribute new analysis functions and ML prediction models to derive additional insights from existing data, or use existing analysis functions and ML prediction models on private data and potentially contribute new data to our platform. We outline recommended workflows for each user scenario.
V.1 Visualization and exploration of data
A user wishing to explore the data can access the platform at htpmd.matr.io. All trajectory data are loaded at once; however, the user can down-select the data using the selection panel on the left, filtering by components, simulation conditions (molality, force field, time step, simulation length, and temperature), and the desired range of analyzed properties. Most trajectories also have additional data (chemical structure and mean squared displacement time series) and can be filtered by whether the data are available.
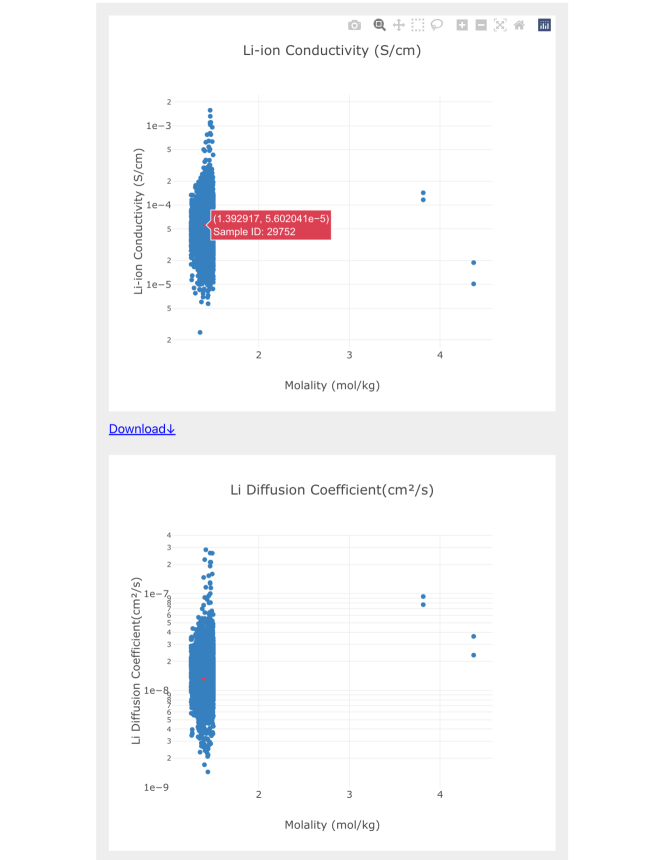
Filtered data are displayed in tabular and graphical formats. The data table lists simulation conditions and analyzed properties for each trajectory ID and can be sorted by ascending/descending value. Aggregate view shows plots of three relevant properties (Li-ion conductivity and diffusion coefficients of Li+ and TFSI-) as a function of molality (Figure 6). Users can hover over each data point for trajectory ID information or zoom into parts of each plot using click-and-drag.
More detailed information on a single trajectory can be displayed by selecting a specific trajectory (in the table or on the graph), as shown in Figure 3. The sample view displays MSD time series, chemical structure, and simulation conditions for the selected trajectory.
Trajectory-specific data in sample view or aggregate information in aggregate view can be downloaded by clicking on the Download button. This information is downloaded as a csv file.
V.2 Community contribution of new analysis methods and data
Some users may wish to run the analysis module locally in order to develop new analysis functions, train new ML prediction models, or try existing analysis functions on private data. This can enable new insights from existing data. For these users, the best starting point is at the public github repository at https://github.com/tri-amdd/htp_md/src. Users are encouraged to install within a Docker container to minimize dependency issues.
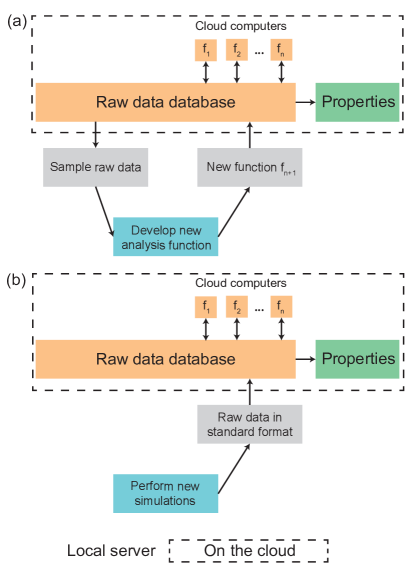
The repository provides test data for three test systems (an aqueous NaCl electrolyte and two LiTFSI polymer electrolytes). Additional data can be downloaded from the database via the UI. Newly developed analysis functions can be tested on the test data, as well as any data downloaded from the database (see Figure 7a)
In order to merge the new analysis function or method, the user must open a pull request containing the source code in function.py and an accompanying test in function_test.py, as well as test data and results (if different from provided test data). The format of the code should follow the provided template. Contributed code will be reviewed by the repository maintenance team.
Once contributed code is reviewed and merged, htpmd version number will be updated, and the pipeline will run the latest version of analysis functions on existing data. Latest versions of extracted properties will be available on the UI.
Alternatively, some users may wish to contribute new data that were locally generated (Figure 7b). Users are not required but are encouraged to provide information on the compiler and version of LAMMPS used.
VI Discussion
The htpmd database enables researchers to harvest insights from molecular dynamics simulations of thousands of polymer-salt systems. We will be adding trajectories and property data as we simulate more polymer-salt systems to identify their respective ion transport properties. We encourage researchers in the community to make use of the presented data, methods, and models for their own investigations and for use as benchmarks. We also welcome any contributions to this database. If you would like to add your data, methods, or machine learning models to this platform, please contact us for details. In future updates of the database web portal, we envision adding functionality that will enable direct upload and automatic verification of new data from MD simulations, experiments, and literature.
In order to make material simulations a meaningful tool in the pursuit of accelerated materials discovery, it is necessary to establish the validity and accuracy of material property data resulting from such simulations. Previous work examined the alignment of MD simulations results with experimentally determined transport properties, such as Li+ conductivity [41, 42, 43]. To further complete the picture, we envision future additional features of the platform which allow a direct comparison of simulation data to experimental results published in the literature. This will enable researchers to further explore the conditions for validity, possible limitations, and future improvements to the simulation methodologies.
A separate effort which is currently underway at MIT in collaboration with TRI is the development of high throughput experimental screening methods for measuring ion conductivity in solid polymer systems. One of its uses will be to validate computational results via synthesis and characterization of previously simulated systems. The experimental data generated through the screening can be further incorporated into our database.
Finally, the cloud-based platform and its infrastructure can be further extended into other types of simulation approaches and material properties. The current available analysis functions and the frontend UI are specific to the transport properties in polymer-salt systems. However, the backend workflow only requires a raw data format and a list of analysis functions designed for the format. It means that we can extend the platform to new types of data by creating a standard raw data format and corresponding analysis functions. Our platform is most suitable for use cases where a large number of useful properties can be extracted from the same raw data, and the computational cost of postprocessing is significantly cheaper than the simulation itself. As the use of this platform increases, we envision broadening the scope of our platform to new problems like mechanical and rheological properties of complex polymer-salt systems.
VII Data availability
All data are available at https://www.htpmd.matr.io.
VIII Code availability
Code is available at https://github.com/TRI-AMDD/htp_md.
IX Acknowledgement
This work was supported by Toyota Research Institute. Computational support was provided by the National Energy Research Scientific Computing Center, a DOE Office of Science User Facility supported by the Office of Science of the U.S. Department of Energy under Contract No. DE-AC02-05CH11231, and the Extreme Science and Engineering Discovery Environment, supported by National Science Foundation grant number ACI-1053575.
X Author contributions
T.X., H.K.K., D.S., J.C.G., Y.S.H. conceived the idea. H.K.K., D.S., T.X. led the development of the platform. T.X., S.G., A.F.L., E.C. generated the data and developed the analysis functions. H.K.K., D.S., A.K., M.P., C.F., W.P. developed the software infrastructure on AWS, including both frontend and backend. All authors (T.X., H.K.K., D.S., S.G., A.F.L., A.K., E.C., M.P., C.F., W.P., Y.S.H., J.C.G.) contributed to the writing of the paper.
References
- Suh et al. [2020] C. Suh, C. Fare, J. A. Warren, and E. O. Pyzer-Knapp, Evolving the materials genome: How machine learning is fueling the next generation of materials discovery, Annual Review of Materials Research 50, 1 (2020), https://doi.org/10.1146/annurev-matsci-082019-105100 .
- Liu et al. [2017] Y. Liu, T. Zhao, W. Ju, and S. Shi, Materials discovery and design using machine learning, Journal of Materiomics 3, 159 (2017), high-throughput Experimental and Modeling Research toward Advanced Batteries.
- Pollice et al. [2021] R. Pollice, G. dos Passos Gomes, M. Aldeghi, R. J. Hickman, M. Krenn, C. Lavigne, M. Lindner-D’Addario, A. Nigam, C. T. Ser, Z. Yao, and A. Aspuru-Guzik, Data-driven strategies for accelerated materials design, Accounts of Chemical Research 54, 849 (2021), pMID: 33528245, https://doi.org/10.1021/acs.accounts.0c00785 .
- Nandy et al. [2022] A. Nandy, C. Duan, and H. J. Kulik, Audacity of huge: overcoming challenges of data scarcity and data quality for machine learning in computational materials discovery, Current Opinion in Chemical Engineering 36, 100778 (2022).
- Jain et al. [2013] A. Jain, S. P. Ong, G. Hautier, W. Chen, W. D. Richards, S. Dacek, S. Cholia, D. Gunter, D. Skinner, G. Ceder, and K. A. Persson, Commentary: The materials project: A materials genome approach to accelerating materials innovation, APL Materials 1, 011002 (2013), https://doi.org/10.1063/1.4812323 .
- Curtarolo et al. [2012] S. Curtarolo, W. Setyawan, G. L. Hart, M. Jahnatek, R. V. Chepulskii, R. H. Taylor, S. Wang, J. Xue, K. Yang, O. Levy, M. J. Mehl, H. T. Stokes, D. O. Demchenko, and D. Morgan, AFLOW: An automatic framework for high-throughput materials discovery, Computational Materials Science 58, 218 (2012).
- Talirz et al. [2020] L. Talirz, S. Kumbhar, E. Passaro, A. V. Yakutovich, V. Granata, F. Gargiulo, M. Borelli, M. Uhrin, S. P. Huber, S. Zoupanos, et al., Materials cloud, a platform for open computational science, Scientific data 7, 1 (2020).
- Ong et al. [2013] S. P. Ong, W. D. Richards, A. Jain, G. Hautier, M. Kocher, S. Cholia, D. Gunter, V. L. Chevrier, K. A. Persson, and G. Ceder, Python materials genomics (pymatgen): A robust, open-source python library for materials analysis, Computational Materials Science 68, 314 (2013).
- Mathew et al. [2017] K. Mathew, J. H. Montoya, A. Faghaninia, S. Dwarakanath, M. Aykol, H. Tang, I. heng Chu, T. Smidt, B. Bocklund, M. Horton, J. Dagdelen, B. Wood, Z.-K. Liu, J. Neaton, S. P. Ong, K. Persson, and A. Jain, Atomate: A high-level interface to generate, execute, and analyze computational materials science workflows, Computational Materials Science 139, 140 (2017).
- Jain et al. [2015] A. Jain, S. P. Ong, W. Chen, B. Medasani, X. Qu, M. Kocher, M. Brafman, G. Petretto, G.-M. Rignanese, G. Hautier, D. Gunter, and K. A. Persson, Fireworks: a dynamic workflow system designed for high-throughput applications, Concurrency and Computation: Practice and Experience 27, 5037 (2015), https://onlinelibrary.wiley.com/doi/pdf/10.1002/cpe.3505 .
- Landrum [2013] G. Landrum, Rdkit: open-source cheminformatics, http://www.rdkit.org (2013).
- Woods-Robinson et al. [2018] R. Woods-Robinson, D. Broberg, A. Faghaninia, A. Jain, S. S. Dwaraknath, and K. A. Persson, Assessing high-throughput descriptors for prediction of transparent conductors, Chemistry of Materials 30, 8375 (2018), https://doi.org/10.1021/acs.chemmater.8b03529 .
- Hautier et al. [2013] G. Hautier, A. Miglio, G. Ceder, G.-M. Rignanese, and X. Gonze, Identification and design principles of low hole effective mass p-type transparent conducting oxides, Nature communications 4, 1 (2013).
- Ha et al. [2017] V.-A. Ha, F. Ricci, G.-M. Rignanese, and G. Hautier, Structural design principles for low hole effective mass s-orbital-based p-type oxides, J. Mater. Chem. C 5, 5772 (2017).
- Sivonxay et al. [2020] E. Sivonxay, M. Aykol, and K. A. Persson, The lithiation process and li diffusion in amorphous sio2 and si from first-principles, Electrochimica Acta 331, 135344 (2020).
- Cheng et al. [2020] J. Cheng, E. Sivonxay, and K. A. Persson, Evaluation of amorphous oxide coatings for high-voltage li-ion battery applications using a first-principles framework, ACS Applied Materials & Interfaces 12, 35748 (2020), pMID: 32657117, https://doi.org/10.1021/acsami.0c10000 .
- Qi et al. [2021] J. Qi, S. Banerjee, Y. Zuo, C. Chen, Z. Zhu, M. Holekevi Chandrappa, X. Li, and S. Ong, Bridging the gap between simulated and experimental ionic conductivities in lithium superionic conductors, Materials Today Physics 21, 100463 (2021).
- Zhang et al. [2021] B. Zhang, Z. He, J. Zhong, L. Yang, Z. Lin, and F. Pan, Balancing stability and li-ion conductivity of li10sip2o12 for solid-state electrolytes with the assistance of a body-centered cubic oxygen framework, J. Mater. Chem. A 9, 22952 (2021).
- Flam-Shepherd et al. [2021] D. Flam-Shepherd, T. C. Wu, and A. Aspuru-Guzik, MPGVAE: improved generation of small organic molecules using message passing neural nets, Machine Learning: Science and Technology 2, 045010 (2021).
- Jiménez-Luna et al. [2020] J. Jiménez-Luna, A. Cuzzolin, G. Bolcato, M. Sturlese, and S. Moro, A deep-learning approach toward rational molecular docking protocol selection, Molecules 25, 10.3390/molecules25112487 (2020).
- Hall et al. [2017] R. J. Hall, C. W. Murray, and M. L. Verdonk, The fragment network: A chemistry recommendation engine built using a graph database, Journal of Medicinal Chemistry 60, 6440 (2017), pMID: 28712298, https://doi.org/10.1021/acs.jmedchem.7b00809 .
- Rodríguez-Espigares et al. [2020] I. Rodríguez-Espigares, M. Torrens-Fontanals, J. K. Tiemann, D. Aranda-García, J. M. Ramírez-Anguita, T. M. Stepniewski, N. Worp, A. Varela-Rial, A. Morales-Pastor, B. Medel-Lacruz, et al., Gpcrmd uncovers the dynamics of the 3d-gpcrome, Nature Methods 17, 777 (2020).
- Hospital et al. [2015] A. Hospital, P. Andrio, C. Cugnasco, L. Codo, Y. Becerra, P. D. Dans, F. Battistini, J. Torres, R. Goñi, M. Orozco, and J. L. Gelpí, BIGNASim: a NoSQL database structure and analysis portal for nucleic acids simulation data, Nucleic Acids Research 44, D272 (2015), https://academic.oup.com/nar/article-pdf/44/D1/D272/16661850/gkv1301.pdf .
- Mixcoha et al. [2016] E. Mixcoha, R. Rosende, R. Garcia-Fandino, and Á. Piñeiro, Cyclo-lib: a database of computational molecular dynamics simulations of cyclodextrins, Bioinformatics 32, 3371 (2016), https://academic.oup.com/bioinformatics/article-pdf/32/21/3371/7889578/btw289.pdf .
- van der Kamp et al. [2010] M. W. van der Kamp, R. D. Schaeffer, A. L. Jonsson, A. D. Scouras, A. M. Simms, R. D. Toofanny, N. C. Benson, P. C. Anderson, E. D. Merkley, S. Rysavy, D. Bromley, D. A. Beck, and V. Daggett, Dynameomics: A comprehensive database of protein dynamics, Structure 18, 423 (2010).
- Coudert [2019] F.-X. Coudert, Materials databases: The need for open, interoperable databases with standardized data and rich metadata, Advanced Theory and Simulations 2, 1900131 (2019), https://onlinelibrary.wiley.com/doi/pdf/10.1002/adts.201900131 .
- Ward et al. [2014] C. H. Ward, J. A. Warren, and R. J. Hanisch, Making materials science and engineering data more valuable research products, Integrating Materials and Manufacturing Innovation 3, 292 (2014).
- Himanen et al. [2019] L. Himanen, A. Geurts, A. S. Foster, and P. Rinke, Data-driven materials science: Status, challenges, and perspectives, Advanced Science 6, 1900808 (2019), https://onlinelibrary.wiley.com/doi/pdf/10.1002/advs.201900808 .
- Kalidindi and De Graef [2015] S. R. Kalidindi and M. De Graef, Materials data science: Current status and future outlook, Annual Review of Materials Research 45, 171 (2015), https://doi.org/10.1146/annurev-matsci-070214-020844 .
- Plimpton [1995] S. Plimpton, Fast parallel algorithms for short-range molecular dynamics, Journal of computational physics 117, 1 (1995).
- Thompson et al. [2022] A. P. Thompson, H. M. Aktulga, R. Berger, D. S. Bolintineanu, W. M. Brown, P. S. Crozier, P. J. in’t Veld, A. Kohlmeyer, S. G. Moore, T. D. Nguyen, et al., Lammps-a flexible simulation tool for particle-based materials modeling at the atomic, meso, and continuum scales, Computer Physics Communications 271, 108171 (2022).
- Mathew and Varia [2014] S. Mathew and J. Varia, Overview of amazon web services, Amazon Whitepapers (2014).
- [33] Lammps manual: dump command, https://docs.lammps.org/dump.html.
- Walke [2022] J. Walke, React - a javascript library for building user interfaces, https://reactjs.org/ (2022).
- Xie et al. [2021] T. Xie, A. France-Lanord, Y. Wang, J. Lopez, M. A. Stolberg, M. Hill, G. M. Leverick, R. Gomez-Bombarelli, J. A. Johnson, Y. Shao-Horn, et al., Accelerating the screening of amorphous polymer electrolytes by learning to reduce random and systematic errors in molecular dynamics simulations, arXiv preprint arXiv:2101.05339 (2021).
- Brown and McMahon [2002] I. D. Brown and B. McMahon, Cif: the computer language of crystallography, Acta Crystallographica Section B: Structural Science 58, 317 (2002).
- France-Lanord and Grossman [2019] A. France-Lanord and J. C. Grossman, Correlations from ion pairing and the nernst-einstein equation, Phys. Rev. Lett. 122, 136001 (2019).
- Moriwaki et al. [2018] H. Moriwaki, Y.-S. Tian, N. Kawashita, and T. Takagi, Mordred: a molecular descriptor calculator, Journal of cheminformatics 10, 1 (2018).
- Pedregosa et al. [2011] F. Pedregosa, G. Varoquaux, A. Gramfort, V. Michel, B. Thirion, O. Grisel, M. Blondel, P. Prettenhofer, R. Weiss, V. Dubourg, et al., Scikit-learn: Machine learning in python, the Journal of machine Learning research 12, 2825 (2011).
- Xie and Grossman [2018] T. Xie and J. C. Grossman, Crystal graph convolutional neural networks for an accurate and interpretable prediction of material properties, Physical review letters 120, 145301 (2018).
- Li et al. [2012] Z. Li, G. D. Smith, and D. Bedrov, Li+ solvation and transport properties in ionic liquid/lithium salt mixtures: A molecular dynamics simulation study, The Journal of Physical Chemistry B 116, 12801 (2012), pMID: 22978679, https://doi.org/10.1021/jp3052246 .
- Kubisiak and Eilmes [2017] P. Kubisiak and A. Eilmes, Molecular dynamics simulations of ionic liquid based electrolytes for na-ion batteries: Effects of force field, The Journal of Physical Chemistry B 121, 9957 (2017), pMID: 28976751, https://doi.org/10.1021/acs.jpcb.7b08258 .
- Gudla et al. [2020] H. Gudla, C. Zhang, and D. Brandell, Effects of solvent polarity on li-ion diffusion in polymer electrolytes: An all-atom molecular dynamics study with charge scaling, The Journal of Physical Chemistry B 124, 8124 (2020), pMID: 32840375, https://doi.org/10.1021/acs.jpcb.0c05108 .