Primary Cosmic Ray Energy Spectrum and Mean
Mass Composition Using Data from the TAIGA Astrophysical Complex
V. Prosin1 I. Astapov6 P. Bezyazeekov2 E. Bonvech2 A. Borodin7 A. Bulan1 A. Chiavassa4 D. Chernov1 A. Dyachok2 A. Gafarov2 A. Garmash11,9 V. Grebenyuk7,8 O. Gress2 E. Gress2 T. Gress2 A. Grinyuk7 O. Grishin2 A. D. Ivanova2 A. L. Ivanova9,2 N. Kalmykov1 V. Kindin6 S. Kiryuhin2 R. Kokoulin6 K. Komponiets6 E. Korosteleva1 V. Kozhin1 E. Kravchenko9,11 A. Kryukov1 L. Kuzmichev1 A. Lagutin10 M. Lavrova7 Y. Lemeshev2 B. Lubsandorzhiev3 N. Lubsandorzhiev1 A. Lukanov3 D. Lukyantsev2 S. Malakhov2 R. Mirgazov2 R. Monkhoev2 E. Okuneva6 E. Osipova1 A. Pakhorukov2 A. Pan7 L. Panasenko11 L. Pankov2 A. D. Panov1 A. Petrukhin6 I. Poddubny2 D. Podgrudkov1 V. Poleschuk2 V. Ponomareva2 E. Popova1 E. Postnikov1 V. Ptuskin5 A. Pushnin2 R. Raikin10 A. Razumov1 G. Rubtsov3 E. Ryabov2 Y. Sagan7,8 V. Samoliga2 A. Silaev1 A. Silaev(junior)1 A. Sidorenkov3 A. Skurikhin1 A. Sokolov9,11 L. Sveshnikova1 V. Tabolenko2 A. Tanaev2 B. Tarashchansky2 M. Y. Ternovoy2 L. Tkachev7 R. Togoo12 N. Ushakov3 A. Vaidyanathan11 P. Volchugov1 N. Volkov10 D. Voronin3 A. Zagorodnikov2 A. Zhaglova2 D. Zhurov2,13 I. Yashin6
1 Skobeltsyn Institute of Nuclear Physics, Moscow State University, Moscow, Russia
2 Applied Physics Institute of Irkutsk State University, Irkutsk, Russia
3 Institute for Nuclear Research of the RAS, Troytsk, Moscow, Russia
4 Dipartimento di Fisica Generale Universiteta di Torino and INFN, Turin, Italy
5 Puskov Institute of Terrestrial Magnetism, Ionosphere and Radio Wave Propagation of the RAS, Troitsk, Moscow. Russia
6 National Research Nuclear University MEPhI, Moscow, Russia
7 Joint Institute for Nuclear Research, Dubna, Moscow Region, Russia
8 DUBNA University, Dubna, Moscow Region, Russia
9 Budker Institute of Nuclear Physics SB RAS, Novosibirsk, Russia
10 Altai State Univeristy, Barnaul, Russia
11 Novosibirsk State University, Novosibirsk, Russia
12 Institute of Physics and Technology Mongolian Academy of Sciences, Ulaanbaatar, Mongolia
13 Irkutsk National Research Technical University, Irkutsk, Russia
* v-prosin@yandex.ru
![]() 21st International Symposium on Very High Energy Cosmic Ray Interactions (ISVHECRI 2022)
21st International Symposium on Very High Energy Cosmic Ray Interactions (ISVHECRI 2022)
Online, 23-27 May 2022
10.21468/SciPostPhysProc.?
Abstract
The corrected dependence of the mean depth of the EAS maximum on the energy was obtained from the data of the Tunka-133 array for 7 years and the TAIGA-HiSCORE array for 2 years. The parameter , characterizing the mean mass compositon was derived from these results. The differential energy spectrum of primary cosmic rays in the energy range of – eV was reconstructed using the new parameter the Cherenkov light flux at the core distance 100 m. Change of the parameter for the energy reconstuction for the TAIGA-HiSCORE from to provides a decreasing energy threshold for the spectrum to about 200 TeV.
1 Introduction
The energy spectrum and mass composition of primary cosmic rays are the main characteristics that can be obtained by studying extensive air showers (EAS). The total flux of Cherenkov light is proportional to the total energy scattered by the shower in the atmosphere. The lateral distribution function (LDF) of the EAS Cherenkov light reflects the position of the shower development maximum, which in turn characterizes the mass of the primary particle. The main aim of the present work is to achieve a lower energy threshold by the new method of energy reconstruction, descibed below.
2 Brief description of the arrays
Several arrays that detect the EAS Cherenkov light were successively constructed in the Tunka Valley. The most productive arrays were the Tunka-25 (2000 - 2005) [1], which consisted of 25 detectors with a sensitive area of 0.1 each, covering a total area of approximately 0.1 , and the Tunka-133 (2009 - 2017) [2], consisted finally of 175 detectors with a sensitive area of 0.03 , covering an area of approximately 3 . The experimetal data was accumulated over 350 clear moonless nights. The total time of the data acquisition was 2175h. Their modern successor is the TAIGA-HiSCORE [3] array, a part of the TAIGA experimental complex [4]. TAIGA-HiSCORE single station has a sensitive area of 0.5 . Every station has it’s own trigger. The stations are merged to an EAS event in case of station hits coincident inside a time gate of 3 s. This work presents the TAIGA-HiSCORE data that was obtained using 67 stations (two first clusters) during 135 clear moonless nights in the seasons of 2019 - 2020 and 2020 - 2021. The total data acquisition time was 327 h.
![[Uncaptioned image]](/html/2208.01689/assets/x2.png)
|
![[Uncaptioned image]](/html/2208.01689/assets/x3.png)
|
3 Reconstruction of the EAS parameters
The reconstruction of the EAS parameters for the Tunka-133 array is described in [2]. The same algorithms and the fitting functions are used for the TAIGA-HiSCORE data processing [3]. We use the ratio as a quantitative parameter of LDF steepness. Here, is the Cherenkov light flux at a distance, R, in meters. One has to control that there are measurements of light flux at core distances m and m. The first of these conditions is applied to the events for the primary energy eV for Tunka-133 and eV for the TAIGA-HiSCORE. CORSIKA simulation [5] confirmed that the Cherenkov light LDF steepness is determined solely by the thickness of the atmosphere between the array and the depth of the EAS maximum (). Here, is the total depth of the atmosphere. The calculated connection between and , inside the limited range of parameter from 2.5 to 9, can be fitted inside the following expression [5]:
| (1) |
The standard deviation of simulated points from the fitting line for this range is approximately 15 [5].
4 Mean experimental depth of the EAS maximum
The above described parameter of the LDF steepness was applied to analyze the data of both the Tunka-133 and TAIGA-HiSCORE arrays. The depth of the maximum is found by the formula:
| (2) |
where 965 is the total depth of the atmosphere at the location of the arrays in the Tunka Valley. To obtain undistorted estimations of the depth of the maximum, showers are selected for the zenith angle and the energy above eV for the Tunka-133 array and above eV for TAIGA-HiSCORE. We have 69000 events for 7 years of operation of the Tunka-133 and 380000 events for 2 years of operation of TAIGA-HiSCORE. The expermental results are shown in Fig. 1. The data of both arrays, despite the difference in their geometry, agree well with each other, providing a wide energy range from to eV. Our experimental data are compared with the direct measurements of the depth of the maximum obtained by observing the fluorescent EAS light at the Pierre Auger Observatoy (PAO) [10] and Telescope Array (TA) [11]. A close agreement of our data with the PAO data is observed at an energy of eV. All the experimental results are compared with theoretical curves calculated using the QGSJET-II-04 model [12] for primary protons and iron nuclei.
Fig. 2 shows the results of recalculation from the mean depth of the maximum to the parameter the average logarithm of the atomic number using the QGSJET-II-04 model. Qualitatively, the behavior of the mean mass composition repeats what was published in our previous studies [13] becoming heavier in the energy range of - eV and lighter with a further increase in energy. However, the mean composition in the entire energy range under consideration is estimated as mostly light.
5 Cherenkov light flux at a core distance 100 m as a new estimator of energy
The TAIGA-HiSCORE array structure is a square net of stations with a step of about 100 m. So the minimal core distance for which light flux can be reconstructed for almost all the events is about 100 m. Our previous parameter for the energy reconstruction was light flux at a core distance 200 m () [3]. When the EAS zenith angle changes from to , changes by less than 10%. Therefore, it was assumed in [3], that does not depend on for a fixed particle energy. It was found by the new CORSIKA simulation that light flux depends on the zenith angle sigificantly more, changing by about 2.5 times with the same change in . So first one needs to recalculate from the measured light flux to the using the new CORSIKA results:
| (3) |
Then can be recalculated to the primary energy using the result of the new CORSIKA simulation:
| (4) |
6 Experimental energy spectrum by the data of TAIGA-HiSCORE
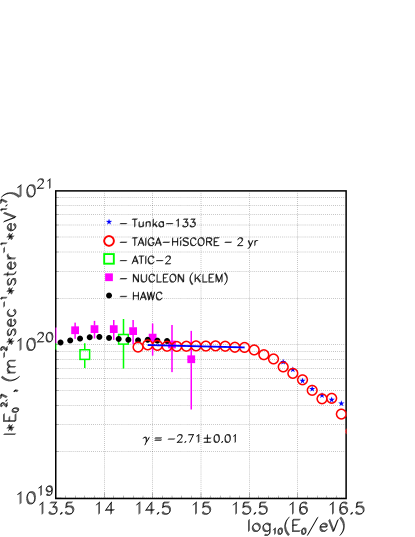
The experimental energy estimation differs from that described at the previous section because the real atmosphere light absorbtion is different from night to night in contradiction with standard absorption assumed in CORSIKA simulations. So first we obtain the integral energy spectrum for the single night using the expression (4). Then we normalize this spectrum to the reference energy spectrum measured by the QUEST experiment [6]. The mean difference of normalization constant from that in expression (4) is 0.03. The differential energy spectrum obtained from the data of TAIGA-HiSCORE array is shown in Fig. 3. Efficiency of the events at the first left point (starting from the energy eV) is more than 95%. Points for the lower energy obtained from the events with lower efficiency are removed. The low energy points of our spectrum are in good agreement with direct balloon [7], satellite [8] and mountain [9] measurements.
7 Conclusions
The new estimations of , derived from the steepness parameter provides good agreement between both the results of our arrays Tunka-133, TAIGA-HiSCORE and Tunka-133 and the direct measurements of at the Pierre Auger Observatory (PAO).
The primary composition, derived from is lighter than it seemed in our previous publications. It is mostly light (p+He) over the whole energy range.
The observed increase of in the energy range - eV demands a new theoretical explanation.
Change of the parameter for the energy reconstruction for the TAIGA-HiSCORE from to provides a decreasing energy threshold for the spectrum to about 200 TeV.
The all particle energy spectrum over the energy range 200 TeV - 3 PeV follows a pure power law with index .
Acknowledgements
The work was performed at the UNU “Astrophysical Complex of MSU-ISU” (agreement EB 075-15-2021-675). The work is supported by RFBR (grants 19-52-44002, 19-32-60003), the RSF(grants 19-72-20067(Section 2)), the Russian Federation Ministry of Science and High Education (projects FZZE-2020-0017, FZZE-2020-0024, and FSUS-2020-0039).
References
- [1] N. Budnev et al, Tunka-25 Air Shower Cherenkov array The main results, Astropart. Phys. 50, 18 (2013), 10.1016/j.astropartphys.2013.09.006.
- [2] N. M. Budnev et al, The primary cosmic-ray energy spectrum measured with the Tunka-133 array, Astropart. Phys. 117, 102406 (2020), 10.1016/j.astropartphys.2019.102406.
- [3] V. Prosin et al, Cosmic Ray Energy Spectrum derived from the Data of EAS Cherenkov Light Arrays in the Tunka Valley, EPJ Web of Conf. 210, 01003 (2019), 10.1051/epjconf/201921001003.
- [4] L. Kuzmichev et al, Experimental Complex TAIGA, Phys. At. Nucl. 83, 1375 (2020), 10.1134/S1063778820090161.
- [5] V. Prosin et al, Energy Spectrum and Mass Composition of Cosmic Rays from the Data of the Astrophysical Complex TAIGA, Physics of Atomic Nulei, 84, 9, 1563 (2021), 10.1134/S1063778821090283.
- [6] E. E. Korosteleva et al, Measurement of cosmic ray primary energy with the atmospheric Cherenkov light technique in extensive air showers, Nucl. Phys. B Proc. Suppl. 165, 74 (2007), 10.1016/j.nuclphysbps.2006.11.012.
- [7] A. D. Panov et al, Energy Spectra of Abundant Nuclei of Primary Cosmic Rays from the Data of ATIC-2 Experiment Final Results, Bull. Russ. Acad. Sci.: Phys. 73, 564 (2009), 10.3103/S1062873809050098.
- [8] A. N. Turundaevskiy et al, Main Results from the NUCLEON Experiment, Bull. Russ. Acad. Sci.: Phys. 85, 353 (2021), 10.3103/S1062873821040377.
- [9] R. Alfaro et al (HAWC Collab.), All-particle cosmic ray energy spectrum measured by the HAWC experiment from 10 to 500 TeV, Phys. Rev. D: Part. Fields 96, 122001 (2017), 10.1103/PhysRevD.96.122001.
- [10] A. Yushkov (for P. A. Collab.), Mass composition of cosmic rays with energies above 1017.2 eV from the hybrid data of the Pierre Auger Observatory, in Proceedings of the 36th ICRC, Madison, USA, PoS(ICRC2019), 482 (2019).
- [11] R. U. Abbasi et al. (T. A. Collab.), Depth of Ultra High Energy Cosmic Ray Induced Air Shower Maxima Measured by the Telescope Array Black Rock and Long Ridge FADC Fluorescence Detectors and Surface Array in Hybrid Mode, Astrophys. J. 858, 76 (2018), 10.48550/arXiv.1801.09784.
- [12] S. Ostapchenko and M. Bleicher, Constraining pion interactions at very high energies by cosmic ray data, Phys. Rev. D: Part. Fields 93, 051501 (2016); arXiv: 1601.06567.; 10.48550/arXiv.1601.06567. EPJ Web of Conf. 208, 02002 (2019), 10.1051/epjconf/201920802002.
- [13] V. V. Prosin et al, Results from Tunka-133 (5 years observation) and from the Tunka-HiSCORE prototype, EPJ Web of Conf. 121, 03004 (2016), 10.1051/epjconf/201612103004.