Resolving the inner parsec of the blazar J1924–2914 with the Event Horizon Telescope
Abstract
The blazar J1924–2914 is a primary Event Horizon Telescope (EHT) calibrator for the Galactic Center’s black hole Sagittarius A∗. Here we present the first total and linearly polarized intensity images of this source obtained with the unprecedented 20 as resolution of the EHT. J1924–2914 is a very compact flat-spectrum radio source with strong optical variability and polarization. In April 2017 the source was observed quasi-simultaneously with the EHT (April 5-11), the Global Millimeter VLBI Array (April 3), and the Very Long Baseline Array (April 28), giving a novel view of the source at four observing frequencies, 230, 86, 8.7, and 2.3 GHz. These observations probe jet properties from the subparsec to 100-parsec scales. We combine the multi-frequency images of J1924–2914 to study the source morphology. We find that the jet exhibits a characteristic bending, with a gradual clockwise rotation of the jet projected position angle of about 90 degrees between 2.3 and 230 GHz. Linearly polarized intensity images of J1924–2914 with the extremely fine resolution of the EHT provide evidence for ordered toroidal magnetic fields in the blazar compact core.
1 Introduction
The radio source J1924–2914 (PKS 1921–293, OV–236) is a radio-loud quasar at a redshift (Wills & Wills, 1981; Jones et al., 2009). The source exhibits strong optical variability and is highly polarized (Wills & Wills, 1981; Pica et al., 1988; Worrall & Wilkes, 1990). While it is extremely compact at long radio wavelengths, very long baseline interferometry (VLBI) observations at centimeter wavelengths were able to resolve a persistent core-jet structure elongated in a northern direction (e.g., Preston et al., 1989; Shen et al., 1997; Tingay et al., 1998; Kellermann et al., 1998). The source is a part of the 15 GHz Monitoring Of Jets in Active galactic nuclei with VLBA Experiments (MOJAVE) source sample111http://www.physics.purdue.edu/astro/MOJAVE/sourcepages/1921-293.shtml and shows a prominent 10 milli-arcsecond scale jet, see Lister et al. (2018). Imaging and Gaussian-component model fitting of observations at frequencies between 5 and 43 GHz conducted between 1994 and 2000 indicated a sharp bend of the inner jet from north-east to north with increasing frequency (Shen et al., 1999, 2002). Motions of individual components across multiple years were observed further downstream in the jet, but not yet in the VLBI core region on sub-milliarcsecond scales.
Early 230 GHz observations with the prototype Event Horizon Telescope (EHT) at three geographical sites (Hawai’i, California, and Arizona) provided a first model of the resolved structure in the inner jet of J1924–2914 via model fitting of amplitudes and closure phases (Lu et al., 2012). The individual components are extended in a direction consistent with the millimeter wavelength inner jet morphology. However, without (quasi-)simultaneous multi-frequency observations, these observations alone cannot link the compact millimeter structures to the large-scale centimeter jet. Furthermore, with a very limited coverage, these observations were unable to reconstruct an image of the source and track its detailed time variability.
Recently, the highly sensitive Atacama Large Millimeter/submillimeter Array (ALMA) was equipped for millimeter VLBI via the ALMA Phasing Project (APP; Matthews et al., 2018; Goddi et al., 2019). In 2017, ALMA participated in its first VLBI science campaign jointly with the Global Millimeter VLBI Array (GMVA) at 86 GHz and the EHT at 230 GHz. In addition to its sensitivity, ALMA provides valuable north–south baselines to the predominantly east–west geometry of the GMVA. These observations enabled a first image of J1924–2914 at 86 GHz (project code MB007; Issaoun et al., 2019). With participation of ALMA at 230 GHz, the EHT Collaboration imaged the horizon-scale emission of M 87∗ (EHTC et al., 2019a, b, c, d, e, f), as well as central regions of the blazar 3C 279 (Kim et al., 2020) and the radio galaxy Cen A (Janssen et al., 2021). The first EHT millimeter images of linearly polarized emission in M 87∗ were published recently (EHTC et al., 2021a, b). In this paper, we present the first total intensity and linear polarization images of J1924–2914 at 230 GHz obtained with the EHT, and make comparisons to the near-contemporaneous GMVA results from Issaoun et al. (2019) and Very Long Baseline Array (VLBA) observations at 2.3 and 8.7 GHz (Hunt et al., 2021).
The EHT array achieves a resolution of 20 as. At the J1924–2914 redshift of (Jones et al., 2009), this corresponds to a linear scale222For the cosmological parameters we have assumed km s-1 Mpc-1, , and (Wright, 2006; Planck Collaboration et al., 2016). of 0.1 pc or, in Schwarzschild radius units , about . No robust mass estimate for J1924–2914’s central black hole was found in the literature. The EHT results reported in this paper are the highest resolution images of a blazar’s linear polarization ever obtained at millimeter wavelengths, likely probing a region within the gravitational sphere of influence of the central supermassive black hole (e.g., Kormendy & Ho, 2013).
2 Observations and data processing
Brightness Temperature ( K)
2.1 230 GHz EHT
Observations of J1924–2914 were carried out by the EHT on 2017 April 5, 6, 7, 10, and 11, interleaved among observations of Sagittarius A∗ (EHTC et al., 2022a), for which J1924–2914 was used as an active galactic nucleus (AGN) calibrator source, along with the blazar NRAO 530 (Jorstad et al., in prep). Eight stations at six geographic sites took part in the observations: ALMA and the Atacama Pathfinder Experiment (APEX) telescope in Chile; the Large Millimeter Telescope Alfonso Serrano (LMT) in Mexico; the IRAM 30 m telescope (PV) in Spain; the Submillimeter Telescope (SMT) in Arizona; the James Clerk Maxwell Telescope (JCMT) and the Submillimeter Array (SMA) in Hawai’i; and the South Pole Telescope (SPT) in Antarctica.
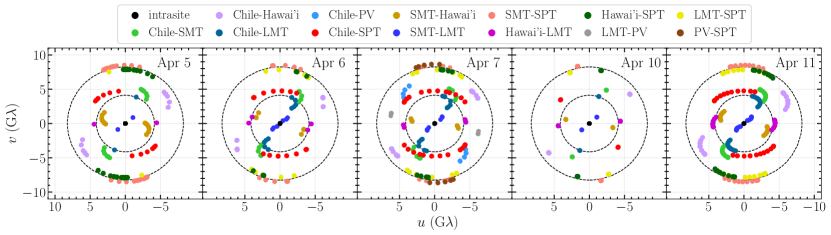
The signals were recorded onto Mark6 recorders at a rate of 32 Gbps in two 2 GHz subbands centered at 227.1 and 229.1 GHz (hereafter low and high bands, respectively), using dual right-hand and left-hand circularly polarized feeds (RCP ad LCP, respectively) for all stations except ALMA and JCMT. ALMA recorded dual linear polarization, which was subsequently converted at the correlation stage to a circular basis by PolConvert (Martí-Vidal et al., 2016; Goddi et al., 2019). The JCMT observed a single circular polarization component during the campaign (predominantly RCP for 2017 April 5 and 6 and LCP for 2017 April 7, 10, and 11). In Figure 1, we show the resulting EHT () coverage for each observing day. Good () coverage on 2017 April 5-7 and 11 facilitated a detailed VLBI imaging of the source at 230 GHz. Due to the very sparse snapshot coverage on 2017 April 10 and the static properties of the source on short timescales (see Section 3), observations on 2017 April 10 were combined with those of 2017 April 11 for analysis.
After observation, the data were shipped to the MIT Haystack Observatory and the Max-Planck-Institut für Radioastronomie in Bonn for correlation, see EHTC et al. (2019b) for details. The resulting data were calibrated using two separate VLBI data reduction pipelines (Blackburn et al., 2019; Janssen et al., 2019) to ensure robustness of the results. Their consistency has been studied in detail in EHTC et al. (2019c), and an example of cross-pipeline comparisons is presented in Appendix A. For the science results presented in this paper we use the EHT-HOPS pathway (Blackburn et al., 2019; EHTC et al., 2019c) complemented by updated postprocessing (most notably with revised a priori flux density calibration; EHTC et al., 2022b). For further information concerning the observations, data collection, processing and validation, see EHTC et al. (2019b, c).
The polarimetric calibration follows the procedures described in EHTC et al. (2021a). Similarly to the M 87∗ polarimetric analysis, JCMT has been flagged from the data for polarimetric imaging of J1924–2914 due to its single polarization configuration. This has no effect on the () coverage as all baselines to Hawai’i are fulfilled by the co-located SMA, which observed in full-polarization at all times. For the polarization leakage (D-term) calibration of the stations with a co-located site (ALMA & APEX, SMA & JCMT), we used the D-terms reported in Appendix D of EHTC et al. (2021a), which were obtained through a robust multi-source fit to the EHT data using polsolve (Martí-Vidal et al., 2021). For the remaining stations (except SPT), the values adopted are derived based on the results reported in Appendix E of EHTC et al. (2021a) and are presented in Table 1. The SPT D-terms were fitted as part of analysis presented in this paper. A consistency test of the assumed leakage coefficients and constraints on the SPT D-terms are given in Appendix B.
| Station | ||
|---|---|---|
| LMT | ||
| SMT | ||
| PV |
Note – Constraints on SPT D-terms are discussed in Appendix B.
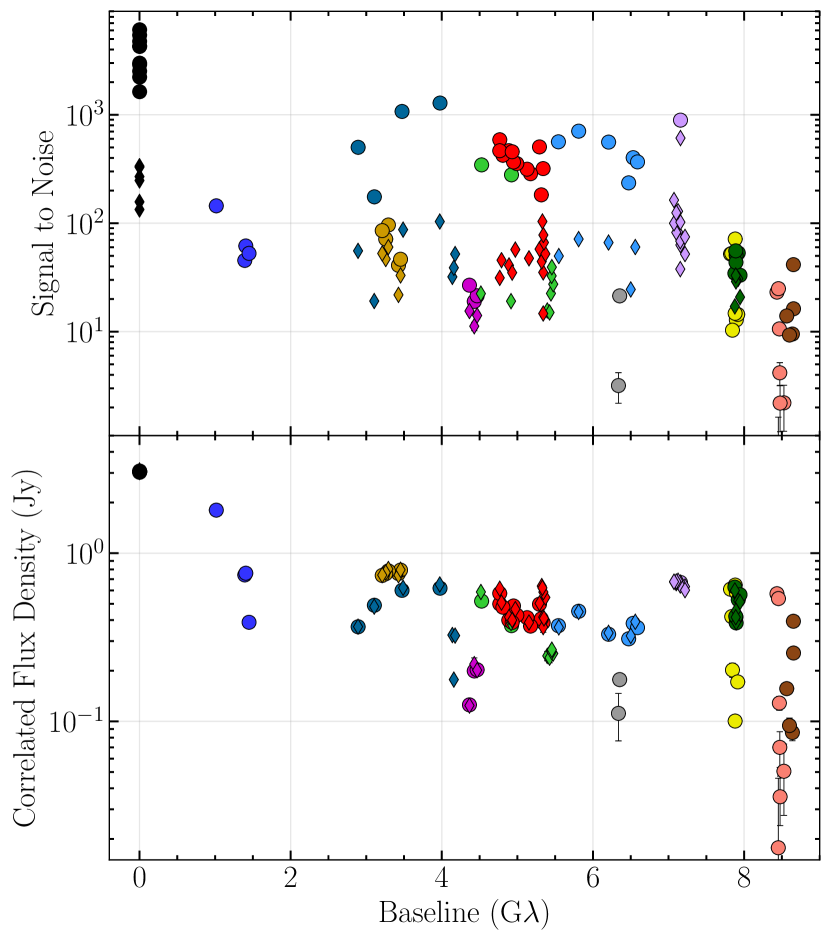
Detections were obtained for J1924–2914 on all participating baselines of the EHT for all observing days. In Figure 2, we show an example of the signal-to-noise ratio (S/N) and correlated flux density on our EHT baselines for 2017 April 7 (low band), which corresponds to the observing day with the best coverage. The baselines to ALMA provide extremely high S/N of several hundreds for data averaged in 5 min intervals, the corresponding APEX baselines offer a S/N about an order of magnitude lower. The data shown in the bottom panel of Figure 2 have been calibrated using a priori calibration information (system temperatures, antenna gains and opacities) provided for the telescopes. The consistency of measurements on the primary (to the sensitive ALMA or SMA) and redundant (to APEX or JCMT, co-located with ALMA and SMA, respectively) baselines verifies the 10% accuracy of the flux density calibration and indicates a good self-consistency of the data set. A network calibration procedure was additionally applied to obtain the final data set (Blackburn et al., 2019), further improving gain calibration of sites with a co-located station by assuming a total compact flux density provided by ALMA (Goddi et al., 2021).
| Date | Data Product | DIFMAP | eht-imaging | SMILI | DMC | Themis |
|---|---|---|---|---|---|---|
| 2017 April 5 | 0.346 | 0.343 | 0.551 | 0.342 | 0.485 | |
| 1.211 | 1.087 | 1.338 | 1.802 | 1.264 | ||
| 1.009 | 0.838 | 1.702 | 2.539 | 1.377 | ||
| 2017 April 6 | 1.226 | 0.579 | 2.13 | 0.791 | 1.143 | |
| 1.850 | 0.910 | 0.935 | 1.074 | 1.350 | ||
| 2.128 | 0.978 | 3.901 | 1.337 | 2.026 | ||
| 2017 April 7 | 1.018 | 0.663 | 1.00 | 0.545 | 1.115 | |
| 2.013 | 0.674 | 2.912 | 0.828 | 2.024 | ||
| 1.983 | 1.191 | 1.791 | 1.286 | 2.031 | ||
| 2017 April 10+11 | 1.994 | 1.171 | 1.111 | 0.914 | 1.671 | |
| 2.895 | 1.123 | 1.437 | 1.211 | 3.592 | ||
| 3.806 | 1.700 | 1.907 | 1.708 | 3.134 |
NOTE – Reduced are calculated using a total error budget containing thermal noise plus an additional complex systematic error corresponding to 2% of the observed visibility amplitude
2.2 86 GHz GMVA+ALMA
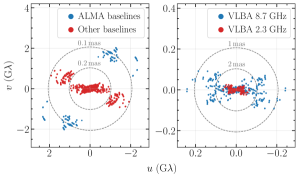
Observations of J1924–2914 at 86 GHz (3.5 mm) were obtained with the GMVA+ALMA on 2017 April 3 in conjunction with observations of Sagittarius A∗ published in Issaoun et al. (2019). The array was composed of eight VLBA antennas, the Green Bank Telescope, the Yebes 40-m telescope, the IRAM 30-m telescope, the Effelsberg 100-m telescope and ALMA. The data were recorded with a bandwidth of 256 MHz at a data rate of 4 Gbps over a 12 h track, of which 8 h included ALMA. The total recorded time on J1924–2914 was about 2 hours. In the left panel of Figure 3 we show the coverage of these observations. These observations yield images with a beam size of () as at 36 deg. The data reduction, processing, and imaging followed a similar pathway to the EHT data, and are described in more detail in Issaoun et al. (2019). Analysis of this data set was challenging because of the large uncertainties in the amplitude gain calibration and low phase stability of the complex visibilities. The 86 GHz image of J1924–2914 presented in this work was reconstructed with the eht-imaging library using only closure quantities (Chael et al., 2016, 2018) to overcome the calibration problems and was originally published in Issaoun et al. (2019). Linear polarization imaging at 86 GHz did not yield robust results that could be interpreted confidently.
2.3 2.3 and 8.7 GHz VLBA
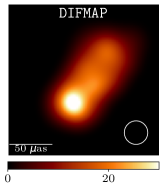
Observations of J1924–2914 at 2.3 and 8.7 GHz were carried out as part of the International Celestial Reference Frame survey with the VLBA (Hunt et al., 2021). The observations were executed in astrometric and geodetic modes, thus providing high positional accuracy. The target was observed simultaneously at the two frequencies, as is customary for geodetic observations. To reduce any variability-induced offset, we select the observation that is closest in time to the EHT observations reported here, on 2017 April 28. The target was observed by all ten stations of the VLBA, where sixteen intermediate frequency sub-bands were recorded, with four centered at 2.3 GHz and twelve at 8.7 GHz, for a total bandwidth of 128 and 384 MHz at the respective frequencies. In the right panel of Figure 3 we show the coverage of these observations. Observations were recorded in right-hand circular polarization mode only, at a data rate of 2 Gbps. For further information on observation and data calibration, refer to Hunt et al. (2021). The calibrated data were imaged using the CLEAN algorithm implemented in the DIFMAP software package (Shepherd, 1997, 2011). The beam sizes are () mas at deg and () mas at deg for the 2.3 and 8.7 GHz observations, respectively. We iterated the reconstruction process using a hybrid imaging loop, consisting of CLEAN and a phase self-calibration cycle, with a stopping criterion of obtaining three times the noise floor of the residual image. The final images are presented in Section 4.1 as part of the multi-frequency analysis.
| 2017 April 6 | 2017 April 7 | 2017 April 11 |
|---|---|---|
eht-imaging
|
 |
|
DMC
|
 |
|
3 EHT Image Analysis Results
3.1 Total Intensity
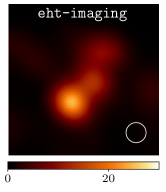
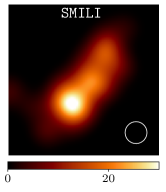
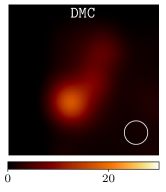
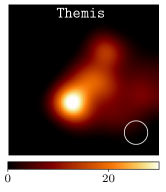
The total-intensity analysis was performed on four individual observing epochs, 2017 April 5, 6, 7, and 10+11. The three imaging software packages used for the analysis of the EHT observations of M 87∗ (EHTC et al., 2019d) were employed to reconstruct total-intensity images of J1924–2914: the Regularized Maximum Likelihood (RML) software eht-imaging (Chael et al., 2016, 2018) and SMILI (Akiyama et al., 2017b, a); and the CLEAN algorithm implemented in the DIFMAP software package (Shepherd, 1997, 2011). Following the development of posterior exploration techniques for the M 87∗ polarization results (EHTC et al., 2021a), we utilized two Markov chain Monte Carlo framework algorithms in addition to the imaging methods: DMC (Pesce, 2021) and Themis (Broderick et al., 2020a, b). The reconstructions typically combine both low and high band data sets, given the very small fractional bandwidth difference and high inter-band consistency reported in EHTC et al. (2019c) and EHTC et al. (2021a).
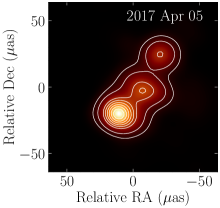
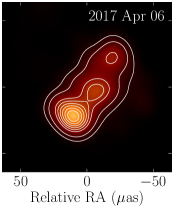
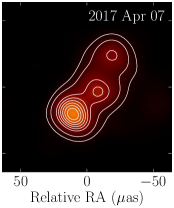
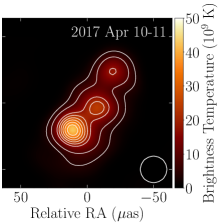
The total-intensity structure of J1924–2914 at 230 GHz is very resilient to various user-based choices in the imaging process, leading to an easily-recoverable three-component structure shown in Figures 4 and 5. While the reconstructed source morphology appears robust, the total compact flux density within the 200 as field of view and in the three components is more ambiguous. An upper limit is provided by the simultaneous connected-element interferometric-ALMA measurements reported in Goddi et al. (2021), that is around 3.2 Jy, with small day-to-day variations below 0.1 Jy, within the calibration uncertainties. Different analysis pipelines recover anything between 2.0 and 3.2 Jy within the 200 as field of view. Furthermore, the algorithms differ in their detailed approach to the image reconstruction. As an example, SMILI favors image sparsity, keeping brightness in a compact sub-structures, while DMC does not encourage sparsity in any way, possibly allowing for more flux density to be distributed throughout the field of view as a dynamic range-limited noise floor. Additionally RML methods typically assume compact imaging priors, discouraging emission further away from the core. For these reasons in Figure 4 SMILI and DMC have similar total brightness, but the main three-component structure appears significantly dimmer in the DMC reconstruction. Furthermore, the total compact flux density ambiguity is a particularly severe problem for the EHT array, which for the observations of J1924–2914 has no baselines in the range between 2 M and 0.6 G, a single SMT–LMT baseline in the range 0.6-1.5 G and no coverage between 1.5 and 2.8 G. Hence, constraining structures larger than as is extremely challenging with EHT data.
Monitoring by the SMA333http://sma1.sma.hawaii.edu/callist/callist.html?plot=1924-292 shows that the total compact flux density at 1.3 mm remained in the Jy range since 2013 until the end of 2021, hence the EHT 2017 observations should correspond to a representative state of the source in this low luminosity period. In early 2009 the source went through a flaring phase, when the total flux density went up to about 10 Jy. The proto-EHT VLBI results reported by Lu et al. (2012) correspond to this period. Interestingly, while there is much more flux density in the 2009 data set on short baselines (about 6 Jy at 0.6 G), the 2009 and 2017 data sets show a nearly consistent correlated flux of Jy on the shared Hawai’i–SMT baseline (3-3.5 G in both epochs). This suggests that the 2009 flare event could be related to a more extended region, possibly further downstream from the 1.3 mm VLBI core region.
In Table 2, we show the reduced calculated for the low band data sets averaged in 120 s bins, as a metric of the fit quality to closure quantities (closure phases – , log closure amplitudes – ; Thompson et al., 2017; Blackburn et al., 2020) and visibility amplitudes () for the final representative (or ‘fiducial’) images from all methods and all observing days. The best reconstructions from the imaging methods based on least-squares fitting to closure quantities and the mean images from the posterior exploration methods were chosen as the fiducial images. The eht-imaging and DMC models exhibit the best values in the metric with consistently good performance for all days, and hence we focus on those two software packages in the subsequent quantitative analysis. In Figure 4, we show the fiducial images for all methods for the 2017 April 7 observations, restored to a resolution of 20 as. In Figure 5, we show the method-averaged images across our four observing epochs (2017 April 10 and 11 are combined). The method-averaging procedure reduces the impact of method-specific systematics and provides a more conservative image-domain representation of the source, highlighting image features consistently reconstructed across different algorithms. However, the averaged image may fit the visibility domain observations to a lesser degree than the individual reconstructions, and hence more quantitative studies typically rely on the analysis of individual pipelines (e.g., EHTC et al., 2019d; Kim et al., 2020; EHTC et al., 2021a). The stability and robustness of the J1924–2914 image and derived amplitude gains were also confirmed in EHTC et al. (2022b) for the purpose of the calibrator gain transfer for the imaging of Sgr A∗ (EHTC et al., 2022c). We verified that imaging merged data sets from separate days generally leads to a decrease in the fit quality, which justifies the choice to analyze observing days separately.
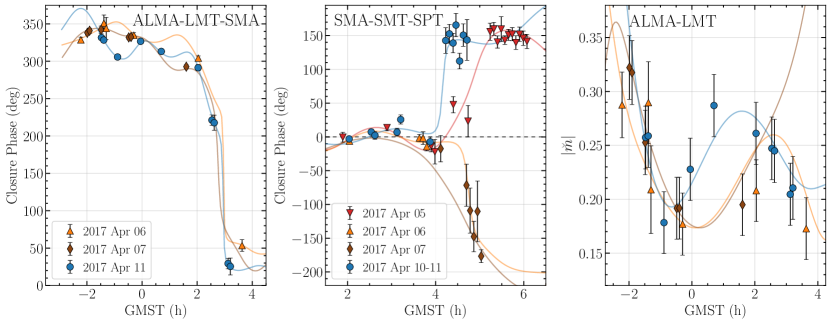
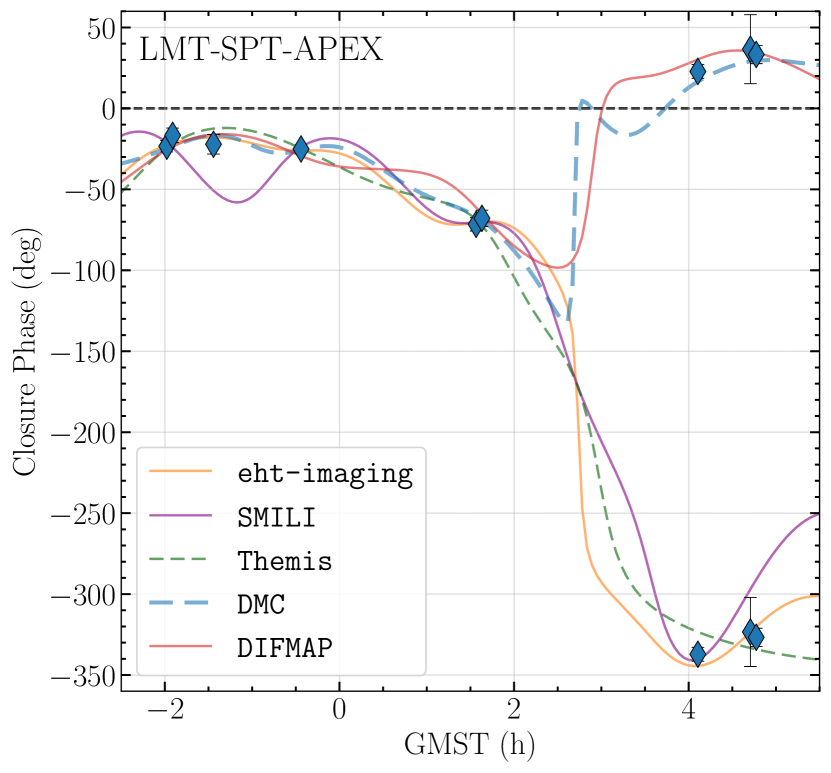
The total-intensity structure of J1924–2914 is very stable across the duration of the EHT 2017 campaign. Examples of this consistency are shown in Figure 6, where we plot closure phases (Thompson et al., 2017; Blackburn et al., 2020) from the EHT observations of J1924–2914 on two triangles along with the fits obtained by the eht-imaging pipeline for different observing days. In particular, the left panel of Figure 6 presents closure phases on the sensitive ALMA–LMT–SMA triangle, showing good agreement of the models obtained for 2017 April 6, 7 and 11. The SMA–SMT–SPT closure phases (middle panel of Figure 6) are consistent in the first part of the track, but about GMST=4 h the models diverge, with 2017 April 5 and 10-11 indicating a rapid closure phase growth, and 2017 April 6 and 7 a rapid decrease of the closure phase. After GMST=5 h, the models are consistent again, as the phase is wrapping with a 360 deg period. There is some evidence for structural evolution between 2017 April 5-7 and April 10-11, however, such phase degeneracies on triangles involving long baselines can be caused by small structural changes in the image domain, such as single as-scale relative motion of the components (Kim et al., 2020). We quantify the image structure evolution in Section 3.4. Furthermore, we can track down the degeneracy seen in the middle panel of Figure 6 to the absolute phase ambiguity seen on baselines between SPT and SMT/LMT/Hawai’i. In Figure 7 we show that the same degeneracy can be seen on a single day between our five imaging pipelines, all fitting the available data well and resulting in very similar models, e.g., eht-imaging and DMC images seen in Figure 4.
3.2 Linear polarization
Due to the high consistency between all five methods in total intensity imaging, we employed one RML imaging method (eht-imaging) and one posterior exploration method (DMC) exhibiting particularly good values of (see Table 2) to streamline the polarimetric imaging and analysis. Both software packages have been extensively tested, including their performance on polarimetric reconstructions of synthetic images, see Appendix J of EHTC et al. (2021a). We focus on the three observing days which include the sensitive ALMA array (2017 April 6, 7, and 11). Additionally, the presence of ALMA in the array enables a straightforward calibration of the absolute electric vector position angle (EVPA). In the right panel of Figure 6 we demonstrate the consistency of the RML models with the polarimetric data. We are using the absolute value of the Fourier domain fractional polarization (Johnson et al., 2015),
| (1) |
on the very sensitive ALMA–LMT baseline, where , , and are Fourier domain Stokes components of the radiation field. Given the rotation measure value of rad m-2 reported in Goddi et al. (2021), we expect that Faraday rotation effects do not affect the observed EVPA by more than 5 deg at the observing frequency of 230 GHz.
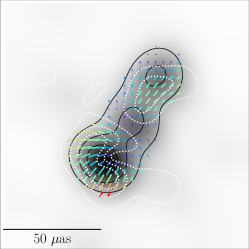
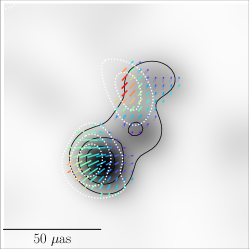
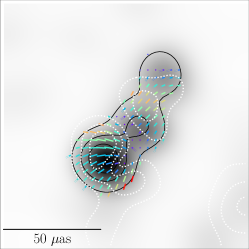
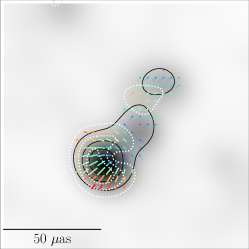
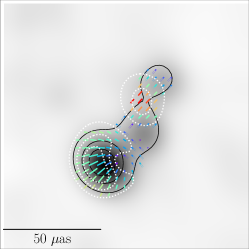
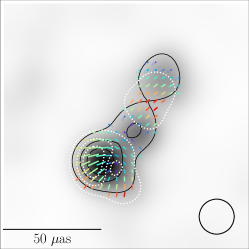
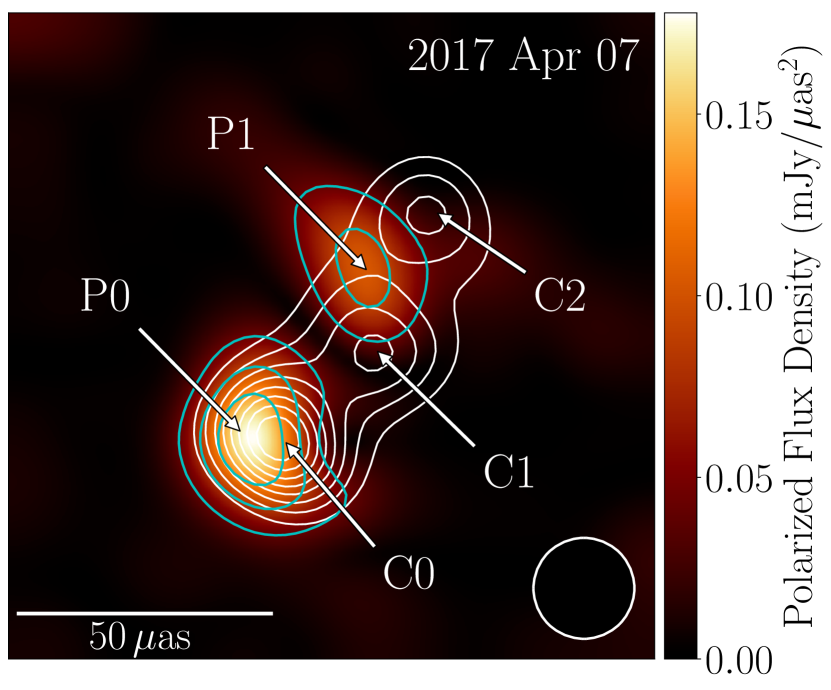
In Figure 8, we show the fiducial polarimetric images of J1924–2914 for the three days with ALMA and two analysis pipelines. The linearly polarized emission is localized in the VLBI core (the brightest and southernmost component , see Section 3.4) and in-between the second and third total-intensity components along the jet direction. In these two regions, the resolved image-domain fractional polarization reaches %. While the EVPAs seen in the outer jet components are mainly aligned parallel to the jet axis, the EVPA pattern in the core region rotates in a fan-like pattern, causing depolarization in the image-integrated results. These features are persistent for all observing days and across methods.
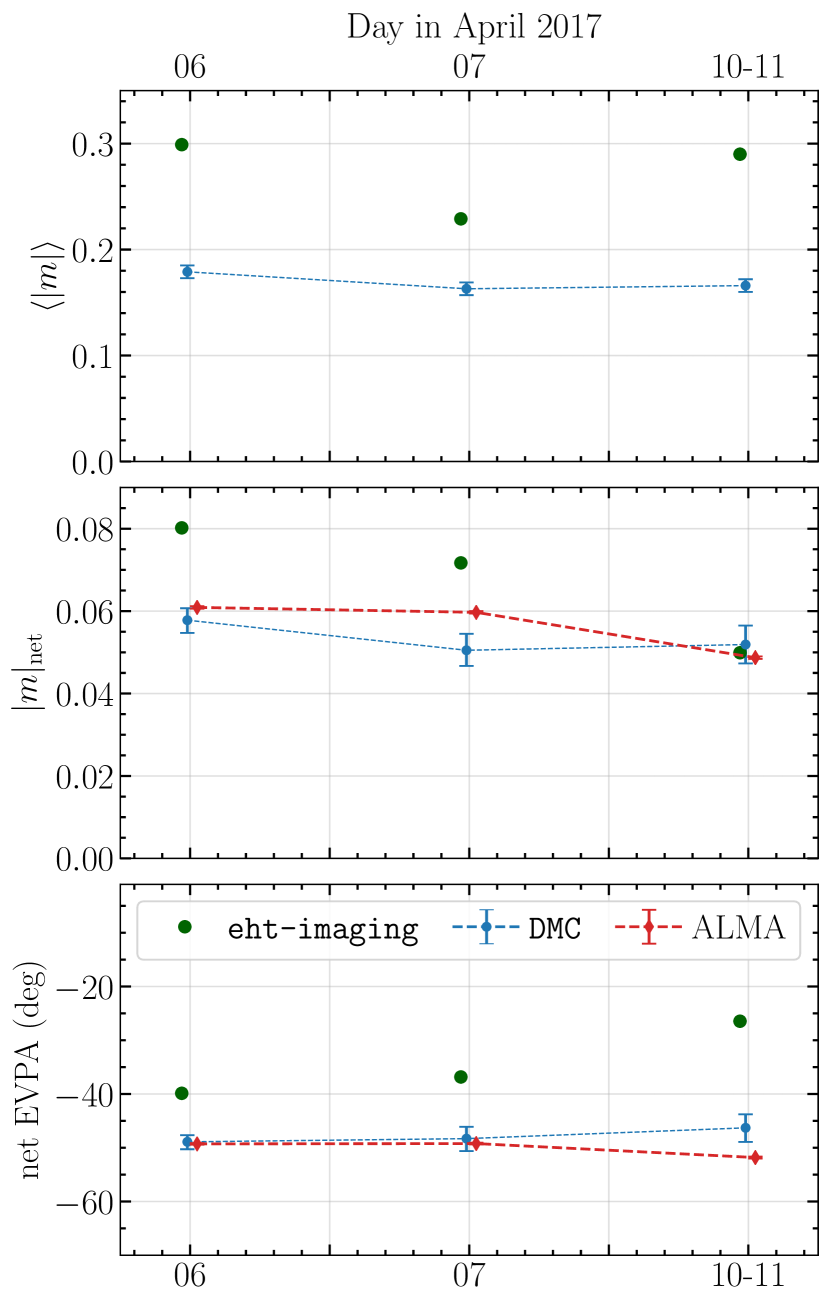
We can characterize the image-integrated linear polarization (over a 200 as field of view) with the following metrics. First, the intensity-weighted average polarization fraction across the resolved EHT image (we blur models with a 15 as circular Gaussian beam) is given by
| (2) |
Here , and are the image-domain Stokes parameters, and the sums are taken over all pixels in the image. In the first panel of Figure 9 we show across observing days and imaging pipelines to be about 20-30 %. In Figure 8 we see that the largest contribution to comes from the core region.
A second metric is the coherently-averaged polarization fraction , representing the unresolved fractional polarization in the 200 as field of view,
| (3) |
In the middle and bottom panels of Figure 9 we show the absolute values and EVPAs of at about 6% and -50 deg, respectively. Comparing these results with the ALMA measurements reported by Goddi et al. (2021) we find overall good consistency, in particular with the DMC pipeline. This indicates that the polarized emission unresolved by ALMA with arcsec resolution is mostly confined to the narrow field of view of the EHT. The large difference between and is related to the large EVPA variation in the image, as seen in the core component in Figure 8.
3.3 Circular polarization
As DMC is a posterior-exploration code performing full-Stokes modeling (Pesce, 2021), we can use the recovered posterior distributions to determine whether the 230 GHz images contain statistically significant detections of circular polarization. Moreover, in contrast to other analysis methods that we consider, DMC explores relative complex polarimetric station gains as parameters of the fitted image, thus providing more robustness against systematic uncertainties in the polarimetric a priori flux density calibration. We measure the detection confidence in the resolved image as the ratio between the local mean posterior and the local posterior standard deviation of the estimated circular polarization, evaluated based on 1000 images drawn from the posterior distribution. Our confidence does not exceed at any location in the image on any observing day. The distribution of net (image-averaged) circular polarization is also consistent with zero, in agreement with the findings of Goddi et al. (2021). For comparison, the same procedure determines the confidence in the source structure corresponding to over 30 when applied to Stokes images, and about when applied to linear polarization images.
3.4 Image components feature extraction
In Figure 10 we show a diagram of the different components in total intensity and linear polarization on which image domain-based feature extraction was performed across observing days and methods. We identify the brightest total intensity component at the south-eastern end of the jet as the VLBI core , following the image morphology at lower frequencies, and the other total intensity features as the first jet component , and the second jet component . The components showing the highest linear polarization are in the core region, and the jet component , the latter located between and .
In case of DMC, similarly as in the Section 3.3, we consider 1000 images drawn from the posterior distribution. For each image, we perform an image-domain brightness maxima search, identifying them with the maxima of components indicated in Figure 10. We then define binary masks around each extremum to compute the total flux density corresponding to each component (Figure 11), and the positions of the flux density centroids (Figure 12). The errorbars reflect the 68% confidence intervals of individual measured quantities extracted from DMC posteriors. DMC enables parameter extraction for all epochs, apart from EVPA measurements on April 5, which is the day without ALMA participation and hence lacks the absolute EVPA calibration. Additionally we show a similar measurement obtained from a single eht-imaging reconstruction per day (markers without the errorbars in Figures 11-12). The total intensity eht-imaging results are available for all epochs, while polarization results are only available for the days with ALMA.
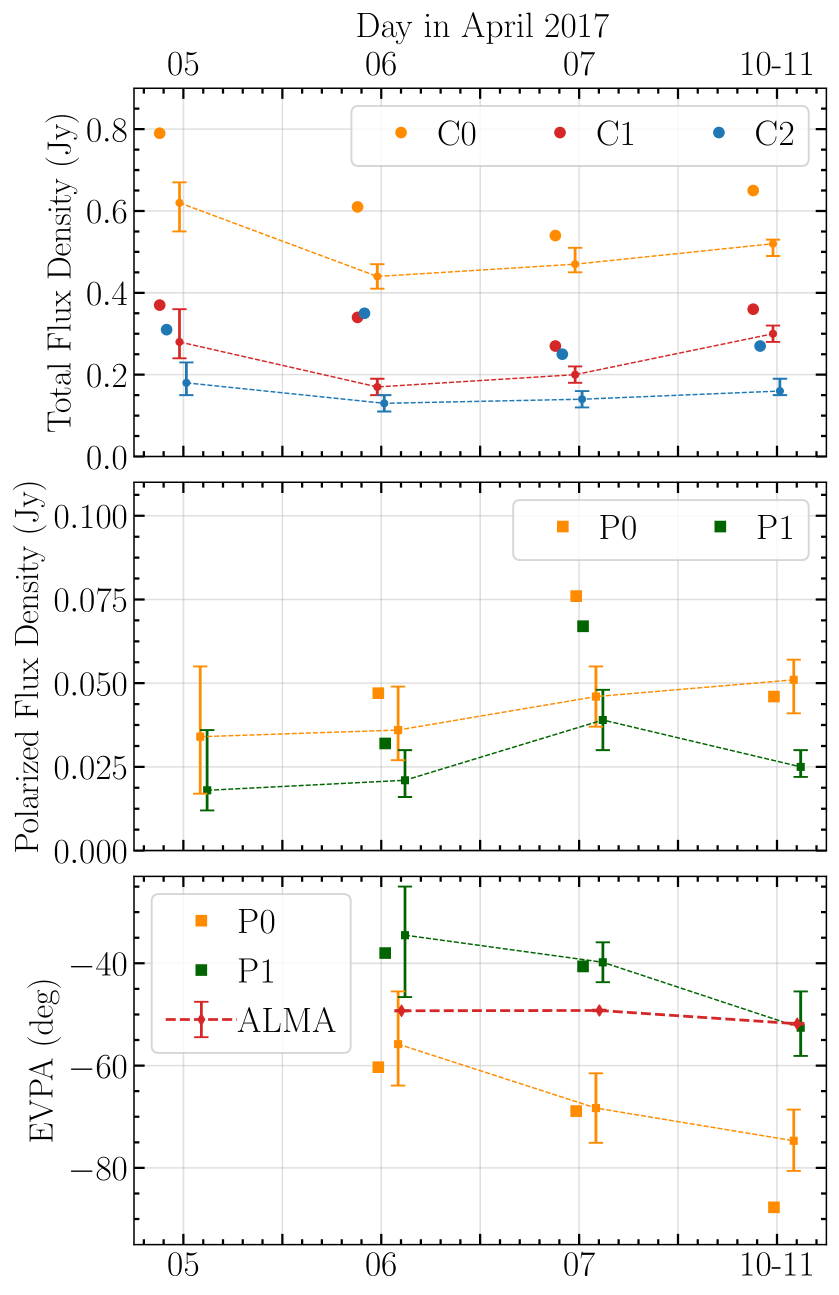
In Figure 11, we present the total-intensity and polarization properties of the components identified in Figure 10 across the four observing days. We show the variation of total flux density, linear polarization flux density and EVPA integrated over each component across the EHT observing campaign extracted from the eht-imaging and DMC imaging results. The southernmost component has the highest total flux density and is assumed to be the 230 GHz VLBI core. For the component-integrated EVPA, we also compare the results with the image-integrated EVPA measured from simultaneous interferometric-ALMA observations in Goddi et al. (2021). We notice a bias between component flux densities identified with eht-imaging and DMC, with the former returning values larger by about 25% for and components. We attribute the effect to imaging algorithm systematics, particularly to sparsity-based regularization employed for the eht-imaging reconstructions, see the discussion in Section 3.1. Given the associated uncertainties, there are no strong indications of the time evolution of the component flux density on the timescale of our EHT observations. The core component is about 2 times brighter than and , the latter two showing similar flux densities. While has a higher polarized flux density than , the EVPA varies by about 90 deg across the compact core component, consistently between days and methods (see Figure 8), adding destructively in Figure 11. When we add absolute values of the linear polarization instead of coherently adding complex numbers, we find about 0.1 Jy in the region for images blurred to a 15 as resolution. There is also a notable EVPA rotation trend observed in both and components and not observed in the ALMA-only data (bottom panel of Figure 11). While this feature is not very statistically significant and may be a statistical fluke, it may also indicate some systematic VLBI calibration bias. However, the bias in the absolute EVPA calibration, which follows the ALMA QA2 calibration (Goddi et al., 2021), would be expected to impact all EHT sources in a similar fashion, and an opposite trend in EVPA was found for M 87∗ (EHTC et al., 2021a). Since the net EVPA of VLBI images is consistent with the ALMA-only measurements (at least for the DMC images, see Figure 9), this implies that the EVPA shift of the components is compensated by the change in the residual net EVPA within the field of view. Hence, if the effect is systematic, it appears to be related to the imaging or parameter extraction algorithms, rather than to the data calibration. In any case, we conclude that a deg consistency between the ALMA-only data and the sum of the VLBI components is overall reassuring and constrains the contribution from the systematic errors.
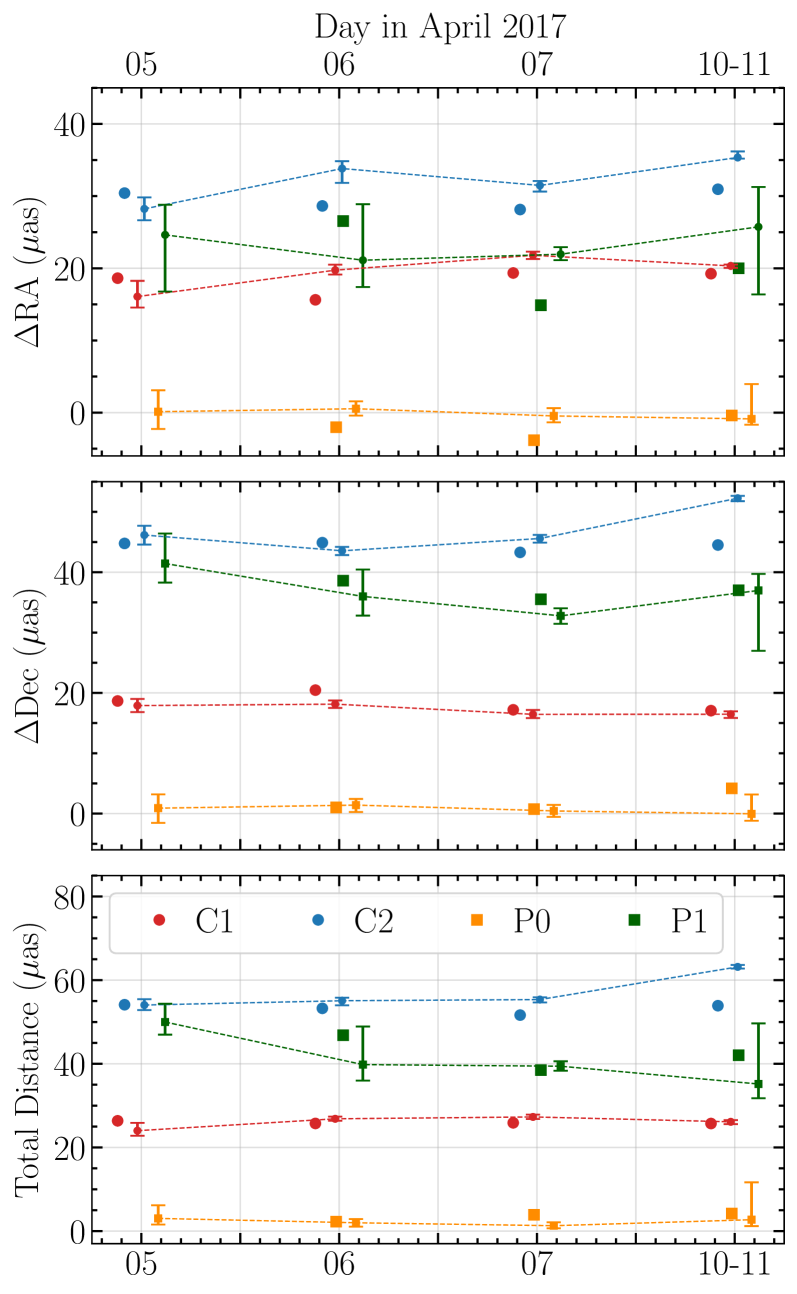
In Figure 12, we present the relative distance of the individual total intensity and polarization component centroids from the core across the EHT observing campaign. There is no systematic offset between centroids of and , indicating that most likely they correspond to the same physical core component. However, the peak brightness location of is shifted to the East with respect to the peak brightness of , see also the discussion in Section 4.3. We see no significant motion of the components between 2017 April 5 and 11, particularly is well constrained and on all days and for both pipelines its distance from the core remains consistent within 2 as. For J1924–2914, observed motion of 1 as/day corresponds to an apparent velocity of 8 , which translates to an upper limit on apparent velocity . Kinematic analysis at 15 GHz (Lister et al., 2019) resulted in apparent velocities of three features, yielding at a distance of 5 mas from the core, and two features on sub-mas scale, moving with and . While a direct comparison of the apparent velocities seen at 15 GHz and 230 GHz is difficult in view of the bent jet morphology and different regions being probed, let us engage in some plausible speculation about this. The wider range of apparent velocity estimated in the innermost region may suggest jet bending and a smaller jet inclination of the innermost region (bending away from the line of sight). In this regime, and thus small intrinsic variations of can result in relatively large variations of the apparent velocity. At present, the physical origin of the relative large variation of the component speeds along the jet is unclear. It could be due to component motion along spatially bent trajectories, but intrinsic jet acceleration combined with regions of slower velocity or even stationarity (shocks) also cannot be excluded. Future more detailed kinematic studies will be required to clarify this.
We also note a peculiarity seen in Figure 12, resulting mostly from the DMC analysis: there is marginal evidence that, while component separates from the core and moves downstream, the motion of the centroid goes in the opposite direction, approaching the VLBI core. Whether this is due to pattern motion or is a projection effect in a rotating jet remains at this time an open question. We can only place very loose upper limits on the apparent velocities with respect to , , with a hint of acceleration, which may be related to the transverse shock discussed in Section 4.4, rather than to the overall acceleration pattern expected in the inner part of the ejected jet.
4 Discussion
4.1 Multifrequency images of the bent jet
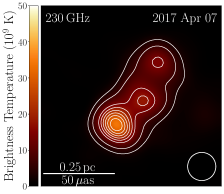
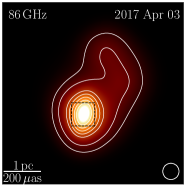
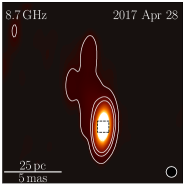
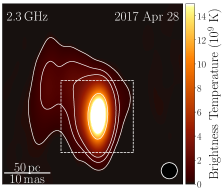
In Figure 13, we show multi-frequency images of J1924–2914 from close in time observations in April 2017 with the VLBA (2.3 and 8.7 GHz), the GMVA+ALMA (86 GHz), and the EHT (230 GHz). Ranging two orders of magnitude in frequency, these images show jet structure spanning from sub-parsec to 100 parsec scales. The EHT image of J1924–2914 provides an unprecedented view of the inner parsec of this blazar.
The projected position angle (PA) of the jet gradually rotates counter-clockwise with increasing distance from the jet base. In the 2.3 GHz VLBA image the PA is deg east of north at about 20 mas from the core and the jet bends toward the north-south direction closer to the core, consistently with the jet orientation in the non-simultaneous 1.6 GHz image at 5-10 mas from the core (Shen et al., 1999). At 8.7 GHz we find a PA of deg at about 5 mas from the core, consistent with the archival VLBA monitoring results at 15 GHz, showing a persistent jet orientation at a PA of about 30 deg in the epochs from 1995 to 2013 at angular scales mas (Kellermann et al., 1998; Pushkarev et al., 2017). The same MOJAVE observations hint at more variability of the jet PA on the smallest resolved scales mas. Observations by Shen et al. (2002) with the VLBA between 1994 and 2000 across four frequencies (5, 12, 15, and 43 GHz) showed a consistent PA orientation of 30 deg at 5 GHz with a clockwise shift of about 51-67 deg at 43 GHz. At 86 GHz a possible bent jet structure is seen, with the inner jet oriented with a PA of about deg less than mas from the core, and an apparent transition to a north-east direction further out. The deg PA with respect to the core is consistent with the PA of the single jet component located as from the core, imaged from 2018 April GMVA observations, see Figure 4 of Issaoun et al. (2021). 2018 images at 86 GHz do not indicate jet bending. At 230 GHz, the component is located at a PA of deg and at a PA of deg with respect to the core . This morphology can potentially be explained by a helical structure in the jet (Conway & Murphy, 1993; Steffen et al., 1995). Such a helical jet structure can be caused by an orbiting lower-mass secondary black hole around a stable primary central black hole, as also proposed for 4C 73.18 (Roos et al., 1993) and OJ 287 (e.g., Dey et al., 2021; Gómez et al., 2022), precession caused by a wobbling disk (Britzen et al., 2018), or a large-scale accretion flow that is tilted with respect to the black hole spin axis (e.g., as in M 81; Martí-Vidal et al., 2011).
Alternatively, the jet could be showing a sharp bend related to a collision between the jet and a dense cloud in the external medium (e.g., as in 3C 120; Gómez et al., 2000, 2001), although the lack of clear signatures of jet disruption render this interpretation less likely. Instabilities in a relativistic jet constitute another possible origin of the bent structure. There are two main types of instabilities that can be responsible for this bending: (1) the Kelvin-Helmholtz (KH) instability; and (2) the current-driven (CD) kink instability. KH instabilities develop through the shear between two different flow components, e.g., the fast jet spine and the slow jet sheath and/or the wind and external medium (Mizuno et al., 2007; Sironi et al., 2021). The non-axisymmetric helical mode can produce bent structures in relativistic jets (Hardee, 2000; Lobanov & Zensus, 2001). This instability grows in the kinetic energy dominated region; therefore the region far from the jet base is a preferred site. The CD kink instability was also shown to generate helically twisted jet structures (McKinney & Blandford, 2009; Mizuno et al., 2012; Davelaar et al., 2020). This instability is excited by the existence of a helical magnetic field, which is predicted by the jet formation theory and simulations (e.g., Pudritz et al., 2012), and is expected to grow in the magnetically dominated region near the jet base. The toroidal magnetic fields would create a twisted polarization pattern like the one we observe in the component at the VLBI core in Figure 8.
4.2 Brightness temperatures
We measure the observer frame brightness temperatures of the VLBI core by performing Gaussian model fitting in DIFMAP at each frequency, and estimating the core size and flux density. The results are presented in Table 3, with calculated as
| (4) |
where the units of , , and are as given in Table 3. Apart from that, non-simultaneous MOJAVE data at 15 GHz give a core brightness temperature K in 2012, and an apparent brightness temperature in excess of K was found at 1.6 GHz (Shen et al., 1999).
| (GHz) | 2.3 | 8.7 | 86.2 | 229.1 |
|---|---|---|---|---|
| (Jy) | 2.2 | 4.3 | 0.4 | 0.5 |
| (mas) | 0.82 | 0.56 | –a) | 0.01 |
| 7.6 | 7.8 | 2.8 | 1.2 |
a) a as resolution limit calculated using the residual map noise was used
The reported brightness temperatures are generally lower limits if the cores are not resolved. Nevertheless, the trend of brightness temperature decreasing with frequency seems robust, and consistent with signatures of an accelerating (sub-)pc scale jet (Lee et al., 2016). However, this interpretation is only straightforward if the change in inclination angle in the bent jet does not cause significant changes in the Doppler factor. The 230 GHz brightness temperature is consistent with the visibility-domain brightness temperature limit obtained from the flux density values observed on the longest baselines (Lobanov, 2015), which, in our case, reach about 8.5 G, as well as with the prior estimates by Lu et al. (2012). The observed value is related to the fluid frame brightness temperature via
| (5) |
with a Doppler factor and Lorentz factor
| (6) |
with velocity and viewing angle . While we do not have strong limits on the jet velocity and inclination (which also varies with the angular scale as the jet is bent), Paliya et al. (2017) suggests (), and it is enough that deg and in order to obtain . This implies that the intrinsic brightness temperature at 230 GHz is likely lower than the equipartition temperature , K, indicating a magnetically-dominated inner jet (Readhead, 1994), likely dominated by the helical magnetic field. The brightness temperature is also significantly lower than the inverse-Compton limit of K (Kellermann & Pauliny-Toth, 1969). These findings are comparable to the ones reported for 3C 279 by Kim et al. (2020) from observations in the same EHT run. Low brightness temperatures at 230 GHz were also reported for other EHT sources, Cen A (resolved at about 200 scale, Janssen et al., 2021) and M 87∗ (resolved at about 3.5 scale, EHTC et al., 2019a).
4.3 Superresolved millimeter core
With RML-based imaging methods we may expect to achieve superresolution in regularized fitted images (Honma et al., 2014). Indeed, with eht-imaging we consistently find the component as an elliptical feature of major and minor axes full widths at half maximum equal to 15 as and 10 as, respectively, and a major axis PA of about 45 deg, perpendicular to the position angle of , which we associate with the PA of the sub-pc scale jet. Superresolved images obtained with an RML-based reconstruction method, with no subsequent blurring, are shown in Appendix A. In all images in Figure 8, the polarized component appears to have a crescent-like shape around the core , with a large fractional polarization of about 15% and a depolarized intrusion on the west side of the core feature. Within the structure, the EVPA rotates by at least 90 deg around the core, consistently across days and methods, see Figure 8. We interpret this as a signature of the presence of toroidal magnetic fields in the core (Molina et al., 2014). The inner depolarization could be a resolution effect related to the size of the beam, averaging over the spatially varying EVPA within the VLBI core region, however the depolarization towards the west requires a different explanation. It is possible that the innermost jet is launched in the western direction, and hence because the material in the jet is partially obscuring the view onto the jet base, the Faraday depth is greater on the west side of the core, causing depolarization. The western orientation of the inner jet is consistent with the trend of the bend direction seen across all angular scales. An alternative explanation is a conical shock (Lind & Blandford, 1985), which can reproduce similar geometrical features in the EVPA orientation, particularly in the presence of a tangled magnetic field component (Cawthorne, 2006). In this interpretation the core in our images would need to be associated with the optically thin jet plasma.
Simultaneous interferometric-ALMA observations of J1924–2914 give spectral indices of at 93 GHz, and at 220 GHz (Goddi et al., 2021). These values suggest an optically thin source, and since the emission is dominated by the core component, this could imply an optically thin core, contrary to the standard model of a radio jet, in which the core emission corresponds to the photosphere of the optically thick region (Blandford & Königl, 1979). Such optically thin emission is expected if the source is observed at a frequency higher than the synchrotron self-absorption turnover. In this case the VLBI core would appear resolved, and the polarization substructure would become observable.
4.4 Jet features
The two total intensity jet features and appear at PAs of -47 deg and -36 deg respectively, with a change consistent with the direction of the jet bending. Additionally, we find a polarized component , located between and . The EVPA in the component is ordered and aligned in a pattern parallel to the jet. This is indicative of a transverse magnetic field component, implying a toroidal or helical magnetic field topology, and this provides a simple and natural explanation for the presence of the offset from and . It is possible that is a relativistic transverse shock in the jet, which enhances the magnetic field in the plane of compression, perpendicularly to the shock propagation direction (Hughes et al., 1985). In this case, some of the polarization associated with could be associated with this shock structure. The separation between the linearly polarized and total intensity features could be a consequence of the presence of sub-structure within the shock, e.g., a forward and reverse shock, one being more polarized than the other (Gómez et al., 1997; Laskar et al., 2019). There is some weak indication of and motion in opposite directions supporting this interpretation, see Figure 12. Linear polarization maps in 15 GHz with MOJAVE indicate that in the most upstream region the EVPA is aligned with the 230 GHz jet PA (Lister et al., 2018). This suggests a similar origin of the 15 GHz polarization features as transverse shock features in the upstream jet, unresolved at 15 GHz. Further away from the core, the 15 GHz maps show the EVPA aligning with the mas scale jet orientation, strengthening this interpretation.
5 Summary
In this paper, we presented the first 1.3 mm VLBI total-intensity and polarimetric images of the blazar J1924–2914 with the EHT. The EHT enabled the highest resolution polarimetric imaging of a quasar to date, corresponding to a linear resolution of 0.1 pc. These unprecedented images of the inner parsec of J1924–2914 reveal a compact total-intensity structure of three distinct components oriented in a north-west direction, with a fan-like EVPA pattern in the VLBI core (the southernmost component). We did not find significant motion of the component , closest to the core, with an upper limit of 2 on the apparent velocity. In the superresolved core region, we notice a rotation of the EVPA, suggestive of the presence of toroidal magnetic fields in the core region. We have shown that J1924–2914 is a bright and very compact source at mm wavelengths, displaying very little variability on a timescale of several days – these features render it possibly the best available EHT calibrator positioned close to Sgr A∗ on the sky.
We compared our EHT images with quasi-simultaneous images of J1924–2914 at longer wavelengths obtained with the GMVA and the VLBA. We observed a clockwise rotation of the jet direction in J1924–2914 as we go from long to short observing wavelengths, with an apparent bend of the jet in 3.5 mm. The rotation of the PA with the frequency could be indicative of a helical jet structure. Several scenarios have been proposed for helical jets in other sources, such as a putative supermassive black hole binary in the core, or a tilted large-scale accretion flow compared to the black hole spin axis, or shock regions as the jet interacts with the external medium. All these scenarios predict a time variability of the PA at individual frequencies, which we do not see in the 20 year timescale of the MOJAVE 15 GHz observations on angular scales of mas. Monitoring on longer timescales, particularly at higher frequencies, will be needed to further understand the helical structure.
The narrow fractional bandwidth of the EHT 2017 observations (), and a scale separation between observations by different arrays prevented us from studying the spatially resolved spectral index and rotation measure. EHT observations in 2018 and later provide a wider bandwidth (), alleviating this shortcoming (EHTC et al., 2019b). There are plans for expanding the EHT array and enabling 345 GHz observations (Doeleman et al., 2019), which should further improve both the resolution and the dynamic range of the J1924–2914 images.
Finally, J1924–2914 is a source of -ray radiation identified in the Fermi-LAT catalog (Abdollahi et al., 2020). Given that with the EHT at 1.3 mm we see detailed structure of the source total intensity and linear polarization on an extreme scale of pc, the source may be an excellent target to study the relation between high energy emission and jet morphology and kinematics at millimeter wavelengths. Interestingly, the most recent 230 GHz SMA monitoring data from the beginning of 2022 show a steep brightness rise to the largest values seen in a decade.
6 Acknowledgments
We thank the anonymous reviewer for their thoughtful and helpful comments. The Event Horizon Telescope Collaboration thanks the following organizations and programs: the Academy of Finland (projects 274477, 284495, 312496, 315721); the Agencia Nacional de Investigación y Desarrollo (ANID), Chile via NCN (TITANs) and Fondecyt 3190878, the Alexander von Humboldt Stiftung; an Alfred P. Sloan Research Fellowship; Allegro, the European ALMA Regional Centre node in the Netherlands, the NL astronomy research network NOVA and the astronomy institutes of the University of Amsterdam, Leiden University and Radboud University; the Black Hole Initiative at Harvard University, through a grant (60477) from the John Templeton Foundation; the China Scholarship Council; Consejo Nacional de Ciencia y Tecnología (CONACYT, Mexico, projects U0004-246083, U0004-259839, F0003-272050, M0037-279006, F0003-281692, 104497, 275201, 263356); the Delaney Family via the Delaney Family John A. Wheeler Chair at Perimeter Institute; Dirección General de Asuntos del Personal Académico-—Universidad Nacional Autónoma de México (DGAPA-—UNAM, projects IN112417 and IN112820); the European Research Council Synergy Grant ”BlackHoleCam: Imaging the Event Horizon of Black Holes” (grant 610058); the Generalitat Valenciana postdoctoral grant APOSTD/2018/177 and GenT Program (project CIDEGENT/2018/021); MICINN Research Project PID2019-108995GB-C22; the Gordon and Betty Moore Foundation (grant GBMF-3561); the Istituto Nazionale di Fisica Nucleare (INFN) sezione di Napoli, iniziative specifiche TEONGRAV; the International Max Planck Research School for Astronomy and Astrophysics at the Universities of Bonn and Cologne; Joint Princeton/Flatiron and Joint Columbia/Flatiron Postdoctoral Fellowships, research at the Flatiron Institute is supported by the Simons Foundation; the Japanese Government (Monbukagakusho: MEXT) Scholarship; the Japan Society for the Promotion of Science (JSPS) Grant-in-Aid for JSPS Research Fellowship (JP17J08829); the Key Research Program of Frontier Sciences, Chinese Academy of Sciences (CAS, grants QYZDJ-SSW-SLH057, QYZDJSSW- SYS008, ZDBS-LY-SLH011); the Leverhulme Trust Early Career Research Fellowship; the Max-Planck-Gesellschaft (MPG); the Max Planck Partner Group of the MPG and the CAS; the MEXT/JSPS KAKENHI (grants 18KK0090, JP18K13594, JP18K03656, JP18H03721, 18K03709, 18H01245, 25120007); the Malaysian Fundamental Research Grant Scheme (FRGS) FRGS/1/2019/STG02/UM/02/6; the MIT International Science and Technology Initiatives (MISTI) Funds; the Ministry of Science and Technology (MOST) of Taiwan (105- 2112-M-001-025-MY3, 106-2112-M-001-011, 106-2119- M-001-027, 107-2119-M-001-017, 107-2119-M-001-020, 107-2119-M-110-005, 108-2112-M-001-048, and 109-2124-M-001-005); the National Aeronautics and Space Administration (NASA, Fermi Guest Investigator grant 80NSSC20K1567, NASA Astrophysics Theory Program grant 80NSSC20K0527, NASA NuSTAR award 80NSSC20K0645); the National Institute of Natural Sciences (NINS) of Japan; the National Key Research and Development Program of China (grant 2016YFA0400704, 2016YFA0400702); the National Science Foundation (NSF, grants AST-0096454, AST-0352953, AST-0521233, AST-0705062, AST-0905844, AST-0922984, AST-1126433, AST-1140030, DGE-1144085, AST-1207704, AST-1207730, AST-1207752, MRI-1228509, OPP-1248097, AST-1310896, AST-1555365, AST-1615796, AST-1715061, AST-1716327, AST-1903847,AST-2034306); the Natural Science Foundation of China (grants 11573051, 11633006, 11650110427, 10625314, 11721303, 11725312, 11933007, 11991052, 11991053); a fellowship of China Postdoctoral Science Foundation (2020M671266); the Natural Sciences and Engineering Research Council of Canada (NSERC, including a Discovery Grant and the NSERC Alexander Graham Bell Canada Graduate Scholarships-Doctoral Program); the National Youth Thousand Talents Program of China; the National Research Foundation of Korea (the Global PhD Fellowship Grant: grants NRF-2015H1A2A1033752, 2015- R1D1A1A01056807, the Korea Research Fellowship Program: NRF-2015H1D3A1066561, Basic Research Support Grant 2019R1F1A1059721); the Netherlands Organization for Scientific Research (NWO) VICI award (grant 639.043.513) and Spinoza Prize SPI 78-409; the New Scientific Frontiers with Precision Radio Interferometry Fellowship awarded by the South African Radio Astronomy Observatory (SARAO), which is a facility of the National Research Foundation (NRF), an agency of the Department of Science and Technology (DST) of South Africa; the Onsala Space Observatory (OSO) national infrastructure, for the provisioning of its facilities/observational support (OSO receives funding through the Swedish Research Council under grant 2017-00648) the Perimeter Institute for Theoretical Physics (research at Perimeter Institute is supported by the Government of Canada through the Department of Innovation, Science and Economic Development and by the Province of Ontario through the Ministry of Research, Innovation and Science); the Spanish Ministerio de Economía y Competitividad (grants PGC2018-098915-B-C21, AYA2016-80889-P, PID2019-108995GB-C21); the State Agency for Research of the Spanish MCIU through the ”Center of Excellence Severo Ochoa” award for the Instituto de Astrofísica de Andalucía (SEV-2017- 0709); the Toray Science Foundation; the Consejería de Economía, Conocimiento, Empresas y Universidad of the Junta de Andalucía (grant P18-FR-1769), the Consejo Superior de Investigaciones Científicas (grant 2019AEP112); the US Department of Energy (USDOE) through the Los Alamos National Laboratory (operated by Triad National Security, LLC, for the National Nuclear Security Administration of the USDOE (Contract 89233218CNA000001); the European Union’s Horizon 2020 research and innovation programme under grant agreement No 730562 RadioNet; ALMA North America Development Fund; the Academia Sinica; Chandra DD7-18089X and TM6- 17006X; the GenT Program (Generalitat Valenciana) Project CIDEGENT/2018/021. This work used the Extreme Science and Engineering Discovery Environment (XSEDE), supported by NSF grant ACI-1548562, and CyVerse, supported by NSF grants DBI-0735191, DBI-1265383, and DBI-1743442. XSEDE Stampede2 resource at TACC was allocated through TG-AST170024 and TG-AST080026N. XSEDE JetStream resource at PTI and TACC was allocated through AST170028. The simulations were performed in part on the SuperMUC cluster at the LRZ in Garching, on the LOEWE cluster in CSC in Frankfurt, and on the HazelHen cluster at the HLRS in Stuttgart. This research was enabled in part by support provided by Compute Ontario (http://computeontario.ca), Calcul Quebec (http://www.calculquebec.ca) and Compute Canada (http://www.computecanada.ca). We thank the staff at the participating observatories, correlation centers, and institutions for their enthusiastic support. This paper makes use of the following ALMA data: ADS/JAO.ALMA#2016.1.01154.V and ADS/JAO.ALMA2016.1.00413.V. ALMA is a partnership of the European Southern Observatory (ESO; Europe, representing its member states), NSF, and National Institutes of Natural Sciences of Japan, together with National Research Council (Canada), Ministry of Science and Technology (MOST; Taiwan), Academia Sinica Institute of Astronomy and Astrophysics (ASIAA; Taiwan), and Korea Astronomy and Space Science Institute (KASI; Republic of Korea), in cooperation with the Republic of Chile. The Joint ALMA Observatory is operated by ESO, Associated Universities, Inc. (AUI)/NRAO, and the National Astronomical Observatory of Japan (NAOJ). The NRAO is a facility of the NSF operated under cooperative agreement by AUI. APEX is a collaboration between the Max-Planck-Institut für Radioastronomie (Germany), ESO, and the Onsala Space Observatory (Sweden). The SMA is a joint project between the SAO and ASIAA and is funded by the Smithsonian Institution and the Academia Sinica. The JCMT is operated by the East Asian Observatory on behalf of the NAOJ, ASIAA, and KASI, as well as the Ministry of Finance of China, Chinese Academy of Sciences, and the National Key R&D Program (No. 2017YFA0402700) of China. Additional funding support for the JCMT is provided by the Science and Technologies Facility Council (UK) and participating universities in the UK and Canada. The LMT is a project operated by the Instituto Nacional de Astrófisica, Óptica, y Electrónica (Mexico) and the University of Massachusetts at Amherst (USA). The IRAM 30-m telescope on Pico Veleta, Spain is operated by IRAM and supported by CNRS (Centre National de la Recherche Scientifique, France), MPG (Max-Planck- Gesellschaft, Germany) and IGN (Instituto Geográfico Nacional, Spain). The SMT is operated by the Arizona Radio Observatory, a part of the Steward Observatory of the University of Arizona, with financial support of operations from the State of Arizona and financial support for instrumentation development from the NSF. Support for SPT participation in the EHT is provided by the National Science Foundation through award OPP-1852617 to the University of Chicago. Partial support is also provided by the Kavli Institute of Cosmological Physics at the University of Chicago. The SPT hydrogen maser was provided on loan from the GLT, courtesy of ASIAA. The EHTC has received generous donations of FPGA chips from Xilinx Inc., under the Xilinx University Program. The EHTC has benefited from technology shared under open-source license by the Collaboration for Astronomy Signal Processing and Electronics Research (CASPER). The EHT project is grateful to T4Science and Microsemi for their assistance with Hydrogen Masers. This research has made use of NASA’s Astrophysics Data System. We gratefully acknowledge the support provided by the extended staff of the ALMA, both from the inception of the ALMA Phasing Project through the observational campaigns of 2017 and 2018. We would like to thank A. Deller and W. Brisken for EHT-specific support with the use of DiFX. We acknowledge the significance that Mauna Kea, where the SMA and JCMT EHT stations are located, has for the indigenous Hawaiian people.
We also thank Alexandra Elbakyan for her contributions to the open science initiative. This research has made use of data obtained with the Global Millimeter VLBI Array (GMVA), coordinated by the VLBI group at the Max-Planck-Institut für Radioastronomie (MPIfR). The GMVA consists of telescopes operated by MPIfR, IRAM, Onsala, Metsahovi, Yebes, the Korean VLBI Network, the Green Bank Observatory and the Very Long Baseline Array (VLBA). The VLBA and the GBT are facilities of the National Science Foundation under cooperative agreement by Associated Universities, Inc. The data were correlated at the DiFX correlator of the MPIfR in Bonn, Germany. We thank the National Science Foundation (awards OISE-1743747, AST-1816420, AST-1716536, AST-1440254, AST-1935980) and the Gordon and Betty Moore Foundation (GBMF-5278) for financial support of this work. Support for this work was also provided by the NASA Hubble Fellowship grant HST-HF2-51431.001-A awarded by the Space Telescope Science Institute, which is operated by the Association of Universities for Research in Astronomy, Inc., for NASA, under contract NAS5-26555.
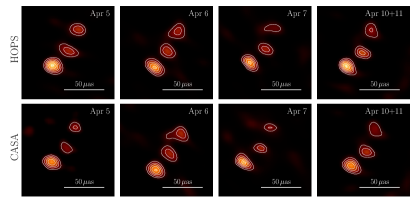
Appendix A Data reduction pipelines comparison
In Figure 14 we compare the Stokes (total intensity) 230 GHz images obtained from the two data reduction pipelines: EHT-HOPS (Blackburn et al., 2019), and CASA-based rPICARD (Janssen et al., 2019). All images presented in Figure 14 were obtained using an identical eht-imaging script (Chael et al., 2016). The images correspond to a direct fit to the observations, with no blurring or restoring beam applied.
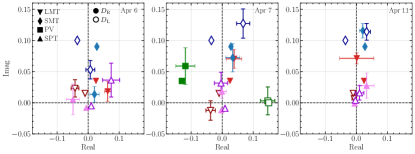
Appendix B Leakage terms consistency
Leakage coefficients can be estimated robustly for the telescopes with an intra-site station (ALMA, APEX, SMA, JCMT), where a point source model can be employed for a multi-source fit (Martí-Vidal et al., 2021; EHTC et al., 2021a). For the remaining sites the leakage terms need to be modeled simultaneously with the source structure and the problem becomes degenerate. The values presented in Table 1 are representative values based on the analysis spanning multiple epochs and different image reconstruction algorithms (EHTC et al., 2021a). These values were used for the linear polarization imaging with eht-imaging, and only SPT D-terms were solved for in this framework. For imaging with DMC, leakage terms were fitted within the software, providing a consistency test with the assumed values, see Figure 15. Systematic differences between days are seen for the DMC fits. Since D-terms are unlikely to significantly vary in time for stations other than ALMA (Goddi et al., 2019), this highlights the importance of using multi-epoch fits to constrain the leakage coefficients. SPT leakage calibration is particularly challenging given the limited parallactic coverage and the relevant D-terms have not been estimated in EHTC et al. (2021a) because M 87∗ is not observable from the south pole. Our fits to J1924–2914 data indicate that the magnitude of the SPT D-terms does not exceed 5%. Overall the D-terms have an acceptable degree of consistency and the residual uncertainties related to imperfect leakage calibration do not influence the overall morphology of the linear polarization images, see Section 3.2.
References
- Abdollahi et al. (2020) Abdollahi, S., Acero, F., Ackermann, M., et al. 2020, ApJS, 247, 33
- Akiyama et al. (2017a) Akiyama, K., Ikeda, S., Pleau, M., et al. 2017a, AJ, 153, 159
- Akiyama et al. (2017b) Akiyama, K., Kuramochi, K., Ikeda, S., et al. 2017b, ApJ, 838, 1
- Blackburn et al. (2019) Blackburn, L., Chan, C.-k., Crew, G. B., et al. 2019, ApJ, 882, 23
- Blackburn et al. (2020) Blackburn, L., Pesce, D. W., Johnson, M. D., et al. 2020, ApJ, 894, 31
- Blandford & Königl (1979) Blandford, R. D. & Königl, A. 1979, ApJ, 232, 34
- Britzen et al. (2018) Britzen, S., Fendt, C., Witzel, G., et al. 2018, MNRAS, 478, 3199
- Broderick et al. (2020a) Broderick, A. E., Gold, R., Karami, M., et al. 2020a, ApJ, 897, 139
- Broderick et al. (2020b) Broderick, A. E., Pesce, D. W., Tiede, P., Pu, H.-Y., & Gold, R. 2020b, ApJ, 898, 9
- Cawthorne (2006) Cawthorne, T. V. 2006, MNRAS, 367, 851
- Chael et al. (2018) Chael, A. A., Johnson, M. D., Bouman, K. L., et al. 2018, ApJ, 857, 23
- Chael et al. (2016) Chael, A. A., Johnson, M. D., Narayan, R., et al. 2016, ApJ, 829, 11
- Conway & Murphy (1993) Conway, J. E. & Murphy, D. W. 1993, ApJ, 411, 89
- Davelaar et al. (2020) Davelaar, J., Philippov, A. A., Bromberg, O., & Singh, C. B. 2020, ApJL, 896, L31
- Dey et al. (2021) Dey, L., Valtonen, M. J., Gopakumar, A., et al. 2021, MNRAS, 503, 4400
- Doeleman et al. (2019) Doeleman, S., Blackburn, L., Dexter, J., et al. 2019, in Bulletin of the American Astronomical Society, Vol. 51, 256
- EHTC et al. (2019a) EHTC, Akiyama, K., Alberdi, A., et al. 2019a, ApJL, 875, L1
- EHTC et al. (2019b) EHTC, Akiyama, K., Alberdi, A., et al. 2019b, ApJL, 875, L2
- EHTC et al. (2019c) EHTC, Akiyama, K., Alberdi, A., et al. 2019c, ApJL, 875, L3
- EHTC et al. (2019d) EHTC, Akiyama, K., Alberdi, A., et al. 2019d, ApJL, 875, L4
- EHTC et al. (2019e) EHTC, Akiyama, K., Alberdi, A., et al. 2019e, ApJL, 875, L5
- EHTC et al. (2019f) EHTC, Akiyama, K., Alberdi, A., et al. 2019f, ApJL, 875, L6
- EHTC et al. (2021a) EHTC, Akiyama, K., Algaba, J. C., et al. 2021a, ApJL, 910, L12
- EHTC et al. (2021b) EHTC, Akiyama, K., Algaba, J. C., et al. 2021b, ApJL, 910, L13
- EHTC et al. (2022a) EHTC, Akiyama, K., Alberdi, A., Alef, W., et al. 2022a, ApJL, 930, L12
- EHTC et al. (2022b) EHTC, Akiyama, K., Alberdi, A., Alef, W., et al. 2022b, ApJL, 930, L13
- EHTC et al. (2022c) EHTC, Akiyama, K., Alberdi, A., Alef, W., et al. 2022c, ApJL, 930, L14
- Goddi et al. (2021) Goddi, C., Martí-Vidal, I., Messias, H., et al. 2021, ApJL, 910, L14
- Goddi et al. (2019) Goddi, C., Martí-Vidal, I., Messias, H., et al. 2019, PASP, 131, 075003
- Gómez et al. (2001) Gómez, J.-L., Marscher, A. P., Alberdi, A., Jorstad, S. G., & Agudo, I. 2001, ApJL, 561, L161
- Gómez et al. (2000) Gómez, J.-L., Marscher, A. P., Alberdi, A., Jorstad, S. G., & García-Miró, C. 2000, Science, 289, 2317
- Gómez et al. (1997) Gómez, J. L., Martí, J. M., Marscher, A. P., Ibáñez, J. M., & Alberdi, A. 1997, ApJL, 482, L33
- Gómez et al. (2022) Gómez, J. L., Traianou, E., Krichbaum, T. P., et al. 2022, ApJ, 924, 122
- Hardee (2000) Hardee, P. E. 2000, ApJ, 533, 176
- Honma et al. (2014) Honma, M., Akiyama, K., Uemura, M., & Ikeda, S. 2014, PASJ, 66, 95
- Hughes et al. (1985) Hughes, P. A., Aller, H. D., & Aller, M. F. 1985, ApJ, 298, 301
- Hunt et al. (2021) Hunt, L. R., Johnson, M. C., Cigan, P. J., Gordon, D., & Spitzak, J. 2021, AJ, 162, 121
- Issaoun et al. (2019) Issaoun, S., Johnson, M. D., Blackburn, L., et al. 2019, ApJ, 871, 30
- Issaoun et al. (2021) Issaoun, S., Johnson, M. D., Blackburn, L., et al. 2021, ApJ, 915, 99
- Janssen et al. (2021) Janssen, M., Falcke, H., Kadler, M., et al. 2021, Nature Astronomy, 5, 1017
- Janssen et al. (2019) Janssen, M., Goddi, C., van Bemmel, I. M., et al. 2019, A&A, 626, A75
- Johnson et al. (2015) Johnson, M. D., Fish, V. L., Doeleman, S. S., et al. 2015, Science, 350, 1242
- Jones et al. (2009) Jones, D. H., Read, M. A., Saunders, W., et al. 2009, MNRAS, 399, 683
- Kellermann & Pauliny-Toth (1969) Kellermann, K. I. & Pauliny-Toth, I. I. K. 1969, ApJL, 155, L71
- Kellermann et al. (1998) Kellermann, K. I., Vermeulen, R. C., Zensus, J. A., & Cohen, M. H. 1998, AJ, 115, 1295
- Kim et al. (2020) Kim, J.-Y., Krichbaum, T. P., Broderick, A. E., et al. 2020, A&A, 640, A69
- Kormendy & Ho (2013) Kormendy, J. & Ho, L. C. 2013, ARA&A, 51, 511
- Laskar et al. (2019) Laskar, T., Alexander, K. D., Gill, R., et al. 2019, ApJL, 878, L26
- Lee et al. (2016) Lee, S.-S., Lobanov, A. P., Krichbaum, T. P., & Zensus, J. A. 2016, ApJ, 826, 135
- Lind & Blandford (1985) Lind, K. R. & Blandford, R. D. 1985, ApJ, 295, 358
- Lister et al. (2018) Lister, M. L., Aller, M. F., Aller, H. D., et al. 2018, ApJS, 234, 12
- Lister et al. (2019) Lister, M. L., Homan, D. C., Hovatta, T., et al. 2019, ApJ, 874, 43
- Lobanov (2015) Lobanov, A. 2015, A&A, 574, A84
- Lobanov & Zensus (2001) Lobanov, A. P. & Zensus, J. A. 2001, Science, 294, 128
- Lu et al. (2012) Lu, R.-S., Fish, V. L., Weintroub, J., et al. 2012, ApJL, 757, L14
- Martí-Vidal et al. (2011) Martí-Vidal, I., Marcaide, J. M., Alberdi, A., et al. 2011, A&A, 533, A111
- Martí-Vidal et al. (2021) Martí-Vidal, I., Mus, A., Janssen, M., de Vicente, P., & González, J. 2021, A&A, 646, A52
- Martí-Vidal et al. (2016) Martí-Vidal, I., Vlemmings, W. H. T., & Muller, S. 2016, A&A, 593, A61
- Matthews et al. (2018) Matthews, L. D., Crew, G. B., Doeleman, S. S., et al. 2018, PASP, 130, 015002
- McKinney & Blandford (2009) McKinney, J. C. & Blandford, R. D. 2009, MNRAS, 394, L126
- Mizuno et al. (2007) Mizuno, Y., Hardee, P., & Nishikawa, K.-I. 2007, ApJ, 662, 835
- Mizuno et al. (2012) Mizuno, Y., Lyubarsky, Y., Nishikawa, K.-I., & Hardee, P. E. 2012, ApJ, 757, 16
- Molina et al. (2014) Molina, S. N., Agudo, I., Gómez, J. L., et al. 2014, A&A, 566, A26
- Paliya et al. (2017) Paliya, V. S., Marcotulli, L., Ajello, M., et al. 2017, ApJ, 851, 33
- Pesce (2021) Pesce, D. W. 2021, AJ, 161, 178
- Pica et al. (1988) Pica, A. J., Smith, A. G., Webb, J. R., et al. 1988, AJ, 96, 1215
- Planck Collaboration et al. (2016) Planck Collaboration, Ade, P. A. R., Aghanim, N., et al. 2016, A&A, 594, A13
- Preston et al. (1989) Preston, R. A., Jauncey, D. L., Meier, D. L., et al. 1989, AJ, 98, 1
- Pudritz et al. (2012) Pudritz, R. E., Hardcastle, M. J., & Gabuzda, D. C. 2012, Space Sci. Rev., 169, 27
- Pushkarev et al. (2017) Pushkarev, A. B., Kovalev, Y. Y., Lister, M. L., & Savolainen, T. 2017, MNRAS, 468, 4992
- Readhead (1994) Readhead, A. C. S. 1994, ApJ, 426, 51
- Roos et al. (1993) Roos, N., Kaastra, J. S., & Hummel, C. A. 1993, ApJ, 409, 130
- Shen et al. (1999) Shen, Z.-Q., Edwards, P. G., Lovell, J. E. J., et al. 1999, PASJ, 51, 513
- Shen et al. (2002) Shen, Z.-Q., Moran, J. M., & Kellermann, K. I. 2002, in 8th Asian-Pacific Regional Meeting, Volume II, ed. S. Ikeuchi, J. Hearnshaw, & T. Hanawa (Hitotsubashi Memorial Hall, Tokyo, Japan: The Astronomical Society of Japan), 401–402
- Shen et al. (1997) Shen, Z. Q., Wan, T. S., Moran, J. M., et al. 1997, AJ, 114, 1999
- Shepherd (2011) Shepherd, M. 2011, Difmap: Synthesis Imaging of Visibility Data, Astrophysics Source Code Library
- Shepherd (1997) Shepherd, M. C. 1997, in Astronomical Society of the Pacific Conference Series, Vol. 125, Astronomical Data Analysis Software and Systems VI, ed. G. Hunt & H. Payne, 77
- Sironi et al. (2021) Sironi, L., Rowan, M. E., & Narayan, R. 2021, ApJL, 907, L44
- Steffen et al. (1995) Steffen, W., Zensus, J. A., Krichbaum, T. P., Witzel, A., & Qian, S. J. 1995, A&A, 302, 335
- Thompson et al. (2017) Thompson, A. R., Moran, J. M., & Swenson, Jr., G. W. 2017, Interferometry and Synthesis in Radio Astronomy, 3rd Edition (Springer International Publishing)
- Tingay et al. (1998) Tingay, S. J., Murphy, D. W., Lovell, J. E. J., et al. 1998, ApJ, 497, 594
- Wills & Wills (1981) Wills, D. & Wills, B. J. 1981, Nature, 289, 384
- Worrall & Wilkes (1990) Worrall, D. M. & Wilkes, B. J. 1990, ApJ, 360, 396
- Wright (2006) Wright, E. L. 2006, PASP, 118, 1711