Dependence of the Radio Emission on the Eddington Ratio of Radio-Quiet Quasars
Abstract
Roughly of quasars are “radio-loud”, producing copious radio emission in large jets. The origin of the low-level radio emission seen from the remaining of quasars is unclear. Observing a sample of eight radio-quiet quasars with the Very Long Baseline Array, we discovered that their radio properties depend strongly on their Eddington ratio . At lower Eddington ratios , the total radio emission of the AGN predominately originates from an extremely compact region, possibly as small as the accretion disk. At higher Eddington ratios (), the relative contribution of this compact region decreases significantly, and though the total radio power remains about the same, the emission now originates from regions large. The change in the physical origin of the radio-emitting plasma region with is unexpected, as the properties of radio-loud quasars show no dependence with Eddington ratio. Our results suggest that at lower Eddington ratios the magnetised plasma is likely confined by the accretion disk corona, and only at higher Eddington ratios escapes to larger scales. Stellar-mass black holes show a similar dependence of their radio properties on the accretion rate, supporting the paradigm which unifies the accretion onto black holes across the mass range.
1 Introduction
Quasars are the most persistent luminous sources in the Universe. Powered by material accreting onto the super-massive black hole (SMBH) residing at the center of a galaxy (e.g., Salpeter 1964; Lynden-Bell 1969), the observed manifestations of these active galactic nuclei (AGN) vary significantly across the electromagnetic spectrum. At radio wavelengths, there is a well established dichotomy in the observed properties of quasars, with being “radio-loud”, whose ratio of 6 cm (4.8 GHz) to 4400Å flux density 10 (Kellermann et al., 1989), with the remaining being “radio-quiet” (e.g., Sandage 1965 and references therein). For radio-loud AGN, the radio emission is generated by a relativistic jet that originates close to the event horizon of the black hole (see Blandford et al. 2019 for a recent review), regardless of its appearance in other wavebands (e.g. Urry & Padovani 1995 for references thereafter). However, the situation is very different for radio-quiet AGN where, not only is there a multitude of possible sources for their radio emission (see Panessa et al. 2019 for a recent review), the dominant mechanism can, and almost certainly does, vary between different radio-quiet quasars (RQQs). Understanding how of accreting SMBHs produce their radio emission is important for understanding the physics of accretion onto black holes.
Recent work suggests that the radio spectrum of RQQs depends on the AGN’s Eddington ratio , where is its bolometric luminosity and is the “maximum” (Eddington) luminosity of material accreting onto a SMBH with its particular mass. A Very Large Array (VLA) study of the 4.8 and 8.5 GHz emission from 25 radio-quiet Palomar-Green (PG) quasars found that RQQs with low Eddington ratios () had flat radio spectra (spectral index ; flux density ), while RQQs with higher Eddington ratios () had steep () radio spectra (Laor et al., 2019). Understanding the physical implications of this correlation requires determining the origin of the radio emission in these galaxies.
In general, the radio emission from an AGN is primarily produced by the accretion disk itself or an accretion-powered outflow (e.g. wind or weak jet). Radio emission from optically thick plasma – possibly the disk corona and/or base of a jet located very close (less than a few parsecs) to the SMBH – will result in a compact, flat spectrum () radio source. Conversely, outflows are observed to produce steep spectrum () radio emission on scales ranging from parsecs (pc) to kilo-parsecs (kpc) in size. Disentangling the emission from these two components requires measuring the radio spectrum and morphology of an AGN on physical scales far smaller than the spatial resolution of the VLA radio data used by Laor et al. 2019.
To rectify this situation, we studied the pc-scale emission of the PG RQQs studied by Laor et al. 2019 with the four highest radio spectral indices and the four lowest radio spectral indices, listed in Table 1. In Section 2 we describe our reduction and analysis of 1.4 GHz and 4.8 GHz Very Long Baseline Array (VLBA) observations of these PG RQQs, while in Section 3 we present the properties of the nuclear radio emission derived from these observations. In Section 4, we describe the dependence of their observed radio properties with the Eddington ratio, while in Section 5 we discuss the implications of these results.
| Name | z | [mJy] | Ref. | ||||
|---|---|---|---|---|---|---|---|
| (1) | (2) | (3) | (4) | (5) | (6) | (7) | (8) |
| PG 0050+124 | 00:53:34.940 | +12:41:36.20 | 0.060 | 1.07 | 1.45 | aaKellermann et al. (1989),bbBarvainis et al. (1996),ccKukula et al. (1998) | |
| PG 0052+251 | 00:54:52.120 | +25:25:39.00 | 0.155 | +0.93 | +0.21 | aaKellermann et al. (1989),ddLeipski et al. (2006) | |
| PG 1149-110 | 11:52:03.540 | -11:22:24.30 | 0.050 | 0.20 | +0.48 | aaKellermann et al. (1989),ddLeipski et al. (2006) | |
| PG 1440+356 | 14:42:07.463 | +35:26:22.92 | 0.077 | 2.70 | 1.88 | aaKellermann et al. (1989),bbBarvainis et al. (1996) | |
| PG 1612+261 | 16:14:13.203 | +26:04:16.20 | 0.131 | 0.39 | 1.57 | aaKellermann et al. (1989),bbBarvainis et al. (1996),ddLeipski et al. (2006) | |
| PG 1613+658 | 16:13:57.179 | +65:43:09.58 | 0.139 | 0.08 | 1.06 | aaKellermann et al. (1989) | |
| PG 2130+099 | 21:32:27.813 | +10:08:19.46 | 0.062 | 0.85 | 1.40 | aaKellermann et al. (1989),bbBarvainis et al. (1996),ddLeipski et al. (2006) | |
| PG 2304+042 | 23:07:02.912 | +04:35:57.22 | 0.042 | 0.03 | 0.67 | aaKellermann et al. (1989) |
2 VLBA Data Reduction
In this section, we describe the reduction of the 1.4 and 4.8 GHz Very Long Baseline Array (VLBA) observations of the eight Palomar-Green Radio-Quiet Quasars (PG RQQs) listed in Table 1. The properties of these VLBA observations are provided in Table 2, which used all ten main VLBA stations, recording the data from each using the Mark6 VLBI system (Whitney et al., 2013) with 2-bit sampling at a rate of 4 Gbps, and then correlated at the remote Array Operation Center. At both 1.4 and 4.8 GHz, we used four 128 MHz, dual polarization, intermediate frequency (IF) bands. For the 1.4 GHz datasets, these IFs were centered at 1376, 1504, 1632, and 1760 MHz. For 4.8 GHz datasets, the IFs were centered at 4612, 4740, 4868, and 4996 MHz. Each observation was 3 hours long, and all began and ended with two-minute scans of a strong calibrator source (“Fringe Finder”; Table 2) at each observing frequency. Between the Fringe Finder scans, we alternated between 30 second scans of the phase calibrator and two-minute scans of the RQQ target at 1.4 GHz, and switched to 4.8 GHz halfway through the observation time. As shown in Table 2, for each target the phase calibrator was located away, less than the away as required for phase-referencing to work. This observing strategy yielded hour of total integration time on the target at each frequency.
| \topruleName | Observation | Fringe | Phase | Angular | Integration |
|---|---|---|---|---|---|
| Date | Finder | Calibrator | Separation | Time [mins] | |
| (1) | (2) | (3) | (4) | (5) | (6) |
| PG 0050+124 | 2020 May 05 | 3C454.3 | J0055+1408 | 58.7 , 58.7 | |
| PG 0052+251 | 2020 May 16 | 3C454.3 | J0054+2550 | 58.8 , 58.6 | |
| PG 1149-110 | 2020 May 31 | 4C39.25 | J1153-1105 | 58.6 , 58.6 | |
| PG 1440+356 | 2020 Jun. 12 | 3C345 | J1438+3710 | 58.6 , 58.6 | |
| PG 1612+261 | 2020 May 12 | 3C345 | J1610+2414 | 58.8 , 58.7 | |
| PG 1613+658 | 2020 May 11 | J1642+3948 | J1623+6624 | 58.7 , 58.7 | |
| PG 2130+099 | 2020 May 05 | J2005+7752 | J2130+0843 | 58.6 , 58.7 | |
| PG 2304+042 | 2020 May 07 | 3C454.3 | J2300+0337 | 58.9 , 58.7 | |
| \botrule |
The data was edited and calibrated using the Astronomical Image Processing System (AIPS; Wells 1985; Greisen 1990). We first corrected the recorded visibilities for ionospheric delays (VLBATECR) and errors in the Earth Orientation Parameters (VLBAEOPS), and then corrected for amplitude errors resulting from digital sampling (VLBACCOR). We then used observations of the fringe finder to solve for the antenna phase delays (VLBAMPCL) and calculate the bandpass of each antenna (VLBABPSS). Furthermore, we inspected the data on all baselines (pairs of antennae), IF, and sources for abnormalities which, once identified were removed. At 1.4 GHz, this necessitated a careful inspection of the visibilities for radio frequency interference (RFI), which were removed from the data using the AIPS task (SPFLG). The FRING task was then used to find the group delay and phase rate which maximized the fringes observed from first, the fringe finder, and then both the fringe finder and phase calibrator. At 4.8 GHz, these initial solutions were improved by upon by “self-calibrating” data obtained on the phase calibrator. At 1.4 GHz, self calibration did not lead to a significant improvement in image quality, due to the increased atmospheric coherence timescale at this longer frequency, and therefore was not performed. Upon completion of the various calibration steps mentioned above, we used the AIPS task CLCAL to calculate the final calibration table for the target, which were then applied to the data using the AIPS task SPLIT.
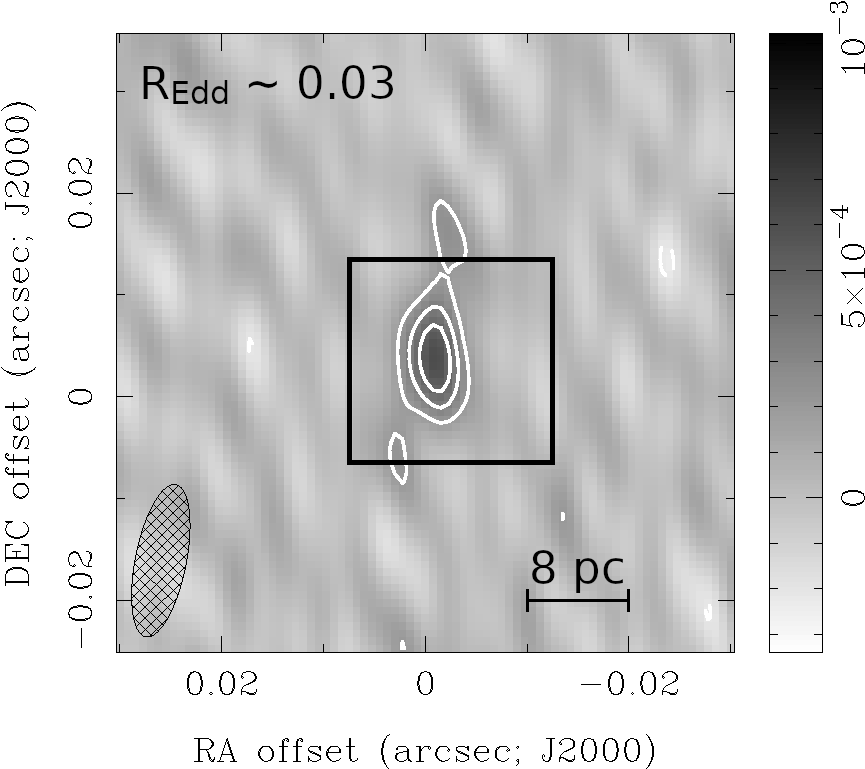
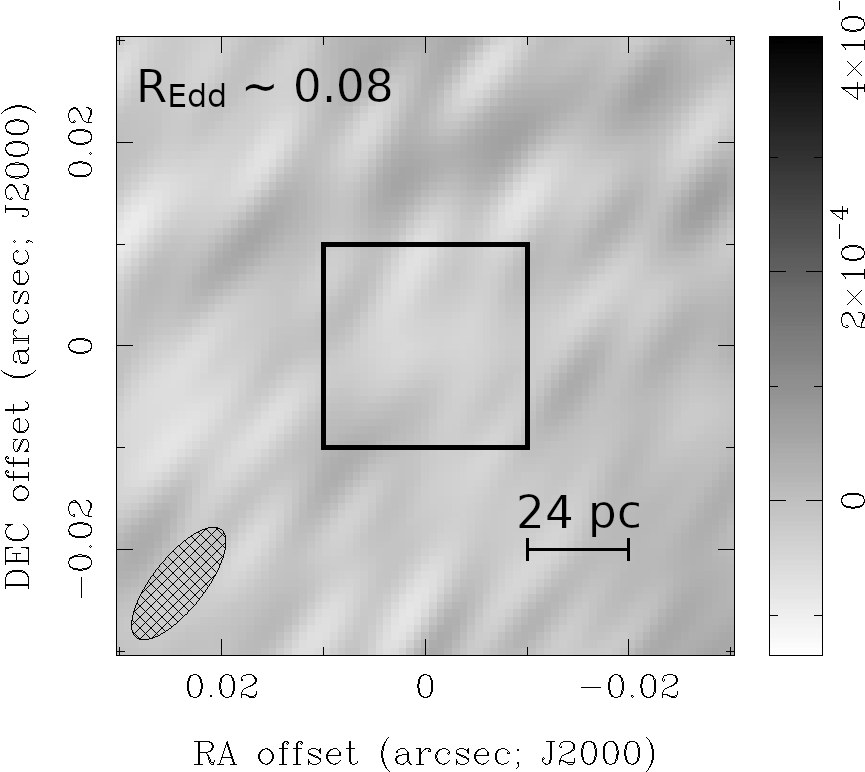
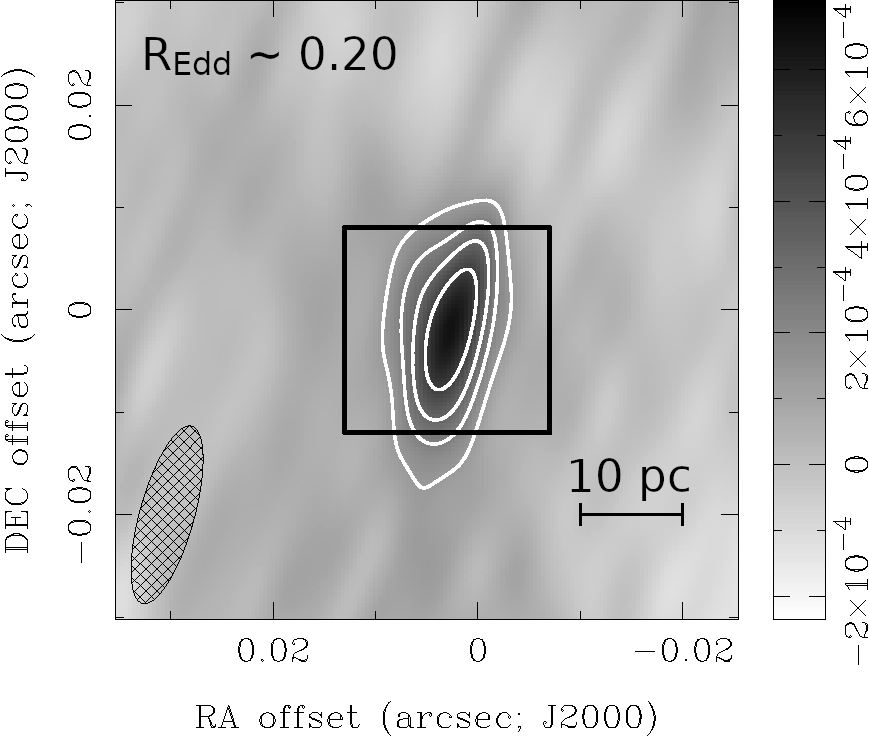
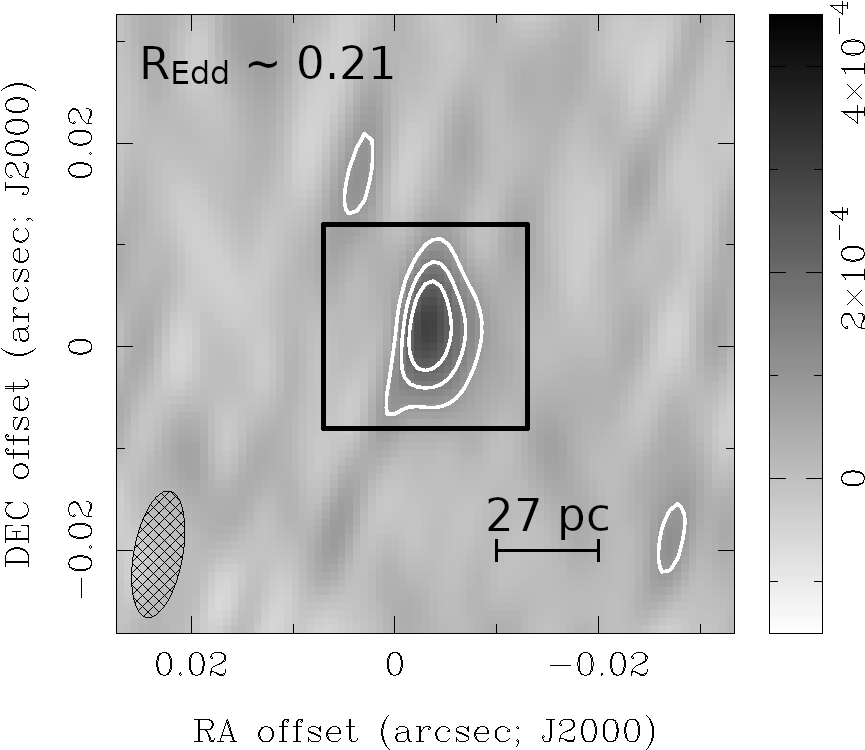
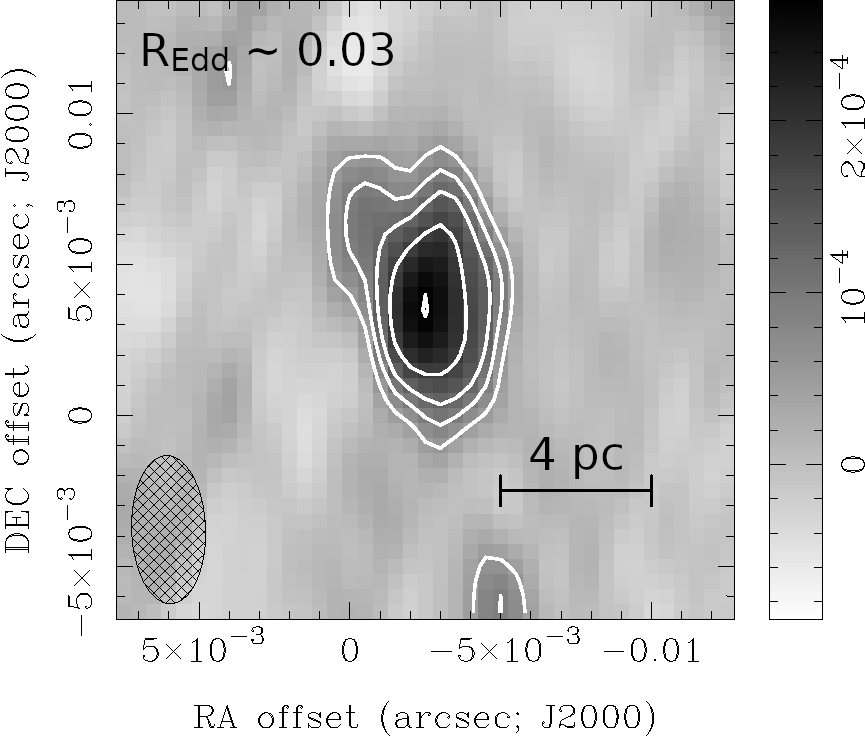
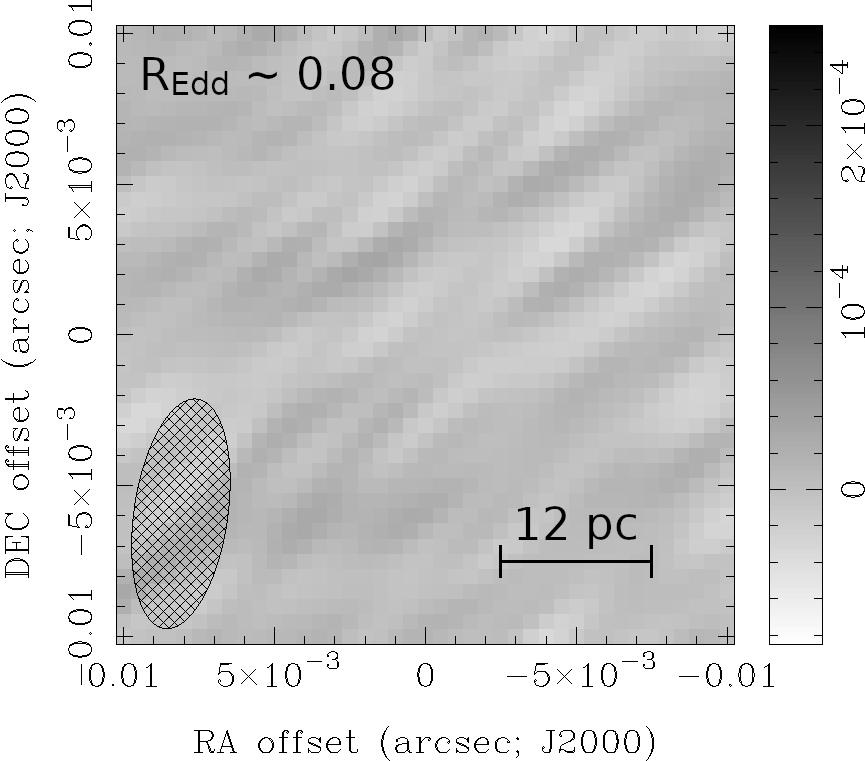
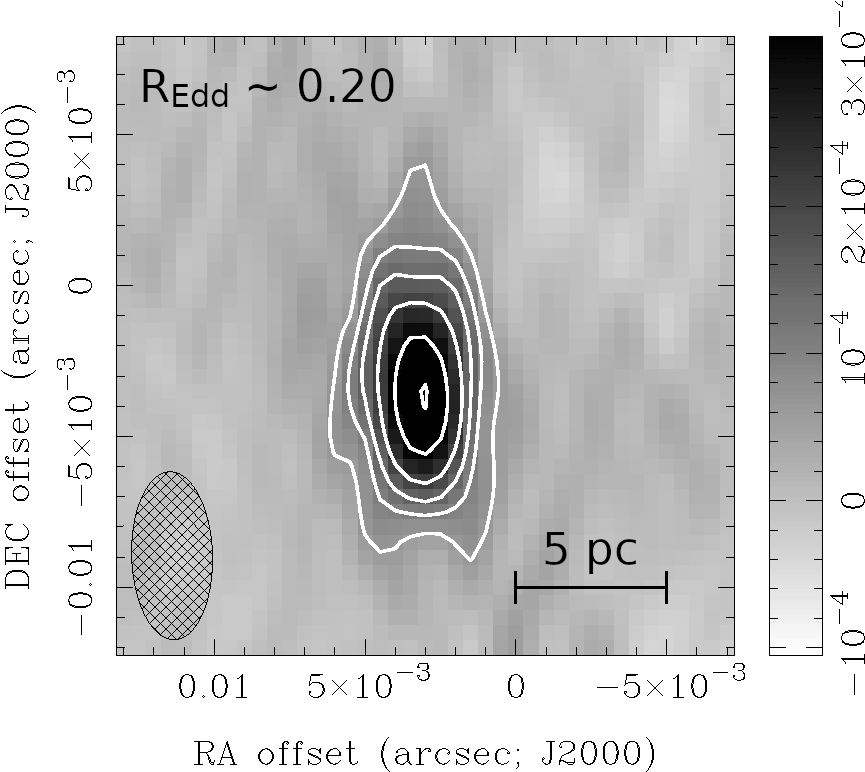
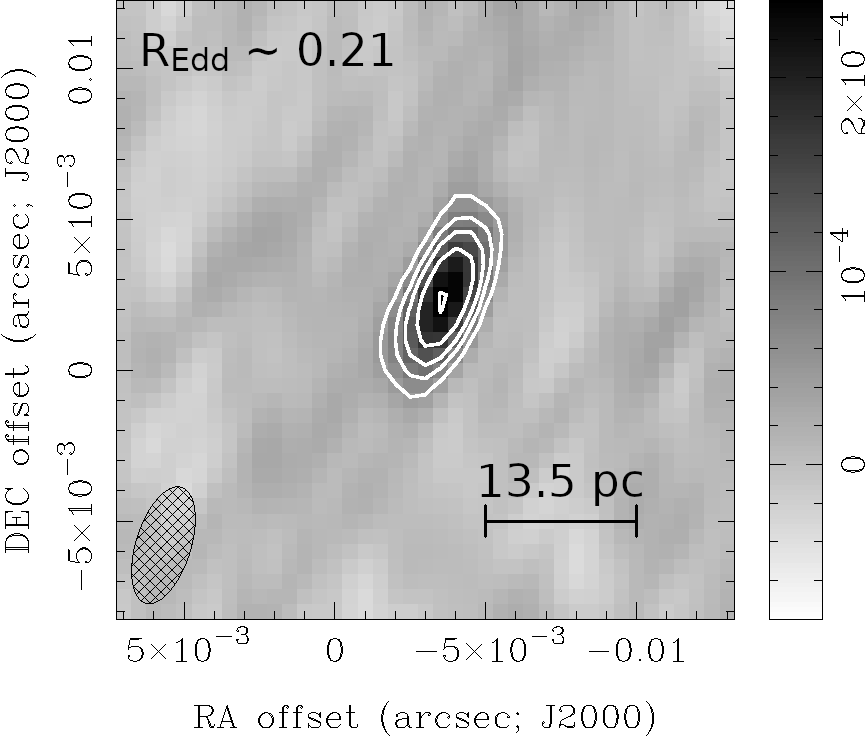
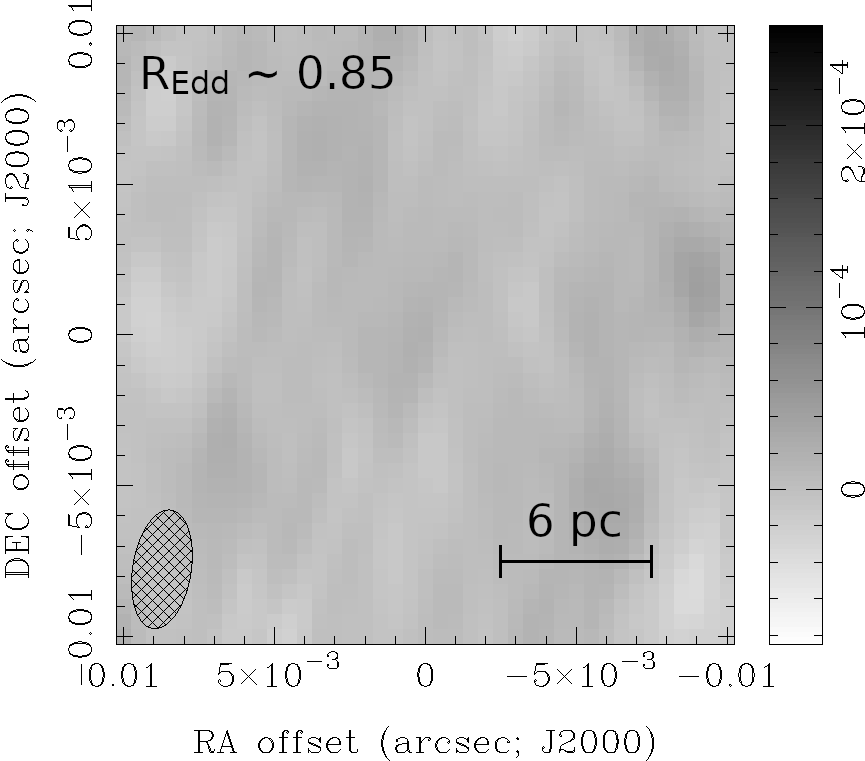
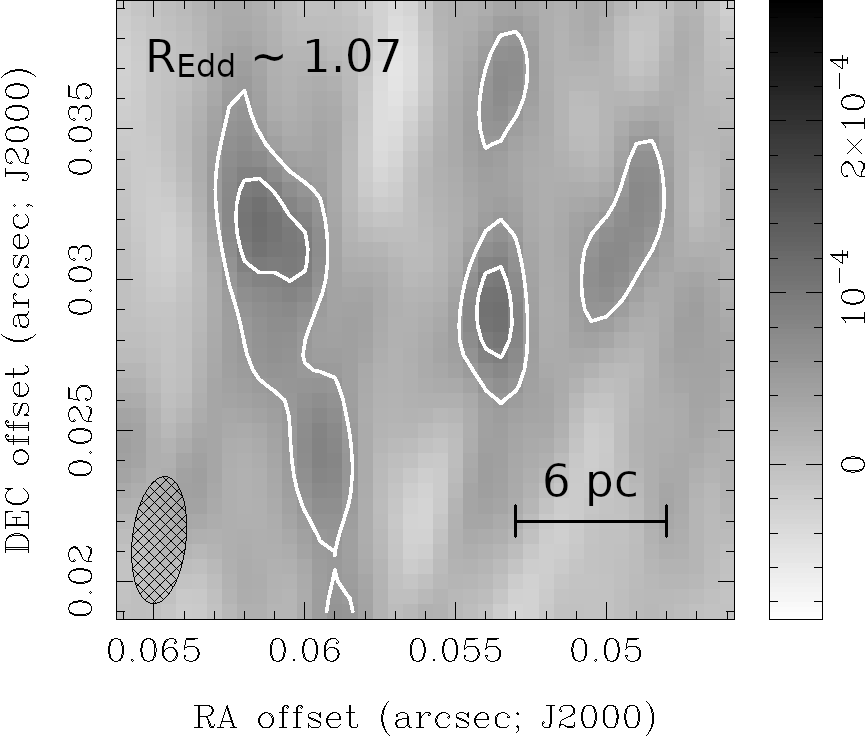
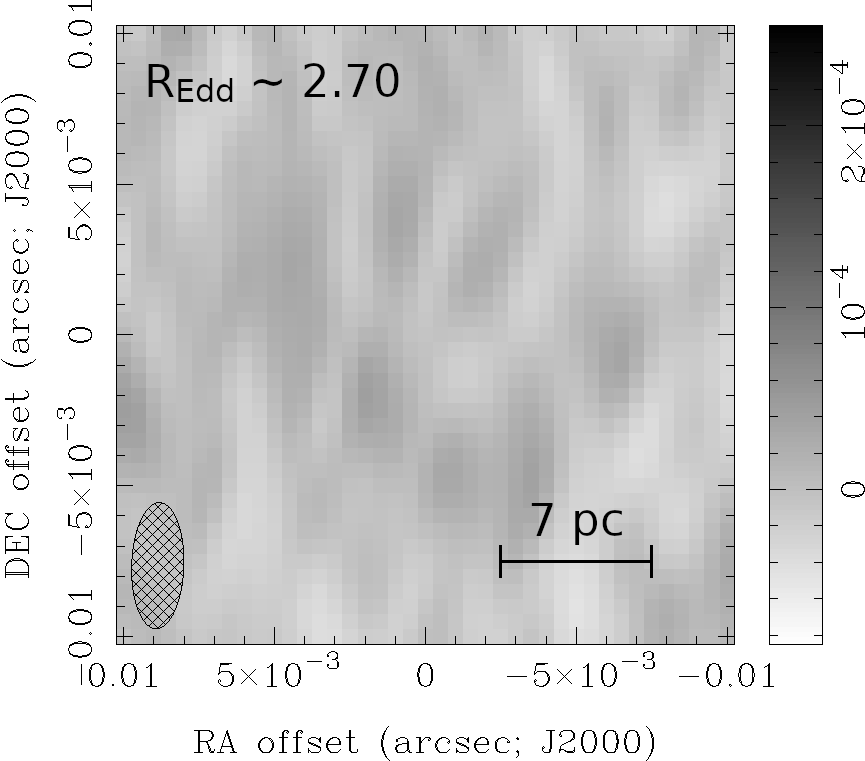
Once calibrated, we imaged the recorded visibility data at each frequency using the AIPS task IMAGR. This program uses the CLEAN algorithm (Högbom, 1974; Clark, 1980) to deconvolve the “dirty image” (produced from taking the 2D Fourier Transform of the visibility) data with the point spread function (PSF; “dirty beam”). This requires choosing the relative weight of data collected from different baselines, and we chose natural weighting (i.e. “robust”=5; Briggs 1995) which maximizes sensitivity at the expense of angular resolution. The resultant images, which have a spatial resolution of , are shown in Figure 1 while their properties are given in Table 3.
Low Eddington
PG 2304+042
PG 1613+658
PG 1149-110
PG 0052+251
1.4 GHz
4.8 GHz
High Eddington
PG 1612+261
PG 2130+099
PG 0050+124
PG 1440+356
1.4 GHz

4.8 GHz
3 Properties of Nuclear Radio Emission
As described in §1, distinguishing between radio emission produced by an accretion disk and an accretion-powered outflow requires measuring the spectrum and morphology of the pc-scale emission probed by the VLBA observations discussed in §2. Below, we describe the criteria needed for determining if a PG RQQ was detected in these images (§3.1) and, if so, measuring the flux density and angular distribution of this emission (§3.2).
| \topruleName | 1.4 GHz | 4.8 GHz | |||||
| (1) | (2) | (3) | (4) | (5) | (6) | (7) | (8) |
| PG 2304+042 | 0.03 | 68 | 613 | -260 | 18 | 273 | -91 |
| PG 1613+658 | 0.08 | 27 | 133 | -134 | 17 | 74 | -73 |
| PG 1149-110 | 0.20 | 47 | 629 | -122 | 21 | 425 | -83 |
| PG 0052+251 | 0.21 | 30 | 297 | -102 | 16 | 244 | -70 |
| PG 1612+261 | 0.39 | 29 | 366 | -139 | 17 | 75 | -78 |
| PG 2130+099 | 0.85 | 31 | 151 | -135 | 15 | 80 | -70 |
| PG 0050+124 | 1.07 | 37 | 813 | -118 | 17 | 91 | -75 |
| PG 1440+356 | 2.70 | 25 | 108 | -111 | 17 | 72 | -70 |
| \botrule |
3.1 VLBA Detections
If an image contains no emission from an astronomical source, the distribution of its pixel intensities should be well described by a Gaussian with an average much smaller than the root-mean-squared () intensity. The symmetric nature of this distribution results in comparable absolute values for the maximum and minimum pixel intensities (”brightness”), though these values will likely be significantly larger than the noise level due to the large number of pixels111The 1.4 GHz images have pixels, while the 4.8 GHz images have pixels. in each image (). However, an image where emission from a source is detected will have , and therefore we require a detection to have a peak intensity and . As shown in Table 3, these criteria indicate that emission is detected in the 1.4 GHz VLBA images of five RQQs, three of which are also detected in their 4.8 GHz VLBA images.
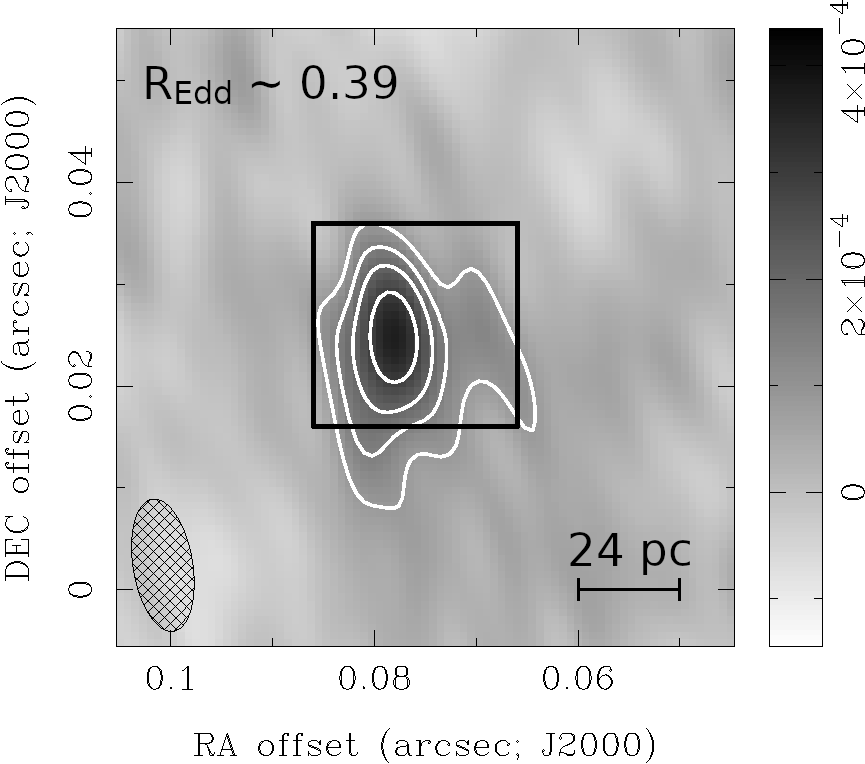
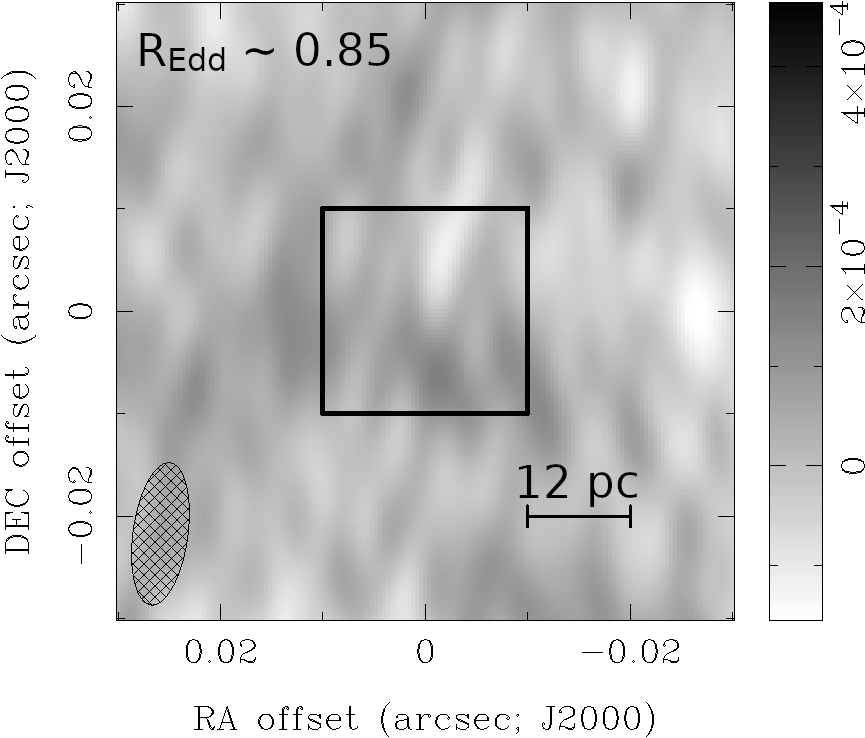
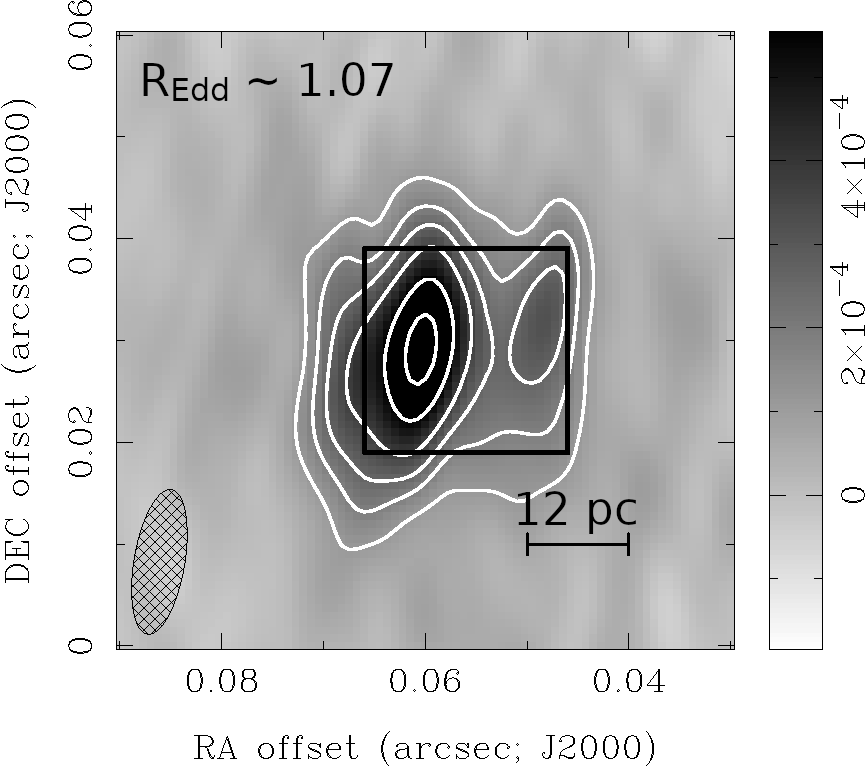
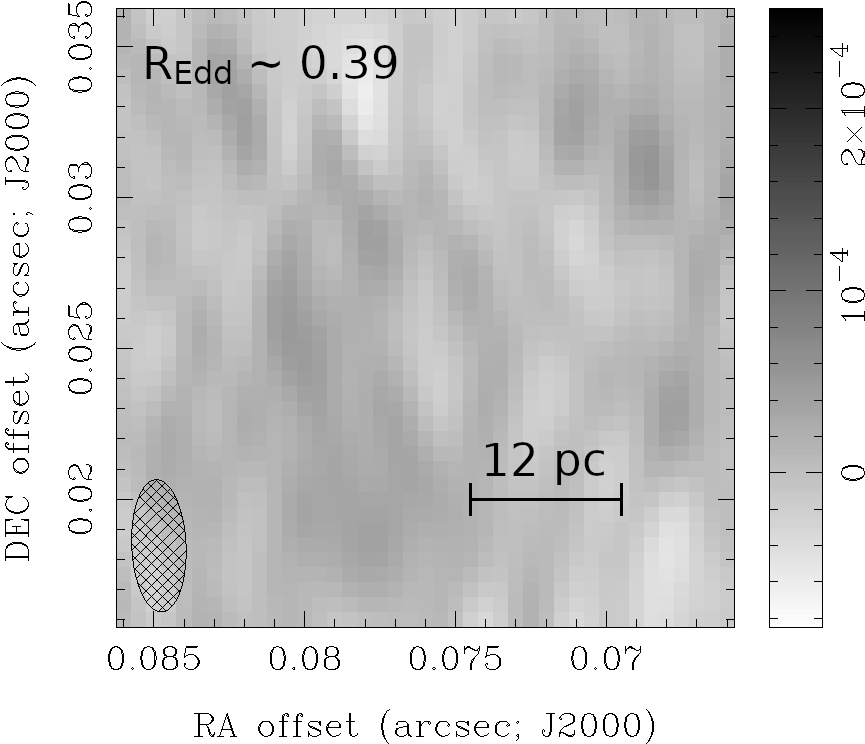
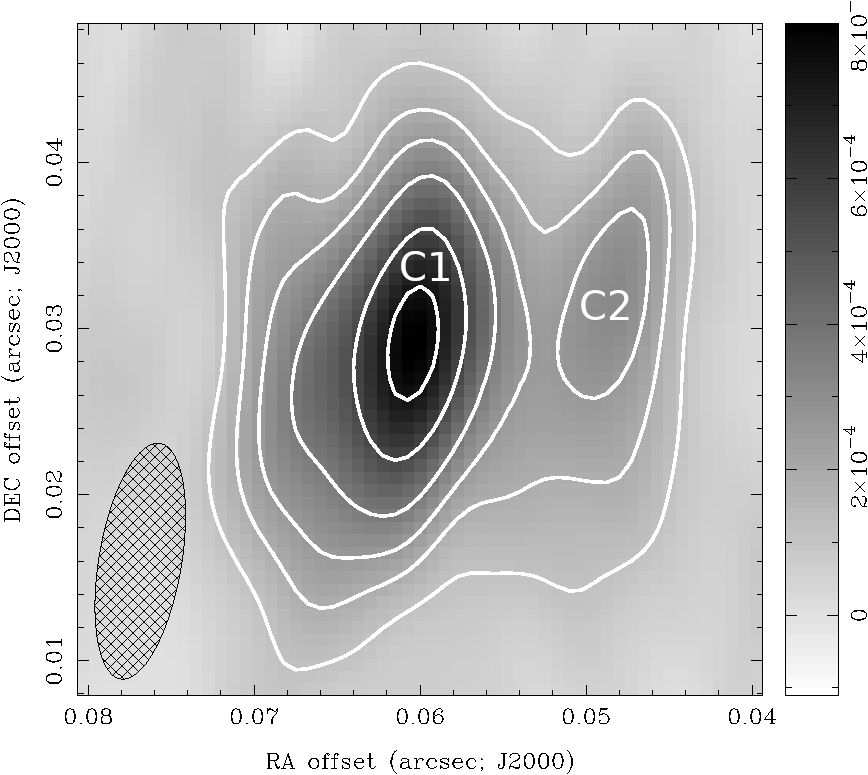
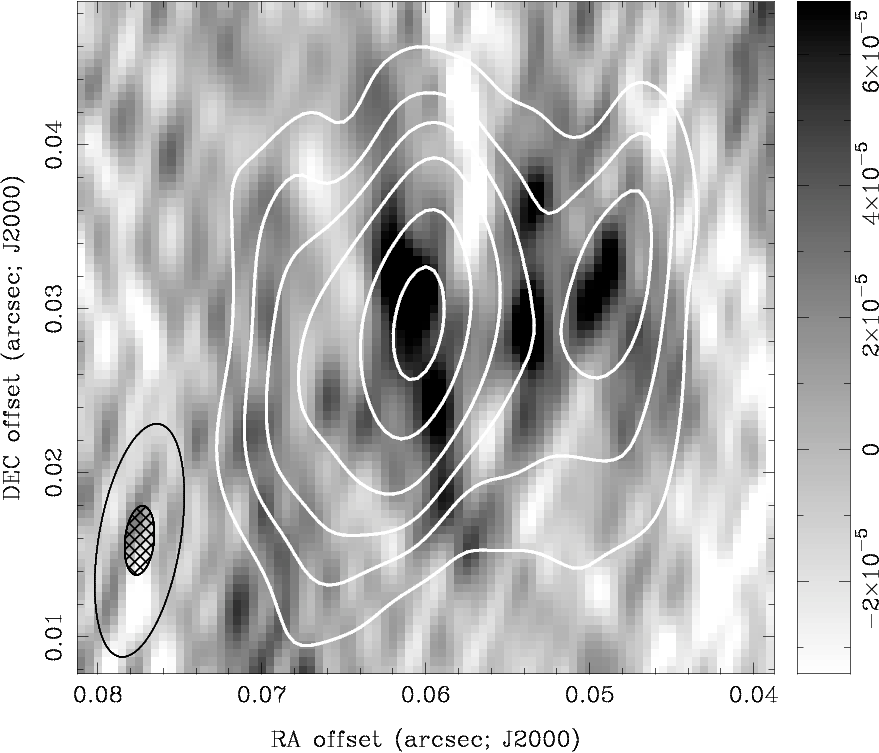
Since PG 1612261 and PG 0050124 were only detected at 1.4 GHz according these criteria, we examined their 4.8 GHz images for emission spatially coincident with that observed at the lower frequency. No such emission was detected in the 4.8 GHz image of PG 1612+261 (Fig. 1), but a excess was detected in the 4.8 GHz image of PG 0050+124 (Fig. 2). While this does not the satisfy the detection criteria described above, the statistical significance of this spatial coincidence suggests it is 4.8 GHz emission from this RQQ, and is treated as such below.
1.4 GHz
4.8 GHz
3.2 Properties of Detected Nuclear Radio Emission
For the RQQs detected in our VLBA images, we used the AIPS task JMFIT to fit the pixel intensities in the region around the image peak intensity the image with a 2D Gaussian model, whose free parameters are the centroid location, peak intensity, major and minor axis, and orientation (position angle). JMFIT then calculates the integrated flux density using these values and the size of the synthesized beam as determined by the task IMAGR. A single 2D Gaussian was sufficient to model the observed emission for all RQQ detections but PG 0050+124, which required two separate Gaussian components at both 1.4 and 4.8 GHz (Fig. 2).
3.2.1 Position of Nuclear Radio Emission
| Name | JMFIT Offsets | Optical position | |||
| Citation | |||||
| [mas] | [mas] | [mas] | |||
| (1) | (2) | (3) | (4) | (5) | (6) |
| PG 2304+042 | 0.03 | -2.6 | +3.7 | Klemola et al. (1987) | |
| PG 1149110 | 0.20 | +3.2 | -3.4 | B. Skiff (private comm. to NED) | |
| PG 0052+251 | 0.21 | -3.6 | +2.4 | B. Skiff (private comm. to NED) | |
| PG 1612+261 | 0.39 | +83 | +25 | Adelman-McCarthy et al. (2008) | |
| PG 0050+124-C1 | 1.07 | +61 | +31 | Clements (1981) | |
| PG 0050+124-C2 | +54 | +29 | |||
As listed in Table 4, the radio emission detected in our VLBA observations appears displaced from the optical center of these galaxies, with the positions derived from image fitting described above suggesting offsets ranging from to (Table 4). Such an offset could result from errors in the absolute astrometry of our VLBA images. However, using the results of a study conducted by Pradel et al. (2006) to determine the positional uncertainty arising from the “phase referencing” technique described in §2, we obtain errors – significantly smaller than what is observed. However, this observed offset could also result from the uncertainty in the optical position used for the phase center of our VLBA observations, which were taken from the NASA/IPAC Extragalactic Database (NED)222The NASA/IPAC Extragalactic Database (NED) is funded by the National Aeronautics and Space Administration and operated by the California Institute of Technology.. As listed in Table 4, this uncertainty is considerably larger than what is observed offsets and therefore we can not conclude if the nuclear radio emission is displaced from the center of these galaxies as observed in other quasars with more precise optical positions (e.g., Kovalev et al. 2017; Yao et al. 2021). However, we note that the observed offsets ( mas) for the higher Eddington ratio quasars are significantly larger than the offsets () for the low Eddington ratio quasars.
3.2.2 Integrated Flux Density and Spectrum of Nuclear Radio Emission
The resultant integrated flux densities of these components are listed Table 5. However, the measured flux densities only include emission from the angular scales probed by the individual pairs of antennae, or baselines, in this array. As described below, this has considerable implications when calculating the spectral index of a source, which requires measuring this flux density at two frequencies.
| \topruleName | [] | [] | |||
|---|---|---|---|---|---|
| (1) | (2) | (3) | (4) | (5) | (6) |
| PG 2304+042 | 700 | ||||
| 2500 | |||||
| PG 1149-110 | 800 | ||||
| 2800 | |||||
| PG 0052+251 | 860 | ||||
| 3000 | |||||
| PG 1612+261 | 1000 | ||||
| 3500 | |||||
| PG 0050+124-C1 | 860 | ||||
| 3000 | |||||
| PG 0050+124-C2 | 860 | ||||
| 3000 | |||||
| \botrule |
For a baseline of (projected) length333The projected length is defined to be the distance between two antenna as measured from the viewpoint of the source. , the measured visibility is the intensity emitted on an angular scale , where is observed wavelength, is the observed frequency, and is the speed of light. Therefore, an observation on the same baseline at two different frequencies measures the intensity not only emitted at different frequencies but also from different angular scales – with observations at 4.8 GHz () measuring the intensity on scales smaller (i.e., more compact) than that measured at 1.4 GHz (). Since our 1.4 and 4.8 GHz VLBA observations (Table 2) were performed using the same array, and therefore the same distribution of baselines, the emission detected at each frequency originates from different, but overlapping, ranges of angular scales. As a result, differences in the measured 1.4 and 4.8 GHz flux density of a source not only reflects its intrinsic spectrum (i.e., intensity as a function of frequency ) but its morphology (i.e., intensity as a function of angular scale ).
Measuring the intrinsic spectral index of these sources requires measuring their flux density at different frequencies but on the same range of angular scales . This requires producing 1.4 and 4.8 GHz images sensitive to the same range of angular scales. The flux density measured from an image produced at frequency using data from baselines longer than only includes emission originating from angular scales , where the largest angular scale is:
| (1) |
Therefore, producing 1.4 and 4.8 GHz images with the same requires the length of the shortest baseline used at 1.4 GHz is longer than the shortest baseline used at 4.8 GHz .
To maximize the data used in this analysis, we set , the projected distance of the shortest baseline during a particular VLBA observation. We then made a 1.4 GHz image only using data from baselines with length by setting the “uvrange” parameter in AIPS task IMAGR (§2) to the appropriate value (given in Table 5). The flux density of the source in this 1.4 GHz image was measured using this same image fitting routine described above, with the resultant values listed in Table 5. We then use this 1.4 GHz flux density to calculate the spectral index (flux density ) of the 4.8 GHz emission detected in an image produced using all baselines, also listed in Table 5.
| \topruleName | 1.4 GHz | ||||||
| [GHz] | pc2 | Compactness | |||||
| (1) | (2) | (3) | (4) | (5) | (6) | (7) | (8) |
| PG2304+042 | 0.03 | 4.8 | 0.83 | 5 | |||
| PG1149-110 | 0.20 | 1.4 | 0.98 | 70 | |||
| 4.8 | 6 | ||||||
| PG0052+251 | 0.21 | 1.4 | 2.71 | 250 | |||
| 4.8 | 4.5 | ||||||
| PG1612+261 | 0.39 | 1.4 | 11.27.3 | 2.35 | 26.217.2 | 355 | |
| PG0050+124-C1 | 1.07 | 1.4 | 1.17 | 200 | |||
| 4.8 | 30 | ||||||
| PG0050+124-C2 | 1.4 | 150 | |||||
| 4.8 | 20 | ||||||
| \botrule |
3.2.3 Extent of Nuclear Radio Emission
Furthermore, if the observed emission originates from a region considerably larger than the synthesized beam, then JMFIT (§2) returns its deconvolved angular size. Since this quantity accounts for the size of the synthesized beam in the image, it should be the same at 1.4 and 4.8 GHz if the same physical region is responsible for the emission observed at both frequencies. However, as listed in Table 6, this is not the case, with the deconvolved size at 1.4 GHz larger than at 4.8 GHz for sources resolved at both frequencies. This discrepancy results from the different angular scales probed by VLBA observations at different frequencies, as discussed in §3.2.2, and the larger size observed at 1.4 GHz indicates emission on scales greater than detectable at 4.8 GHz.
Therefore, the deconvolved size is not the physical extent of the emission region, and we require a different way of estimating this quantity. The dependence between measured flux density and baseline length at a particular frequency allows us to quantitatively measure the distribution of emission on different angular scales, i.e., its morphology. We do so by comparing the 1.4 GHz integrated flux density measured in an image made using all VLBA baselines to that measured in an image produced only using the baselines probing angular scales also measured at 4.8 GHz, . If the emitting region is infinitesimally small, its intensity will be the same on all baselines, and therefore . However, a large emission region will produce a higher intensity on shorter baselines (i.e., larger angular scales) than longer baselines (i.e., smaller angular scales), and therefore . As a result, the ratio of these two flux densities is inversely correlated to the extent of the emitting region. We therefore define the “1.4 GHz Compactness” of a source to be:
| (2) |
such that , and a more compact (higher fraction of the total emission originating from a smaller volume) source will have a larger 1.4 GHz Compactness than a more diffuse source. We calculated this quantity using the flux densities given in Table 5, with the results listed in Table 6.
4 Eddington Ratio Dependence of PG RQQ Radio Properties
Using the morphological and spectral properties of the radio emission of these RQQs described in §3, we can now disentangle emission from the innermost accretion disk (compact, flat spectrum) and an accretion-powered outflow (diffuse, steep spectrum). In this Section, we discuss the different origins of the radio emission observed from these eight PG RQQs, and how their properties change with Eddington ratio of these AGN.
While our 4.8 GHz VLBA observation of these PG RQQs can only detect emission originating in regions in size, previous VLA observations measured the total emission from regions large. Since these past 4.8 GHz VLA observations measured flux densities (VLA Table 1) greatly exceeding the noise level of our 4.8 GHz VLBA images (Table 2), a VLBA non-detection of a particular RQQ indicates its 4.8 GHz radio emission originates from a region in size, and/or has significantly decreased during the years since the VLA observation, with the short variability timescale requiring a compact emission region. We are unable to distinguish between these two possibilities for the only low Eddington PG RQQ not detected in our VLBA observations (PG 1613+658) since there exists only one previous 4.8 GHz VLA observation of this source. However, all of the high Eddington ratio PQ RQQs undetected in our 4.8 GHz VLBA observations (PG 1440+356, PG 1612+261, and PG 2130+099) were detected with a nearly constant flux densities in multiple 4.8 GHz VLA observations (Table 1), suggesting their radio emission primarily originates from a large region and therefore produced by an outflow.
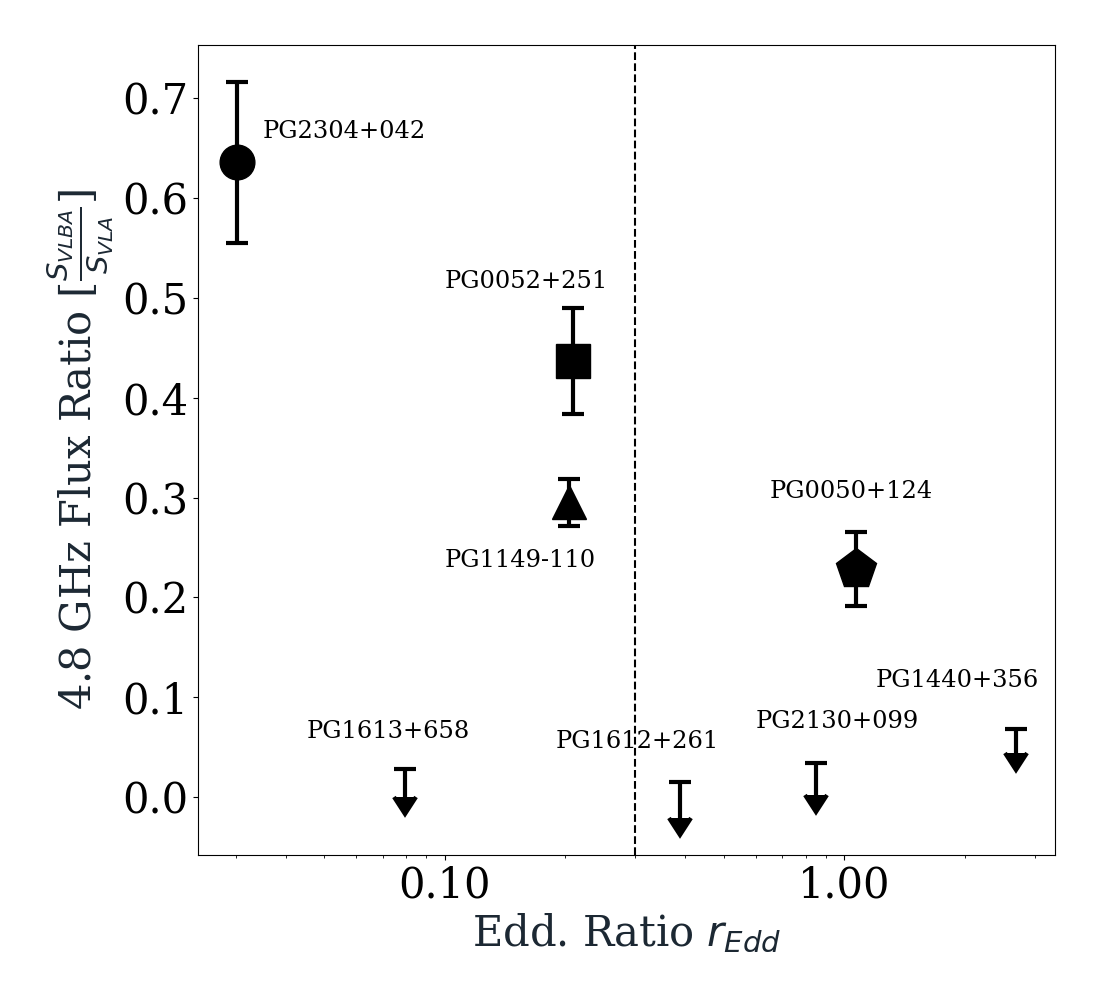
Similarly, the detection of 4.8 GHz VLBA emission from a PG RQQ suggests a significant contribution from compact () regions. The higher detection rate of low Eddingtion RQQs in our 4.8 GHz VLBA observations suggests a higher fraction of their radio emission originates from smaller regions than their high Eddington counterparts. To further investigate this dependence, we calculate the ratio of a RQQ’s 4.8 GHz VLBA to VLA flux densities, which constrains the fraction of the AGN’s total radio emission originating from its nucleus (defined as the central of the galaxy in this work). As shown in Figure 3, of the total 4.8 GHz radio emission from high Eddington ratio RQQs originates from inside their nucleus – indicating their radio emission is predominately produced by a larger scale outflow. However, the nucleus of low Eddington ratio RQQs can contribute as much as of their total 4.8 GHz radio emission. The increased 4.8 GHz VLBA detection rate and VLBA-to-VLA flux ratio of low Eddington ratio RQQs suggests that nuclear radio emission is both more common and more prominent in such AGN.
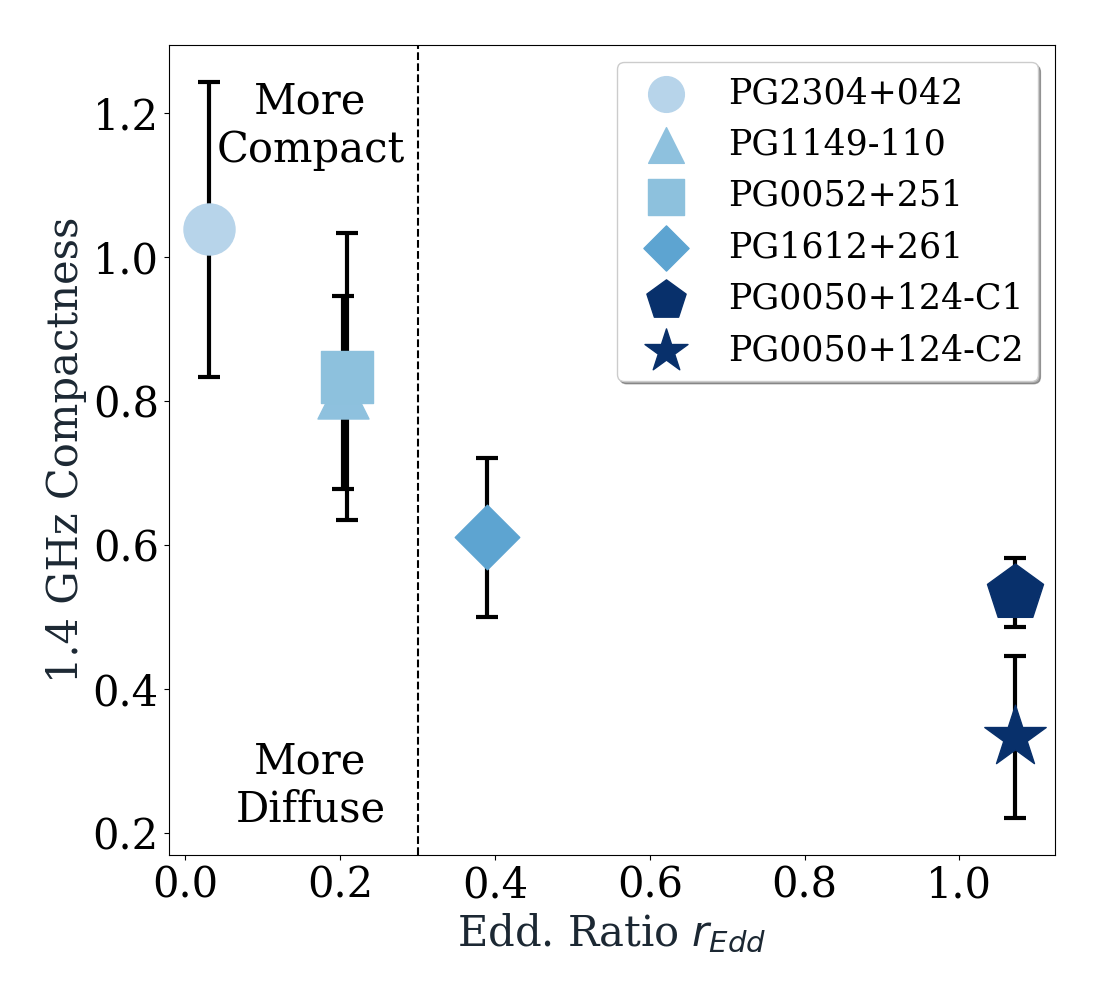
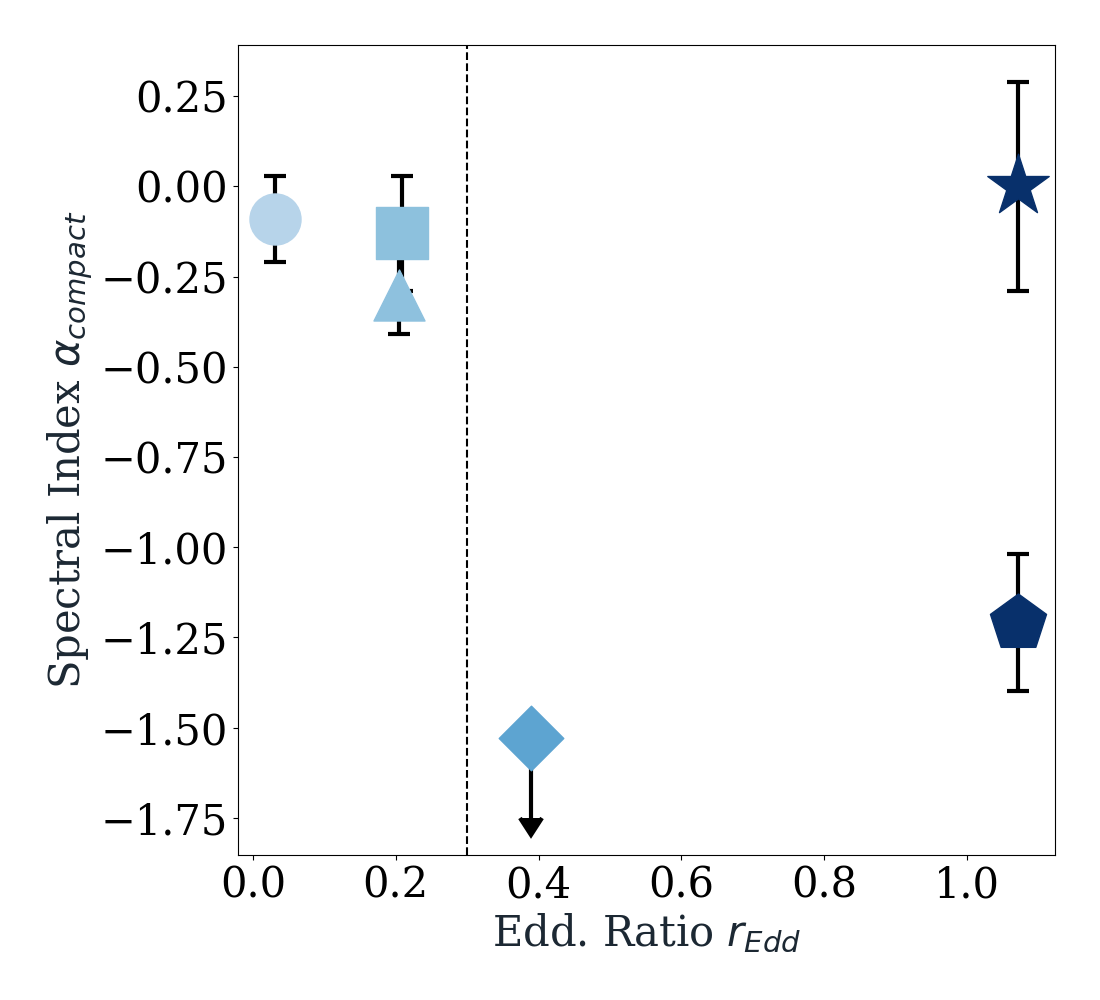
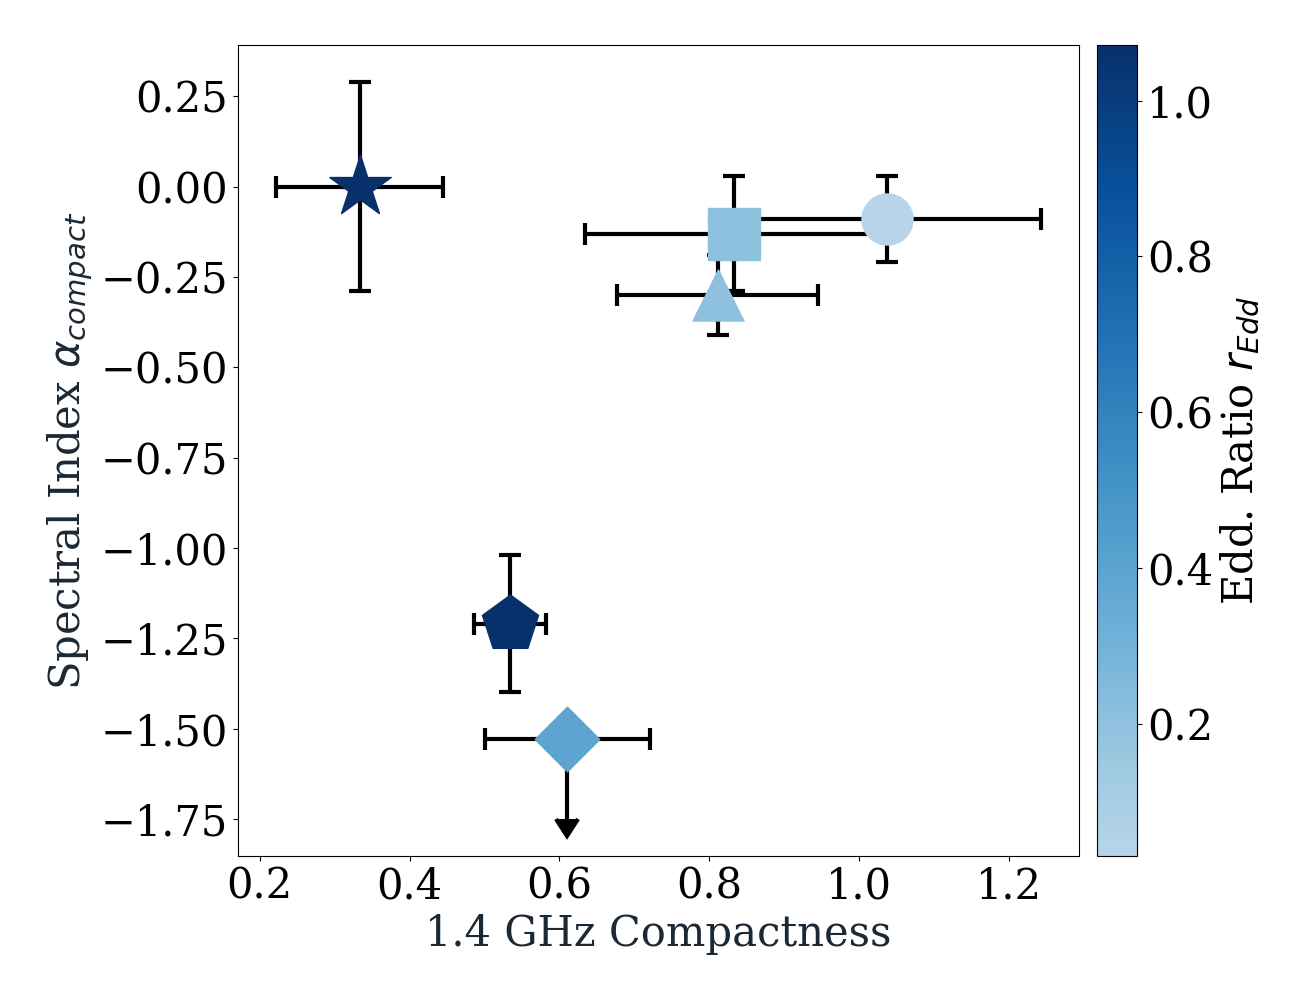
To determine if the nuclear properties (Section 3.2) of the VLBA detected AGN also depends on Eddington ratio, we plotted the 1.4 GHz Compactness (Equation 2) and compact spectral index of their nuclear radio emission (Table 5) as a function of – shown in Figure 4. We find that the 1.4 GHz compactness of nuclear radio sources decreases as the Eddington ratio increases (Figure 4; left), with compact regions responsible for of the total 1.4 GHz nuclear emission in the three low Eddington ratio RQQs detected in our VLBA observations, but only of the emission from the nuclear radio sources detected in the high Eddington ratio RQQs. We also find differences between the 1.4 - 4.8 GHz spectral index of compact regions within the nucleus of low and high Eddingtion RQQs. Low Eddington ratio RQQs all have flat spectra, as does the second component observed from high Eddington ratio RQQ PG 0050+124 (PG 0050+124-C2; Fig. 2). However, the first component observed from PG 0050+124 (PG 0050+124-C1; Fig. 2) and the other high Eddington ratio RQQ detection both have extremely steep radio spectra. The observed difference in 1.4 GHz compactness and radio spectral index of the nuclear emission of low and high Eddington RQQs suggests a difference in physical origin.
Using the measured compactness and spectral indices of the nuclear radio emission, we can determine if it originates in the innermost accretion disk, outflow, or a mixture of both. As shown in the right panel of Fig. 4, the observed compact nature and flat spectrum () of the nuclear emission from the detected low Eddington ratio RQQs – PG 2304+042, PG 1149-110, and PG 0052+251 – suggests this emission primarily originates from the innermost regions of the accretion disk. This is further supported by the relatively small offsets between the radio emission in these sources and the optical center of the galaxy.
The diffuse 1.4 GHz emission (low compactness) from the second component in high Eddington RQQ PG 0050+124 (PG 0050+124-C2; Fig. 2) is characteristic of an outflow, but its compact (4.8 GHz) core has a flatter radio spectrum than expected for such emission. This suggests that C2 may be the location of the SMBH, with the flat-spectrum emission from the disk corona embedded within the more diffuse, steep-spectrum, radio emission generated by the outflow powered by this AGN (e.g., An et al. 2010; Pushkarev & Kovalev 2012). An alternate possibility is that C2 is a flat spectrum component of this larger scale outflow (e.g., Hovatta et al. 2014). Future VLBI observations phase centered on a more precise optical position (e.g., from the GAIA Data Release 3; Vallenari et al. 2022) could distinguish between these possibilities, though the relatively large () offset from the current position favors the latter.
Finally, the diffuse nature (low 1.4 GHz compactness) and steep radio spectra () of the nuclear emission of high Eddington ratio RQQ PG 1612+261 and the first component in high Eddington RQQ PG 0050+124 (PG 0050+124-C1; Fig. 2) suggesting they are both produced by outflows.
5 Summary and Conclusions
In this paper, we present the results of 1.4 and 4.8 GHz VLBA observations of eight PG RQQs spanning a wide range of Eddington ratios (; Table 1). Our analysis indicates that the radio properties of the observed RQQs strongly depend on their Eddington ratio: as increases, a smaller fraction of its total radio emission is generated in its nucleus, and its radio nuclear emission becomes increasingly diffuse and has a steeper radio spectrum. Furthermore, these differences are indicative of changes in the physical origin of the radio emission from these RQQs. At low Eddington ratios, the innermost accretion disk (i.e., the disk corona and/or jet base) is primarily responsible for the total radio emission. As the Eddington ratio increases, the size and relative contribution of outflows increases until they dominate the emission at the highest Eddington ratios. Such a dependence is not observed from radio-loud quasars, but similar results are obtained in studies of other manifestations of radio-quiet AGN, e.g. Narrow-Line Seyfert 1s (e.g., Doi et al. 2015; Yao et al. 2021). Therefore, our results likely hold for the broader population of radio-quiet AGN.
Furthermore, a similar behavior is observed from stellar-mass black hole binaries (BHBs), whose radio properties depend strongly on the “spectral state” (defined using a combination of Eddington ratio and X-ray spectrum) of these systems (see recent review by Gallo 2010). The radio emission of BHBs in the “low/hard” spectral state, systems with an Eddington ratio (e.g. Dunn et al. 2010), is typically dominated by an extremely compact, flat spectrum radio source – similar to what we observe for PG 2304+042 (which has a comparable Eddington ratio). As the Eddington ratio of a BHB increases, the contribution of the flat spectrum, compact core decreases, and their radio emission is increasingly dominated by optically thin synchrotron radiation generated by an outflow or weak jet (e.g., Gallo 2010). This is consistent with the increasing size, and steepening spectrum, of the nuclear radio emission with Eddington ratio we observe from the RQQs in our sample. Lastly, the transition of BHBs into the “high/soft” spectral state, when they have the highest accretion rates, is often accompanied by the ejection of radio-emitting optically thin plasmons from the accretion disk – similar to the steep spectrum components observed in the nuclear regions of PG 1612+261 and PG 0050+124, the two high Eddington ratio RQQs in our sample detected by the VLBA. This correspondence between the nuclear radio emission of RQQs and stellar-mass black hole X-ray binaries across a wide range of Eddington ratios (and spectral states) is strong evidence for the universality of accretion onto black holes.
References
- Adelman-McCarthy et al. (2008) Adelman-McCarthy, J. K., Agüeros, M. A., Allam, S. S., et al. 2008, ApJS, 175, 297, doi: 10.1086/524984
- An et al. (2010) An, T., Hong, X. Y., Hardcastle, M. J., et al. 2010, MNRAS, 402, 87, doi: 10.1111/j.1365-2966.2009.15899.x
- Barvainis et al. (1996) Barvainis, R., Lonsdale, C., & Antonucci, R. 1996, AJ, 111, 1431, doi: 10.1086/117888
- Bennett et al. (2014) Bennett, C. L., Larson, D., Weiland, J. L., & Hinshaw, G. 2014, ApJ, 794, 135, doi: 10.1088/0004-637X/794/2/135
- Blandford et al. (2019) Blandford, R., Meier, D., & Readhead, A. 2019, ARA&A, 57, 467, doi: 10.1146/annurev-astro-081817-051948
- Briggs (1995) Briggs, D. S. 1995, PhD thesis, New Mexico Institute of Mining and Technology, United States
- Clark (1980) Clark, B. G. 1980, A&A, 89, 377
- Clements (1981) Clements, E. D. 1981, MNRAS, 197, 829, doi: 10.1093/mnras/197.4.829
- Deller et al. (2011) Deller, A. T., Brisken, W. F., Phillips, C. J., et al. 2011, PASP, 123, 275, doi: 10.1086/658907
- Doi et al. (2015) Doi, A., Wajima, K., Hagiwara, Y., & Inoue, M. 2015, ApJ, 798, L30, doi: 10.1088/2041-8205/798/2/L30
- Dunn et al. (2010) Dunn, R. J. H., Fender, R. P., Körding, E. G., Belloni, T., & Cabanac, C. 2010, MNRAS, 403, 61, doi: 10.1111/j.1365-2966.2010.16114.x
- Gallo (2010) Gallo, E. 2010, in Lecture Notes in Physics, Berlin Springer Verlag, ed. T. Belloni, Vol. 794, 85, doi: 10.1007/978-3-540-76937-8_4
- Green et al. (1986) Green, R. F., Schmidt, M., & Liebert, J. 1986, ApJS, 61, 305, doi: 10.1086/191115
- Greisen (1990) Greisen, E. W. 1990, in Acquisition, Processing and Archiving of Astronomical Images, 125–142
- Högbom (1974) Högbom, J. A. 1974, A&AS, 15, 417
- Hovatta et al. (2014) Hovatta, T., Aller, M. F., Aller, H. D., et al. 2014, AJ, 147, 143, doi: 10.1088/0004-6256/147/6/143
- Kellermann et al. (1989) Kellermann, K. I., Sramek, R., Schmidt, M., Shaffer, D. B., & Green, R. 1989, AJ, 98, 1195, doi: 10.1086/115207
- Klemola et al. (1987) Klemola, A. R., Jones, B. F., & Hanson, R. B. 1987, AJ, 94, 501, doi: 10.1086/114489
- Kovalev et al. (2017) Kovalev, Y. Y., Petrov, L., & Plavin, A. V. 2017, A&A, 598, L1, doi: 10.1051/0004-6361/201630031
- Kukula et al. (1998) Kukula, M. J., Dunlop, J. S., Hughes, D. H., & Rawlings, S. 1998, MNRAS, 297, 366, doi: 10.1046/j.1365-8711.1998.01481.x
- Laor et al. (2019) Laor, A., Baldi, R. D., & Behar, E. 2019, MNRAS, 482, 5513, doi: 10.1093/mnras/sty3098
- Leipski et al. (2006) Leipski, C., Falcke, H., Bennert, N., & Hüttemeister, S. 2006, A&A, 455, 161, doi: 10.1051/0004-6361:20054311
- Lynden-Bell (1969) Lynden-Bell, D. 1969, Nature, 223, 690, doi: 10.1038/223690a0
- Panessa et al. (2019) Panessa, F., Baldi, R. D., Laor, A., et al. 2019, Nature Astronomy, 3, 387, doi: 10.1038/s41550-019-0765-4
- Pradel et al. (2006) Pradel, N., Charlot, P., & Lestrade, J. F. 2006, A&A, 452, 1099, doi: 10.1051/0004-6361:20053021
- Pushkarev & Kovalev (2012) Pushkarev, A. B., & Kovalev, Y. Y. 2012, A&A, 544, A34, doi: 10.1051/0004-6361/201219352
- Salpeter (1964) Salpeter, E. E. 1964, ApJ, 140, 796, doi: 10.1086/147973
- Sandage (1965) Sandage, A. 1965, ApJ, 141, 1560, doi: 10.1086/148245
- Urry & Padovani (1995) Urry, C. M., & Padovani, P. 1995, PASP, 107, 803, doi: 10.1086/133630
- Vallenari et al. (2022) Vallenari, A., Arenou, F., Bellazzini, M., et al. 2022, Gaia DR3 documentation Chapter 19: Performance verification, Gaia DR3 documentation, European Space Agency; Gaia Data Processing and Analysis Consortium. Online at ¡A href=“https://gea.esac.esa.int/archive/documentation/GDR3/index.html”¿https://gea.esac.esa.int/archive/documentation/GDR3/index.html¡/A¿, id. 19
- Wells (1985) Wells, D. C. 1985, in Data Analysis in Astronomy, ed. V. di Gesu, L. Scarsi, P. Crane, J. H. Friedman, & S. Levialdi, 195
- Whitney et al. (2013) Whitney, A. R., Beaudoin, C. J., Cappallo, R. J., et al. 2013, PASP, 125, 196, doi: 10.1086/669718
- Wright (2006) Wright, E. L. 2006, PASP, 118, 1711, doi: 10.1086/510102
- Yao et al. (2021) Yao, S., Yang, X., Gu, M., et al. 2021, MNRAS, 508, 1305, doi: 10.1093/mnras/stab2651