11email: Rik.Claes@eso.org 22institutetext: School of Physics, University College Dublin, Belfield, Dublin 4, Ireland 33institutetext: School of Cosmic Physics, Dublin Institute for Advanced Studies, 31 Fitzwilliam Place, Dublin 2, Ireland 44institutetext: Purple Mountain Observatory, Chinese Academy of Sciences, 10 Yuanhua Road, Nanjing 210023, People’s Republic of China 55institutetext: Konkoly Observatory, Research Centre for Astronomy and Earth Sciences, Eötvös Loránd Research Network (ELKH), Konkoly-Thege Miklós út 15-17, 1121 Budapest, Hungary 66institutetext: ELTE Eötvös Loránd University, Institute of Physics, Pázmány Péter sétány 1/A, 1117 Budapest, Hungary 77institutetext: INAF – Osservatorio Astronomico di Capodimonte, via Moiariello 16, 80131 Napoli, Italy 88institutetext: SUPA, school of science and engineering, university of dundee, nethergate, dundee dd1 4hn, U.K. 99institutetext: INAF – Osservatorio Astrofisico di Torino, Via Osservatorio 20, I-10025 Pino Torinese, Italy 1010institutetext: INAF – Osservatorio Astrofisico di Arcetri, L.go E. Fermi 5, 50125 Firenze, Italy 1111institutetext: INAF - Osservatorio Astrofisico di Catania, via S. Sofia, 78, 95123 Catania, Italy 1212institutetext: Departamento de Física e Astronomia, Faculdade de Ciências, Universidade do Porto, Rua do Campo Alegre 687, PT4169-007 Porto, Portugal 1313institutetext: Instituto de Astrofísica e Ciências do Espaço, Universidade do Porto, CAUP, Rua das Estrelas, PT4150-762 Porto, Portugal 1414institutetext: Kavli Institute for Astronomy and Astrophysics, Peking University, Yiheyuan 5, Haidian Qu, 100871 Beijing, China 1515institutetext: Department of Astronomy, Peking University, Yiheyuan 5, Haidian Qu, 100871 Beijing, China 1616institutetext: Max Planck Institute for Astronomy, Königstuhl 17, D-69117 Heidelberg, Germany 1717institutetext: School of Physics and Astronomy, University of Leicester, Leicester LE1 7RH, UK 1818institutetext: SETI Institute, 339 Bernardo Avenue, Suite 200, Mountain View, CA 94043, USA
PENELLOPE III. The peculiar accretion variability of XX Cha and its impact on the observed spread of accretion rates ††thanks: Based on observations collected at the European Southern Observatory under ESO programmes 084.C-1095 and 106.20Z8.
The processes regulating protoplanetary disk evolution are constrained by studying how mass accretion rates scale with stellar and disk properties. The spread in these relations can be used as a constraint to the models of disk evolution, but only if the impact of accretion variability is correctly accounted for. While the effect of variability might be substantial in the embedded phases of star formation, it is often considered limited at later stages. Here we report on the observed large variation in the accretion rate for one target, XX Cha, and we discuss the impact on population studies of classical T Tauri stars. The mass accretion rate determined by fitting the UV-to-near-infrared spectrum in recent X-Shooter observations is compared with the one measured with the same instrument 11 years before. XX Cha displays an accretion variability of almost 2 dex between 2010 and 2021. Although the timescales on which this variability happens are uncertain, XX Cha displays an extreme accretion variability for a classical T Tauri star. If such behavior is common among classical T Tauri stars, possibly on longer timescales than previously probed, it could be relevant for discussing the disk evolution models constrained by the observed spread in accretion rates. Finally, we remark that previous studies of accretion variability based on spectral lines may have underestimated the variability of some targets.
Key Words.:
Accretion, accretion disks - Stars: pre-main sequence - Stars: variables: T Tauri, Herbig Ae/Be - Stars: individual: XX Cha1 Introduction
While planets are forming, the protoplanetary disks they are born in evolve under the effect of several processes. Of particular relevance is how the material is transported through the disk and how it is accreted onto the central star (Hartmann et al. 2016). Accretion regulates the final stellar mass, and it is commonly used in combination with the stellar and disk mass to constrain the models driving the global evolution of disks (Manara et al. 2022).
The accretion process is intrinsically highly variable (e.g., Stauffer et al. 2014) on timescales of minutes to years (e.g., Fang et al. 2013; Costigan et al. 2014), with different magnitudes of variability (e.g., Hillenbrand & Findeisen 2015; Fischer et al. 2022). It has often been questioned whether accretion variability can explain the spread of 2-3 dex observed in the relations between accretion rates and stellar or disk masses (e.g., Manara et al. 2020, 2022). If not dominated by accretion variability, this spread is a way to test and constrain disk evolution models, in particular to highlight the limits of the viscous evolution scenario (e.g., Mulders et al. 2017; Lodato et al. 2017; Manara et al. 2020, 2022). Independently from each other, several works have shown that, typically, accretion variability peaks at 0.5 dex on timescales of a few weeks (Costigan et al. 2012, 2014; Biazzo et al. 2012, 2014; Venuti et al. 2014; Frasca et al. 2015; Zsidi et al. 2022). Such variability is too small to explain the observed scatter. However, little data exist probing longer timescales of decades, and this is usually limited to single band photometric studies, which would hardly distinguish between variations in the stellar photosphere or accretion variability. Finally, a tiny fraction of young stars, named FU Orionis and EXor, have been identified to show a strong (2-3 dex) increase in their accretion rates lasting years (e.g., Audard et al. 2014; Fischer et al. 2022). Since they are rare, they are not considered to have a significant impact on the observed relations.
Here we present and analyze the case of the highly variable young stellar object (YSO) XX Cha, observed with the same spectrograph in 2010 (Manara et al. 2016, 2017) and then in 2021. We then discuss the implications on studies of disk evolution based on accretion and stellar or disk masses.
2 Target, observations, and data reduction
The target of this study is XX Cha (2MASS J11113965-7620152, Ass Cha T 2-49), a classical T Tauri star (CTTS) in the Chamaeleon I region, at a distance of 192 pc (Gaia Collaboration et al. 2021). This star is part of a very wide binary system with CHX 18N (Kraus & Hillenbrand 2007), with an angular separation of 24.38″4,600 au.
XX Cha hosts a disk that was detected with Atacama Large Millimeter Array (ALMA) in the Band 7 continuum (Pascucci et al. 2016), but it was not detected in the 13CO gas emission (Long et al. 2017). The corresponding disk dust mass is 8.12 (Manara et al. 2022).
XX Cha is known to have a significant mid-infrared variability. Kóspál et al. (2012) compared the ISO/ISOPHOT-S and Spitzer IRS spectra of this target, and found a strong decadal change in the 5-12 m range, with a peculiar wavelength dependence. XX Cha is one of the only sources where an anti-correlation was found in the silicate emission feature at m with the continuum flux between m, as opposed to a correlation. Such a variability may be caused by variable shadowing of the silicate emitting region (Kóspál et al. 2012).
2.1 Spectroscopic observations
XX Cha was observed from the ESO Very Large Telescope (VLT) with the X-Shooter instrument. It is a medium-resolution spectrograph simultaneously observing in three wavelength ranges, called the UV-Blue (UVB) (300–560 nm), Visible (VIS) (560–1024 nm), and Near-IR (NIR) (1020–2480 nm) arms (Vernet et al. 2011).
The first observation was taken on 19 January 2010 (UT 07:39:06) in visitor mode, and it was analyzed by Manara et al. (2016). The target was observed a second time on 5 June 2021 (UT 03:45:18) as a part of the PENELLOPE Large Program (Manara et al. 2021). The latter observation is presented here for the first time. Both observations used a combination of a short exposure with a wide set of slits - 5.0″ wide, except for the NIR arm in 2010 when a 1.5″ slit was used to measure absolute fluxes, followed by a long nod-on-slit integration with a narrower set of slits - 1.0″-0.4″-0.4″ in the UVB, VIS, and NIR arms, so as to achieve a spectral resolution 5400, 18400, and 11600 in the three arms, respectively.
The reduction of the spectra taken was performed using the ESO X-Shooter pipeline (Modigliani et al. 2010) v1.3.2 and v3.5.0 for the 2010 and 2021 epochs, respectively. The final flux calibration was performed by rescaling the narrow slit spectrum to the wide slit one as described by Manara et al. (2016, 2021). The flux calibration accuracy for the 2010 epoch of XX Cha was found by Rugel et al. (2018) to be . We expect a similar value for the 2021 epoch. In 2010, the low signal to noise of the flux standard star in the NIR arm did not allow for a proper flux calibration of most of this arm, and telluric correction could also not be performed. Telluric lines were removed from the VIS and NIR parts of the 2021 spectrum using the molecfit tool (Smette et al. 2015).
2.2 Photometric data
The American Association of Variable Star Observers (AAVSO) obtained photometric data for XX Cha to complement the TESS and Hubble Space Telescope (HST) ULLYSES (Roman-Duval et al. 2020; Espaillat et al. 2022) observations111 https://www.aavso.org/hst-ulyssessouthern-t-tauri-campaign-01 from April to August 2021. We collected this dataset, covering , , , and band photometry, from the AAVSO website 222 https://www.aavso.org/data-download (Kafka 2020).
Optical photometry in the , , and band is also available for periods spanning from April 2010 to May 2010 and January 2013. The 2010 photometry contains ten observations obtained with the REM telescope (Pr.Id. 21703, PI: Michel Curé). The 2013 photometry contains four epochs obtained with the ANDICAM instrument on the CTIO 1.3m telescope (Project ID: ESA-12B-0001, PI: Ágnes Kóspál). The light curve and additional information is reported in Appendix A.1.
3 Analysis
3.1 Continuum variations
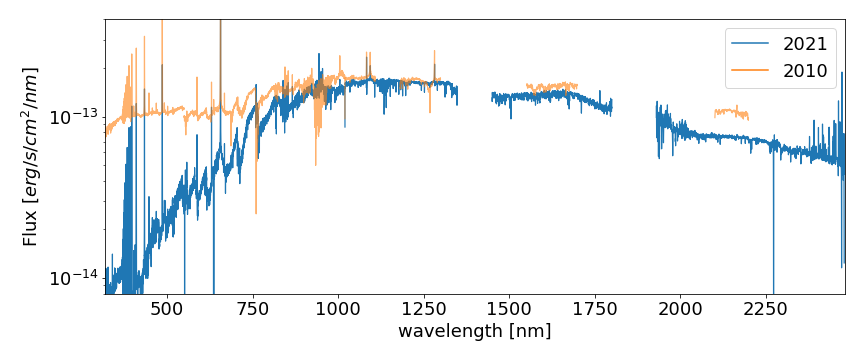
A comparison between the two X-Shooter spectra can be seen in Fig. 1. The spectrum obtained in 2010 is significantly brighter than the one taken in 2021 at wavelengths shorter than 800 nm, suggestive of either a higher accretion rate in 2010 or different extinction. The two spectra look quite similar at longer wavelengths; although, the -band spectrum in the 2010 epoch is, on average, times brighter than in the 2021 epoch, hinting at a difference in the inner disk properties.
Synthetic photometry was performed on both X-Shooter spectra using the PYPHOT package333 https://mfouesneau.github.io/docs/pyphot/index.html in the Johnson-Cousins , , and bands. The obtained values are listed in Table 2. A good agreement between the 2021 spectrum and almost simultaneous photometry can be seen in Fig. 4. The 2021 X-Shooter observation was obtained when the star was at a minimum of the short-term light curve. No simultaneous photometry is available for the 2010 epoch. However, the synthetic photometry of the 2010 spectrum appears to fall close to the maximum brightness observed in the available photometry. We conclude that the X-Shooter observations are taken close to the extremes of the known photometric variability of XX Cha.
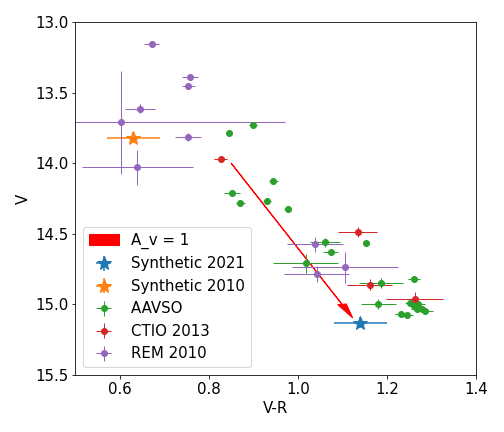
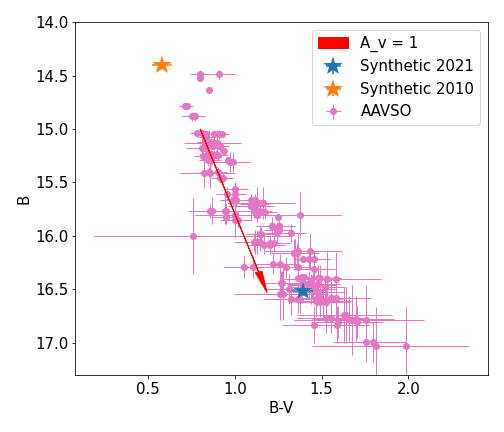
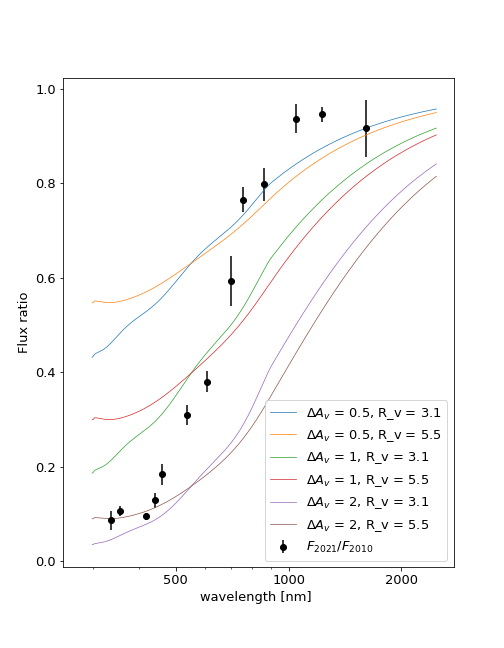
Variations in the circumstellar extinction can explain dippers and dimming events of peculiar stars (e.g., Schisano et al. 2009; Bouvier et al. 2013; Facchini et al. 2016; Schneider et al. 2018; Koutoulaki et al. 2019). To exclude this possibility, Fig. 5-6 show the color-magnitude diagram of XX Cha, and they indicate that the variations between the two epochs are incompatible with just extinction variations. Similarly, flux ratios between the two spectra are compared with typical reddening laws for increasing values of and in Fig. 7, showing that the observed variations cannot be fully explained by a difference in extinction.
Finally, the lithium line at 670.78 nm is found to have a lower equivalent width in 2010 when compared to 2021 (Fig. 8). This is due to an increase in the veiling in 2010, which is related to an increase in the accretion rate. The analysis of the spectra with ROTFIT (Frasca et al. 2017) indeed leads to a measured veiling at 620 nm of 6.4 in 2010 and of 0.6 in 2021.
3.2 Stellar and accretion properties
The stellar and accretion parameters were derived by fitting the UV excess in the X-Shooter spectra with the procedure described by Manara et al. (2013) (see Appendix B.2). The 2010 data were analyzed with this method by Manara et al. (2016). Here, for 2010, we use the values reported by Manara et al. (2022), which were computed by rescaling the distance to 192 pc, assuming the relation between spectral type and temperature by Herczeg & Hillenbrand (2014), and the non-magnetic evolutionary tracks by Feiden (2016) to obtain the stellar mass. These values are reported in Table 1.
With the same method and the same assumptions, we fit the 2021 spectrum, and we derived a spectral type consistent with the 2010 result within half of a subclass, but we obtain significant differences in the other parameters. In particular, the mass accretion rate () is found to be smaller by 2 dex than in 2010, and is found to be smaller by 0.7 mag. Since veiling can make the determination of the stellar parameters more uncertain (e.g., Calvet & Gullbring 1998), we repeated the fit of the 2010 spectrum, using the same photospheric template and extinction as derived in the 2021 epoch. We obtain a lower than previously reported (see Table 1, column 2010*), leading to a difference in of dex compared to the 2021 observations.
| Epoch of observation | |||
|---|---|---|---|
| Property | 2010 | 2021 | 2010* |
| SpT | M3.5 | M3 | M3* |
| (K) | 3300 | 3410 | 3410* |
| (mag) | 1.0 | 0.3 | 0.3* |
| () | 0.42 | 0.30 | 0.39 |
| () | -0.65 | -2.34 | -1.06 |
| () | 0.24 | 0.30 | 0.30 |
| (/yr) | -7.14 | -9.06 | -7.69 |
3.3 Accretion properties from the emission lines
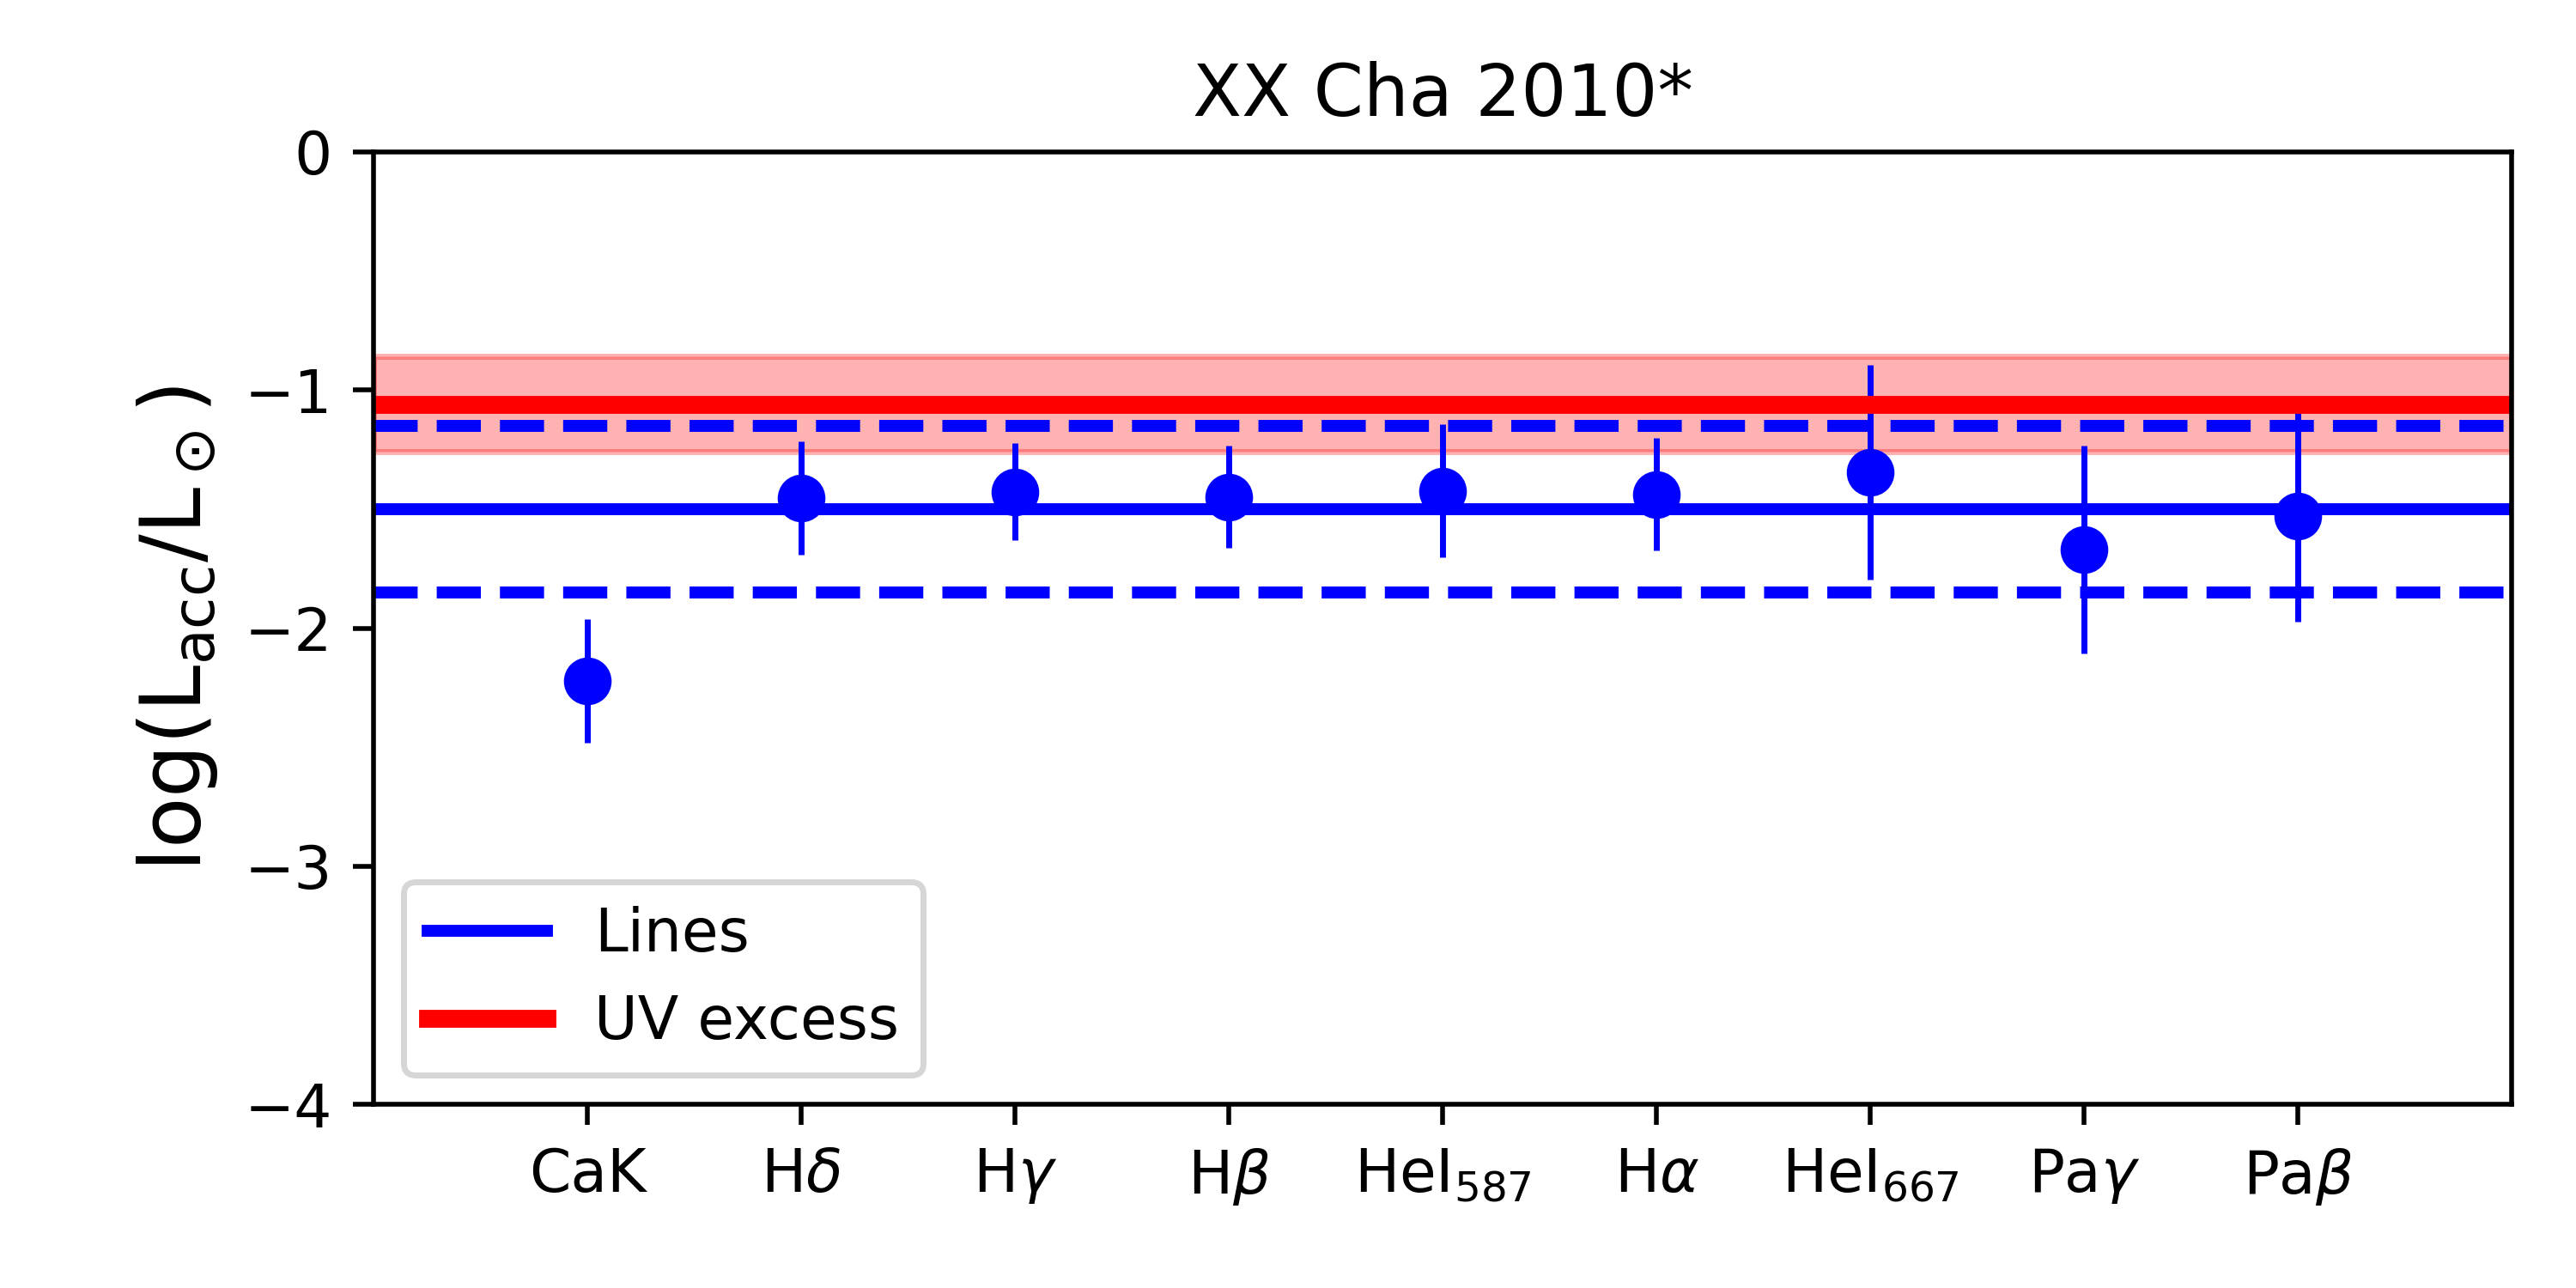
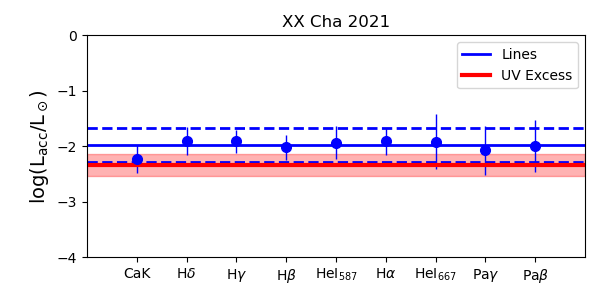
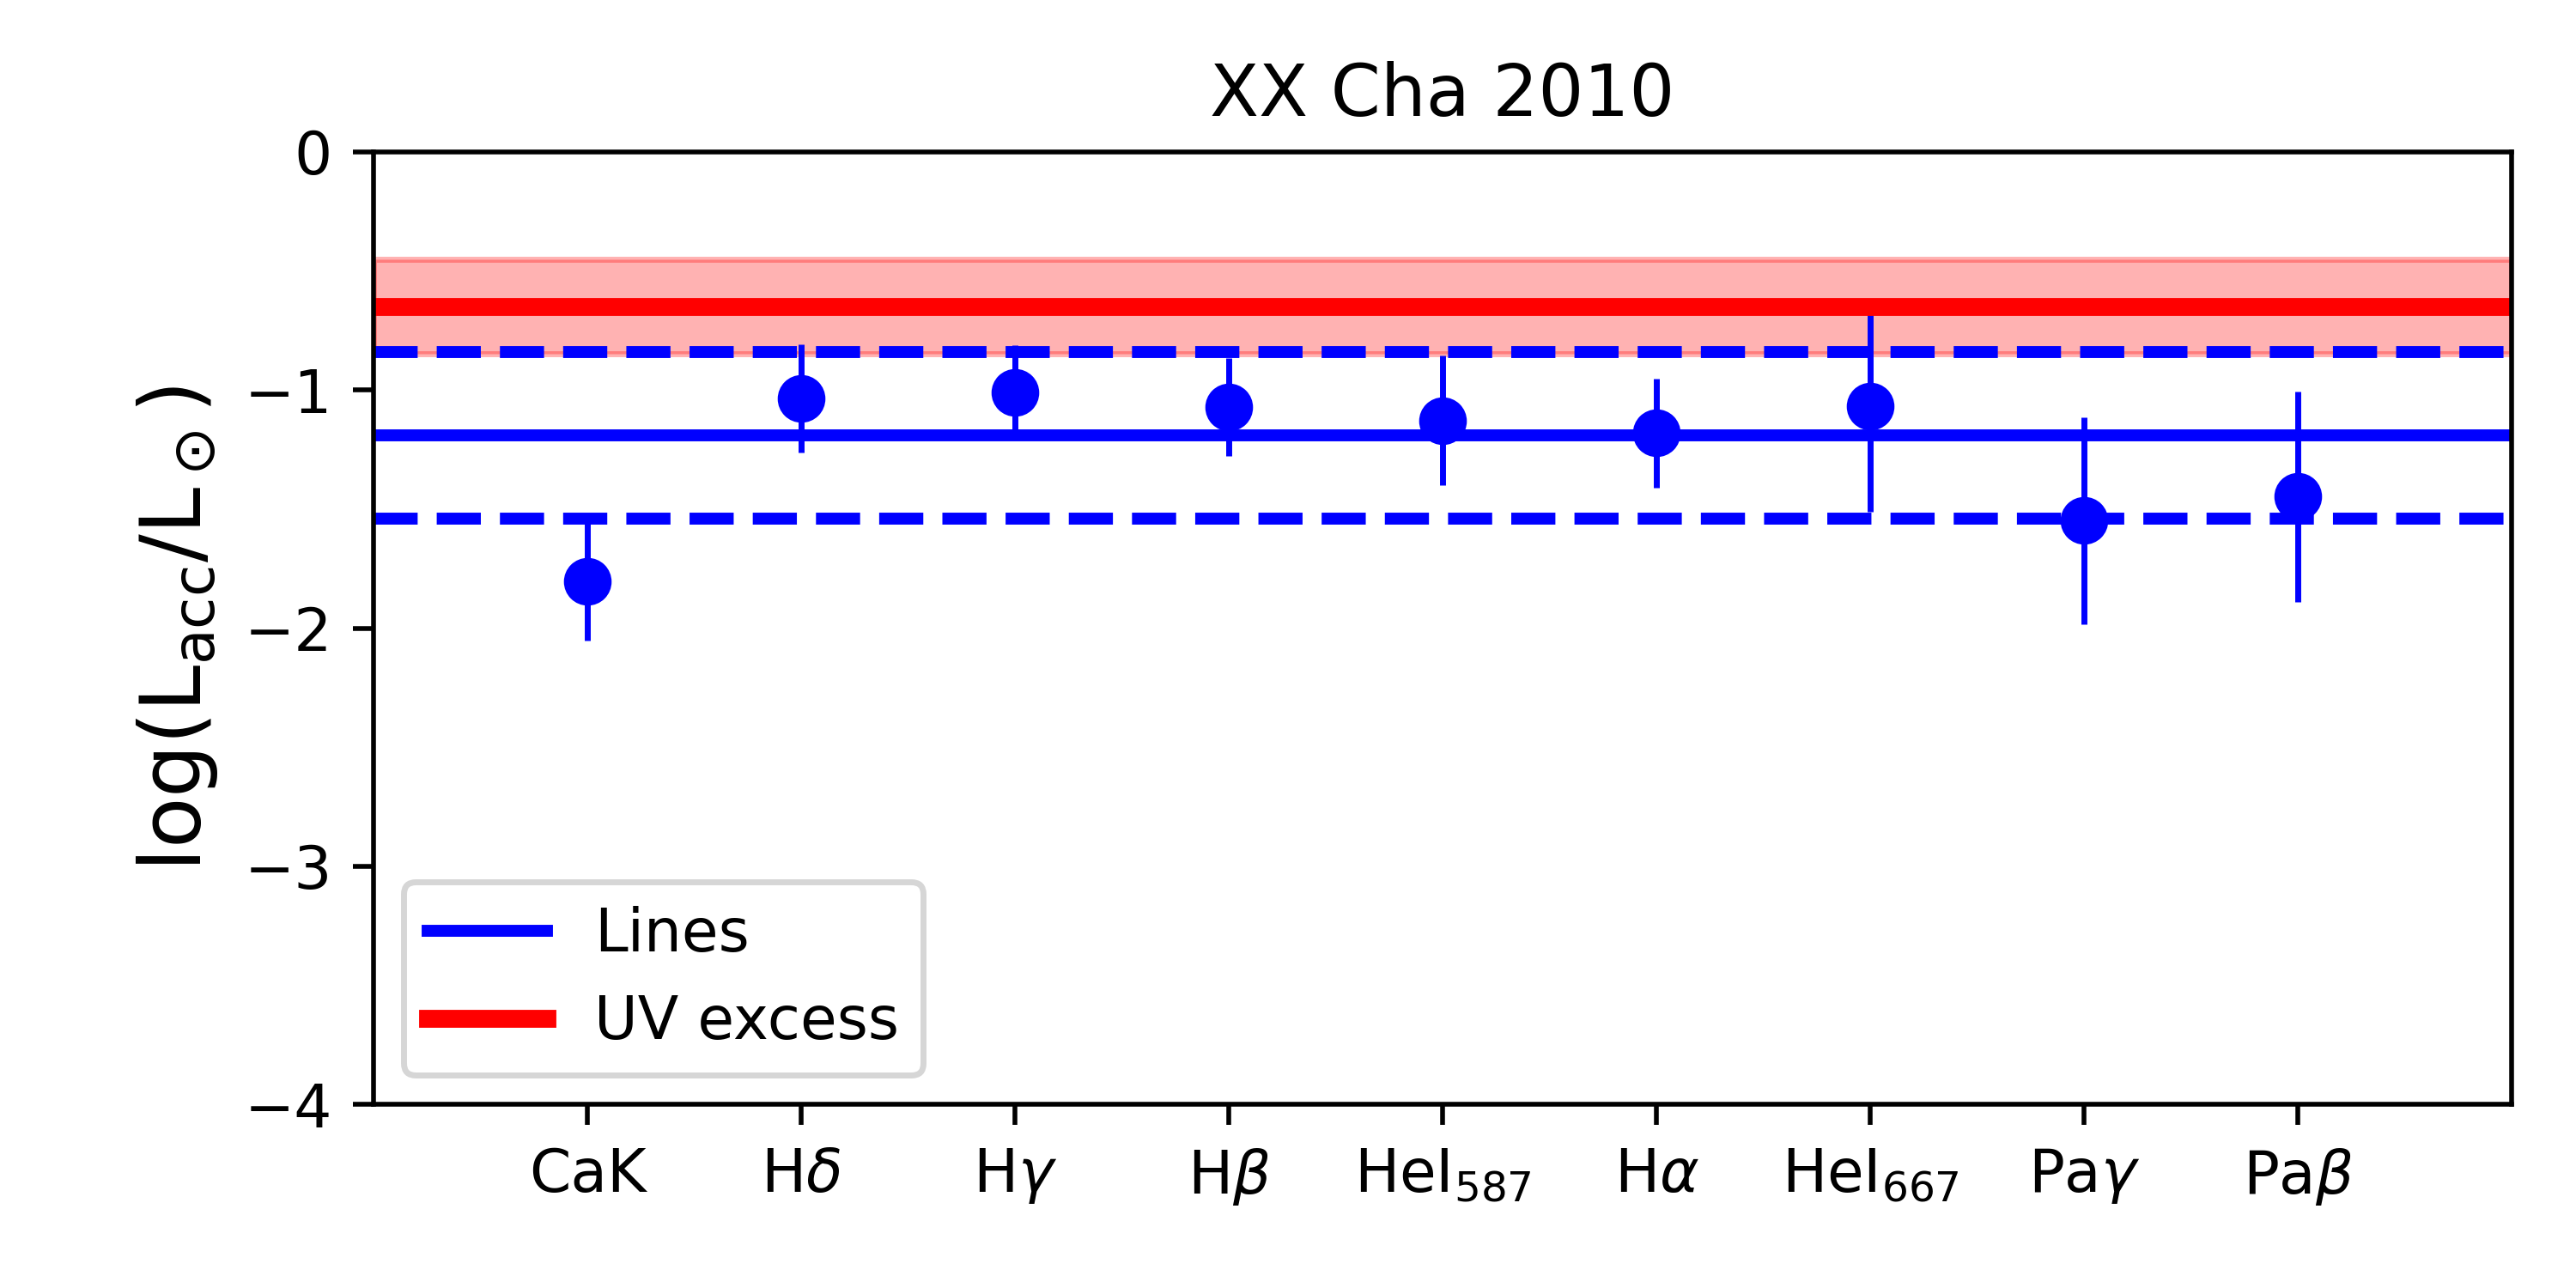
Starting from the relations between the line luminosity () and the accretion luminosity () by Alcalá et al. (2017), we calculated using different emission lines and assuming mag for both observations. The mean values of measured from the line luminosity agree within the uncertainties with the corresponding value from the UV-excess fitting at each epoch (Fig. 12 for 2010*, ; Fig. 13 for 2021, ). On the other hand, the difference between the two values of from the line luminosity is smaller than when computed from the UV excess.
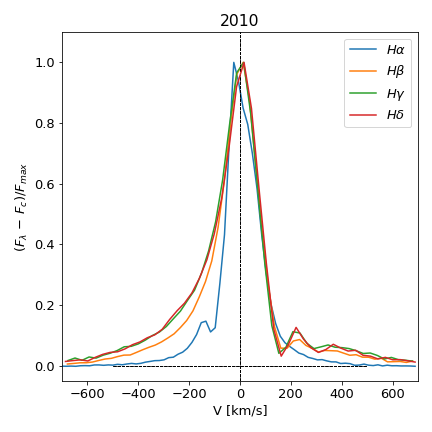
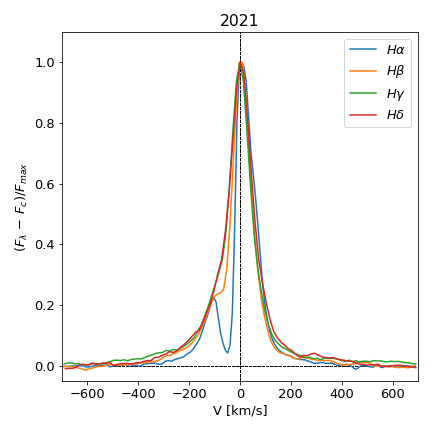
We note that the line profiles are very different between the two epochs (Fig. 16-15). In particular, the 2010 observations show a stronger red-shifted absorption and a wider blueshifted emission in the hydrogen emission lines. Both aspects are in line with the stronger accretion rate measured in 2010.
We also considered additional estimates of from line emission available from an observation of XX Cha in 2009 by Antoniucci et al. (2011). We scaled the luminosity of the H, Pa, and Br lines, accounting for the different distance and extinction adopted here. We find an average accretion luminosity of dex, which is slightly higher but compatible with the one measured in 2010 from the line luminosity. We derived an accretion rate of (/yr) dex, assuming the stellar mass obtained for the 2010* epoch. This value is consistent with the accretion properties found in 2010*.
4 Discussion
4.1 Variability of XX Cha in context
The 1.4 dex variations in accretion rates measured in XX Cha poses the question of whether this target could be part of either the FU Orionis or EXor variable classes (e.g., Fischer et al. 2022). We exclude the former, since FU Orionis stars experience sudden jumps in accretion rate to about /yr (Kóspál 2011) which last for timescale of decades to centuries. Both the value of and the timescales of the photometric evolution (Fig. 4) are very different than typical FU Orionis outbursts. During an outburst, several spectral features in the spectra of FU Orionis stars are the opposite of what we observe in XX Cha, for example in FU Orionis stars the Pa line is observed in absorption and the CaII infrared triplet is not detected (Connelley & Reipurth 2018).
EXor stars, on the other hand, display an increase in of dex, similar to XX Cha. These variations occur in an outburst that typically lasts several months to a year. In EXor-type outbursts, a large number of emission lines can be detected in the near-infrared (e.g., Kóspál et al. 2011). Such lines are not evident in the 2010 spectrum of XX Cha, but Antoniucci et al. (2011) in 2009 observed ro-vibrational CO transitions at nm in emission, which is a typical feature of EXor outbursts (Fischer et al. 2022). As discussed in Sect. 3.3, XX Cha was accreting at a similar , both in our 2010 observations and in 2009. Both the high accretion luminosity and CO emission found by Antoniucci et al. (2011) suggest that XX Cha may have experienced an EXor-type outburst in 2009, with our 2010 observations being taken at a later stage during this outburst. However, the lack of data between the two epochs does not allow us to confirm or exclude this possibility.
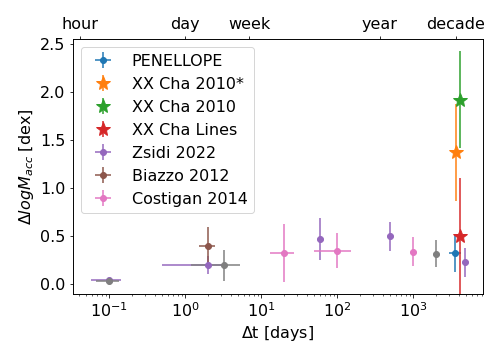
Even if it is unclear whether XX Cha is an EXor variable star, it is instructive to compare its extreme accretion variability to previous samples of CTTS. We show in Fig. 2 the extent of its variability in comparison with literature results (Biazzo et al. 2012; Costigan et al. 2014; Zsidi et al. 2022) and with the preliminary analysis of 11 other targets from the PENELLOPE survey (Manara et al. 2021, Garcia-Lopez et al. in prep.). The data for XX Cha are displayed using the interval between the observations, and both of the values measured from UV excess and line luminosity. Based on our data, we cannot distinguish between a timescale for the observed variability of 11 years or of days, an indication of which could be determined in reviewing the observed light curve in 2021 (Fig. 4). Either way, the accretion variability of XX Cha measured from the UV excess is more extreme than literature results for CTTS, including the similarly analyzed PENELLOPE targets. Among other possible objects showing a potentially similar variability as XX Cha, we can cite V347 Aur, since it has periodic band variations with an amplitude of mag on timescales days. However, other effects, such as a variable extinction, could significantly contribute to the photometric variability.
The accretion variability measured from the line luminosity (0.5 dex) is instead in line with literature results. We strongly advocate that studies of accretion variability should be performed with flux-calibrated broad wavelength range spectra. A possible explanation for the different results obtained from the UV excess and emission lines could be a partial occultation due to an inner disk warp. In this case, similar to AA-Tau (Bouvier et al. 2013; Schneider et al. 2015), the UV radiation from the shock region on the stellar surface is obscured by the disk, whereas the line emission coming from the accretion columns would be less obscured. In turn, this would result in comparatively higher line emission in the epoch with lower UV excess, and vice versa. If such a differential extinction could explain the discrepancy between a line and UV excess, this would affect the measurements of in population studies based on a single value of and on UV-excess measurements. Therefore, when we discuss the impact of this accretion variability on the observed spreads in the next section, the difference measured from the UV excess is the relevant one.
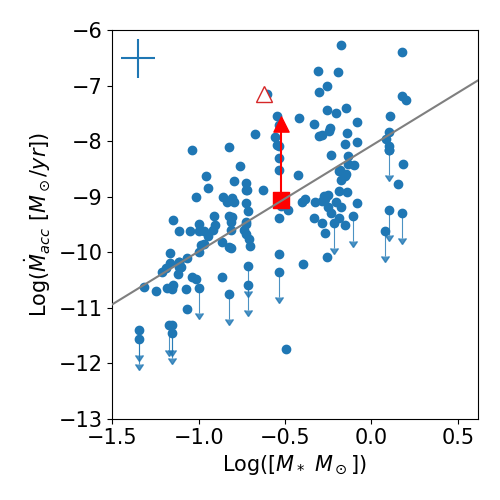
4.2 Impact on accretion rates spread
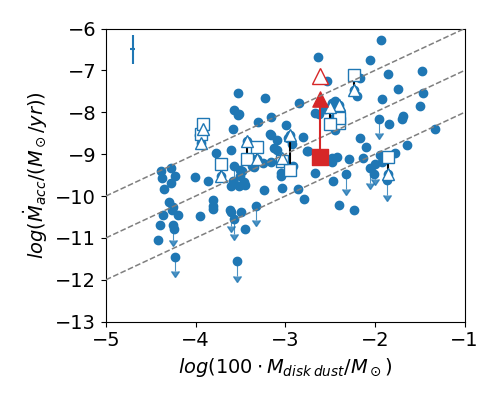
The observed distributions on the - and - planes are a useful test bench of the mechanisms driving protoplanetary disk evolution (Manara et al. 2022). To understand how a significantly variable object such as XX Cha impacts these relations, we plotted in Fig. 3 and Fig. 17 the data taken from Manara et al. (2022) for the Chamaeleon I and Lupus star-forming regions, as well as the two measured values for XX Cha. This target does not appear to be an outlier in the distribution of values in either 2010 or 2021, since its variability is still smaller than the observed spread, and the measured values of are well in line with typical measurements for similarly massive stars or disks. In this specific case, the measured variability therefore has no impact on the observed spread. The effect would be significant if a larger number of targets would undergo similarly significant variability, or even a stronger one.
Based on currently available information, XX Cha seems still to be a rare outlier. Indeed, the preliminary analysis of other PENELLOPE data points to the fact that, even looking at the UV excess, typical variability is 0.5 dex (see both Fig. 2 and 3). Also literature exploration of both short- and long-term variability seems to converge on this result. Venuti et al. (2014, 2015) used photometrically derived UV-excess measurements to determine that, overall, variations on UV excess over timescales of years are statistically consistent with those on timescales lasting for weeks, with a typical variation of 0.4 0.3 dex when considering all CTTS, and 0.60.5 dex when considering only CTTS with variations 1 dex over 2 week timescales. Only about 14% of stars in their sample show additional long-term variations in UV excess beyond 0.5 dex. If these results are confirmed, we can assume that the majority of the spread of accretion rates is intrinsic, and not related to accretion variability.
However, we cannot base our estimates purely on line equivalent width or luminosity estimates since we have shown that these could lead to an underestimation of the extent of the variability. Further monitoring with broad wavelength range spectra is needed to constrain the fraction of sources showing large variability, so as to better constrain the effect of accretion variability on the observed relations, making them a more powerful tool to study protoplanetary disk evolution.
Finally, we note that the large variability in the accretion rate of XX Cha would have an effect on the measured value of =/ anyways. This quantity is used, for example, to discriminate between targets whose evolution is regulated by viscous evolution (e.g., Lodato et al. 2017; Mulders et al. 2017), magnetohydrodynamic wind-driven evolution (e.g., Mulders et al. 2017; Tabone et al. 2022), or even by other internal or external disk evolution processes (e.g., Rosotti et al. 2017). While population studies are unaffected, since the spread is not sensitive to this magnitude of variability, results on individual targets must consider this additional cause of uncertainty due to variability before firmly assessing whether the displacement of a target on the - plane is due to one or another disk evolution mechanism. The interpretation of individual values should be confirmed with multiple epochs of observation, when possible.
5 Conclusions
We report a variability in accretion rates for XX Cha of 1.4 dex between 2010 and 2021, when measured from the UV excess. This change in accretion rate is much larger than the typical accretion variability of 0.5 dex found in other CTTS. However, a smaller 0.5 dex variability is obtained for XX Cha when measured from the luminosity of emission lines. This result highlights the need to monitor accretion using flux-calibrated broad wavelength range spectra. Although large, the measured variability of XX Cha has no impact on the observed spread of in the relations with or . Since the variability of XX Cha seems rare to date, this confirms that the spread of is related to disk evolution. However, we suggest that more extensive exploration of accretion variability on longer timescales than previously probed must be performed, so as to firmly asses its importance.
Acknowledgements.
We thank M. Benisty and J. Bouvier for discussions on this target. R. Claes acknowledges the PhD fellowship of the International Max-Planck-Research School (IMPRS) funded by ESO. This work benefited from discussions with the ODYSSEUS team (HST AR-16129), https://sites.bu.edu/odysseus/. Funded by the European Union under the European Union’s Horizon Europe Research & Innovation Programme 101039452 (WANDA). Views and opinions expressed are however those of the author(s) only and do not necessarily reflect those of the European Union or the European Research Council. Neither the European Union nor the granting authority can be held responsible for them. This project has received funding from the European Union’s Horizon 2020 research and innovation programme under grant agreement No 716155 (SACCRED) and under the Marie Sklodowska-Curie grant agreement No 823823 (DUSTBUSTERS). This work was partly funded by the Deutsche Forschungsgemeinschaft (DFG, German Research Foundation) - 325594231. This research received financial support from the project PRIN-INAF 2019 ”Spectroscopically Tracing the Disk Dispersal Evolution”. R.G.Lopez acknowledges support by Science Foundation Ireland under Grant no. 18/SIRG/5597. J.F.Gameiro was supported by fundacao para a Ciência e Tecnologia (FCT) through the research grants UIDB/04434/2020 and UIDP/04434/2020. G. Rosotti acknowledges support from an STFC Ernest Rutherford Fellowship (grant number ST/T003855/1)References
- Alcalá et al. (2017) Alcalá, J. M., Manara, C. F., Natta, A., et al. 2017, A&A, 600, A20
- Antoniucci et al. (2011) Antoniucci, S., García López, R., Nisini, B., et al. 2011, A&A, 534, A32
- Audard et al. (2014) Audard, M., Ábrahám, P., Dunham, M. M., et al. 2014, in Protostars and Planets VI, ed. H. Beuther, R. S. Klessen, C. P. Dullemond, & T. Henning, 387
- Biazzo et al. (2012) Biazzo, K., Alcalá, J. M., Covino, E., et al. 2012, A&A, 547, A104
- Biazzo et al. (2014) Biazzo, K., Alcalá, J. M., Frasca, A., et al. 2014, A&A, 572, A84
- Bouvier et al. (2013) Bouvier, J., Grankin, K., Ellerbroek, L. E., Bouy, H., & Barrado, D. 2013, A&A, 557, A77
- Calvet & Gullbring (1998) Calvet, N. & Gullbring, E. 1998, ApJ, 509, 802
- Cardelli et al. (1989) Cardelli, J. A., Clayton, G. C., & Mathis, J. S. 1989, ApJ, 345, 245
- Connelley & Reipurth (2018) Connelley, M. S. & Reipurth, B. 2018, ApJ, 861, 145
- Costigan et al. (2012) Costigan, G., Scholz, A., Stelzer, B., et al. 2012, MNRAS, 427, 1344
- Costigan et al. (2014) Costigan, G., Vink, J. S., Scholz, A., Ray, T., & Testi, L. 2014, MNRAS, 440, 3444
- Espaillat et al. (2022) Espaillat, C. C., Herczeg, G. J., Thanathibodee, T., et al. 2022, AJ, 163, 114
- Facchini et al. (2016) Facchini, S., Manara, C. F., Schneider, P. C., et al. 2016, A&A, 596, A38
- Fang et al. (2013) Fang, M., Kim, J. S., van Boekel, R., et al. 2013, ApJS, 207, 5
- Feiden (2016) Feiden, G. A. 2016, A&A, 593, A99
- Fischer et al. (2022) Fischer, W. J., Hillenbrand, L. A., Herczeg, G. J., et al. 2022, arXiv e-prints, arXiv:2203.11257
- Frasca et al. (2017) Frasca, A., Biazzo, K., Alcalá, J. M., et al. 2017, A&A, 602, A33
- Frasca et al. (2015) Frasca, A., Biazzo, K., Lanzafame, A. C., et al. 2015, A&A, 575, A4
- Gaia Collaboration et al. (2021) Gaia Collaboration, Brown, A. G. A., Vallenari, A., et al. 2021, A&A, 649, A1
- Hartmann et al. (2016) Hartmann, L., Herczeg, G., & Calvet, N. 2016, ARA&A, 54, 135
- Herczeg & Hillenbrand (2014) Herczeg, G. J. & Hillenbrand, L. A. 2014, ApJ, 786, 97
- Hillenbrand & Findeisen (2015) Hillenbrand, L. A. & Findeisen, K. P. 2015, ApJ, 808, 68
- Kafka (2020) Kafka, S. 2020, in European Planetary Science Congress, EPSC2020–314
- Kóspál (2011) Kóspál, Á. 2011, A&A, 535, A125
- Kóspál et al. (2012) Kóspál, Á., Ábrahám, P., Acosta-Pulido, J. A., et al. 2012, ApJS, 201, 11
- Kóspál et al. (2011) Kóspál, Á., Ábrahám, P., Goto, M., et al. 2011, ApJ, 736, 72
- Koutoulaki et al. (2019) Koutoulaki, M., Facchini, S., Manara, C. F., et al. 2019, A&A, 625, A49
- Kraus & Hillenbrand (2007) Kraus, A. L. & Hillenbrand, L. A. 2007, ApJ, 662, 413
- Lodato et al. (2017) Lodato, G., Scardoni, C. E., Manara, C. F., & Testi, L. 2017, MNRAS, 472, 4700
- Long et al. (2017) Long, F., Herczeg, G. J., Pascucci, I., et al. 2017, ApJ, 844, 99
- Manara et al. (2022) Manara, C. F., Ansdell, M., Rosotti, G. P., et al. 2022, arXiv e-prints, arXiv:2203.09930
- Manara et al. (2013) Manara, C. F., Beccari, G., Da Rio, N., et al. 2013, A&A, 558, A114
- Manara et al. (2016) Manara, C. F., Fedele, D., Herczeg, G. J., & Teixeira, P. S. 2016, A&A, 585, A136
- Manara et al. (2021) Manara, C. F., Frasca, A., Venuti, L., et al. 2021, A&A, 650, A196
- Manara et al. (2020) Manara, C. F., Natta, A., Rosotti, G. P., et al. 2020, A&A, 639, A58
- Manara et al. (2017) Manara, C. F., Testi, L., Herczeg, G. J., et al. 2017, A&A, 604, A127
- Modigliani et al. (2010) Modigliani, A., Goldoni, P., Royer, F., et al. 2010, in Society of Photo-Optical Instrumentation Engineers (SPIE) Conference Series, Vol. 7737, Observatory Operations: Strategies, Processes, and Systems III, ed. D. R. Silva, A. B. Peck, & B. T. Soifer, 773728
- Mulders et al. (2017) Mulders, G. D., Pascucci, I., Manara, C. F., et al. 2017, ApJ, 847, 31
- Pascucci et al. (2016) Pascucci, I., Testi, L., Herczeg, G. J., et al. 2016, ApJ, 831, 125
- Roman-Duval et al. (2020) Roman-Duval, J., Proffitt, C. R., Taylor, J. M., et al. 2020, Research Notes of the American Astronomical Society, 4, 205
- Rosotti et al. (2017) Rosotti, G. P., Clarke, C. J., Manara, C. F., & Facchini, S. 2017, MNRAS, 468, 1631
- Rugel et al. (2018) Rugel, M., Fedele, D., & Herczeg, G. 2018, A&A, 609, A70
- Schisano et al. (2009) Schisano, E., Covino, E., Alcalá, J. M., et al. 2009, A&A, 501, 1013
- Schneider et al. (2015) Schneider, P. C., France, K., Günther, H. M., et al. 2015, A&A, 584, A51
- Schneider et al. (2018) Schneider, P. C., Manara, C. F., Facchini, S., et al. 2018, A&A, 614, A108
- Smette et al. (2015) Smette, A., Sana, H., Noll, S., et al. 2015, A&A, 576, A77
- Stauffer et al. (2014) Stauffer, J., Cody, A. M., Baglin, A., et al. 2014, AJ, 147, 83
- Tabone et al. (2022) Tabone, B., Rosotti, G. P., Lodato, G., et al. 2022, MNRAS, 512, L74
- Venuti et al. (2014) Venuti, L., Bouvier, J., Flaccomio, E., et al. 2014, A&A, 570, A82
- Venuti et al. (2015) Venuti, L., Bouvier, J., Irwin, J., et al. 2015, A&A, 581, A66
- Vernet et al. (2011) Vernet, J., Dekker, H., D’Odorico, S., et al. 2011, A&A, 536, A105
- Zsidi et al. (2022) Zsidi, G., Manara, C. F., Kóspál, Á., et al. 2022, arXiv e-prints, arXiv:2201.03396
Appendix A Broadband variability
A.1 Photometric variability
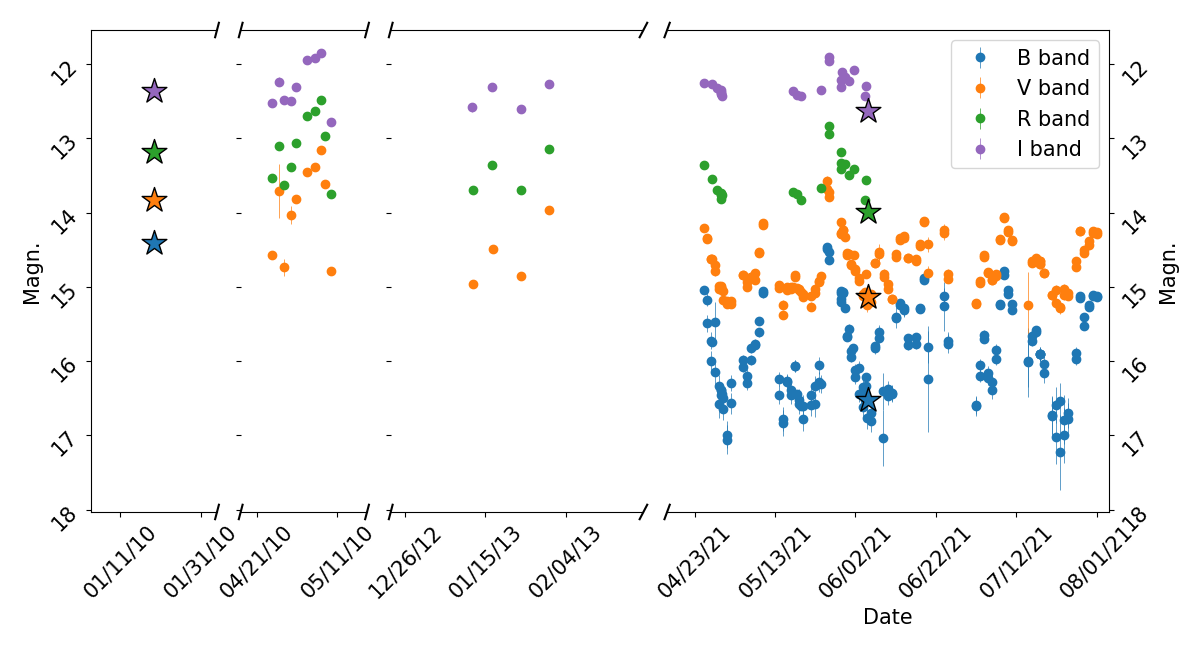
The available photometric data presented in Sect. 2.2 is shown in Fig. 2 as a function of the time of the observations. On the same plot, the synthetic photometry derived from the X-Shooter spectra (see Sect. 3.1 for the procedure and Table 2 for the values) is also included for comparison. The synthetic photometry measured on the 2021 spectrum agrees with the photometry taken close in time. When looking at the light curve around the 2021 observations, the brightness of the target at the time of the 2021 X-Shooter observations is close to the local variability minimum. Indeed, there seems to be a quasi-periodic variability pattern with timescales of 22 days which, however, is only hinted at in the periodogram analysis we carried out, possibly due to the short time coverage with respect to the length of this putative period. The 2010 synthetic data fall on the high side, but within the range of variability for all epochs of observation.
The variability amplitude observed in the photometry is larger for bluer bands. Such a trend is expected in the case of a variable accretion rate or reddening. To further explore this effect, we show in Fig. 5 the versus and in Fig. 6 the versus color-magnitude diagram (CMD), respectively, and a reddening vector with =3.1. The reddening vector is well aligned with the AAVSO data in the CMD, and less so in the one. In either case, the reddening vector cannot reproduce the variability between the 2010 and 2021 spectra analyzed here. The variability, or at least a part of it, must be ascribed to accretion variability.
| Band | 2010 | 2021 |
|---|---|---|
| 14.40 | 16.52 | |
| 13.82 | 15.13 | |
| 13.19 | 13.99 | |
| 12.36 | 12.64 |
A.2 Continuum variability
We computed the flux ratio between the 2010 and 2021 spectra as using the median flux in an interval of 4 nm around a number of wavelengths in the spectra, chosen to sample the continuum in the spectra and avoiding emission lines. The errors were then computed from the standard deviation of the ratios within these intervals. Fig. 7 displays the measured flux ratio of the two spectra along with the ratio expected from a difference in extinction () following the Cardelli et al. (1989) reddening law.
The measured flux ratio between the spectra is steeper than any reasonable extinction difference and reddening law. This confirms that the difference in both spectra cannot be attributed to a variation in extinction between the two epochs, as described in Sect. A.1.
Appendix B Additional analysis of the spectra
B.1 Variations in the lithium absorption
The lithium absorption line at 670.78 nm is one of the strongest absorption lines in low-mass CTTS. The depth of this line solely depends on the stellar temperature and on the age of the target. For this reason, this is a key feature to constrain whether the variations seen in the spectra are due to accretion, which would result in a higher veiling of this line, or extinction, which would leave the line depth unaffected.
We decided to compare the depth of this line, not only between the 2010 and 2021 epochs of the X-Shooter observations, but to also include the spectra of XX Cha taken with the UVES instrument on the VLT within 2 days from the 2021 observations with X-Shooter. The UVES data were reduced with the ESO Reflex pipeline as described in Manara et al. (2021).
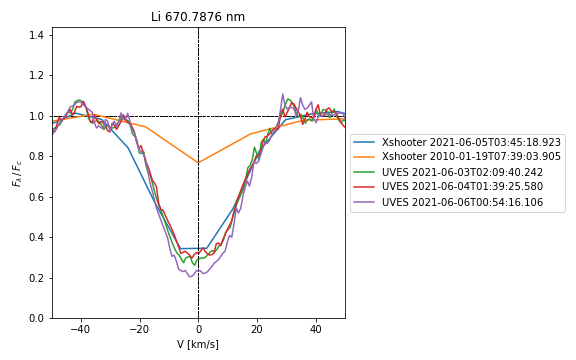
The continuum normalized lithium absorption line is shown in Fig. 8. The four spectra obtained in 2021 all show very similar depths, with differences mainly being due to the lower resolution of the X-Shooter observations with respect to the UVES ones. On the other hand, the spectrum obtained in 2010 shows a significantly shallower depth in this line, which is a clear signature of an increased veiling in this epoch. This should thus be ascribed to a stronger accretion rate in 2010.
B.2 Fitting of the X-Shooter spectra
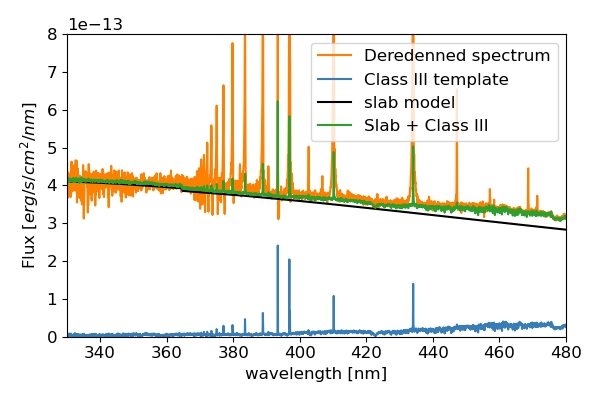
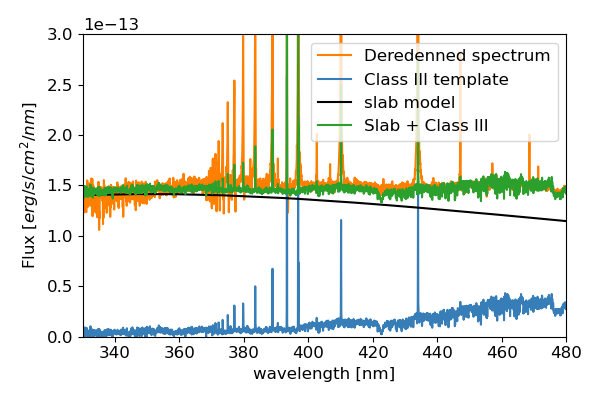
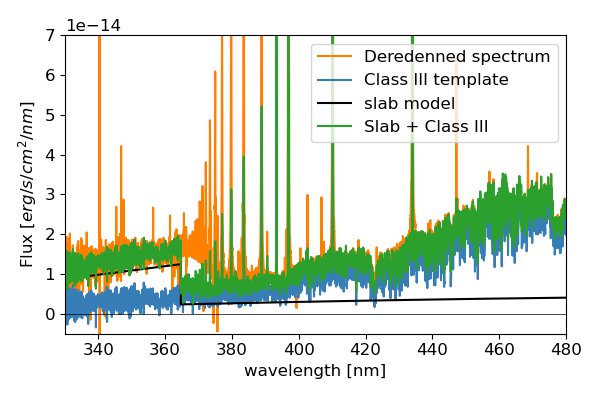
To derive the stellar and accretion properties, we used the method by Manara et al. (2013). This method consists of fitting three components to the observed spectra: a Class III template to reproduce the stellar photosphere, a slab model for the continuum excess emission due to accretion, and the reddening law by Cardelli et al. (1989) to account for interstellar extinction. The slab model and Class III template were scaled to match the observed flux at and at nm. A function was computed for a grid of parameters considering different extinction values, slab model parameters and normalization, and Class III templates and their normalizations. This was computed in some key spectral features, such as the Balmer jump, Balmer continuum, Paschen continuum, and a number of molecular bands that are indicative of the spectral type of the target.
Figures 9, 10 and 11 display the best-fit components around the Balmer jump. Comparing both figures highlights the significant differences in the accretion spectrum between the epochs.
B.3 Accretion luminosity from emission lines
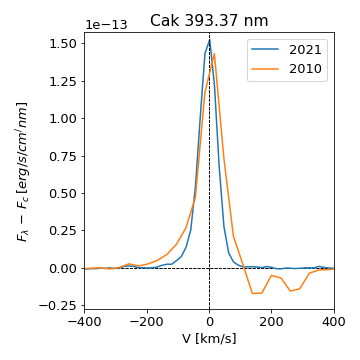
The accretion luminosities obtained from individual lines (see Sect. 3.3) in both epochs are listed in table 3. These values are also plotted in Figs. 12 and 13, where they are compared to the results obtained from the UV excess in the corresponding epochs. The lines are ordered with increasing wavelengths, allowing one to discern possible trends with wavelength, which would indicate a wrong correction for extinction. Such a trend is not observed when using the value mag for the 2010 epoch, whereas a slight dependence with wavelength is present at higher values of mag (see Fig. 12). The accretion luminosity obtained from the CaK line is lower than that found from the other lines in both epochs. This difference is more pronounced in 2010. The accretion luminosity derived from this line is even lower in 2010 than in 2021. In Fig. 15 we show the profile of this line in the two X-Shooter observations, and we observe an inverse P-Cygni profile in the 2010 observation, with an otherwise similar profile and intensity. The additional absorption seen here is a likely cause for the low accretion luminosity obtained. However, the Pa, Pa, and HeI line at 667.82 nm also display a similar absorption feature in 2010, but the derived are larger than in 2021.
The H, H, and H lines profiles also change between both epochs. In 2021 they appear almost symmetrical, whereas in 2010 they are more extended on the blueshifted side. This is illustrated in figure 16, and further discussed in Sect. 3.3.
| Epoch of observation | 2010* | 2021 |
|---|---|---|
| H | -1.43 | -1.91 |
| H | -1.45 | -2.02 |
| H | -1.43 | -1.91 |
| H | -1.45 | -1.90 |
| CaK | -2.22 | -2.23 |
| HeI587 | -1.42 | -1.93 |
| HeI667 | -1.34 | -1.91 |
| Pa | -1.52 | -2.00 |
| Pa | -1.66 | -2.07 |
| mean | ||
| (/(/yr)) |
Appendix C -relation
Figure 17 displays the measured and for the targets in the Lupus and Chamaeleon I star-forming regions observed with X-Shooter. The data are taken from Manara et al. (2022), as in Fig. 3. XX Cha, reported with red symbols, is observed to be within the observed scatter in both epochs.