.tiffpng.pngconvert #1 \OutputFile \AppendGraphicsExtensions.tiff
Unsupervised machine learning framework for discriminating major variants of concern during COVID-19
Rohitash Chandra1*, Chaarvi Bansal1,3, Mingyue Kang1, Tom Blau4*, Vinti Agarwal3, Pranjal Singh5, Laurence O. W. Wilson2, Seshadri Vasan6
1 Transitional Artificial Intelligence Research Group, School of Mathematics and Statistics, UNSW Sydney, Sydney, Australia
2 Australian e-Health Research Centre, Commonwealth Scientific and Industrial Research Organisation, North Ryde, Australia
3 Department of Computer Science and Information Systems, Birla Institute of Technology and Science Pilani, Rajasthan, India
4 Data 61, CSIRO, Sydney, Australia
5 Department of Computer Science and Engineering, Indian Institute of Technology Guwathi, Assam, India
6 Department of Health Sciences, University of York, York, United Kingdom
* rohitash.chandra@unsw.edu.au
* tom.blau@data61.csiro.au
Abstract
Due to the high mutation rate of the virus, the COVID-19 pandemic evolved rapidly. Certain variants of the virus, such as Delta and Omicron, emerged with altered viral properties leading to severe transmission and death rates. These variants burdened the medical systems worldwide with a major impact to travel, productivity, and the world economy. Unsupervised machine learning methods have the ability to compress, characterize, and visualize unlabelled data. This paper presents a framework that utilizes unsupervised machine learning methods to discriminate and visualize the associations between major COVID-19 variants based on their genome sequences. These methods comprise a combination of selected dimensionality reduction and clustering techniques. The framework processes the RNA sequences by performing a -mer analysis on the data and further visualises and compares the results using selected dimensionality reduction methods that include principal component analysis (PCA), t-distributed stochastic neighbour embedding (t-SNE), and uniform manifold approximation projection (UMAP). Our framework also employs agglomerative hierarchical clustering to visualize the mutational differences among major variants of concern and country-wise mutational differences for selected variants (Delta and Omicron) using dendrograms. We also provide country-wise mutational differences for selected variants via dendrograms. We find that the proposed framework can effectively distinguish between the major variants and has the potential to identify emerging variants in the future.
Introduction
Coronaviruses (CoVs) consist of enclosed, positive-sense, single-stranded, and diversified Ribonucleic acid (RNA) viruses [1]. CoVs comprise major variants that occur through mutations, also known as genera, including delta, gamma, beta and alpha [2, 3]. Currently, there are three reported highly deadly coronaviruses, MERS-CoV, SARS-CoV-2 and SARS-CoV, due to their lethal effects on humans [4, 5]. In contrast to other CoVs, these three are more likely to cause acute lung injury, multiple organ failure and even death [6]. Even though human coronaviruses (hCoVs) [7, 8] primarily lead to asymptomatic or mild infections, they cause around 15 to 30% of common colds [9]. In 2020 the world began to witness the pandemic caused by SARS-CoV-2 which led the detrimental repercussions to the world economy [10, 11].
MERS-CoV surfaced ten years after SARS-CoV was initially reported in April 2012 in Jordan which accounted for the continuous outbreaks in the Middle East region [12]. After the plague caused by MERS-CoV, SARS-CoV-2 also known as COVID-19 was first reported in Wuhan, China in December 2019. This escalated across other cities in China and threatened the health of people worldwide. On 30th January 2020, COVID-19 was declared a global concern and subsequently declared a global pandemic [13]. Notably, the SARS-CoV-2 caused mutations in humans which led to further worldwide outbreaks [14]. Although some vaccines such as Oxford-AstraZeneca and Pfizer-BioNTech have been reported to limit transmission and hospitalization rate [15, 16]. SARS-CoV-2 presently does not have fully effective vaccines. It is imperative to efficaciously trace the virus by performing polymerase chain reaction (PCR) [17] tests to sequence the strand in suspected patients. PCR tests with timely reporting can examine patterns in mutation and forecast transmission routes; however, there have been a number of challenges since the efficacy of the tests has also been questioned [18, 19]. Hence, there is a dire need to acquire more knowledge of these two deadly hCoVs, and combat outbreaks given emerging variants [20].
Traditionally, principal component analysis (PCA) [21] has been used extensively in biology to examine genome and protein sequences to reduce the dimensions of complex datasets such as deoxyribonucleic acid (DNA) and ribonucleic acid (RNA) sequences [22, 23]. A high dimensional dataset is projected using PCA into an eigenspace that constitutes the direction of the largest variation illustrated by principal components. There are various drawbacks when using PCA, including the existence of abnormality that can lead to a recalculation of the PCA and result in unnecessary information disclosure [24]. Other than PCA, t-distributed stochastic neighbour embedding (t-SNE) [25] is widely used in the field of bioinformatics [26]. t-SNE is capable of displaying local structure by reducing the dimensions of data; however, inaccurate representation of the global structure in the data has been reported in some studies [27]. In order to mitigate these problems, other approaches such as uniform manifold approximation projection (UMAP)[28] have been used which outperformed PCA and t-SNE for transcriptomic datasets [29]. We note that a similar study was done during the beginning of the COVID-19 pandemic [30]; however, only the early form of the variants, without a comprehensive evaluation of the different dimensionality reduction and clustering methods which is a major contribution of this study.
-mer analysis is typically used within the context of computational genomics and sequence analysis [31, 32]. It has also been used in the analysis of COVID-19 sequences [33]. -mers are sub-strings of length contained within a larger biological sequence, where the -mers consist of nucleotides [34] (i.e. A, T, G, and C). It is important to use the right value of , taking into account that larger values of increase the sequence processing time exponentially.
In this paper, we present an unsupervised machine learning framework that utilizes -mer analysis for feature extraction from the selected genome (SARS-CoV-2) isolates and compares different dimensionality reduction methods that include PCA, t-SNE, and UMAP to visualise major variants. Furthermore, the framework employs selected clustering methods and provides a visualisation using a dendrogram plot. First, we investigate an optimal value of for -mer analysis and then evaluate the selected dimensionality reduction methods. After this, we apply agglomerative hierarchical clustering and visualise mutational differences between variations of concern and country-wise mutational differences for selected variants via dendrograms. Our study deals with the RNA sequences of coronavirus, and hence we use -mer analysis before applying selected dimensionality reduction and clustering methods. We also provide an open-source code framework developed in Python to further extend the study to emerging variants. We investigate the effect of the prominent dimensional reduction methods since they have certain strengths and limitations which have mostly been shown for tabular data. Hence, our major contribution is in evaluating the dimensional reduction methods with a study of visualisation produced by them for genome analysis.
We organise the remaining sections of this paper as follows. Section 2 provides an overview of the framework via unsupervised machine learning for distinguishing major variants. Section 3 presents the results, and Section 4 discusses the results. Lastly, Section 5 provides a conclusion of the study.
Materials and methods
Data
Nowadays, the global initiative on sharing Avian influenza data (GISAID) [35] is recognized as a reliable portal for prompt sharing of COVID-19 data [36]. Currently, GISAID is the largest publicly accessible platform, consisting of sequences and associated epidemiological data of over 12.1 million SARS-CoV-2 strains (https://www.gisaid.org/hcov19-variants/). Due to the tremendous effort by scientists, new SARS-CoV-2 variants of concern have been included in GISAD, such as B.1.1.7 (Alpha; first detected in the United Kingdom), B.1.617.2 (Delta; first detected in India) and B.1.1.529 (Omicron; first detected in South Africa) [37, 38]. GISAID provides prompt updates to formulate crucial public health policies to control COVID-19 situations globally.
We extracted 250 randomly selected SARS-CoV-2 isolates of complete genome sequences of human origins from GISAID on 12th September 2022. The five variants (Alpha, Beta, Gamma, Delta, and Omicron) featured 50 genome sequences each. Table 1 presents the meta-information from the top 10 countries based on the number of genome isolates for the selected variants across the globe.
| Country | Number of Occurrences | Number of Variants |
|---|---|---|
| United States | Alpha(18), Beta(5), Delta | |
| (5),Gamma(8), Omicron(5) | 5 | |
| India | Alpha(10), Beta(3), Gamma | |
| (3), Delta(11), Omicron(10) | 5 | |
| Brazil | Alpha(5), Beta(3), Gamma | |
| (4), Delta(5), Omicron(3) | 5 | |
| Italy | Beta(5), Omicron(4) | |
| Gamma(5) | 3 | |
| Japan | Alpha(7), Gamma(5) | |
| Delta(1) | 3 | |
| South Africa | Alpha(2), Beta(2), Delta | |
| (3), Gamma(3), Omicron(4) | 5 | |
| Poland | Delta(5), Omicron(5) | 2 |
| Canada | Alpha(2), Beta(5) | |
| Gamma(2) | 3 | |
| Spain | Beta(5), Gamma(3) | 2 |
| England | Omicron(7) | 1 |
In addition, we extracted 250 further genome sequences each for Delta and Omicron on 16th September 2022 from GISAID to visualize the country-wise mutational differences with meta-information in Table 2 and Table 3.
| Country | Number of Occurrences |
|---|---|
| France | 42 |
| South Africa | 41 |
| USA | 25 |
| India | 25 |
| Brunei | 23 |
| England | 23 |
| Spain | 20 |
| Denmark | 18 |
| Peru | 15 |
| Canada | 15 |
| Country | Number of Occurrences |
|---|---|
| India | 83 |
| USA | 47 |
| France | 32 |
| Denmark | 30 |
| Germany | 26 |
| Brazil | 18 |
| Indonesia | 16 |
| Italy | 15 |
| Mongolia | 10 |
| Sudan | 6 |
k-mer Analysis
Data pre-processing methods such as -mer analysis have been prominent in the analysis of genome (DNA) sequences. -mers are substrings of genome sequences of length and analysis is done to calculate the frequency of the substrings. A -mer refers to all of a sequence’s substring of length ; for instance, the sequence “ATGG” would have four monomers (A, T, G, and G), three 2-mers (AT, TG, GG), two 3-mers (ATG and TGG), and one 4-mer (ATGG). Effective -mer analysis can reduce computational time for sequence processing and provide better data storage for further analysis with statistical methods [39]. -mer analysis is extensively used in numerous bioinformatics problems, including computational genomics and sequence analysis [40] and has also been applied for COVID-19. The major challenge of -mer analysis is in determining the value of “k” which needs to be determined experimentally for different problems. A number of packages in languages such as R and Python exist for -mer analysis [41, 42]. Typically, -mers consisting of ambiguous bases i.e. bases not identified during sequencing, such as ‘N’ which represents any possible nucleotide, are deleted. After -mer analysis, the distance between a pair or a group of sequences can be visualized using unsupervised machine learning methods.
DNA is represented with bases paired on the opposite strands (double-stranded) [43] and typically sequenced on either of the two strands. We need to consider every location of the genome once, no matter which has been considered. For instance, our analysis for sequence “ATCGAC” would consider its reverse complement “GTCGAT”. In canonical -mer count, the -mers that are reverse complements of themselves are counted twice. Typically, -mer counting tools [44, 41, 42] either count in canonical -mers or have the option to switch between canonical and non-canonical [31]. We note that there are three types of -mer count, which include total, unique, and distinct -mers. Hence, distinct -mers would be counted only once, while unique -mers are those that appear only once. Therefore, the sequence “ATCGATCAC” in non-canonical form, would have 7 total 3-mers, 6 unique 3-mers, and 5 distinct 3-mers, respectively. We used the kmer package [45] in R with default values that used total count in con-canonical form.
Dimensionality Reduction
PCA
PCA is a dimensionality reduction method extensively used in various forms of data reduction, data analysis, and data visualization with applications in computer graphics [46], machine learning [47], and bioinformatics [22, 23]. The aim of PCA is to calculate the most relevant linear basis to represent a complex data set. Thus, PCA is a linear combination of the basis vectors which reduces the dimensions while retaining the most crucial information. Another assumption of PCA is that the principal components are orthogonal. This assumption is essential as it serves as an intuitive simplification which means PCA can function with linear algebra decomposition approaches. In the field of medicine, PCA is used to solve various problems, including multicollinearity clinical studies [48]. PCA has been used to detect phenotypes in order to forecast the severity of COVID-19 and implement an individual treatment [49]. Similarly, PCA has been utilized to automatically classify five types of electrocardiogram (ECG) to detect aberrant cardiac electrical activity [50]. However, limitations of PCA exist in sparse datasets, datasets with uncorrelated features, and datasets with outliers [51].
t-SNE
t-SNE is a nonlinear dimensionality reduction method that is also used for the visualization of high-dimensional data into a low-dimensional space of two or three dimensions. t-SNE is an extension of stochastic neighbour embedding(SNE) [52] with two key modifications that include a student t-distribution rather than a Gaussian and a symmetrical form of the SNE cost function with basic gradients. t-SNE has been widely used in the domain of medicine, and bioinformatics [53] e.g. in molecular dynamics simulations of macromolecules for visualization [54], and motor behaviour in Parkinson’s disease [55]. However, a major limitation of t-SNE is the visualization of the entire structure of the data and the lack of information, such as explained variance ratio that is given by PCA. Since the dimensionality reduction in t-SNE is based on local properties of the data, it could face challenges in high dimensional structure. Hence, it is important to evaluate its performance for different applications. Therefore, in this study, we compare t-SNE with other dimensionality reduction methods.
UMAP
UMAP is a manifold learning approach for dimensionality reduction which employs a conceptual structure according to the Riemannian geometry and algebraic topology [28]. UMAP has been shown to perform comparably to t-SNE in terms of visualization quality [56] and potentially retains better global structure with less computation time. Additionally, UMAP does not have computational restrictions on the dimension of embedding, making it practical as a dimension reduction approach for various problems. UMAP can be expressed in the form of weighted graphs, which places UMAP in the category of k-neighbour-based graph learning models such as Isomap [57] and t-SNE. Together with various k-neighbour graph-based models, UMAP can be expressed in two parts. In the first part, a specific weighted k-neighbour graph is generated, and in the second part, a low-dimensional outline of this graph is calculated. UMAP has been successful in bioinformatics problems such as dimensionality reduction and visualization of single-cell data [58] and transcriptomics data [59].
Agglomerative clustering
Hierarchical agglomerative clustering [60], also known as agglomerative nesting (AGNES) provides a better approach by addressing the problem of -means clustering, where needs to be manually tuned. In an agglomerative clustering model, the clustering initiates with individual collections of every data point [61]. AGNES has been extensively used in various medical domains [62, 63], such as categorizing patients with severe aortic stenosis [64], and mapping molecular substructures [65]. However, AGNES has been ineffective in some problems since finding the nearest pair of clusters can be challenging when data is sparse and noisy [66].
AGNES produces a dendrogram that visualizes the hierarchical relationship amongst the clusters. A dendrogram consists of a tree-like structure for interpretive machine learning which provides a visualisation of how the data instances are allocated to the respective clusters. Phylogenetic associations interpreted from genome sequences are conventionally presented as trees, which can also be represented using dendrograms [67].
Framework
Figure 1 presents the framework for discriminating and visualizing major COVID-19 variants based on genome (RNA) data of the virus. In the first step, we extract data from the GISAID database where we take random samples of selected variants to demonstrate the effectiveness of the framework.
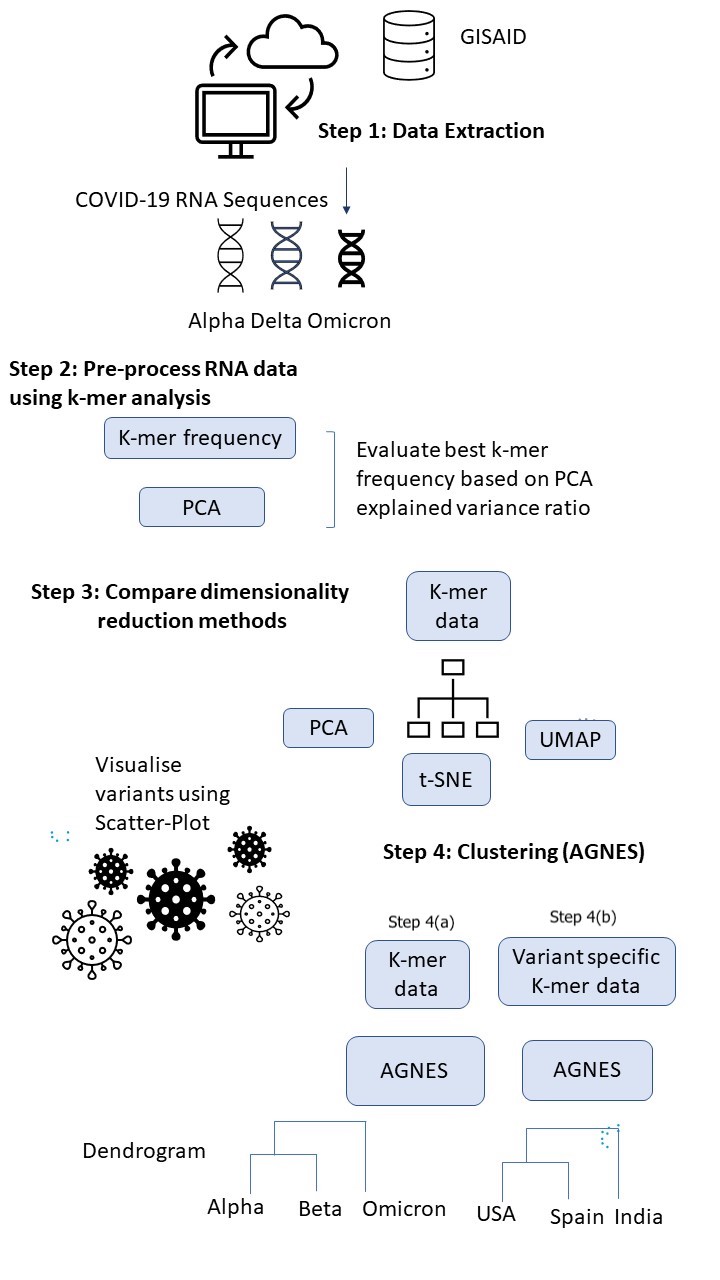
In the second step, we break down the genomes into -mers with selected values of and evaluate the most appropriate for effective visualization via PCA in the next step. We remove any ambiguous base in the genome accordingly using the package employed by the framework [45]. We select the best value of in -mer analysis based on the explained variance ratio of the first two principal components of the reduced dataset. We choose the that provides the highest value of the combined explained variance ratio. The framework also reports a scree-plot to show the explained variance ratio so that the number of principal components in PCA adequately represents the original data that can be selected.
Subsequently, in step three, we compare the selected dimensionality reduction approaches that include PCA, t-SNE, and UMAP. Note that our framework is general and other dimensional reduction approaches such as Isomap and linear discriminant analysis (LDA) can also be utilized. In this step, we compare the visualization produced by the first two components of the respective approaches for the selected COVID-19 variants.
In Step 4(a), we take the data after -mer analysis and apply clustering via AGNES. We first visualize the mutational differences among the five variants (Alpha, Beta, Gamma, Delta, and Omicron), and then visualize the country-wise differences between the genome sequences of Delta and Omicron.
Finally, in Step 4(b), we investigate how the variants compare with others based on their country. The major motivation of this investigation is to track future variants as they are moving from country to country at different times.
Implementation
In our proposed framework, we implement -mer analysis using the k-mer [45] R package and the scikit-learn Python package [68] for implementing the dimensional reduction methods (PCA, UMAP, t-SNE). We also use the same package to implement the clustering approach and provide visualizations using standard R libraries (ggplots). Our framework is available via the GitHub repository which is included in the data section of this paper. In our experiments, we use the Macintosh Operating System with an Apple M1 chip featuring 8‑core GPU (graphics processing units) and 8‑core CPU (central processing units). Note that our framework excludes GPU and utilizes CPU computational power only.
Results
k-mer and PCA analysis
We first investigate the optimal value of for -mer analysis of the selected genomes via explained variance ratio of PCA (Step 3 of framework given in Figure 1). In this way, we understand the best value obtained by different -mer analyses, where . We use the dataset of 250 randomly selected coronavirus sequences (Table 1) for the five variants.
Figure 2 presents the scree-plot of the proportion of variance explained by the different number of principal components (PCs) obtained via PCA for different values of in -mer analysis. We observe that the total explained variance decreases as the value of increases; hence, the best value is given by .
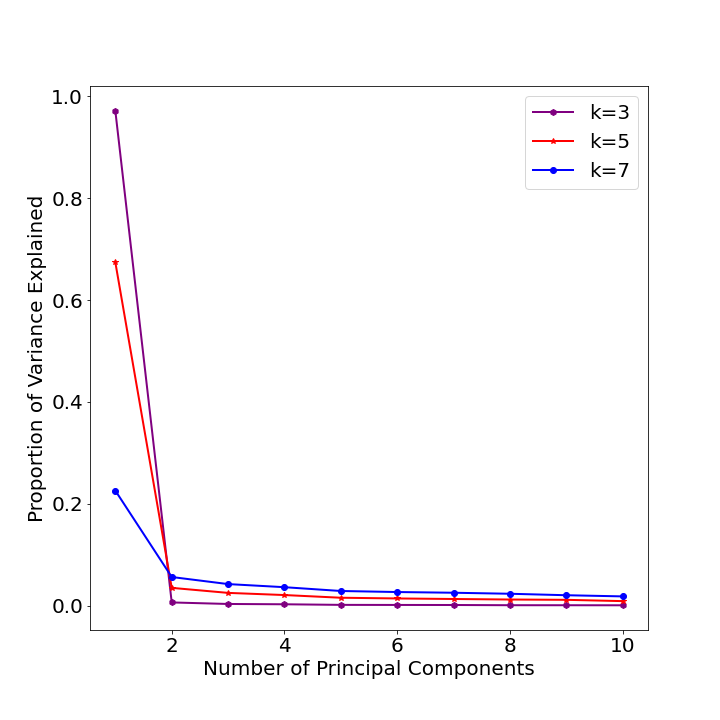
Table 4 shows the top 5 principal components (PC) variance ratio for 3 selected values. Note that shows the highest total variance ratio; hence, this is selected for future analysis. The proportion of explained variance by the first component is for with a total of around ; however, for , the explained variance falls drastically to a total of around . Similarly, when , the proportion of explained variance decreases further to around 18%. This means that the -mer analysis with increasing values of has an inverse relationship with the explained variance ratio.
| PC1 | PC2 | PC3 | PC4 | PC5 | Total | |
|---|---|---|---|---|---|---|
| k = 3 | 0.5330 | 0.0774 | 0.0569 | 0.0519 | 0.0352 | 0.7544 |
| k = 5 | 0.1690 | 0.0881 | 0.0670 | 0.0617 | 0.0538 | 0.4396 |
| k = 7 | 0.06498 | 0.03754 | 0.0298 | 0.0258 | 0.0233 | 0.1814 |
Visualisation using dimensionality reduction methods
In the previous section, we ran PCA-based dimensionality reduction to evaluate the value of in -mer analysis based on explained variance ratio. Dimensionality reduction methods such as PCA can be used to visualize data via scatter plots of the first two principal components. In this way, we have a better picture of the data, giving more insight than explained variance ratio. Next, we take the same dataset, i.e., SARS-CoV-2 genome isolates from 5 distinct clusters (Table 1), and run PCA and two other dimensional reduction methods (t-SNE and UMAP), as outlined in our framework shown in Figure 1. We visualize the different dimensionality reduction methods by varying the value of and present a two-dimensional scatter plot of the first two components. Unlike PCA, t-SNE and UMAP do not provide explained variance ratio, so it is unclear what percentage of data is represented by the first two components; however, we can visually evaluate them based on the scatter plot.
Figures 3, 4 and 5 present the visualization with PCA, UMAP, and t-SNE for selected values from -mer analysis. Figure 3 - Panel (a) shows that Omicron and Gamma variants are close and overlap each other. This is different when compared with Figure 4 - Panel (a) which also shows that Omicron is isolated. Figure 5 - Panel (a) shows that Omicron overlaps the Gamma variant. We note that with , only 26 % of the data is represented by the first two components (Table 4), and only 10 % of data is represented by the first two components of . Hence, we can say that is the most reliable since it represents 61 % of the data by the first two components. Although PCA shows a greater variance ratio for ; visually, it is poor in discriminating variants when compared to and .
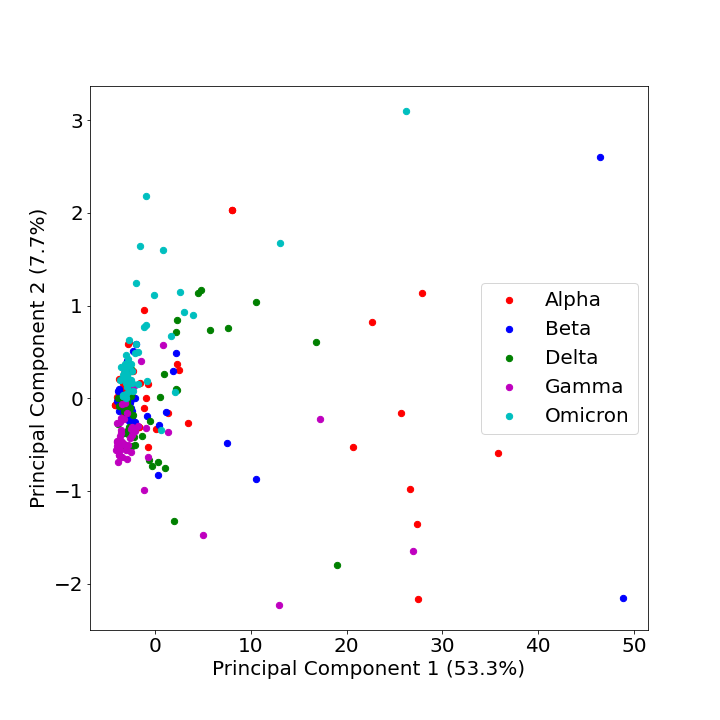
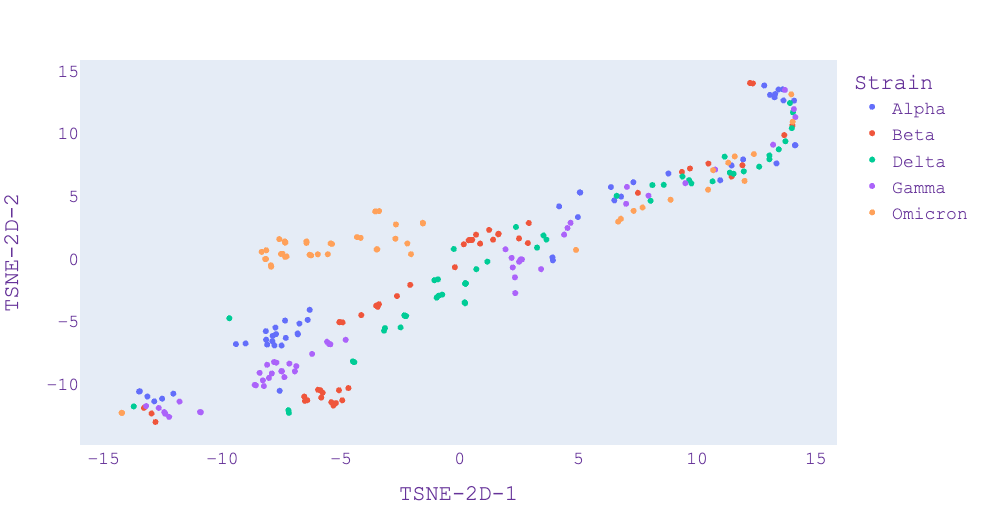
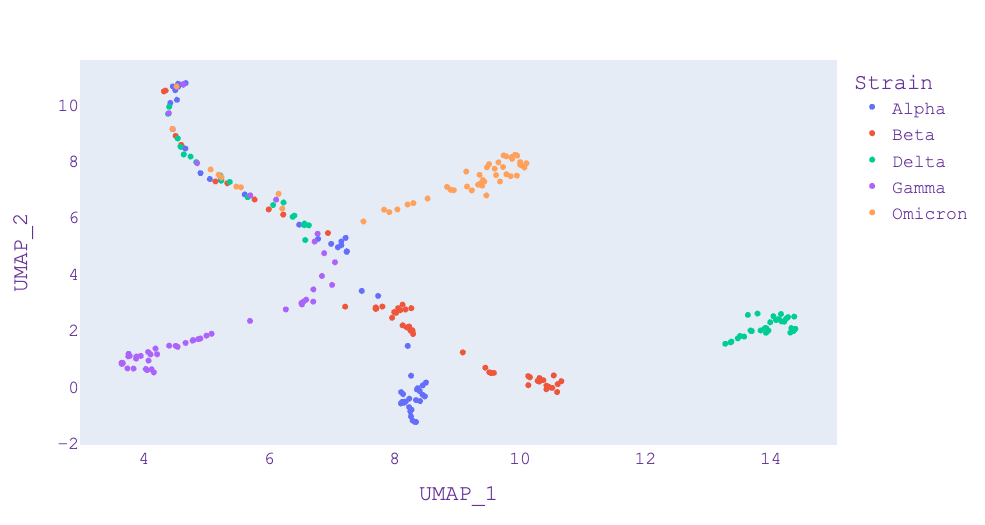
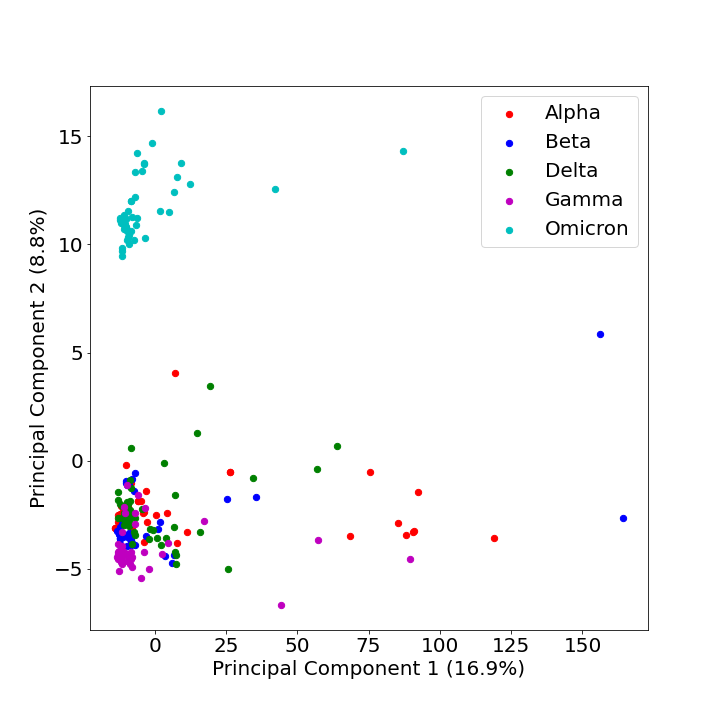
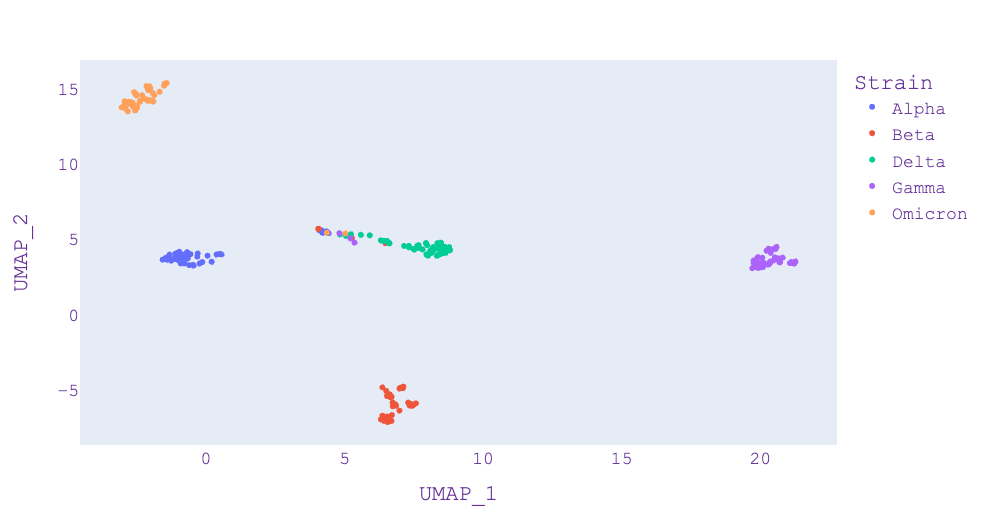
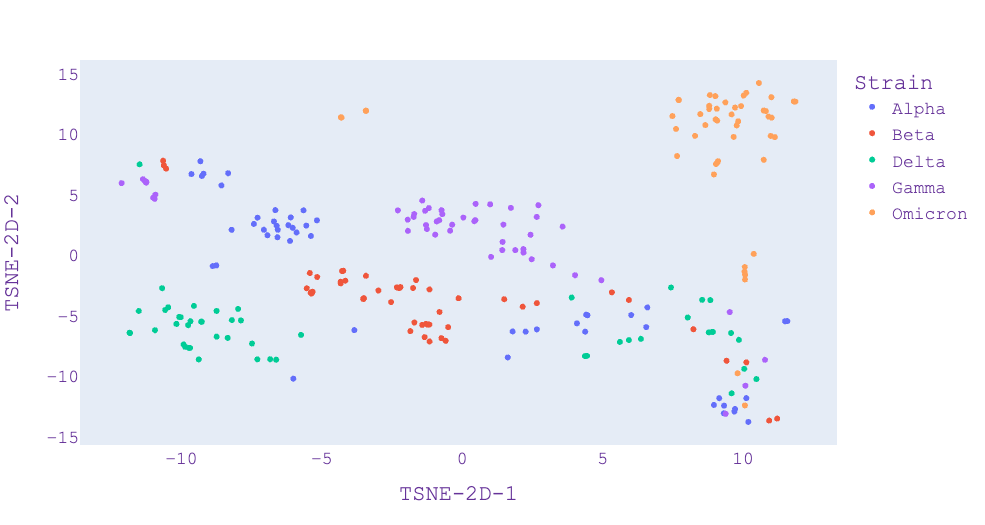
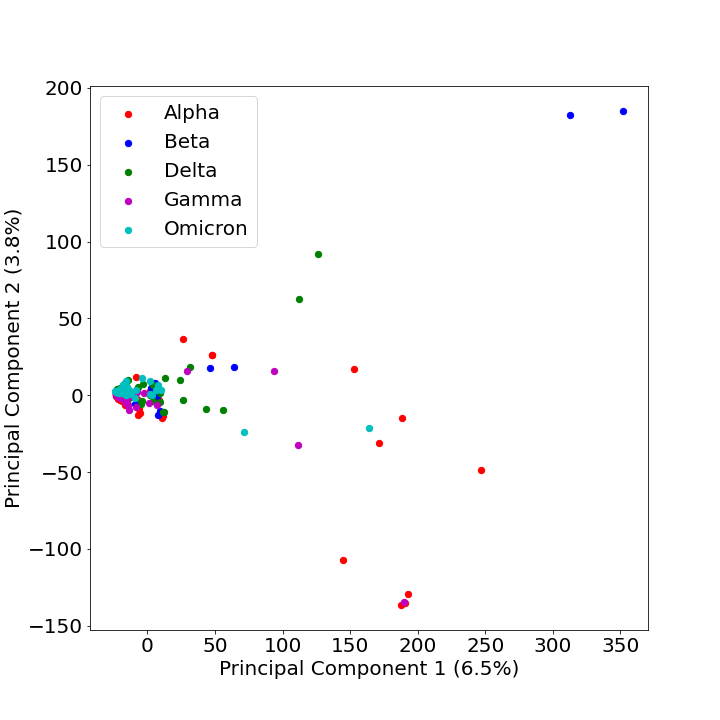
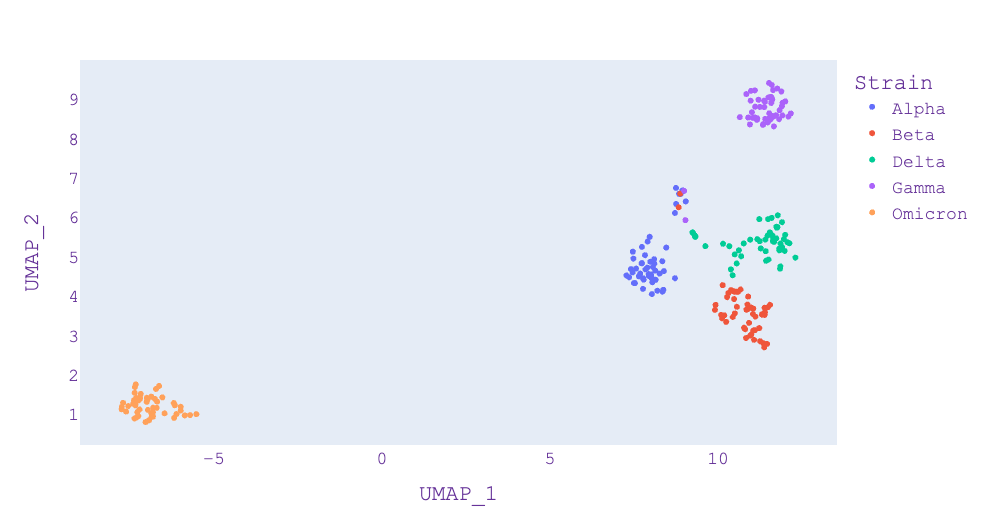
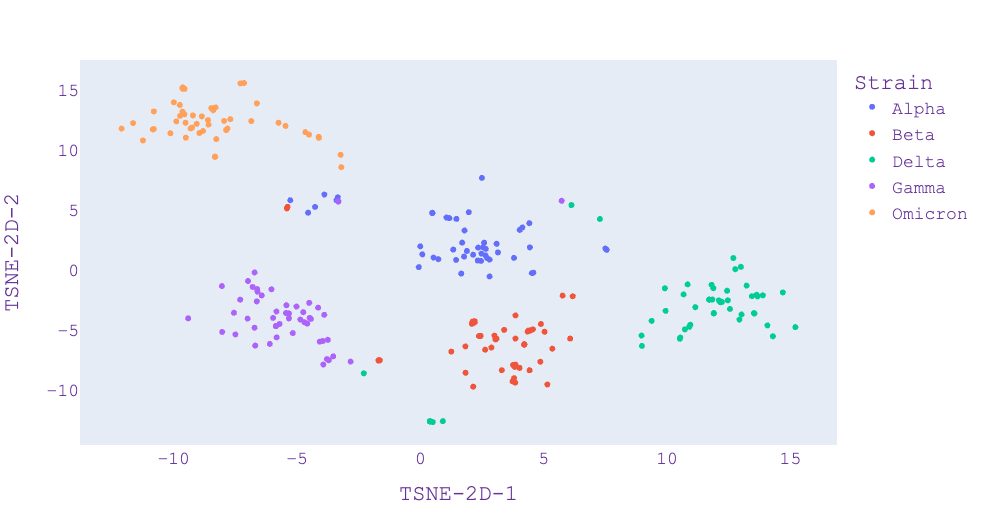
In Figure 3 - Panel (b), we find that there is a further separation of the variants using UMAP. In this case, the Alpha variant is separate while it is overlapping using PCA, as shown in Figure 3 - Panel (a). In Figure 3 - Panel(c), we find that t-SNE is poor in discriminating the variants; however, t-SNE improves when and in Figure 4 - Panel(c) and 5 - Panel(c). In the case of UMAP, these figures show that the distance between distinct clusters becomes more apparent (increases) as the value of increases. This is also apparent in the case of t-SNE, where and provides better visualization in discriminating cluster of variants.
Furthermore, Table 5 presents the computational time where PCA uses the lowest computational time followed by UMAP and t-SNE. Although this is not a problem for this study since only a small dataset is utilized (250 genome sequences), the computational time would be an issue when millions of sequences need to be processed. Note that number of features obtained after the -mer analysis is also shown which indicates how the dataset size changes with different values of while representing the same problem.
| PCA | t-SNE | UMAP | Num. features | |
|---|---|---|---|---|
| k = 3 | 0.0215 | 3.7273 | 0.2905 | 64 |
| k = 5 | 0.0241 | 1.2987 | 0.3190 | 1024 |
| k = 7 | 0.2475 | 1.5757 | 0.3269 | 16384 |
Clustering
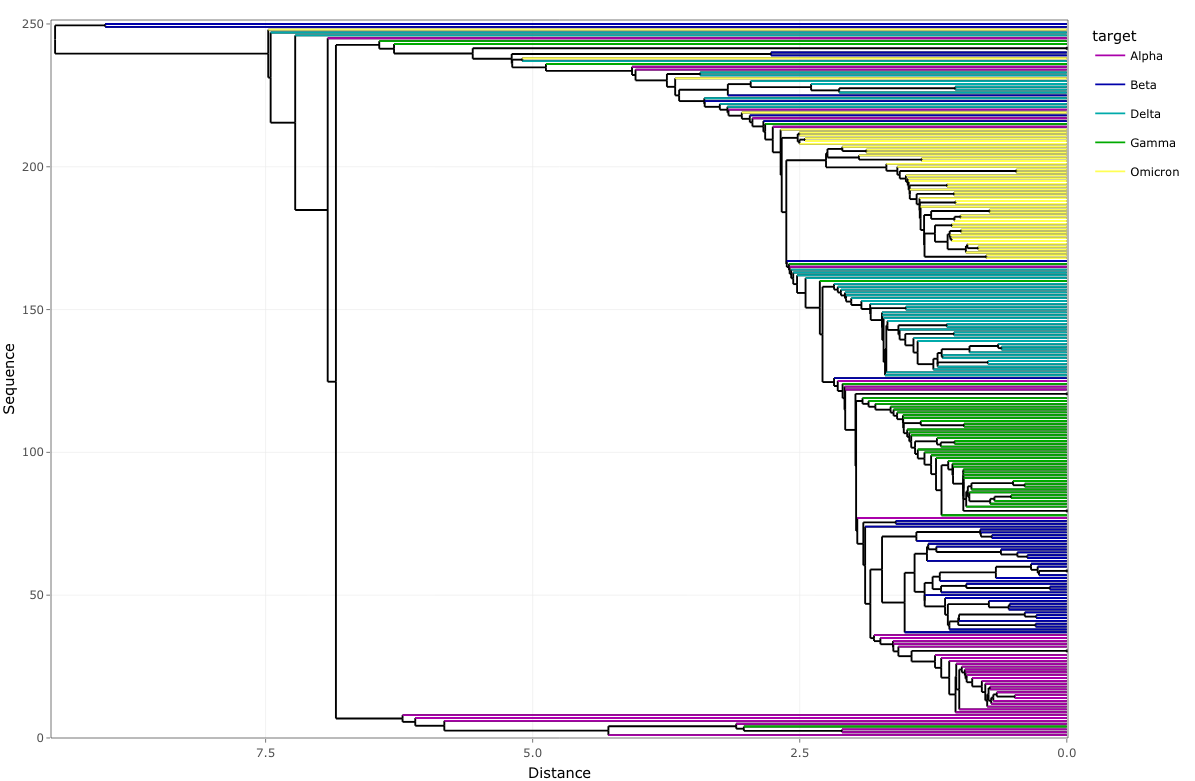
We apply AGNES clustering (Step 4 of the Framework in Figure 1) and obtain a dendrogram using the original dataset consisting of 250 randomly selected SARS-CoV-2 genome isolates. Figure 6 presents the visualization obtained from the dendrogram where we can see the distinction by groups of variants. We represent each genome isolate by a data point using a horizontal line in the plot. The dendrogram demonstrates the relationship between genome isolates and comprises sequences that are classified into every cluster. The value of every sequence is according to the weighted dissimilarity computation that scientists use for clustering. In Figure 6, we note that there are some mutational differences between variants of the same type owing to high mutation rates of SARS-CoV-2. These mutational differences help in identifying the variant lineage and can be used to track the route of transmission from one region to another. However, these mutations do not drastically alter variant properties. We also notice that in certain cases, certain variants such as Beta are close to Delta which is in the top cluster that falls under the distance of less than 3.0.
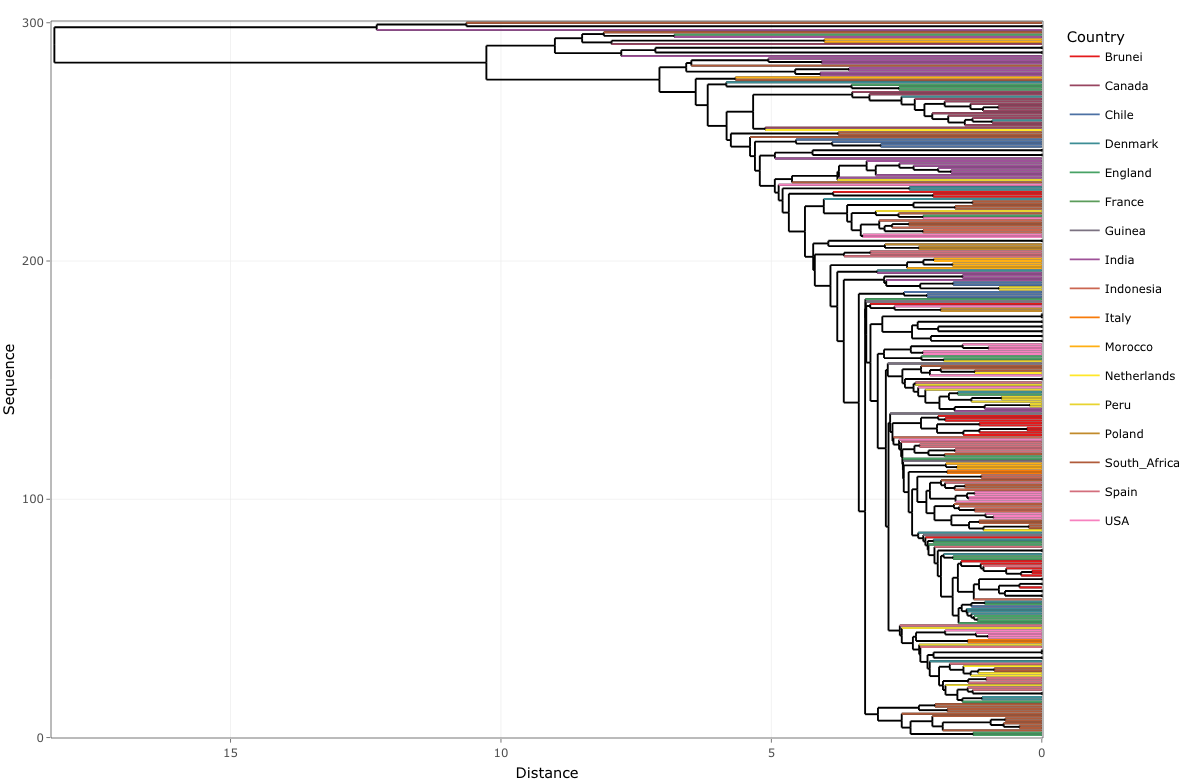
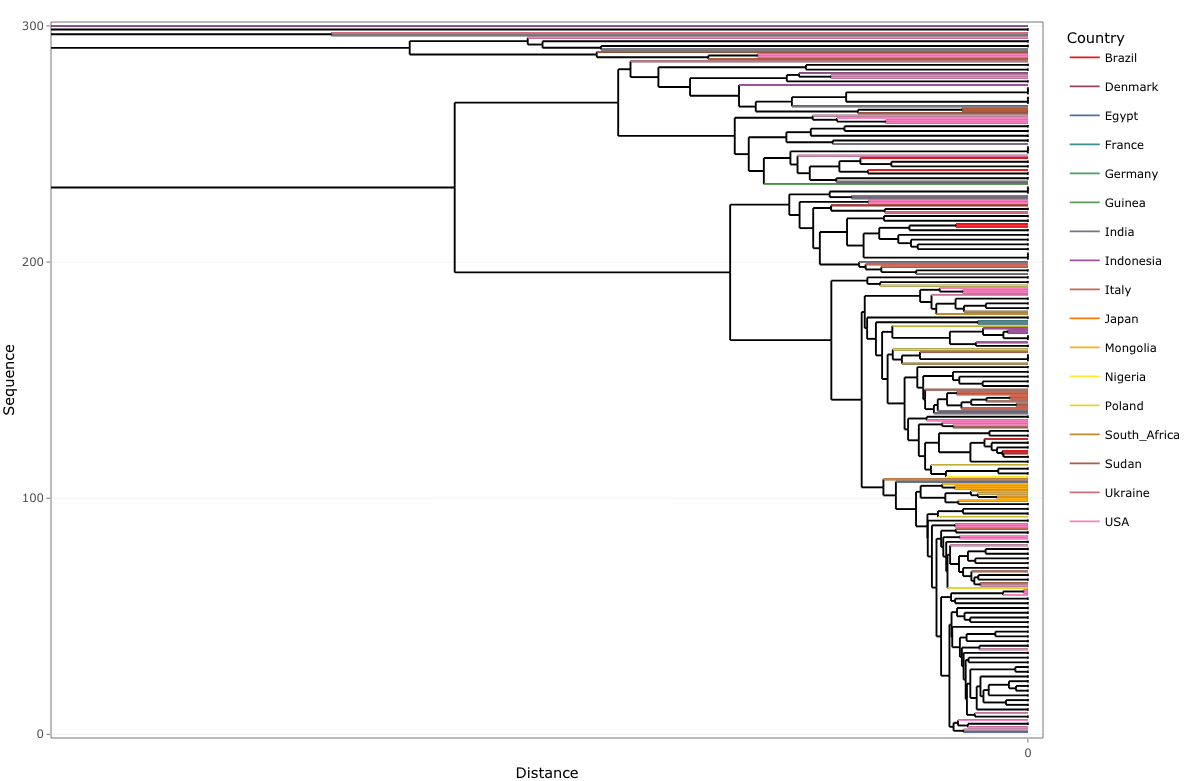
Finally, we apply AGNES on a set of 300 randomly selected SARS-CoV-2 genome isolates (Table 3) of the Omicron variant and obtain a dendrogram that shows the respective countries and how they are related (Step 4(b)) of the Framework in Figure 1). Note that we added 50 randomly selected isolates to the 250 isolates selected previously to get 300 isolates. Figure 7 presents the dendrogram obtained from the visualization for Omicron where we can see that there are some mutational differences between Omicron genome sequences from different regions. As mentioned above, these give rise to different lineages but do not alter the viral phenotype. We also observe that there is a certain level of similarity between variant sequences from different regions, for example, (USA, Spain, Brunei) and (India, Morocco, South Africa). In future work, the point of origin of these similarities can be traced by doing a spatiotemporal analysis of the data. Hence, once extended, this framework has the potential to track the trend of viral spread from one region to another.
A similar country-wise analysis was also performed on 300 randomly selected SARS-CoV-2 genome isolates of the Delta variant. Figure 8 presents the dendrogram obtained from the visualization for Delta, where we observe that the level of similarity for the genome sequence among different regions was much higher than that observed for Omicron. This supports the fact that the observed number of lineages for Omicron(7) is more than that for Delta(2) [69], which further hints at a higher mutation rate for the Omicron variant.
Discussion
The main contribution of this study lies in examining the COVID-19 isolates using classical and novel dimensionality reduction and clustering methods. In general, we found that UMAP performs better than PCA and t-SNE for the given COVID-19 genome isolates. It is effective in visualizing clusters as it takes the nonlinearity of the data into account, unlike PCA, and can capture the global structure of the data better than t-SNE. We also note that -mer analysis is an important data pre-processing step when dealing with genomics data. Our results show that the value of plays a crucial role in capturing the features. Depending on the method (PCA, UMAP, and t-SNE), it is critical to choose the right value of for -mer analysis. Even though small values of often lead to information loss, a larger value of , while preserving important information, demands more computational resources. Thus, we conclude that it is reasonable not to go further than , as it can take further computational time (Table 5) and storage during genome sequence pre-processing. We note that shows the highest explained variance ratio of PCA in Table 4. Figure 3 shows that from PCA is not as good as UMAP which has been better in discriminating the variants. Hence, although has a high explained variance ratio, it is not appropriate when we check the visualisation and compare it with in Figure 5 where UMAP shows the best results. Hence, we can note that PCA is not an appropriate method for visualisation in this case and is the best -mer count value which is supported by UMAP results.
UMAP is a nonlinear dimensionality reduction method that creates simplicial complexes by connecting points if the distance between them is below a threshold. UMAP uses these complexes to calculate the relative distance in the lower dimensions, unlike t-SNE, which does it randomly [28]. PCA on the other hand, cannot capture non-linear dependencies as it is a linear projection and its primary goal is to find directions that maximize the variance in the dataset. Due to these reasons, UMAP scales well given different variations in -mer analysis and also provides a better visual representation with less computational time when compared with PCA and t-SNE (Figures 3, 4 and 5). On the other hand, PCA provides further insights using explained variance ratio which in addition while UMAP gives a good overview of the data. It will be useful to have the feature of explained variance ratio in UMAP and t-SNE, this can shed more light on -mer analysis as done by PCA.
In our framework, we utilise dendrograms via AGNES for visualizing the mutational differences and similarities among various groups. AGNES is easy to implement as it does not require prior information about the number of clusters but the time complexity is high and thus it is computationally expensive for larger and more complex datasets. Similarly, dendrograms well interpret but become less resourceful as the complexity of data increases.
Phylogeny reconstruction describes evolutionary relationships in terms of the relative recency of common ancestry which are typically represented as a branching diagram, or tree, with branches joined by nodes [70]. Phylogeny reconstruction has been prominent in studying evolutionary biology, particularly in visualising the relationship amongst genome sequences [71]; and hence, it has been used for COVID-19 isolates [72]. Our framework produces dendograms that are similar to phylogeny reconstruction, with additional visualisation using dimensional reduction methods. Phylogeny reconstruction has certain limitations which have been demonstrated for amido acid sequence data [73]. The phylogeny trees may not necessarily accurately represent the evolutionary history of the data [74]. A dendrogram is a general term for any type of phylogeny tree (scaled or unscaled). Hence, our framework is not replacing phylogeny reconstruction, but providing a means to provide additional information. We not only provide the dendrograms but also visualization by dimensionality reduction methods to distinguish variants of concern. In future work, a comparison between dendrogram and phylogeny reconstruction would highlight the strengths and limitations of the different approaches.
In future work, the proposed framework can be extended further with novel dimensionality reduction and clustering methods. Therefore, the other novel dimensionality reduction approaches such as Ivis [75] could be considered which is good in extremely large datasets. The genome data extraction using -mer analysis can be compared with alternatives, such as strobemers [76, 77] which is gaining attention in the area of genome sequence analysis.
We note that given the efficacy of the framework in distinguishing different variants of concern, the framework can be used for assisting scientists and policymakers in pandemic management. The framework can be used for large-scale temporal and spatial study of the emergence of major variants of COVID-19 in selected countries, and also globally which can help in better understanding the infection and death rate trend. This can also give an insight into the effectiveness of vaccination programs and boosters [78] for different variants. Furthermore, the framework can be used to perform a spatiotemporal analysis to study the pattern of the spread of infection from one region to another. It can also be extended to perform a similar analysis on future outbreaks (pandemics) to understand the nature of emerging variants. Finally, the web-based application can be developed using our framework that features geo-location and interactive maps (country-wise and worldwide) displaying different variants and their evolution over time.
The limitations of the study include the meta-information provided in the COVID-19 genome isolates since a large number of samples only have dates associated with the data uploaded rather than when they were taken. It is important to know meta-information such as the date and time of the samples collected in order to have further insights into the changing nature of the variants. We also need to note that the number of variants and the number of samples for each variant are magnitudes lower than the number registered in the dataset. Our framework handled a few hundred samples and could be extended to thousands of samples. However, catering millions of samples across space (geo-location) and time would be computationally intensive and parallel computing facilities would be needed.
Conclusion
We presented a framework that provides insights that can further help scientists in effectively discriminating the COVID-19 variants that rapidly change due to mutations. In our framework, we evaluated the dimensional reduction components of the framework with different methods and found that UMAP provides the best dimensionality reduction and visualization tool for the genome sequences. We showed that PCA used in conjunction with t-SNE and UMAP addresses the limitations of the latter methods since they do not provide explained variance ratio. In many applications, visualization of the data alone is not sufficient to address the problem; it is critical to know the contribution of the different features which can only be known through PCA. Furthermore, the visualization of the emerging COVID-19 variants using dendrograms via clustering can provide detailed insights about their evolution which can be extended to larger datasets.
References
- 1. The species Severe acute respiratory syndrome-related coronavirus: classifying 2019-nCoV and naming it SARS-CoV-2. Nature Microbiology. 2020;5(4):536.
- 2. Pellett PE, Mitra S, Holland TC. Basics of Virology. Neurovirology. 2014; p. 45–66.
- 3. Zhao Y, Huang J, Zhang L, Chen S, Gao J, Jiao H. The global transmission of new coronavirus variants. Environmental Research. 2022;206:112240.
- 4. Mahase E. Coronavirus: covid-19 has killed more people than SARS and MERS combined, despite lower case fatality rate. BMJ. 2020;368. doi:10.1136/bmj.m641.
- 5. de Wit E, van Doremalen N, Falzarano D, Munster VJ. SARS and MERS: recent insights into emerging coronaviruses. Nature Reviews Microbiology. 2016;14. doi:10.1038/nrmicro.2016.81.
- 6. Chen YT, Shao SC, Lai ECC, Hung MJ, Chen YC. Mortality rate of acute kidney injury in SARS, MERS, and COVID-19 infection: a systematic review and meta-analysis. Critical care. 2020;24(1):1–4.
- 7. Monchatre-Leroy E, Boué F, Boucher JM, Renault C, Moutou F, Ar Gouilh M, et al. Identification of alpha and beta coronavirus in wildlife species in France: Bats, rodents, rabbits, and hedgehogs. Viruses. 2017;9(12):364. doi:10.3390/v9120364.
- 8. V’kovski P, Kratzel S A, et al S. Coronavirus biology and replication: implications for SARS-CoV-2. Nat Rev Microbiol. 2021;19:155–170.
- 9. Mesel-Lemoine M, Millet J, Vidalain PO, Law H, Vabret A, Lorin V, et al. A human coronavirus responsible for the common cold massively kills dendritic cells but not monocytes. Journal of Virology. 2012;86(14):7577–7587.
- 10. Javed B, Sarwer A, Soto EB, Mashwani ZuR. Impact of SARS-CoV-2 (Coronavirus) Pandemic on Public Mental Health. Frontiers in Public Health. 2020;8. doi:10.3389/fpubh.2020.00292.
- 11. Kim S, Koh K, Zhang X. Short-term Impact of COVID-19 on Consumption Spending and Its Underlying Mechanisms: Evidence from Singapore. Canadian Journal of Economics;20. doi:10.1111/caje.12538.
- 12. de Groot RJ, Baker SC, Baric RS, Brown CS, Drosten C, Enjuanes L, et al. Commentary: Middle East Respiratory Syndrome Coronavirus (MERS-CoV): Announcement of the Coronavirus Study Group. Journal of Virology. 2013;87(14):7790–7792.
- 13. Holmes EC, Goldstein SA, Rasmussen AL, Robertson DL, Crits-Christoph A, Wertheim JO, et al. The origins of SARS-CoV-2: A critical review. Cell. 2021;184(19):4848–4856.
- 14. Li Q, Wu J, Nie J, Zhang L, Hao H, Liu S, et al. The Impact of Mutations in SARS-CoV-2 Spike on Viral Infectivity and Antigenicity. Cell Press. 2020;182:1284–1294.
- 15. Mahase E. Delta variant: What is happening with transmission, hospital admissions, and restrictions ?; 2021.
- 16. Moore S, Hill EM, Tildesley MJ, Dyson L, Keeling MJ. Vaccination and non-pharmaceutical interventions for COVID-19: a mathematical modelling study. The Lancet Infectious Diseases. 2021;21(6):793–802.
- 17. Tahamtan A, Ardebili A. Real-time RT-PCR in COVID-19 detection: issues affecting the results. Expert review of molecular diagnostics. 2020;20(5):453–454.
- 18. Arevalo-Rodriguez I, Buitrago-Garcia D, Simancas-Racines D, Zambrano-Achig P, Del Campo R, Ciapponi A, et al. False-negative results of initial RT-PCR assays for COVID-19: a systematic review. PloS One. 2020;15(12):e0242958.
- 19. Floriano I, Silvinato A, Bernardo WM, Reis JC, Soledade G. Accuracy of the Polymerase Chain Reaction (PCR) test in the diagnosis of acute respiratory syndrome due to coronavirus: a systematic review and meta-analysis. Revista da Associação Médica Brasileira. 2020;66:880–888.
- 20. Li YD, Chi WY, Su JH, Ferrall L, Hung CF, Wu TC. Coronavirus vaccine development: From SARS and MERS to COVID-19. Journal of Biomedical Science. 2020;27(1). doi:10.1186/s12929-020-00695-2.
- 21. Abdi H, Williams LJ. Principal component analysis. Wiley interdisciplinary reviews: computational statistics. 2010;2(4):433–459.
- 22. Wold S, Jonsson J, Sjörström M, Sandberg M, Rännar S. DNA and peptide sequences and chemical processes multivariately modelled by principal component analysis and partial least-squares projections to latent structures. Analytica Chimica Acta. 1993;277(2):239–253.
- 23. Eltzner B, Huckemann S, Mardia KV. Torus principal component analysis with applications to RNA structure. The Annals of Applied Statistics. 2018;12(2):1332–1359.
- 24. Hartebrodt A, Röttger R. Federated horizontally partitioned principal component analysis for biomedical applications. Bioinformatics Advances. 2022;2(1). doi:10.1093/bioadv/vbac026.
- 25. Van der Maaten L, Hinton G. Visualizing data using t-SNE. Journal of Machine Learning Research. 2008;9(11).
- 26. Cieslak MC, Castelfranco AM, Roncalli V, Lenz PH, Hartline DK. t-Distributed Stochastic Neighbor Embedding (t-SNE): A tool for eco-physiological transcriptomic analysis. Marine Genomics. 2020;51:100723.
- 27. Kobak D, Berens P. The art of using t-SNE for single-cell transcriptomics. Nature Communications. 2019;10(1). doi:10.1038/s41467-019-13056-x.
- 28. McInnes L, Healy J, Melville J. Umap: Uniform manifold approximation and projection for dimension reduction. arXiv preprint arXiv:180203426. 2018;.
- 29. Yang Y, Sun H, Zhang Y, Zhang T, Gong J, Wei Y, et al. Dimensionality reduction by UMAP reinforces sample heterogeneity analysis in bulk transcriptomic data. Cell Reports. 2021;36(4):109442. doi:10.1016/j.celrep.2021.109442.
- 30. Bauer DC, Tay AP, Wilson LO, Reti D, Hosking C, McAuley AJ, et al. Supporting pandemic response using genomics and bioinformatics: A case study on the emergent SARS-CoV-2 outbreak. Transboundary and emerging diseases. 2020;67(4):1453–1462.
- 31. Chor B, Horn D, Goldman N, Levy Y, Massingham T. Genomic DNA k-mer spectra: models and modalities. Genome biology. 2009;10:1–10.
- 32. Mapleson D, Garcia Accinelli G, Kettleborough G, Wright J, Clavijo BJ. KAT: a K-mer analysis toolkit to quality control NGS datasets and genome assemblies. Bioinformatics. 2017;33(4):574–576.
- 33. Ali S, Sahoo B, Ullah N, Zelikovskiy A, Patterson M, Khan I. A k-mer based approach for SARS-Cov-2 variant identification. In: International Symposium on Bioinformatics Research and Applications. Springer; 2021. p. 153–164.
- 34. Fišer Pečnikar Ž, Buzan EV. 20 years since the introduction of DNA barcoding: from theory to application. Journal of applied genetics. 2014;55(1):43–52.
- 35. GISAID; Available from: https://www.gisaid.org. Accessed: October 2022
- 36. Shu Y, McCauley J. GISAID: Global initiative on sharing all influenza data – from vision to reality. Eurosurveillance. 2017;22(13). doi:10.2807/1560-7917.es.2017.22.13.30494.
- 37. Kumar N, Quadri S, AlAwadhi AI, AlQahtani M. COVID-19 Recovery Patterns Across Alpha (B.1.1.7) and Delta (B.1.617.2) Variants of SARS-CoV-2. Frontiers in Immunology. 2022;13. doi:10.3389/fimmu.2022.812606.
- 38. Thakur V, Ratho RK. OMICRON (B.1.1.529): A new SARS-CoV-2 variant of concern mounting worldwide fear. Journal of Medical Virology. 2021;94(5):1821–1824. doi:10.1002/jmv.27541.
- 39. Zhang Q, Pell J, Canino-Koning R, Howe AC, Brown CT. These are not the K-MERS you are looking for: Efficient online K-mer counting using a probabilistic data structure. PLoS ONE. 2014;9(7). doi:10.1371/journal.pone.0101271.
- 40. Marçais G, Kingsford C. A fast, lock-free approach for efficient parallel counting of occurrences of K-MERS. Bioinformatics. 2011;27(6):764–770. doi:10.1093/bioinformatics/btr011.
- 41. Lorenzi C, Barriere S, Villemin JP, Dejardin Bretones L, Mancheron A, Ritchie W. iMOKA: k-mer based software to analyze large collections of sequencing data. Genome biology. 2020;21(1):1–19.
- 42. Crusoe MR, Alameldin HF, Awad S, Boucher E, Caldwell A, Cartwright R, et al. The khmer software package: enabling efficient nucleotide sequence analysis. F1000Research. 2015;4.
- 43. Khanna KK, Jackson SP. DNA double-strand breaks: signaling, repair and the cancer connection. Nature genetics. 2001;27(3):247–254.
- 44. Manekar SC, Sathe SR. A benchmark study of k-mer counting methods for high-throughput sequencing. GigaScience. 2018;7(12):giy125.
- 45. Wilkinson S. kmer: an R package for fast alignment-free clustering of biological sequences; 2018. Available from: https://cran.r-project.org/package=kmer.
- 46. Maćkiewicz A, Ratajczak W. Principal Components Analysis (PCA). Computers &; Geosciences. 1993;19(3):303–342.
- 47. Howley T, Madden MG, O’Connell ML, Ryder AG. The effect of principal component analysis on machine learning accuracy with high dimensional spectral data. In: International Conference on Innovative Techniques and Applications of Artificial Intelligence. Springer; 2005. p. 209–222.
- 48. Zhang Z, Castelló A. Principal components analysis in clinical studies. Annals of translational medicine. 2017;5(17).
- 49. Ye W, Lu W, Tang Y, Chen G, Li X, Ji C, et al. Identification of COVID-19 clinical phenotypes by principal component analysis-based cluster analysis. Frontiers in medicine. 2020;7:570614.
- 50. Martis RJ, Acharya UR, Mandana K, Ray AK, Chakraborty C. Application of principal component analysis to ECG signals for automated diagnosis of cardiac health. Expert Systems with Applications. 2012;39(14):11792–11800.
- 51. Parsons KJ, Cooper WJ, Albertson RC. Limits of Principal Components Analysis for Producing a Common Trait Space: Implications for Inferring Selection, Contingency, and Chance in Evolution. PLoS ONE. 2009;4(11):e7957.
- 52. Hinton GE, Roweis S. Stochastic neighbor embedding. Advances in neural information processing systems. 2002;15.
- 53. Toghi Eshghi S, Au-Yeung A, Takahashi C, Bolen CR, Nyachienga MN, Lear SP, et al. Quantitative Comparison of Conventional and t-SNE-guided Gating Analyses. Frontiers in Immunology. 2019;10. doi:10.3389/fimmu.2019.01194.
- 54. Zhou H, Wang F, Tao P. t-Distributed Stochastic Neighbor Embedding Method with the Least Information Loss for Macromolecular Simulations. Journal of Chemical Theory and Computation. 2018;14(11):5499–5510.
- 55. Oliveira FHM, Machado ARP, Andrade AO. On the Use of t-Distributed Stochastic Neighbor Embedding for Data Visualization and Classification of Individuals with Parkinson’s Disease. Computational and Mathematical Methods in Medicine. 2018;2018:1–17. doi:10.1155/2018/8019232.
- 56. Kobak D, Linderman GC. Initialization is critical for preserving global data structure in both t-SNE and UMAP. Nature biotechnology. 2021;39(2):156–157.
- 57. Tenenbaum JB, Silva Vd, Langford JC. A global geometric framework for nonlinear dimensionality reduction. Science. 2000;290(5500):2319–2323.
- 58. Becht E, McInnes L, Healy J, Dutertre CA, Kwok IW, Ng LG, et al. Dimensionality reduction for visualizing single-cell data using UMAP. Nature biotechnology. 2019;37(1):38–44.
- 59. Yang Y, Sun H, Zhang Y, Zhang T, Gong J, Wei Y, et al. Dimensionality reduction by UMAP reinforces sample heterogeneity analysis in bulk transcriptomic data. Cell reports. 2021;36(4):109442.
- 60. Banks DL, Fienberg SE. Statistics, Multivariate. Encyclopedia of Physical Science and Technology. 2003; p. 851–889. doi:10.1016/b0-12-227410-5/00731-6.
- 61. Akman O, Comar T, Hrozencik D, Gonzales J. Data Clustering and Self-Organizing Maps in Biology. Algebraic and Combinatorial Computational Biology. 2019; p. 351–374. doi:10.1016/b978-0-12-814066-6.00011-8.
- 62. Gupta S, Kumar P. A constrained agglomerative clustering approach for unipartite and bipartite networks with application to credit networks. Information Sciences. 2021;557:332–354. doi:10.1016/j.ins.2019.12.085.
- 63. Chen W, Tang Z, Jiang X, Gao J, Sun R, Hashlan S. Agglomerative clustering using improved rough sets and its applications in cooperative object localization. Computers & Electrical Engineering. 2013;39(7):1962–1969. doi:10.1016/j.compeleceng.2013.04.008.
- 64. Lachmann M, Rippen E, Schuster T, Xhepa E, von Scheidt M, Pellegrini C, et al. Subphenotyping of Patients With Aortic Stenosis by Unsupervised Agglomerative Clustering of Echocardiographic and Hemodynamic Data. JACC: Cardiovascular Interventions. 2021;14(19):2127–2140.
- 65. Moehlin J, Mollet B, Colombo BM, Mendoza-Parra MA. Inferring biologically relevant molecular tissue substructures by agglomerative clustering of digitized spatial transcriptomes with multilayer. Cell Systems. 2021;doi:10.1016/j.cels.2021.04.008.
- 66. Yang Y. Temporal Data Clustering. Temporal Data Mining Via Unsupervised Ensemble Learning. 2017; p. 19–34. doi:10.1016/b978-0-12-811654-8.00003-8.
- 67. Volokhov D, Simonyan V, Davidson M, Chizhikov V. RNA polymerase beta subunit (rpoB) gene and the 16S–23S rRNA intergenic transcribed spacer region (ITS) as complementary molecular markers in addition to the 16S rRNA gene for phylogenetic analysis and identification of the species of the family Mycoplasmataceae. Molecular phylogenetics and evolution. 2011;62:515–28.
- 68. Pedregosa F, Varoquaux G, Gramfort A, Michel V, Thirion B, Grisel O, et al. Scikit-learn: Machine Learning in Python. Journal of Machine Learning Research. 2011;12:2825–2830.
- 69. for Disease Control C, Prevention. SARS-CoV-2 Variant Classification and Definitions. Available from: https://www.cdc.gov/coronavirus/2019-ncov/variants/variant-classifications.html. Accessed: October 2022
- 70. Jill Harrison C, Langdale JA. A step by step guide to phylogeny reconstruction. The Plant Journal. 2006;45(4):561–572.
- 71. Boore JL. The use of genome-level characters for phylogenetic reconstruction. Trends in Ecology & Evolution. 2006;21(8):439–446.
- 72. Taiwo IA, Adeleye N, Anwoju FO, Adeyinka A, Uzoma IC, Bankole TT. Sequence analysis for SNP detection and phylogenetic reconstruction of SARS-cov-2 isolated from Nigerian COVID-19 cases. New Microbes and New Infections. 2022;45:100955.
- 73. Bremer K. The limits of amino acid sequence data in angiosperm phylogenetic reconstruction. Evolution. 1988;42(4):795–803.
- 74. Hoelzer GA, Meinick DJ. Patterns of speciation and limits to phylogenetic resolution. Trends in ecology & evolution. 1994;9(3):104–107.
- 75. Szubert B, Cole JE, Monaco C, Drozdov I. Structure-preserving visualisation of high dimensional single-cell datasets. Scientific Reports. 2019;9(1). doi:10.1038/s41598-019-45301-0.
- 76. Sahlin K. Effective sequence similarity detection with strobemers. Genome research. 2021;31(11):2080–2094.
- 77. Sahlin K. Strobemers: an alternative to k-mers for sequence comparison. bioRxiv. 2021;.
- 78. Bruxvoort KJ, Sy LS, Qian L, Ackerson BK, Luo Y, Lee GS, et al. Effectiveness of mRNA-1273 against delta, mu, and other emerging variants of SARS-CoV-2: test negative case-control study. BMJ. 2021; p. e068848.