Unveiling the interplay between the GASP jellyfish galaxy JO194 and its environment with Chandra
Abstract
X-ray studies of jellyfish galaxies opened a window in the physics of the interplay between intracluster medium (ICM) and interstellar medium (ISM). In this paper, we present the study of an archival Chandra observation of the GASP jellyfish galaxy JO194. We observe X-ray emission extending from the stellar disk to the unwinding spiral arms with an average temperature of keV. To investigate the origin of the X-ray emission, we compare the observed X-ray luminosities with those expected from the star formation rates (SFR) obtained from H emission. We estimate an X-ray luminosity excess of a factor with respect to the SF, therefore we conclude that SF is not the main responsible for the extended X-ray emission of JO194. The metallicity in the spiral arms () is consistent with that of the ICM around JO194 (), thus we suggest that the ICM radiative cooling dominates the X-ray emission of the arms. We speculate that the X-ray plasma results from the ISM-ICM interplay, although the nature of this interplay is still mostly unknown. Finally, we observe that the X-ray properties of JO194 are consistent with those of two other GASP galaxies with different stellar mass, phase-space conditions in their hosting clusters, and local ICM conditions. We suggest that the conditions required to induce extended X-ray emission in jellyfish galaxies are established at the beginning of the stripping, and they can persist on long time scales so that galaxies in different clusters and evolutionary stages can present similar extended X-ray emission.
tablenum \restoresymbolSIXtablenum
1 Introduction
The evolution of galaxies is strongly influenced by the environment in which they live. Star-forming galaxies in high density environments, like clusters, have a different gas content than their counterparts in the fields. In particular, spiral galaxies in clusters have, on average, a lower gas content (e.g., Davies & Lewis, 1973; Giovanelli & Haynes, 1988; Solanes et al., 2001; Chung et al., 2009) than the galaxies in the field. This is due to a number of physical interactions that can be particularly efficient in galaxy clusters, and will eventually lead to the gas removal. As a consequence of the loss of gas, the star formation rate (SFR) is reduced and the galaxies could become passive (e.g., Werle et al., 2022). To explain the lack of gas-rich galaxies in clusters, a mechanism that strips away the gas from galaxies was proposed by Gunn & Gott (1972): ram pressure stripping. This mechanism acts when a galaxy falls into the hot and dense (, Sarazin 1986a) intracluster medium (ICM). When a galaxy falls into the ICM, it experiences a drag force in the opposite direction of its relative motion and, if this force exceeds the gravitational one, the cold interstellar medium (ISM) of the galaxy is stripped away. The condition that expresses that the ram pressure overcomes the gravitational force per unit of surface is (Gunn & Gott, 1972), where is the ICM mass density, is the infall velocity of the galaxy, and are the stellar and gas surface density. If this condition is true, the whole ISM is stripped away and the galaxy becomes passive.
The most spectacular examples of galaxies undergoing strong ram pressure are the so-called “jellyfish galaxies”. These galaxies show extra-planar, unilateral debris visible in the optical/UV light and long “tentacles” or tails of diffuse ionized H gas extending for dozens of beyond the galaxy disk, where new stars are born in knots (e.g. Fumagalli et al., 2014; Poggianti et al., 2016). The ‘GAs Stripping Phenomena in galaxies’ (GASP) survey aims at studying the gas removal process and how ram pressure stripping affects star formation (e.g., Vulcani et al., 2018; Poggianti et al., 2019a; Vulcani et al., 2020; Bellhouse et al., 2021), and AGN activities (Poggianti et al., 2017; Radovich et al., 2019; Peluso et al., 2022) in jellyfish galaxies. This project is a European Southern Observatory (ESO) Large Program, carried out with the Multi Unit Spectroscopic Explorer (MUSE) of the Very Large Telescope. The 94 stripping candidates (Poggianti et al., 2017) show an unilateral debris/disturbed morphology and tails, they are at , they have stellar masses in the range and they are located in different environments, such as groups and clusters with different masses (Poggianti et al., 2017).
With multi wavelength studies it is possible to investigate the process of ram pressure stripping through the observation of stripped gas in different phases (e.g., Poggianti et al., 2019b). With observations in the optical band it is possible to reconstruct the star formation history of the galaxies (e.g., Fritz et al., 2017) and, analyzing them in the radio band, it is possible to understand what is the role of magnetic fields during the stripping process (e.g., Müller et al., 2020). In this context, X-ray studies of these galaxies can probe the physics of the interplay between ISM and ICM. The high-energy side of jellyfish galaxies has been the object of several studies in the past decades (e.g., Cowie et al., 1977; Nulsen, 1982; Tschöke, D. et al., 2001; Sun & Vikhlinin, 2005; Sun et al., 2006, 2009; Zhang et al., 2013; Boselli, A. et al., 2016; Poggianti et al., 2019b; Campitiello et al., 2021; Sun et al., 2021). These suggest that the observed X-ray plasma is the result of a complex interaction between ICM and ISM which causes the heating of the ISM through either shock and conduction, or the cooling of the ICM onto the tails of the galaxy, or the ICM-ISM mixing. To improve the knowledge about the interaction between ICM and ISM, it is necessary to extend these studies to additional jellyfish galaxies.
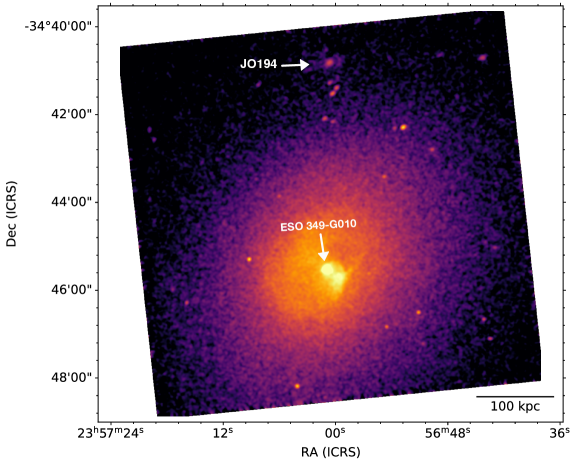
JO194 (), located in Abell 4059, is a jellyfish galaxy characterized by an extended X-ray emission outside the disk. The galaxy is almost face-on along the line-of-sight with an inclination angle between the galaxy and its direction of motion through the ICM of (Bellhouse et al., 2021). For these reasons, it is a good candidate to study the interaction between the ICM and ISM in the stripped arms in the X-ray energy band. JO194 is a spiral Sb galaxy (RA Dec Varela et al. 2009) at a projected distance of North of ESO 349-G010, the central galaxy of the cluster. JO194 has a stellar mass of and a line-of-sight velocity of with respect to the mean velocity of the cluster (Poggianti et al., 2017). Its projected vicinity to the center of the cluster and its high velocity makes the stripping process very efficient. From this information, it was argued that this is the first time that the galaxy is falling to the center of the cluster (see Bellhouse et al., 2017; Jaffé et al., 2018). The star formation of this galaxy ( M⊙ yr-1 Vulcani et al., 2018) is mainly located in the galaxy disk with only the of the stars are currently formed in the tails (Poggianti et al., 2019a).
JO194 was studied in Bellhouse et al. (2021) to understand the unwinding mechanism of the arms caused by the stripping process. It was shown that the youngest stars () are born in the stripped arms while older stars () were born in the inner part of the unwinding arms near the stellar disk. So the youngest stars born in the arms trace the motion of the unwinding arms that characterize the galaxy. This is an important result to better understand how ram pressure is acting on the arms of the spiral galaxies and to reconstruct the unwinding phenomenon as a function of the stellar age (Bellhouse et al., 2021).
Abell 4059 is a relaxed, cool-core cluster (Laganá et al., 2019) at (Abell et al., 1989), dominated by the cD galaxy ESO 349-G010 (RA 23: 57: 00.74 Dec -34: 45: 32.99, Huang & Sarazin 1998). In Schwartz et al. (1991) and Huang & Sarazin (1998) are presented the X-ray analysis of the cluster using, respectively, High Energy Astronomy Observatory (HEAO), EXOSAT, Einstein and ROSAT observations. The previous X-ray analysis revealed that there is an excess of surface brightness in the central region of the cluster. This excess is the result of a cooling flow with a nominal cooling mass rate of . The analysis of the X-ray properties of the ICM of Abell 4059 are presented in Reynolds et al. (2008), Choi et al. (2004) and Mernier et al. (2015). From the analysis of the radial profiles, the temperature of the ICM increases with radius (in the first from the center of the cluster the temperature grows from 1 to ), while electron density () and pressure (P) decrease: goes from to and P goes from to in the first (see Section 3.1). Also the abundance of different metals ( and ) decreases with radius and it is peaked toward the center of the cluster. Also ram pressure stripping might have contributed to a more recent enrichment in the core (Mernier et al., 2015).
We carried out an X-ray analysis of the jellyfish galaxy JO194 to explore the physical properties of the X-ray plasma in the galaxy, like average temperature, metallicity and luminosity, and to investigate the contribution of the SFR in producing this emission. The final purpose is to study the origin of the X-ray emission produced in the arms of this galaxy and what are the similarities between JO194 and the other GASP jellyfish galaxies that have been studied in the X-ray energy band, JO201 and JW100. This paper is structured as follows. In Section 2 we describe the procedures adopted for the Chandra data reduction, for the surface brightness analysis and the spectra extraction. In Section 3 we present the results of the spectral analysis of the ICM spectra and JO194 spectra and we discuss them in Section 4. Summary and conclusions are presented in Section 5.
Throughout this paper, we adopt a Chabrier initial mass function (IMF; Chabrier 2003), a concordance CDM cosmology of , , ( at ) and all the errors are given at level.
2 Data analysis
2.1 Data preparation
The Chandra observation of the cluster A4059 was performed with the Advanced CCD Imaging Spectrometer (ACIS) on January 26 2005 (obsID:5785, PI Reynolds and exposure time). The observation was made in the VFAINT mode with both ACIS-S (S1,S2, and S3 chips) and ACIS-I (I2 and I3 chips) instruments.
In this work, we processed only the CCD including JO194 (S3 chip).
The dataset was downloaded from Chandra Data Archive111https://cda.harvard.edu/chaser/ and was reprocessed with the software package CIAO 4.13 and CALDB 4.9.4 to remove bad pixels and flares.
After the cleaning phase, the net exposure time was .
To improve the absolute astrometry, we have identified the point sources using the CIAO task WAVDETECT and we cross-matched them with the optical catalog USNO-A2.0222http://tdc-www.harvard.edu/catalogs/ua2.html.
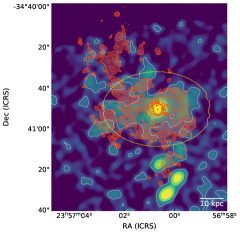
To evaluate the background signal (observational and cosmological) we used the CALDB Blank-Sky files that match our data in the chip of interest. Then we normalized the observed and background count-rate in the band rescaling the exposure time of the background accordingly. The exposure-corrected, background-subtracted Chandra image of the chip of interest in the energy band is shown in the Fig. 1. The resolution at the off-axis distance of JO194 is
In addition to the Chandra data, in this work we made use of the MUSE corrected for stellar absorption H image of JO194 (Poggianti et al., 2017), and the stellar disk mask presented in Gullieuszik et al. (2020).
2.2 Surface brightness analysis
To characterize the X-ray morphology of JO194, we analyzed the X-ray surface brightness profiles of the ICM of Abell 4059. We performed the analysis using the sherpa333https://cxc.cfa.harvard.edu/sherpa/threads/ environment of the software CIAO.
To analyze the 2D surface brightness profile, we defined an ellipsoidal region that followed the morphology of the X-ray emission (Figure 1), centered on the coordinates of the cluster center (RA (J2000) 23 : 57 : 01.065, Dec (J2000) 444These coordinates are shown in the ACCEPT archive:
https://web.pa.msu.edu/astro/MC2/accept/clusters/5785.html), with major axis of and position angle of . To model only the ICM thermal emission, we excluded the point sources found by the task WAVDETECT with circles of average radius of . With sherpa, we performed a 2D fit of the surface brightness inside this ellipsoidal region using a Cash statistic (Cash, 1979) and an elliptical555https://cxc.cfa.harvard.edu/sherpa/ahelp/beta2d.html -model (Cavaliere & Fusco-Femiano, 1976):
| (1) |
where is the central surface brightness, is the core radius and . The model’s ellipticity and inclination angle are and radians, respectively. The best-fit and values are in agreement with the previous results presented in Huang & Sarazin (1998), which reported and . Then, with the CIAO routine dmimgcalc, we subtracted the 2D -model to the exposure-corrected background-subtracted image to obtain a residual image that highlights the excesses of surface brightness of JO194 relative to the ICM thermal emission.
2.3 Spectral Analisys
To understand the origin of the extended X-ray emission of JO194 and to study the interaction between the ICM and ISM contained in the arms of the galaxy, we performed a spectroscopic analysis of the Chandra data with the software package XSPEC (version 12.11.1 Arnaud 1996).
To derive the ICM properties in the region in which the galaxy is located, we assumed that the gas has a spherical symmetry
and we considered 4 annular sectors with an aperture of centered on the center of the cluster. We adopted an average width of to have more than 1000 counts in every sector
(see Figure 2).
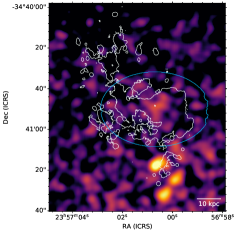
For each region, we masked all the point sources identified by WAVDETECT and the extended emission of JO194 contained in the last annulus in the north direction, to prevent their emission from contaminating that of the ICM. We evaluated that the extended emission of JO194 is contained in an elliptical region of major axis of and of minor axis of , shown in Figure 2.
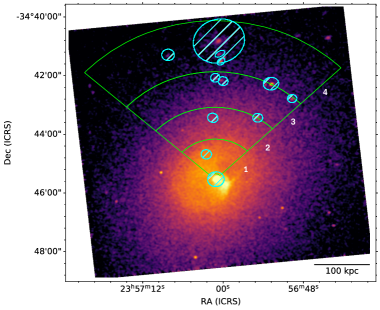
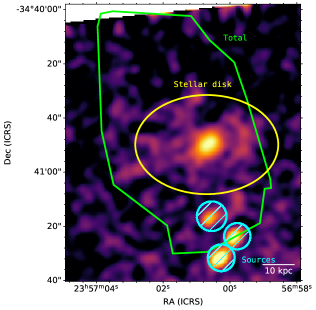
For the spectral analysis of JO194, we considered different regions: a region that follows the contours of the H emission (Poggianti et al., 2019) and resembles the X-ray emission (named “Total”), a region that traces the contour of the stellar disk (named “Disk”) (Gullieuszik et al., 2020) and a region that is the difference between the Total and the Disk regions, from now on we will call this one “Arms of JO194” because it covers the unwinding arms of the galaxy. Figure 2 shows the regions in which the spectra of JO194 are extracted in the energy band. The extraction of different regions was possible thanks to the high number of counts in all regions. Table 1 presents the total counts of the extracted spectra of JO194. The Total and Disk regions were chosen to compare the X-ray luminosities, obtained from the spectral analysis, with those obtained from the SFR found in a previous study on the H emission of JO194 (Vulcani et al., 2018) (see section 4.2).
| Total Data Counts | Rate | |
|---|---|---|
| Total | ||
| Disk | ||
| Arms |
In the spectral analysis we excluded the point sources in the field of view. Concerning the three point sources located south of JO194 (Figure 2), the MUSE optical spectra revealed that they are background galaxies at redshift , thus they were masked.
We extracted a spectrum from each region using the CIAO task specextract and we binned them to give 25 counts in each energy bin. Background spectra were extracted using blanksky files in each region. All spectra of the X-ray emission of JO194 and of the ICM were extracted separately and then were analyzed in the range.
2.4 Spectral models
To take into account that the X-ray emission of the ICM along the line of sight contaminates that of JO194, we investigated the properties of the ICM surrounding the galaxy. The spectra of the four ICM regions were fitted jointly to obtain the deprojected profiles of the ICM thermal properties. We estimated deprojected quantities by using the model projct(phabsapec) where projct is the component that executes the deprojection, phabs represents the galactic absorption and apec describes the emission of a single temperature plasma666For more information consult the website: https://heasarc.gsfc.nasa.gov/xanadu/xspec/manual/node133.html. The Galactic line-of-sight absorption was fixed to a column density value of as computed in the HI4PI survey (HI4PI Collaboration: et al., 2016). The parameters of the apec component, temperature, metallicity, and normalization, were left free to vary, while the redshift was fixed to the cluster value (Abell et al., 1989). The results of this analysis are presented in Section 3.
We modeled separately the spectra of the regions of JO194 (see Figure 2) in order to investigate the nature and the origin of the extended X-ray emission in every region. In order to have a reliable fit of the galaxy spectra, we had to take into account the ICM contamination along the line of sight. Specifically, by rescaling the ICM spectral counts of the fourth sector in the energy band (18500 net counts), and by comparing it with the net counts extracted on the galaxy in the same band (Table 1), we estimated that the ICM composes the 77 of the total counts, and the 60 of the disk’s ones. For this reason, we tested complex models made of two components: the first apec component accounts for the ICM emission along the line of sight that we modeled to the properties of the surrounding ICM ( keV, , see Section 3.1). The second component of the model represents JO194 emission. For the galactic emission, that here after is indicated with the subscript GAL, we tested different models:
-
•
an apec component that describes the X-ray emission of a single temperature plasma and can represent the SF in the galaxy;
-
•
both an apec and a pow component, this latter one describes a non-thermal emission. This model models a possible AGN emission and the contribution of unresolved High mass X-ray Binaries (HXRB);
-
•
a mkcflow777For more information see the website:https://heasarc.gsfc.nasa.gov/xanadu/xspec/manual/node193.htmlcomponent that describes the emission of a radiative cooling multi-phase plasma from a temperature to a temperature and returns the mass accretion rate (). In our analysis this model represents the ICM that cools onto the ISM;
-
•
a cemekl888For more information see the website: https://heasarc.gsfc.nasa.gov/xanadu/xspec/manual/node149.html component that describes a multi-temperature plasma where the emission measure scales with the temperature of the plasma and T has a maximum, T. From T and the index , it is possible to derive the mass-weighted temperature of the plasma, (Sun et al. (2010)).
In all models we included the Galactic line-of-sight absorption using the phabs component with (HI4PI Collaboration: et al., 2016).
For the metallicities of the ISM we used two different approaches: the first one was to set free the metallicity, the second one was to fix it to specific values. With the first approach, in some cases the resulting best-fit parameters were unreliable (see Table 4). In these cases, to model the ISM emission, we used the second approach and we adopted the metallicities of the ionized gas reported in Franchetto et al. (2020) and the metallicity of the ICM (). For the Total and Disk regions, two estimates of the oxygen abundance are provided based on different estimators: , which is based on the O3N2 indicator, and which was obtained with the PYQZ code (e.g., Dopita et al., 2013; Vogt et al., 2015). The corresponding solar metallicities were derived by the following relation:
| (2) |
where is the oxygen abundance in the sun (Asplund et al., 2009). The metallicities values obtained for the Total region are presented in the Table 2.
| Metallicity | Total | Disk |
|---|---|---|
Finally, we used C-statistic and the abundance tables presented in Asplund et al. (2009).
3 Results
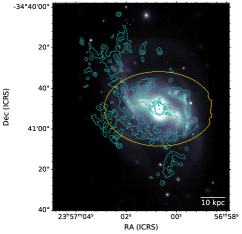
In this section, we describe the main results of the spectral analysis of the X-ray emission of the ICM of Abell 4059 and the ISM of JO194. Figure 3 shows a multi-wavelength field of JO194, in the optical, H (only contours) and X-ray energy bands.
3.1 ICM spectral analysis results
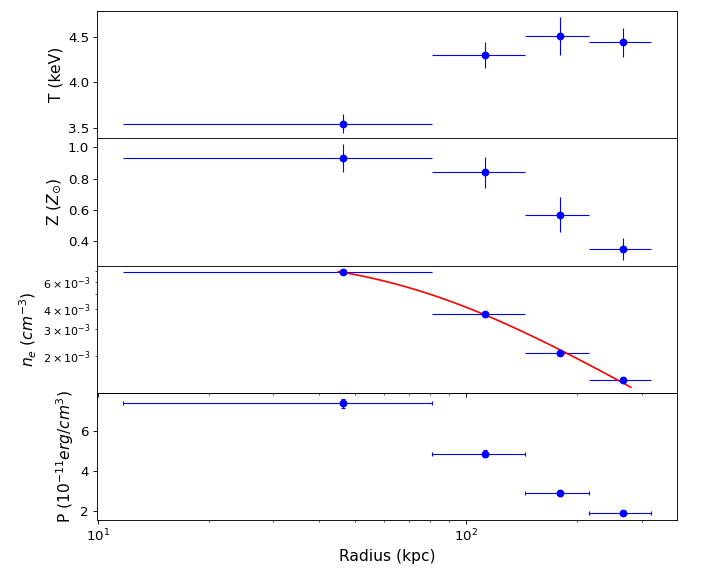
We have first estimated the properties of the ICM around JO194. The parameters that were returned from the spectral analysis were the temperature and the metallicity of the plasma. From these, we have also estimated the deprojected electron density and pressure through the following relations:
| (3) |
and
| (4) |
in which is the apec component’s normalisation, is the luminosity distance, is the volume of the spherical shell where and are the sectors’ external and internal radii, and the total density of particles is .
In Table 3 we report the deprojected properties of the ICM for every annulus. In Figure 4 the deprojected radial profiles of the properties of the ICM are shown. The electron density profile was fitted with a -model to constrain the deprojected ICM density profile. The best-fit parameters are: and core radius . These values are consistent with those reported in Section 2.2.
| Property | Annulus 1 | Annulus 2 | Annulus 3 | Annulus 4 |
|---|---|---|---|---|
| - | ||||
| kT(keV) | ||||
| Z() | ||||
| P() |
3.2 Galaxy spectral analysis results
As previously introduced in Section 2.4, we modeled the spectrum extracted over the galaxy as the combination of the ICM, represented by an apec component, and galactic emissions, indicated by the subscript GAL. Therefore the temperature, the metallicity and the redshift parameters of the first apec component were set to those measured in the region including JO194 (i.e., the fourth sector of the ICM analysis) that are , , and (see Table 3). The second component of the model, that is the galactic emission, was tested among all the components shown in the list in Section 2.3.
The best-fit results are reported in Table 4. We selected the best-fitting model based on the final statistics (i.e., best agreement with the data) and the physical significance (i.e., we rejected those models which provided a good fit with unphysical parameters, such as a temperature significantly higher than the one of the ICM, or an extremely low metallicity). In summary, we observe that:
-
•
The “Total” spectrum is well reproduced by two different models. The first one is the phabs(apec+cemekl) with the cemekl maximum temperature fixed to the ICM temperature and metallicity fixed to the values shown in Section 2.4. This model yields a mass weighted temperature of . The second model is phabs(apec+apec) that measured an average X-ray temperature of the galactic component of , which is consistent with those of other jellyfish galaxies (see Section 4.4);
-
•
The best-fitting models for the galactic disk are phabs(apec+apec) with the second apec metallicity fixed to the values shown in Section 2.4 and the model phabs(apec+pow) with the metallicity of the apec component fixed to the values of the stellar disk. Due to the low statistics, the Disk spectrum showed large uncertainties above 2 keV that resulted in small values of the reduced chi-square (). In the phabs(apec+pow) model the ICM emission contribution seems to be negligible, but this is at odds with the previous results because the ICM contributes far more than the 60 of the emission in the disk (see Section 2.4). In addition, the resulting luminosity of the powGAL component is not consistent with that we expect from the current SFR. By adopting the -SFR relation for point sources, in the energy band, presented in Mineo et al. (2012) (), the current SFR in the disk of JO194 ( M⊙ yr-1 Vulcani et al., 2018) entails a luminosity of erg s-1, that is more than an order of magnitude lower than we measured from the spectral analysis. Therefore the powGAL model is not a reliable description of the disk emission, and we dismiss this model in the following analysis. We argue that the powGAL model fit goodness turns out solely from the fact that, due to the poor statistics of the current data, it tentatively fits the spectrum above .
-
•
The spectrum of JO194 arms is well reproduced by two different models. The first one is the phabs(apec+apec) model with the metallicity of the two apec component fixed to . This model provides an estimate of the average temperature of arms’ X-ray plasma (). The second one is the phabs(apec+mkcflow) model with fixed to the value of the surrounding ICM ( keV). The best-fit model yields a mass flow of yr-1 and a metallicity of , which may be the first direct measure of the metallicity of the X-ray plasma in the arms of a jellyfish galaxy. The implications of these results are discussed in Section 4.
| Region | Model | Fixed Parameters | Parameters of the galactic component | |
| dof | ||||
| Total | phabs(apec+apec) | |||
| phabs(apec+cemekl) | , | , | ||
| , | ||||
| , | ||||
| , | ||||
| Disk | phabs(apec+apec) | , | ||
| , | , | |||
| , | ||||
| , | , | |||
| phabs(apec+pow) | , | |||
| , | ||||
| Arms | phabs(apec+apec) | |||
| phabs(apec+mkcflow) | , | , | ||
| , | ||||
Notes: kT is the average temperature of the galactic plasma, is the index of the powerlaw that describes how the emission measure scales with the temperature of the galaxy, is the photon index of the power law, is the lowest temperature of the galactic plasma and is the mass accretion rate. The fluxes and the luminosities refer to the galactic component and were measured in energy band.
4 Discussion
4.1 Characteristics of the galaxy at different wavelengths
From the analysis of JO194 in the optical and H energy bands, it was argued that in the center of the galaxy is located a Low Ionization Nuclear Emission-line Region (LINER) AGN (Poggianti et al., 2017). From our analysis, we concluded that in the energy band (see Figure 3) there is no hard X-ray emission in the center of JO194. For reference, we derive an upper limit of its luminosity in the 0.5-10 keV band of erg s-1. This evidence challenges the hypothesis of an AGN sitting at the center of JO194, as already discussed in Radovich et al. (2019). For the conclusive analysis of the core region of JO194, we refer to Moretti et al., in preparation.
Concerning the disk in the three different energy bands, an arc of emission is visible on the right side of the disk due to an intense star formation (see Figure 3).
Figure 3 shows the comparison between the morphology of JO194 in the optical, H (only contours) and X-ray energy band. JO194 is characterized by an extended emission outside the stellar disk visible in each of these energy bands. In Figure 3, we used the residual image of the galaxy. The morphology of the galaxy is more distinguishable in the residual image because the surface brightness excess relative to the ICM emission is highlighted. Figure 3 shows the hard X-ray emission () of the galaxy for the analysis of the core region of JO194. This image was used to test if there is an excess of hard X-ray emission due to the AGN. The lack of the emission at the center of this galaxy challenges the hypothesis of the presence of the AGN.
4.2 Origin of the X-ray emission
The X-ray extended emission of late-type, star-forming galaxies is produced by the thermal emission of gas heated by young, massive stars, and the non-thermal X-ray emission of High Mass X-ray Binaries (HMXB) (e.g. Mineo et al., 2013). To investigate if this is the case also in JO194, we compared the observed X-ray luminosities with those expected from the ongoing star formation rates (SFR) measured in Vulcani et al. (2018). In Vulcani et al. (2018) the SFR were estimated from the H emission using the relation SFR ( yr-1) = . The SFR values for the disk and all the entire galaxy are SFR and SFR. Following the relation presented in Poggianti et al. (2019b):
| (5) |
we calculated the corresponding X-ray luminosity, , in the energy band , which are, respectively, and for the total and disk region.
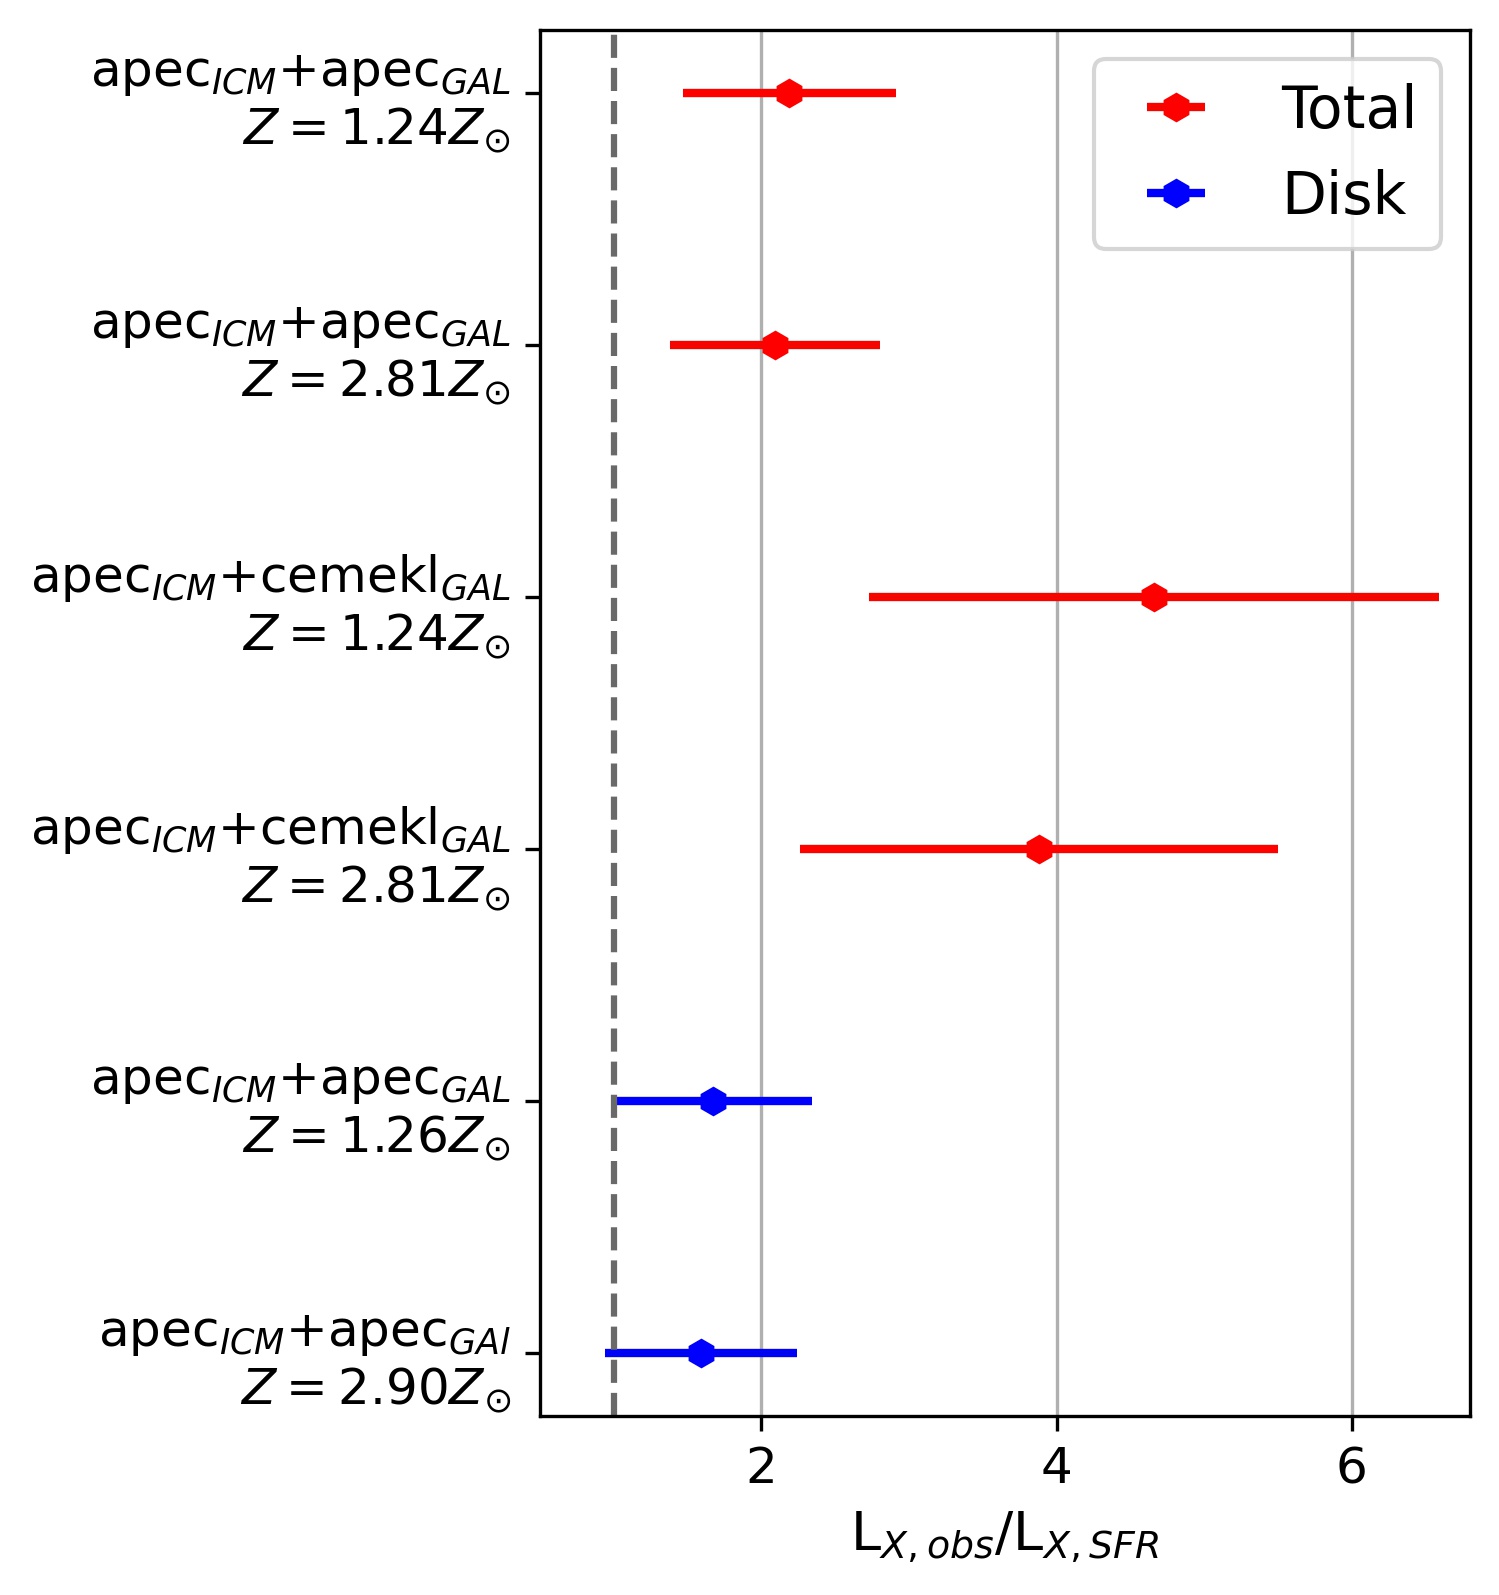
The comparison between the observed and estimated X-ray luminosities is shown in Figure 5. It emerges that, in the Total region, the observed X-ray luminosities are in excess with respect to what expected from the current SFR. Specifically, the excesses are by a factor of and for the different spectral models. This indicates that the X-ray emission of JO194 cannot be the result of the star formation activity alone, and instead is produced by a different process. However in the disk, where most of the star formation takes place (Poggianti et al., 2019a), the luminosities are marginally consistent with each other ( and , where are the luminosities of the model phabs(apec+apec)). Therefore, we speculate that this additional process is more pronounced in the total galaxy than in the disk. Due to the fact that the total region actually includes the disk itself, we suggest that this additional channel to form the X-ray plasma is taking place mostly in the regions of the galaxy outside of the disk, that are the unwinding arms.
We note that similar X-ray luminosity excesses () have been observed also in Poggianti et al. (2019b) for JW100, and Campitiello et al. (2021) for JO201. These discrepancy in X-ray luminosities further corroborate the idea that the star formation alone cannot provide the total X-ray luminosity, so, as already suggested in the literature, additional processes must concur in the origin of the X-ray emission in jellyfish galaxies.
The spectral analysis results (Table 4) allows to speculate on the origin of the X-ray plasma. To begin with, our results rule out the hypothesis that the X-ray emission could be powered by the SFR alone, either the nonthermal emission from HMXB or the thermal emission. On the other hand, the average temperature and the X-ray luminosity excess resemble the results previously reported in literature for other ram pressure stripped galaxies (e.g., Sun et al., 2010; Zhang et al., 2013; Poggianti et al., 2019; Campitiello et al., 2021; Sun et al., 2021). Therefore, as concluded by the previous studies, we argue that the X-ray plasma in JO194 may be the outcome of the interaction between ICM and ISM triggered by RPS. However, the nature of the interaction is poorly understood.
In this work we add a new piece to the puzzle. The X-ray spectrum of J0194’s arms is reasonably described by the model phabs(apec+mkcflow) that is the sum of the ICM thermal emission along the line-of-sight, and the emission of the hot plasma cooling onto the galaxy. Although this fitting model has a reduced slightly larger than the competing phabs(apec+apec) model (see Table 4), it allows the first solid metallicity measurement of the hot plasma generated by the interaction between ICM and ISM (). This value is compatible within the uncertainties with the ICM abundance (). This result would support the idea that the X-ray emission is produced by the radiative cooling of the metal-poor ICM onto JO194. The ICM cooling in cool-core clusters has been observed to be associated with extended H emission (Voit & Donahue, 1997). Therefore, we tested if the H luminosity expected from the ICM radiative cooling was consistent with the upper limit imposed by the observed H luminosity of JO194 ( erg s-1). The cooling H luminosity is:
| (6) |
where is the mass cooling rate in units of 100 solar masses per year. The resulting luminosity is negligible with respect to the observed H luminosity due to star formation (). We conclude that the ICM radiative cooling scenario does not violate the observations, and the warm gas in JO194 is mostly photoionized by the star formation.
However, the observed physical parameters of the ICM ( keV, ) imply that the ICM cooling time (e.g., Sarazin, 1986b) is of the order of , thus resulting much larger than the Hubble time. Therefore, the pure ICM radiative cooling cannot be the only origin of the X-ray emission. A previous phase of ISM-ICM mixing seems to be necessary to rise the density and lower the temperature of the ICM, which entail a decrease of its cooling time (e.g., Gronke & Oh, 2018; Fielding et al., 2020), and stimulates the radiative cooling, that results in the extended X-ray emission. Indeed Franchetto et al. (2021) already reported on evidence of ISM-ICM mixing, traced by metallicity gradients, in the stripped tails of jellyfish galaxies.
4.3 Connections between X-ray and H surface brightness
In order to unfold the connection between X-ray emitting plasma and the warm gas in the galaxy, we studied the ratios between the X-ray () and the H () surface brightness in the arms, the disk and the total region that represent JO194. Previous evidence of a spatial correlation between X and H have been presented in Poggianti et al. (2019b); Campitiello et al. (2021); Sun et al. (2021). The ratio can be a signature of the physical process that produce the warm and hot gas. In case of X-ray and H emission both powered by star formation, the expected ratio can be estimated by combining Equation 5 with the SFR(H) relation reported in Section 4.2 resulting in:
| (7) |
In the case of jellyfish galaxies, Sun et al. (2021) observed that in their tails holds a different, higher ratio of:
| (8) |
which could be evidence of a different origin of the X-ray plasma with respect to the star formation, that is the interaction between the ISM and the ICM.
In the case of JO194, we computed the average X-ray surface brightness by dividing the fluxes of the galactic component in the 0.5-10.0 keV band corrected for the absorption (see Table 4) by the surface of the respective regions (Figure 2). The corresponding H surface brightness derived by dividing the H flux measured in the Total, Disk and Arms regions from the emission-only, dust-corrected MUSE image in the spaxels with (Figure 3) by the total area of the corresponding regions. The resulting of total, disk and arms are, respectively, 0.9, 2.2 and . The are shown in Figure 6, together with the ratios reported in Equation 7 (magenta) and 8 (blue).
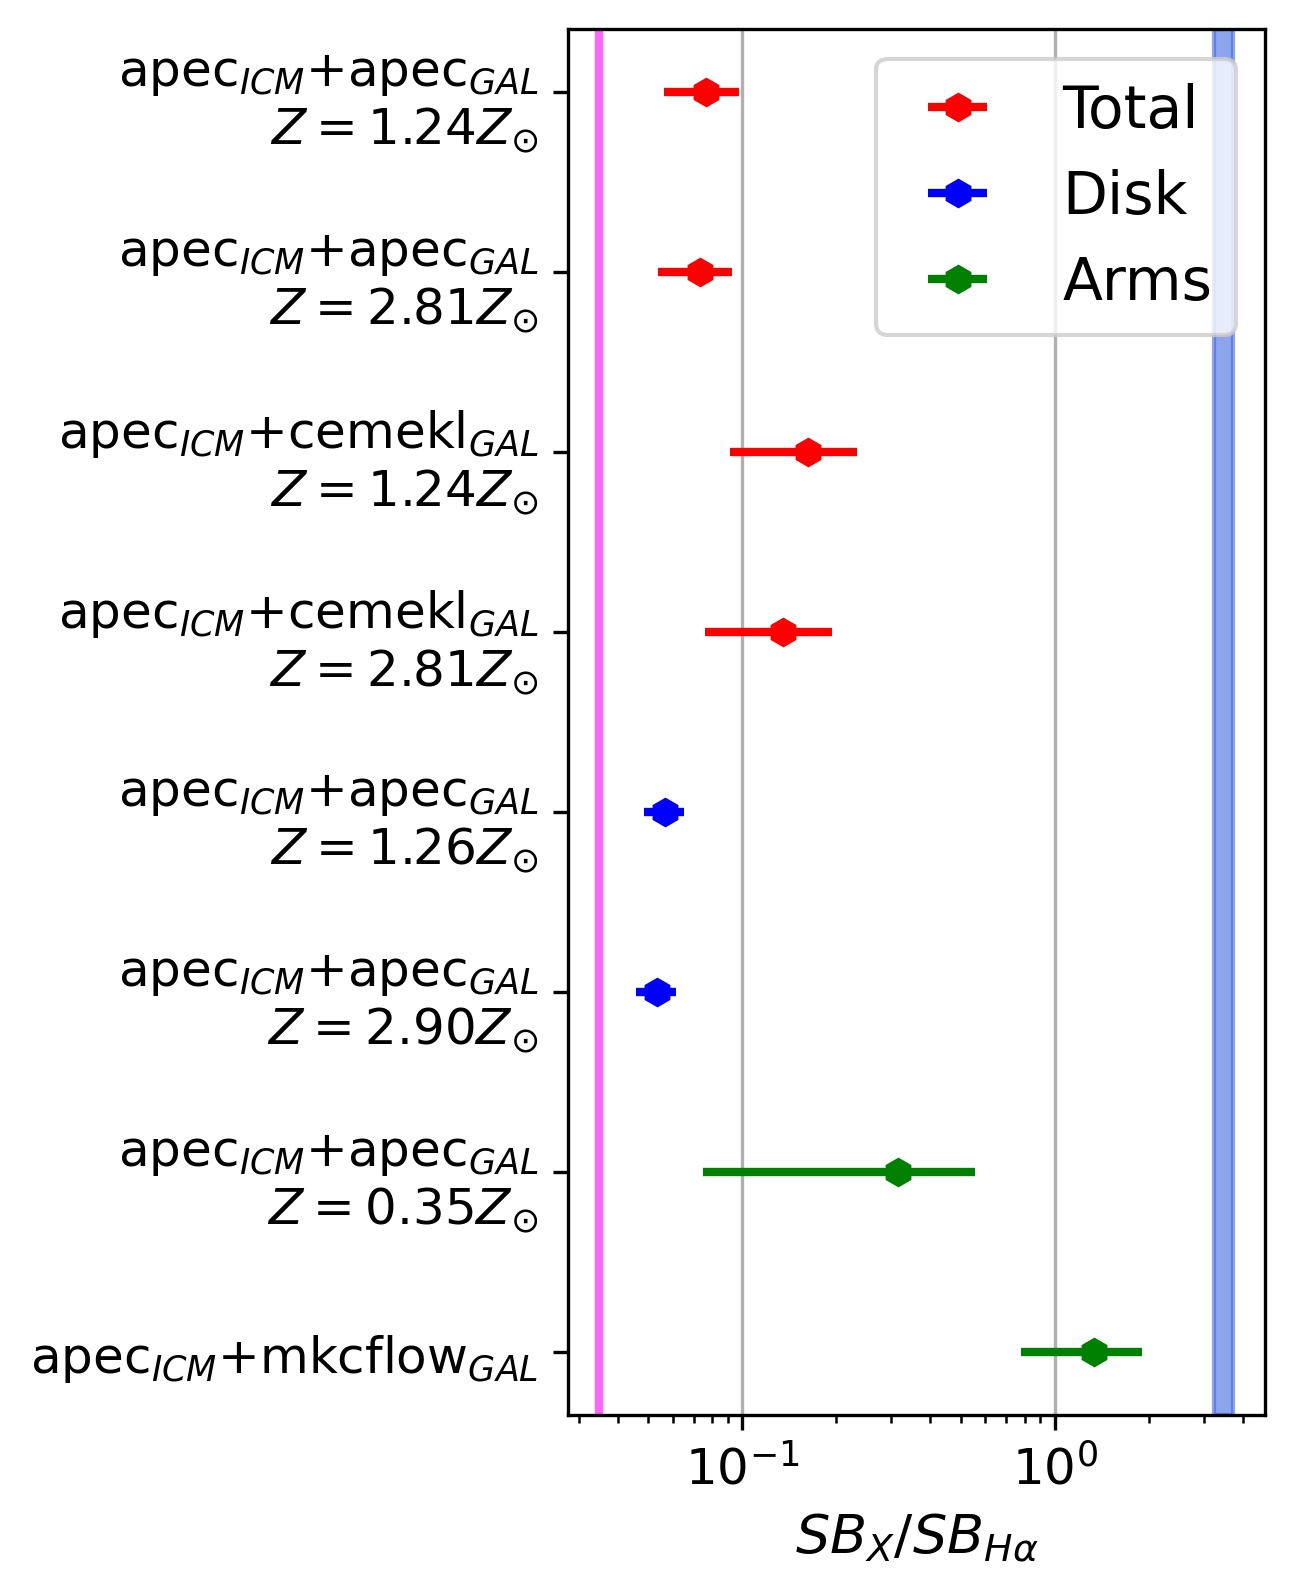
The measured for JO194 are in between the values reported in in Equation 7 and 8, with the disk and total being closer to the former, and the arms’ mkcflow model being closer to the latter. Nevertheless, the measured for the arms is not in agreement with the ratio presented in Sun et al. (2021). This result may suggest that the X-ray emission in the disk is mainly powered by the local star formation, whereas this is not true for the arms. In this case, the fact that the observed ratios are lower than the values observed in jellyfish galaxies’ tails (see Equation 8) might indicate that the stripped arms are not fully evolved into a tail, at least in terms of X-ray properties. We speculate that the galaxy is still in an early stage of its evolution into a jellyfish galaxy, so in the stripped arms the ICM and ISM have not reach yet the balance observed in the other, more evolved jellyfish galaxies.
4.4 Comparison with other GASP jellyfish galaxies
| Properties | JO194 | JO201 | JW100 |
|---|---|---|---|
| () | |||
| 0.17 | 0.18 | 0.06 | |
| () | |||
| Mach Number | |||
| Ram Pressure () |
We compare the results of our study with the previous studies of the GASP galaxies JO201 (Poggianti et al., 2019) and JW100 (Poggianti et al., 2019b) (see Table 5). Although these galaxies are different in terms of stellar mass, velocity and environment properties, they show several similarities in their X-ray emission. These can help understanding the origin of the X-ray emitting plasma and the evolution of the galaxies subjected to ram pressure stripping.
Specifically, these galaxies share the following properties:
-
•
The observed X-ray luminosity for the three galaxies exceeds by a factor that expected from the current SFR inferred from the H emission;
-
•
The galactic average X-ray temperatures derived using a single apec model is in between and keV. This value is neither consistent with the temperature of the surrounding ICM (), nor the usual temperature of the X-ray emitting plasma in star-forming spiral galaxy ( and , e.g., Owen & Warwick, 2009). In addition, this value is in agreement with the typical temperatures of X-ray tails of cluster late-type galaxies ( keV, Sun et al., 2021). The fact that these systems, despite different environmental conditions and evolutionary stage, have consistently developed extended X-ray plasma with similar properties suggests that the process which originated this hot plasma is both fast and stable.
-
•
The Mach number of the GASP galaxies are similar: . Though the considered jellyfish galaxies are located in different environments (i.e., different ICM sound speed), this similarity implies that the galaxies are moving at supersonic velocities and are subjected to similar hydrodynamical phenomena like mixing or shock heating;
-
•
The ICM thermal pressure surrounding these galaxies ranges between 1.87 and 3.41 erg cm-3. These values are consistent with the threshold of erg cm-2 defined in Tonnesen et al. (2011) for the formation of bright H and X-ray filaments. Also the ram pressure felt by these galaxies appears to be similar ( erg cm-3), however these estimates are limited by the fact that the the total velocities of these galaxies are still unknown;
-
•
These galaxies show extended, nonthermal radio emission (Ignesti et al., 2022, , Müller et al., in preparation). As previously outlined in Müller et al. (2021) and Ignesti et al. (2022), the co-existence of radio and X-ray extended emission could be explained by the ICM draping (e.g., Pfrommer & Dursi, 2010). By accreting hot, magnetized ICM, the magnetic field in jellyfish galaxies’s tails can be amplified thus resulting in extended radio emission. In the case of JO194, the accretion and cooling of hot ICM onto the spiral arms would be consistent with the result of the spectral analysis (see Section 3.2).
5 Summary and conclusions
We analyzed an archival Chandra observation of the cluster Abell 4059, focusing on the spectral analysis of the X-ray emission associated to jellyfish galaxy JO194. We investigated different regions of the galaxy, named Total, Disk, and Arms of JO194, where the latter indicates the Total region without the Disk. We found that the X-ray emission comes from a plasma with a temperature of , which is in line with the previous results reported for similar galaxies. The spectral analysis of the arms estimate of the hot plasma metallicity, that is . This value is consistent with that of the surrounding ICM, therefore we argue that the X-ray emission could be produced by the ICM that is cooling onto the cold ISM.
We compared the X-ray luminosities obtained by the spectral analysis of the disk and total with the X-ray luminosities associated with the current SFR, finding an excess of factor over the entire galaxy. This indicates that the star formation cannot be the only responsible for the X-ray emission of the galaxy. Moreover, we showed that the excess is predominant in the arms of the galaxy. Therefore, we suggest that the X-ray plasma pervading JO194 may be produced by the interplay between ICM and ISM, which results in the cooling of the former onto the galaxy. In order to explain the observed temperature of the X-ray plasma ( keV), we conclude that ICM cooling likely takes place initially via mixing between the ICM and ISM, which stimulates the subsequent phase of radiative cooling that, in turn, might result in the extended X-ray emission observed by Chandra.
In order to probe the nature of the interaction between ISM and ICM, we compared the ratio between the observed X-ray and the H surface brightness with that measured in the tails of jellyfish galaxies. We found that the surface brightness ratios in the arms of JO194 are smaller than what is observed in the other ram pressure stripped galaxies. This might indicate that, at least in terms of X-ray properties and ISM-ICM balance, the arms of JO194 are still in an early stage of the evolution into a stripped tail.
Finally, we compared the X-ray properties of GASP jellyfish galaxies, finding them in agreement with each other. Therefore, we suggest that the conditions required to induce extended X-ray emission in jellyfish galaxies, that is the production of hot plasma via ICM-ISM interplay (either via ICM cooling or ISM heating), are established at the beginning of the stripping, and they can persist on long time-scales, so that galaxies in different environments and evolutionary stage can present similar thermal properties.
Acknowledgements
We thank the Referee for the suggestions that improved the presentation of the results. A.I., B.V. acknowledge the Italian PRIN-Miur 2017 (PI A. Cimatti). A.W. acknowledges financial support from ASI through the ASI-INAF agreements 2017-14-H.0. J.F. acknowledges financial support from the UNAM- DGAPA-PAPIIT IN111620 grant, México. We acknowledge funding from the INAF main-stream funding programme (PI B. Vulcani). We acknowledge financial contribution from the agreement ASI-INAF n.2017-14- H.0 (PI A. Moretti). Based on observations collected at the European Organization for Astronomical Research in the Southern Hemisphere under ESO programme 196.B-0578. This project has received funding from the European Research Council (ERC) under the European Union’s Horizon 2020 research and innovation programme (grant agreement No. 833824). This research made use of Astropy, a community-developed core Python package for Astronomy (Astropy Collaboration et al., 2013, 2018), and APLpy, an open-source plotting package for Python (Robitaille & Bressert, 2012). C.B. thanks Chinotto for all the constant, purrfect distractions he made during the preparation of the paper. A.I. thanks the Tokyo Ska Paradise Orchestra’s music for providing the inspiration during the preparation of the draft.
References
- Abell et al. (1989) Abell, G. O., Corwin, H. G., & Olowin, R. P. 1989, IA The Astrophysical Journal Supplement Series, 70, 1
- Arnaud (1996) Arnaud, K. A. 1996, in Astronomical Society of the Pacific Conference Series, Vol. 101, Astronomical Data Analysis Software and Systems V, ed. G. H. Jacoby & J. Barnes, 17
- Asplund et al. (2009) Asplund, M., Grevesse, N., Sauval, A. J., & Scott, P. 2009, ARA&A, 47, 481, doi: 10.1146/annurev.astro.46.060407.145222
- Astropy Collaboration et al. (2013) Astropy Collaboration, Robitaille, T. P., Tollerud, E. J., et al. 2013, A&A, 558, A33, doi: 10.1051/0004-6361/201322068
- Astropy Collaboration et al. (2018) Astropy Collaboration, Price-Whelan, A. M., Sipőcz, B. M., et al. 2018, AJ, 156, 123, doi: 10.3847/1538-3881/aabc4f
- Bellhouse et al. (2017) Bellhouse, C., Jaffé, Y. L., Hau, G. K. T., et al. 2017, ApJ, 844, 49, doi: 10.3847/1538-4357/aa7875
- Bellhouse et al. (2021) Bellhouse, C., McGee, S. L., Smith, R., et al. 2021, Monthly Notices of the Royal Astronomical Society, 500, 1285, doi: 10.1093/mnras/staa3298
- Boselli, A. et al. (2016) Boselli, A., Cuillandre, J. C., Fossati, M., et al. 2016, A&A, 587, A68, doi: 10.1051/0004-6361/201527795
- Burke et al. (2020) Burke, D., Laurino, O., wmclaugh, et al. 2020, sherpa/sherpa: Sherpa 4.12.1, 4.12.1, Zenodo, doi: 10.5281/zenodo.3944985
- Campitiello et al. (2021) Campitiello, M. G., Ignesti, A., Gitti, M., et al. 2021, ApJ, 911, 144, doi: 10.3847/1538-4357/abec82
- Cash (1979) Cash, W. 1979, ApJ, 228, 939, doi: 10.1086/156922
- Cavaliere & Fusco-Femiano (1976) Cavaliere, A., & Fusco-Femiano, R. 1976, Astronomy and Astrophysics, 49, 137
- Chabrier (2003) Chabrier, G. 2003, Publications of the Astronomical Society of the Pacific, 115, 763
- Choi et al. (2004) Choi, Y. Y., Reynolds, C. S., Heinz, S., et al. 2004, ArXiv e-prints, 1795, 1, doi: 10.1086/382941
- Chung et al. (2009) Chung, E. J., Rhee, M.-H., Kim, H., et al. 2009, The Astrophysical Journal Supplement Series, 184, 199, doi: 10.1088/0067-0049/184/2/199
- Cowie et al. (1977) Cowie, L. L., Songaila, A., Cowie, L. L., & Songaila, A. 1977, Natur, 266, 501, doi: 10.1038/266501A0
- Davies & Lewis (1973) Davies, R. D., & Lewis, B. M. 1973, MNRAS, 165, 231, doi: 10.1093/mnras/165.2.231
- Doe et al. (2007) Doe, S., Nguyen, D., Stawarz, C., et al. 2007, in Astronomical Society of the Pacific Conference Series, Vol. 376, Astronomical Data Analysis Software and Systems XVI, ed. R. A. Shaw, F. Hill, & D. J. Bell, 543
- Dopita et al. (2013) Dopita, M. A., Sutherland, R. S., Nicholls, D. C., Kewley, L. J., & Vogt, F. P. A. 2013, The Astrophysical Journal Supplement Series, 208, 10, doi: 10.1088/0067-0049/208/1/10
- Fielding et al. (2020) Fielding, D. B., Ostriker, E. C., Bryan, G. L., & Jermyn, A. S. 2020, ApJ, 894, L24, doi: 10.3847/2041-8213/ab8d2c
- Franchetto et al. (2020) Franchetto, A., Vulcani, B., Poggianti, B. M., et al. 2020, The Astrophysical Journal, 895, 106, doi: 10.3847/1538-4357/ab8db9
- Franchetto et al. (2021) Franchetto, A., Tonnesen, S., Poggianti, B. M., et al. 2021, ApJ, 922, L6, doi: 10.3847/2041-8213/ac3664
- Freeman et al. (2001) Freeman, P., Doe, S., & Siemiginowska, A. 2001, in Society of Photo-Optical Instrumentation Engineers (SPIE) Conference Series, Vol. 4477, Astronomical Data Analysis, ed. J.-L. Starck & F. D. Murtagh, 76–87, doi: 10.1117/12.447161
- Fritz et al. (2017) Fritz, J., Moretti, A., Gullieuszik, M., et al. 2017, ApJ, 848, 132, doi: 10.3847/1538-4357/aa8f51
- Fruscione et al. (2006) Fruscione, A., McDowell, J. C., Allen, G. E., et al. 2006, in Society of Photo-Optical Instrumentation Engineers (SPIE) Conference Series, Vol. 6270, Society of Photo-Optical Instrumentation Engineers (SPIE) Conference Series, ed. D. R. Silva & R. E. Doxsey, 62701V, doi: 10.1117/12.671760
- Fumagalli et al. (2014) Fumagalli, M., Fossati, M., Hau, G. K. T., et al. 2014, Monthly Notices of the Royal Astronomical Society, 445, 4335, doi: 10.1093/mnras/stu2092
- Giovanelli & Haynes (1988) Giovanelli, R., & Haynes, M. P. 1988, in Galactic and Extragalactic Radio Astronomy, ed. K. I. Kellermann & G. L. Verschuur, 522–562
- Gronke & Oh (2018) Gronke, M., & Oh, S. P. 2018, MNRAS, 480, L111, doi: 10.1093/mnrasl/sly131
- Gullieuszik et al. (2020) Gullieuszik, M., Poggianti, B. M., McGee, S. L., et al. 2020, The Astrophysical Journal, 899, 13, doi: 10.3847/1538-4357/aba3cb
- Gunn & Gott (1972) Gunn, J. E., & Gott, J. Richard, I. 1972, ApJ, 176, 1, doi: 10.1086/151605
- HI4PI Collaboration: et al. (2016) HI4PI Collaboration:, Ben Bekhti, N., Flöer, L., et al. 2016, A&A, 594, A116, doi: 10.1051/0004-6361/201629178
- Huang & Sarazin (1998) Huang, Z., & Sarazin, C. L. 1998, The Astrophysical Journal, 496, 728, doi: 10.1086/305406
- Ignesti et al. (2022) Ignesti, A., Vulcani, B., Poggianti, B. M., et al. 2022, ApJ, 924, 64, doi: 10.3847/1538-4357/ac32ce
- Jaffé et al. (2018) Jaffé, Y. L., Poggianti, B. M., Moretti, A., et al. 2018, Monthly Notices of the Royal Astronomical Society, 476, 4753, doi: 10.1093/MNRAS/STY500
- Laganá et al. (2019) Laganá, T. F., Souza, G. S., MacHado, R. E., Volert, R. C., & Lopes, P. A. 2019, Monthly Notices of the Royal Astronomical Society, 487, 3922, doi: 10.1093/mnras/stz1575
- Mernier et al. (2015) Mernier, F., de Plaa, J., Lovisari, L., et al. 2015, Astronomy & Astrophysics, 575, A37, doi: 10.1051/0004-6361/201425282
- Mineo et al. (2013) Mineo, S., Gilfanov, M., Lehmer, B. D., Morrison, G. E., & Sunyaev, R. 2013, Monthly Notices of the Royal Astronomical Society, 437, 1698, doi: 10.1093/mnras/stt1999
- Mineo et al. (2012) Mineo, S., Gilfanov, M., & Sunyaev, R. 2012, MNRAS, 419, 2095, doi: 10.1111/j.1365-2966.2011.19862.x
- Müller et al. (2021) Müller, A., Ignesti, A., Poggianti, B., et al. 2021, Galaxies, 9, 116, doi: 10.3390/galaxies9040116
- Müller et al. (2020) Müller, A., Poggianti, B. M., Pfrommer, C., et al. 2020, Nature Astronomy, 5, 159–168, doi: 10.1038/s41550-020-01234-7
- Nulsen (1982) Nulsen, P. E. J. 1982, Monthly Notices of the Royal Astronomical Society, 198, 1007, doi: 10.1093/mnras/198.4.1007
- Owen & Warwick (2009) Owen, R. A., & Warwick, R. S. 2009, MNRAS, 394, 1741, doi: 10.1111/j.1365-2966.2009.14464.x
- Peluso et al. (2022) Peluso, G., Vulcani, B., Poggianti, B. M., et al. 2022, ApJ, 927, 130, doi: 10.3847/1538-4357/ac4225
- Pfrommer & Dursi (2010) Pfrommer, C., & Dursi, L. 2010, Nature Physics, 6, 520, doi: 10.1038/nphys1657
- Poggianti et al. (2016) Poggianti, B. M., Fasano, G., Omizzolo, A., et al. 2016, AJ, 151, 78, doi: 10.3847/0004-6256/151/3/78
- Poggianti et al. (2017) Poggianti, B. M., Jaffé, Y. L., Moretti, A., et al. 2017, Nature, 548, 304, doi: 10.1038/nature23462
- Poggianti et al. (2017) Poggianti, B. M., Moretti, A., Gullieuszik, M., et al. 2017, The Astrophysical Journal, 844, 48, doi: 10.3847/1538-4357/aa78ed
- Poggianti et al. (2019a) Poggianti, B. M., Gullieuszik, M., Tonnesen, S., et al. 2019a, Monthly Notices of the Royal Astronomical Society, 482, 4466, doi: 10.1093/mnras/sty2999
- Poggianti et al. (2019b) Poggianti, B. M., Ignesti, A., Gitti, M., et al. 2019b, The Astrophysical Journal, 887, 155, doi: 10.3847/1538-4357/ab5224
- Poggianti et al. (2019) Poggianti, B. M., Gullieuszik, M., Tonnesen, S., et al. 2019, MNRAS, 482, 4466, doi: 10.1093/mnras/sty2999
- Radovich et al. (2019) Radovich, M., Poggianti, B., Jaffé, Y. L., et al. 2019, MNRAS, 486, 486, doi: 10.1093/mnras/stz809
- Reynolds et al. (2008) Reynolds, C. S., Casper, E. A., & Heinz, S. 2008, The Astrophysical Journal, 679, 1181, doi: 10.1086/587456
- Robitaille & Bressert (2012) Robitaille, T., & Bressert, E. 2012, APLpy: Astronomical Plotting Library in Python. http://ascl.net/1208.017
- Sarazin (1986a) Sarazin, C. L. 1986a, Reviews of Modern Physics, 58, 1, doi: 10.1103/RevModPhys.58.1
- Sarazin (1986b) —. 1986b, Reviews of Modern Physics, 58, 1, doi: 10.1103/RevModPhys.58.1
- Schwartz et al. (1991) Schwartz, D. A., Bradt, H. V., Remillard, R. A., et al. 1991, ApJ, 376, 424, doi: 10.1086/170291
- Solanes et al. (2001) Solanes, J. M., Manrique, A., García-Gómez, C., et al. 2001, ApJ, 548, 97, doi: 10.1086/318672
- Sun et al. (2009) Sun, M., Donahue, M., Roediger, E., et al. 2009, The Astrophysical Journal, 708, 946–964, doi: 10.1088/0004-637x/708/2/946
- Sun et al. (2010) Sun, M., Donahue, M., Roediger, E., et al. 2010, ApJ, 708, 946, doi: 10.1088/0004-637X/708/2/946
- Sun et al. (2006) Sun, M., Jones, C., Forman, W., et al. 2006, ApJ, 637, L81, doi: 10.1086/500590
- Sun & Vikhlinin (2005) Sun, M., & Vikhlinin, A. 2005, The Astrophysical Journal, 621, 718–724, doi: 10.1086/427728
- Sun et al. (2021) Sun, M., Ge, C., Luo, R., et al. 2021
- Tonnesen et al. (2011) Tonnesen, S., Bryan, G. L., & Chen, R. 2011, ApJ, 731, 98, doi: 10.1088/0004-637X/731/2/98
- Tschöke, D. et al. (2001) Tschöke, D., Bomans, D. J., Hensler, G., & Junkes, N. 2001, A&A, 380, 40, doi: 10.1051/0004-6361:20011354
- Varela et al. (2009) Varela, J., D’Onofrio, M., Marmo, C., et al. 2009, A&A, 497, 667, doi: 10.1051/0004-6361/200809876
- Vogt et al. (2015) Vogt, F. P. A., Dopita, M. A., Borthakur, S., et al. 2015, Monthly Notices of the Royal Astronomical Society, 450, 2593, doi: 10.1093/mnras/stv749
- Voit & Donahue (1997) Voit, G. M., & Donahue, M. 1997, ApJ, 486, 242, doi: 10.1086/304509
- Vulcani et al. (2018) Vulcani, B., Poggianti, B. M., Gullieuszik, M., et al. 2018, ApJ, 866, L25, doi: 10.3847/2041-8213/aae68b
- Vulcani et al. (2020) Vulcani, B., Poggianti, B. M., Tonnesen, S., et al. 2020, ApJ, 899, 98, doi: 10.3847/1538-4357/aba4ae
- Werle et al. (2022) Werle, A., Poggianti, B., Moretti, A., et al. 2022, ApJ, 930, 43, doi: 10.3847/1538-4357/ac5f06
- Zhang et al. (2013) Zhang, B., Sun, M., Ji, L., et al. 2013, The Astrophysical Journal, 777, 122, doi: 10.1088/0004-637x/777/2/122