Dark matter search with the BDX-MINI experiment
Abstract
BDX-MINI is a beam dump experiment optimized to search for Light Dark Matter produced in the interaction of the intense CEBAF 2.176 GeV electron beam with the Hall A beam dump at Jefferson Lab. The BDX-MINI detector consists of a PbWO4 electromagnetic calorimeter surrounded by a hermetic veto system for background rejection. The experiment accumulated EOT in six months of running. Simulations of fermionic and scalar Dark Matter interactions with electrons of the active volume of the BDX-MINI detector were used to estimate the expected signal. Data collected during the beam-off time allowed us to characterize the background dominated by cosmic rays. A blind data analysis based on a maximum-likelihood approach was used to optimize the experiment sensitivity. An upper limit on the production of light dark matter was set using the combined event samples collected during beam-on and beam-off configurations. In some kinematics, this pilot experiment is sensitive to the parameter space covered by some of the most sensitive experiments to date, which demonstrates the discovery potential of the next generation beam dump experiment planned at intense electron beam facilities.
pacs:
123456789I Introduction and Theoretical framework
Many astrophysical observations as well as anomalies in processes involving electromagnetic currents (e.g. the muon anomalous magnetic moment) could be reconciled assuming the existence of a new kind of matter, not directly interacting with light, called Dark Matter (DM) [1, 2]. While gravitational effects of DM are quite well established, despite the tremendous efforts being devoted to reveal the nature of DM in terms of new elementary particles, no clear results have been obtained to date. Experimental efforts have mainly focused on direct detection of galactic DM within the so called “WIMPs paradigm” that assumes the existence of slow-moving cosmological weakly interacting particles with mass larger than 1 GeV [3, 4, 5]. Due to the lack of evidence in “traditional” DM searches, there has been increased experimental activity directed toward the search for light DM (LDM) in the MeV-GeV mass range [6, 7, 8, 9]. This largely unexplored mass region is theoretically well justified with the assumption that DM has a thermal origin [10, 11]. If dark and visible matter had sufficiently large interactions to achieve thermal equilibrium during the early phases of the nascent universe, due to the Hubble expansion that diluted the DM number density, the annihilation rate correspondingly lessened becoming fixed for all subsequent times thereafter. Therefore, in this hypothesis there has been a sufficiently high DM annihilation rate to have depleted any excess abundance in order to agree with our present day observations. For thermal dark matter below the GeV scale, this requirement can only be satisfied if the dark sector contains comparably light new force carriers to mediate the necessary annihilation process. Such mediators must couple to visible matter and neutral under the Standard Model (SM) gauge group. This greatly limits the number of options for possible mediators. A representative model involves a heavy vector boson called or “heavy photon” [12, 13, 8] and is described by the Lagrangian (after fields diagonalization, and omitting the LDM mass term):
| (1) |
where is the dark photon mass, is the dark photon field strength, is the SM electromagnetic field strength, is the dark gauge coupling, is the current of DM fields and parametrizes the degree of kinetic mixing between dark and visible photons. The phenomenology of the DM interaction depends on the DM mediator mass hierarchy and on the details of the dark current . If there is only one dark sector state, the dark current generically contains elastic interactions with the dark photon. However, if there are two (or more) dark sector states the dark photon can couple to the dark sector states off-diagonally [14]. In this work, we will consider the two cases of scalar and fermionic LDM; although the latter has been already strongly constrained by CMB arguments [15], it is representative of other model variations, such as the Majorana or the pseudo-Dirac (small mass splitting) cases [16]. Depending on the relative masses of the and the DM particles the can decay to SM particles (“visible” decay) and/or to light DM states (“invisible” decay). In the rest of the paper we will consider the mass hierarchy case with the arbitrary choice =3, where is the LDM mass. We will also fix , following the recent convention adopted in the CERN Physics Beyond Collider report [17].
In the paradigm of DM with a thermal origin, it would have acquired its current abundance through direct or indirect annihilation into SM. If the mediator is heavier than the DM, the thermal relic abundance is achieved via direct annihilation where are SM fermions/scalars with a corresponding annihilation rate scaling as:
| (2) |
This scenario offers a predictive target for discovery or falsifiability, since there is a minimum SM-mediator coupling compatible with a thermal history that experiments can probe.
Present accelerator technology provides high intensity particle beams of moderate energy that are well suited for the discovery of LDM [6, 7]. In particular, electron beam dump experiments have been shown to have high sensitivity to light dark matter [18, 19, 20]. In these experiments, light dark matter particles ( pairs) are conjectured to be produced when the electron beam interacts with nucleons and electrons in the beam dump via radiative process (-strahlung) or annihilation (resonant and non-resonant) of positrons produced by the electromagnetic shower generated therein [21, 22, 23]. A detector located downstream of the beam dump, shielded from SM background particles (other than neutrinos), could be sensitive to the interaction of DM s. However, the shallow installation of accelerator beam lines exposes detectors to cosmic backgrounds [24]. An electromagnetic shower is expected to be produced by the -electron interaction, depositing large energies (E MeV) that are easily detectable by a standard electromagnetic calorimeter. Surrounding the detector with passive and active vetoes provide further reduction of beam-related and cosmic muon and neutron backgrounds.
An experiment based on the concept described above, called Beam Dump eXperiment or BDX [20], has been proposed and approved to run at Jefferson Lab making use of the 11 GeV, 60 A CW electron beam delivered by the CEBAF accelerator to the experimental Hall A. Five meters of iron will shield a cubic-meter-size electromagnetic calorimeter consisting of CsI(Tl) crystals formerly used in the BaBar experiment at SLAC [25]. Plastic scintillators and lead layers surrounding the calorimeter will veto most of the cosmic and beam-related backgrounds.
In this paper we describe the BDX-MINI experiment [26], a pilot version of BDX that took data at lower beam energy (2 GeV in place of 11 GeV), and therefore avoided the need for the significant shielding planned for the full experiment. BDX-MINI was installed in an existing 10-inch pipe installed 25 m downstream of the Hall A beam dump to intercept possible dark matter particles propagating through the dirt. To partially compensate for the limited active volume that was constrained by the pipe size, the calorimeter was assembled using crystals, which are a factor of two denser than CsI(Tl). Following the BDX detector design, two layers of plastic scintillator and a passive layer of W surrounded the calorimeter. While the BDX-MINI interaction volume was only a few percent of proposed BDX and the beam exposure was only six months, the outcome of this pilot experiment is worthy in its own right.
The paper is organized as follow: Sec. II describes the experimental set up: location, detector, and DAQ. Sec. III describes the simulation framework used to evaluate the expected signal. Section IV reports details about the data analysis and the statistical procedure. Finally, Sec. V reports the experiment sensitivity optimization and the resulting upper limit. A Summary and Outlook will conclude the paper.
II Experimental setup
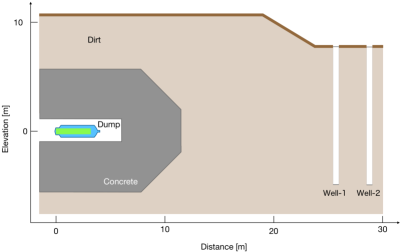
The detector was installed 26 m downstream of the Hall A beam dump at JLab, inside a well (Well-1) at beamline height. The detector was shielded from the background produced in the beam dump by 5.4 m of concrete and 14.2 m of dirt, shown schematically in Fig. 1. The experiment accumulated data during a period of six months between 2019 and 2020. During most of the time, Hall A received one-pass beam from the accelerator (2.176 GeV) and all muons generated in the beam dump ranged out before reaching the detector. In this section we present an overview of the experimental configuration and detector with sufficient information to understand the analysis and results in the rest of the paper. Additional details of the experimental layout and setup can be found in Ref. [26].
The detector was located inside a 20-cm diameter stainless steel watertight cylindrical vessel, which could be lowered into either one of the two wells downstream of the Hall A beam dump. Cable connections from the detector were routed to an electronic rack at ground level near the entrance to the well that contained the readout electronics and the DAQ system. The experimental setup was housed inside a sturdy field tent that covered both wells, the electronic equipment, and power breakers. The environment was conditioned using a portable air conditioning unit to maintain a suitable temperature and humidity.
The detector package, which we call “BDX-MINI”, consists of an electromagnetic calorimeter (ECal) composed of PbWO4 crystals ( 4 x 10⁻³ m3 total volume) and hermetic layers of passive and active vetoes. The innermost veto layer consists of tungsten shielding. This passive layer is followed by two active layers: the inner veto, IV, and the outer veto, OV. Each layer consists of a cylindrical or octagonal tube and two end caps. A cross sectional sketch of the detector is shown in Fig. 2.
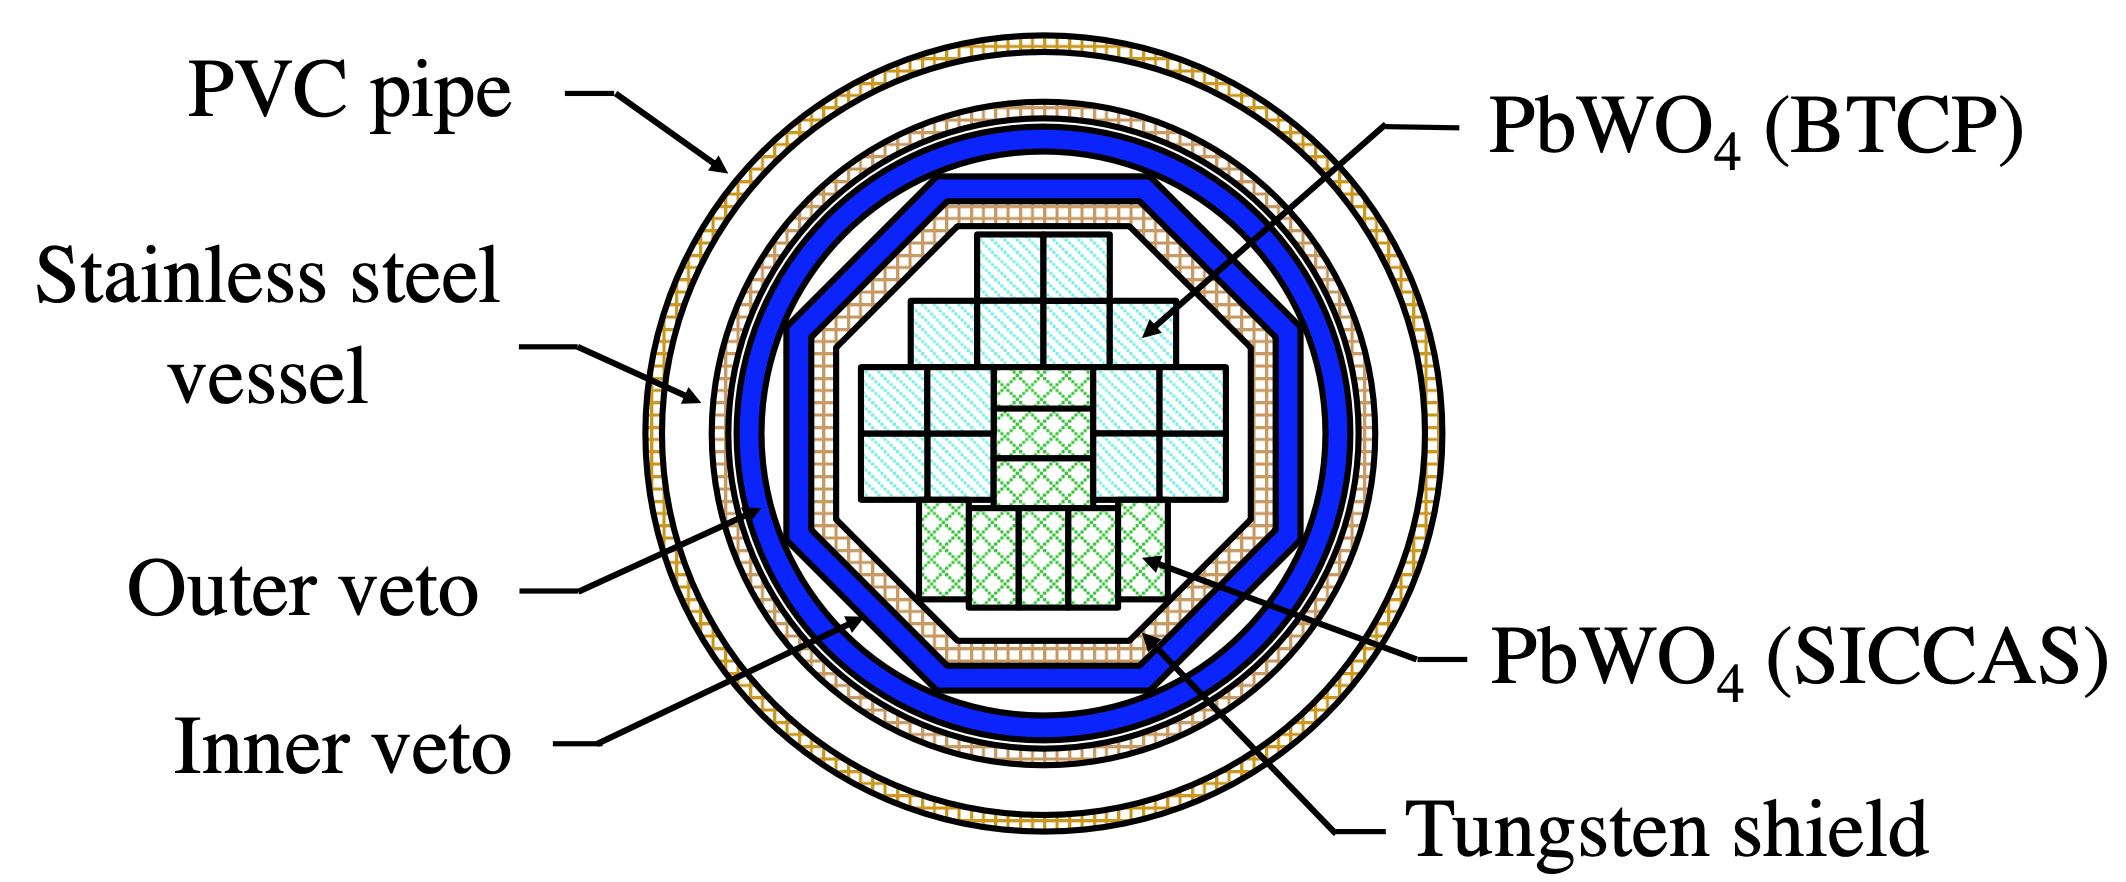
The ECal is composed of two identical modules with 22 PbWO4 crystals each (eight 30 x 15 x 200 mm3 crystals produced by SICCAS111Purchased for the Forward Tagger Detector for CLAS12 from Shanghai Institute of Ceramics, Chinese Academy of Science. and fourteen 20 x 20 x 200 mm3 crystals produced by the BTCP222Purchased for the PANDA-ECal from Bogoroditsk Technical Chemical Plant.). The two modules are mounted vertically, resulting in an approximately cylindrical shape 40 cm long and 11.5 cm in diameter (equivalent to approximately 13 radiation lengths). The ECal uses 6 x 6 mm2 Hamamatsu MPPCs (S13360-6025PE) to read out the PbWO4 scintillation light from each crystal.
The veto is composed of three layers, which completely enclose the ECal. The innermost passive layer is a 0.8 cm-thick tungsten shield that is shaped as an octagonal prism with a height of 45 cm and a base side of 5 cm. This layer is sealed on top and bottom by two octagonal tungsten plates. The purpose of this passive layer is to protect the active vetoes from electromagnetic showers in the ECAL produced by interactions that may accidentally self-veto the interaction. The two active layers are composed of EJ200 plastic scintillators, 0.8 cm thick. The IV is an optically connected octagonal prism with a side base of 6.2 cm and a height of 49.4 cm; two octagonal scintillators cover the top and bottom. The OV is cylindrical in shape with a radius of 9.7 cm and a height of 53.0 cm; the top and bottom are covered by two round caps. Both the IV and the OV use wavelength-shifting fibers to collect the light and deliver it to 3x3 mm2 Hamamatsu S13360-3075CS SiPMs with multiple redundancy.
The preamplifiers, readout electronics and data acquisition electronics are all mounted in racks outside the well at ground level. We found that the noise and the attenuation associated to 8-m long cables between the SiPMs and the front-end electronics were sufficiently low to distinguish the individual photo-electrons signals for each and every one of the SiPMs. Each detector signal is amplified by a custom circuit, which provides two equal outputs of the signal. The first copy of the signal is sent to a leading-edge discriminator (CAEN v895), whose digital output is sent to a programmable logic board (CAEN FPGA v1495) implementing a custom trigger logic. A threshold of MeV is implemented for each crystal, while for veto signals a threshold of few photo-electrons is used. The second copy is fed to a Flash Amplitude-to-Digital converter. Signals from the inner and outer veto photodetectors were processed with a 2V, 14 bit, 500 MHz module (CAEN FADC v1730), while those from the crystals were processed with a board featuring a lower 250 MHz sampling rate (CAEN FADC v1725). To guarantee synchronization, the clock was generated from the first board and distributed to the others through a daisy chain setup. A 640 ns readout window was used for all channels.
The main experimental trigger consisted of the logic “OR” of all signals from the crystals in the ECal, resulting in a constant rate of 3.2 Hz. The rate was insensitive to the beam operation. Other triggers were implemented for monitoring, calibration and debugging. Each individual trigger could be prescaled, and the global trigger condition consisted in the union of all individual trigger bits after prescale. For each trigger, all the FADC raw waveforms were written to the disk without further processing. In order to monitor the rates in the detector, as well as the trigger rate and the livetime, individual scalers were implemented in the FPGA firmware and regularly read through the slow controls system. We used the standard JLab “CEBAF Online Data Acquisition” (CODA) software to handle the readout system [27].
A custom EPICS-based system was developed [28], which was integrated into the main JLab slow-controls in order to access accelerator quantities such as the beam current and energy. The temperature and the humidity at the detector was monitored by two probes installed inside the watertight cylindrical vessel. Likewise, the ambient temperature and humidity inside the tent with the electronics were recorded. The FPGA scalers were readout and trigger configurations could be set using the slow-control system. All slow-control variables were periodically recorded to the data stream during data-taking runs.
Various online monitoring tools were developed to monitor the detector performance during data taking in order to quickly identify and thereby correct any problems as quickly as possible. The count rates for each detector channel, for each trigger bit, and for the total trigger rate were available as data came in and their time evolution was monitored using the EPICS StripTool program. The online reconstruction system also monitored both single-event FADC waveforms and accumulated observables, including the spectrum of the energy deposited in each crystal, and the total energy deposited in the two BDX-MINI modules. If anomalies were found by any of these tools, the DAQ was suspended and the problem investigated till resolved.
III Expected Signal and Simulation
The sensitivity of the BDX-MINI experiment to the production of LDM is determined by precisely simulating the production of LDM in the dump and the response of the detector to interactions of crossing LDM particles. The distributions are computed for specific models and masses of LDM. The expectation for the signal is then compared to the measured distributions in our data to determine, or set limits on, the production strength of LDM. In the following, we first summarize the relevant formulas for LDM production in the beam dump and detection in BDX-MINI, and then we present the Monte Carlo strategy that we adopted to compute the expected signal yield.
III.1 LDM production and detection
In BDX-MINI, LDM particles are produced by the interaction of the secondary particles in the electromagnetic shower induced by the CEBAF electron beam with the nuclei and electrons contained in the Hall A beam dump. The main production mechanisms are the so-called -strahlung () and the resonant annihilation (), followed by the invisible decay to LDM particles [22, 21]. The and particles are sufficiently long lived and penetrating to reach, and possibly interact with, the BDX-MINI detector.
The differential flux per electron on target (EOT) produced in a thick target, neglecting the transverse development of the electromagnetic shower, is given by:
| (3) |
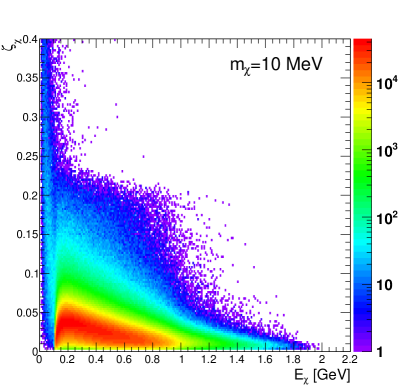
where and , are, the target material atomic mass and mass density, is Avogadro’s number, () are the electron (positron) differential track-length distribution in the thick target per EOT, and . Here, is the differential cross section for production via -strahlung with respect to the energy , polar angle and azimuthal angle , integrated over all the other final state kinematic degrees of freedom, while is the differential cross section for production via electron-positron resonant annihilation. The function accounts for the kinematic correlation between and described by the function resulting from the two-body nature of the resonance production. The effect of the transverse development of the electromagnetic shower further broadens the angular distribution of the flux. However, for the multi-GeV energy range considered in this work, this effect is small compared to the intrinsic angular distribution of the production cross section. For illustration, Fig. 3 shows the differential flux for fermionic LDM with MeV. LDM particles from annihilation populate the high-density band in the range 0.1 – 0.8 GeV, clearly showing a strong vs correlation. Finally, we observe that the integrated flux scales as , and it is almost independent of .
Once produced, the particles propagate through the beam dump and the other materials (concrete shielding, dirt) between the dump and BDX-MINI. LDM crossing the BDX-MINI ECal can interact with the PbWO4 atomic electrons via elastic scattering, , resulting in a recoiling . The differential spectrum of scattered electrons with respect to the recoil energy is given by:
| (4) |
where g/cm3 is the PbWO4 mass density, is the PbWO4 average ratio, is the elastic scattering cross section, is the particles path length in PbWO4, and is the detection efficiency. The integral is performed over the phase-space element defining the BDX-MINI ECal fiducial volume. Since the elastic scattering cross section is proportional to , the overall normalization of the signal yield scales as .
III.2 Simulation framework
The differential electron and positron track-length distributions with respect to the lepton energy and angle ( and in Eq. 3) were computed using the FLUKA simulation package, version 2021.2.1 [29, 30]. We adopted the official Hall A beam dump description, including geometry and materials, provided to us by the JLab Radiation Control Group [31]. A custom mgdraw routine was used to score, for each electron/positron step in the thick target, the energy and the angle with respect to the primary beam axis, with a scoring weight equal to the step length.
In order to compute the LDM flux produced in the beam dump, we used a custom version of the MadGraph4 toolkit, properly modified to handle fixed-target processes [32]. The nuclear form factor for the radiative emission adopted the parameterization reported in Ref. [33]. An independent simulation was performed for each of the LDM mass points considered in this work, with fixed coupling constant (see Eq. 1). To account for the energy distribution of electrons and positrons in the beam dump, each simulation consisted of multiple runs performed by varying the primary energy between 0 and , where is the beam energy. The generated events from all runs were recombined together, with relative weights given by (radiative emission) / (resonant production). The electromagnetic shower angular spread was also accounted for by further rotating all events in the transverse plane by a random angle extracted from the full distribution. The outcome of the procedure was a set of LDM fluxes, one for each mass point considered, normalized to EOT, for the fixed coupling value .
The LDM differential fluxes were used as input for the simulation of interactions in BDX-MINI. We used a GENIE-based Monte Carlo code to sample the LDM flux from the beam dump, propagate the particles to the BDX-MINI detector, and simulate the elastic scattering with atomic electrons [34, 35]. Specifically, we employed the GENIE Boosted Dark Matter Module [36], tuning the parameters to reproduce the phenomenology of the dark sector Lagrangian reported in Eq. 1, consistent with a SM-LDM coupling purely proportional to the electric charge, with no left/right chiral asymmetries. We developed a custom driver for LDM flux sampling, importing the BDX-MINI detector geometry through a GDML file exported from the corresponding GEANT4 implementation. This approach guarantees that no mismatches are present between the scattering and the subsequent detector response simulation. The output from GENIE was a set of unweighted events for the process , including the final state particle four-vectors, the interaction vertex, and the corresponding total number of EOTs. The detector response to these events was computed by processing them through the GEANT4-based simulation code of the BDX-MINI detector package, and then running the JANA-based reconstruction on the results (see Ref. [26] for further details). Finally, the detection efficiency was obtained by imposing the same analysis cuts adopted in the real data analysis to the reconstructed Monte Carlo observables, in particular the veto response and total energy deposition in the ECal.
IV Data analysis
IV.1 Data reduction
BDX-MINI operated parasitically to the experimental program in Hall A, accumulating approximately six months of data in 2020, corresponding to 2.561021 EOT. During most of the run, the Hall A beam dump received 2.176 GeV electron beam with currents ranging from a few up to 150 A. Cosmic-ray data were collected during the same period when the accelerator was down, either during maintenance days, or when the RF cavities tripped off for a long enough time. The beam-off time accounted for about 50 of the data-taking period. In addition, at the beginning of the run, Hall A experiment received a 10.381 GeV energy beam with currents ranging from 5 to 35 . This high energy run produced muons with sufficient energy to penetrate the shielding surrounding the dump and reach the detector with horizontal muons that were used for calibration.
The offline data reconstruction procedure is described in detail in Ref. [26]. For each event, the recorded waveforms were processed to extract the corresponding charge, time, and amplitude. For each PbWO4 crystal, the integrated charge was converted into energy by applying proper calibration constants determined with muons generated in the beam dump during the high energy run. The calorimeter calibration constants were stable within 10% over the entire measurement period [26]. In the data analysis we imposed a minimum energy threshold of 6 MeV to each crystal.
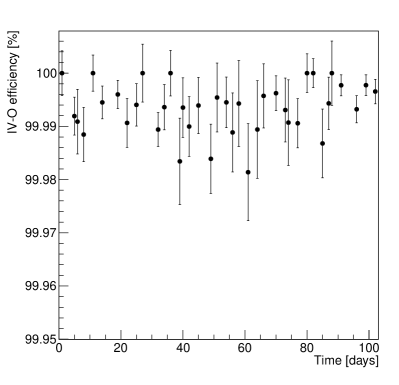
For plastic scintillator detectors, we used the amplitude of each signal normalized to its single photo-electron (p.e.) value and its corresponding time. As shown in Ref. [26], the two veto systems are characterized by a detection efficiency compatible with 100%. The stability of each veto response over time was studied using cosmic-ray data. The response in the vertical sides of the IV (OV) was measured by selecting hits in the sides of the OV (IV) and the upper caps to select cosmic muons with well defined trajectories. The response in the caps was determined by selecting perpendicular cosmic-ray tracks with a significant release of energy in caps ( 5.0 .p.e.) other than the one under study and no activity in the side veto channels. The selection procedure was repeated for each run indicating that each system was stable to better than 0.1 over the data-taking period. An example of the stability response as a function of time for IV sides (IV-Octagon) is shown in Fig. 4.
IV.2 Data Samples
All collected data were analyzed in the very same way and then divided into two samples: beam-on, which corresponded to more than 10 A requirement on current in Hall A, and beam-off. The beam-off sample was used to determine the cosmic-ray background in the beam-on sample after normalizing by the corresponding time. We emphasize that beam-on and beam-off data were collected at almost the same time, so any detector drift would track together.
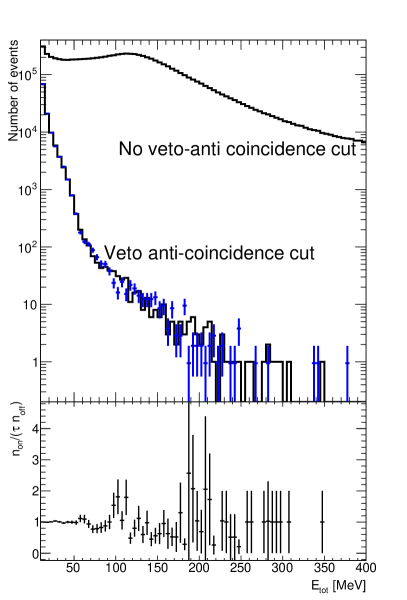
The data reduction is illustrated in Fig. 5, where we show the total energy distribution in the ECal before and after requiring the anti-coincidence with vetoes. A rejection factor between 2 and 4 orders of magnitude was found, depending on the amount of energy collected in the calorimeter. The plot also reports the ratio between beam-on and beam-off distributions, appropriately normalized, showing that there is no statistical difference between the two data sets.
IV.3 Backgrounds
Cosmic rays and beam induced neutrinos represent the two source of backgrounds in the BDX-MINI experiment. Neutrinos have a much lower interaction rate in the detector compared to the dominant cosmogenic contribution, but the neutrino background is irreducible. In this section we report on the study of cosmic backgrounds based on the beam-off data sample and summarize the neutrino background estimates based on Monte Carlo simulations.
IV.3.1 Cosmic background
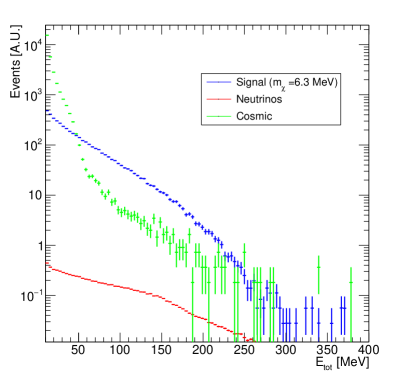
The cosmic background was determined studying data collected during beam-off time. As described in Ref. [26], each BDX-MINI veto is characterized by a high cosmic-ray rejection efficiency that increases by combining the information from both inner and outer vetoes. In fact the average cosmic rate for an ECal energy threshold of 40 MeV was 1.9 Hz, suppressed by three to four orders of magnitude when we required no activity in both vetoes. In the data analysis, events were discarded if the signal of one SiPM of a veto system exceeded a threshold of 5.5 p.e., or at least two SiPMs of the same veto measured a signal above 2.5 p.e within a time window of 200 ns. Figure 7 shows the ECal reconstructed energy distribution for events in anti-coincidence with both veto systems (green dots).
To demonstrate that cosmic events measured during beam-off are representative of beam unrelated background in the beam-on data set, we developed an ad-hoc procedure based on the event topology to identify vertical cosmic muons from a possible LDM hit (vertical down-warding vs. beam dump originated horizontal tracks). Vertical (cosmic muon) tracks were selected by requiring a significant release of energy (6 MeV) in at least one crystal in the ECal top part and in at least one crystal in the bottom part. In addition, we required a signal above 6 p.e. in all veto caps and no activity in the vertical veto sections. Since each BDX run included a combination of beam-on and beam-off time, we were able to compare the beam-on/off vertical cosmic muon rates per each run.
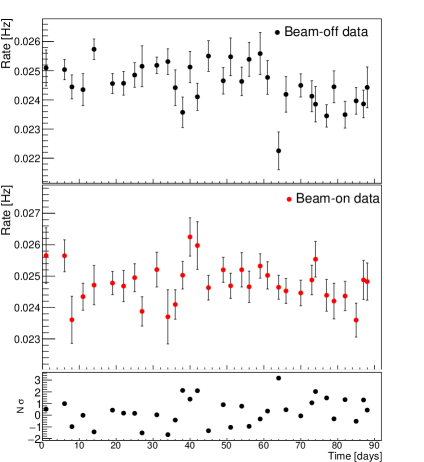
Figure 6 shows the vertical cosmic muon rate as a function of run number for beam-off (top panel) and beam-on (middle panel). The results indicate that, although we cannot exclude a long-term variation within the same run, beam-on and beam-off rates are compatible within 2 as shown in Fig.6-bottom panel. This comparison demonstrates that any possible long-term variations of cosmic rays affect the beam-on and beam-off data in the same way. Therefore, we can use the cosmic measurement performed during beam-off time to estimate the beam unrelated background in the beam-on data set.
IV.3.2 Neutrino background
To estimate the neutrino background we performed Monte Carlo simulations. In particular to simulate the production, propagation, and detector interaction of neutrinos produced by the interaction of the primary electron beam with the Hall A beam dump, we used the procedure described in Ref. [26]. Neutrino production was determined using FLUKA simulations with the same setup adopted for the LDM production. Neutrino interactions with the detector and the surrounding material was simulated with the GENIE package v.3.0.6 [34, 35]. GENIE output was used as an input to the BDX-MINI detector GEANT4-based simulation code of the BDX-MINI. Finally, simulations were processed with the same JANA-based reconstruction code (see Sec.IV) used to process experimental data. The total number of events requiring no activity in both vetoes, and an energy threshold of 40 MeV on ECal was 5.8x10⁻²³ per EOT 333In reference [26], a neutrino event yield of 1.1x/EOT was erroneously reported for an energy threshold of 200 MeV, after anti-coincidence cut. This error was due to a wrong marginalization of the neutrino distribution obtained from GENIE. This corresponds to less than 1 neutrino background event detected in the the entire BDX-MINI run.
IV.4 Statistical Approach
In order to derive an upper limit in the LDM parameters space, we adopted the following statistical procedure, based on the so-called “On/Off” problem (also called “Li & Ma”) [37]. We started by considering a simple counting model, and dividing the measured data in two categories, the “beam-on” and the “beam-off” ones, characterized by overall time durations and , respectively. We denoted as and the total number of measured events in each category. We assumed that these observables are distributed according to Poisson statistics, with average values and , respectively. During the beam-off time, all measured events are due, by definition, by the beam unrelated (cosmic ray) background, while during beam-on time, the contribution from beam-induced (neutrino) background and from the LDM signal should also be added. Therefore, , where is the expected signal event yield, with , and is the expectation for the beam-related backgrounds. The following likelihood expression can thus be used to describe the measured dataset:
| (5) |
where denotes a Poisson distribution with average value , computed for a number of events equal to . This likelihood expression can be employed to derive a test statistics to be used for the upper limit determination by treating as a nuisance parameter, while is uniquely determined from Monte Carlo simulations. It should be observed that, in this model, the parameter-of-interest (POI) represents the average event yield within the signal region due to any source other than the background ones. Therefore, the obtained upper limit on this parameter would be, by definition, model independent, and could be used to test any BSM model against the measured data.
We refined this model in order to include in the upper-limit evaluation procedure the measured energy deposition in the BDX-MINI detector for each event. We expect that, by increasing the observables employed in the statistical analysis, and thus the available information, the obtained upper limit would significantly improve, as already observed in similar studies [38]. We expect the largest improvement to be in the mass region where the annihilation production mechanism is prominent, due to the peculiar energy deposition spectrum associated of signal events, which is significantly different than the background (see also Fig. 7).
We further divided each set of data into discrete bins of the total BDX-MINI measured energy . By calling and the number of measured events in the energy bin, the likelihood model now reads:
| (6) |
where the coefficients are treated as nuisance parameters, and the parameters are obtained from the Monte Carlo simulation of the beam-induced background. As before, the POI is the average signal event yield. Finally, the coefficients represent the fraction of signal events expected in the energy bin (see Section V.1 for their specific assignment). We computed these through a Monte Carlo simulation of the signal events, performed independently for each LDM model considered in this work and for each tested mass value. We note that the coefficients are not independent, but satisfy, by definition, the relation .
To extract the upper limit, a one-sided profile-likelihood test statistics was used:
| (7) |
where is the profile likelihood, and denotes the ensemble of all nuisance parameters 444We used the “traditional” notation to denote the value of a likelihood parameter at the absolute function maximum, and to denote the value of a parameter that maximizes for a fixed value of the POI ..
To translate the upper limit on to an upper limit for the LDM coupling , we computed through Monte Carlo the signal event yield for a nominal coupling value using the relation . We underline that the upper limit on was computed independently for all LDM models and mass values considered in this work, due to the dependency associated to the LDM energy deposition spectrum in the BDX-MINI detector affecting the coefficients .
To incorporate the systematic uncertainties associated with the measurement in the upper limit extraction procedure, we modified the likelihood model for the experiment as follows. The systematic uncertainty on the detector position and alignment, as well as that on the veto response, does not affect directly the obtained upper limit on the number of signal events , rather the corresponding projection on the LDM parameters space. More precisely, these systematic uncertainties affect the evaluation of the nominal signal strength , and thus the upper limit on . To evaluate this effect, we independently studied the dependency of on the vertical position of the detector in the beam pipe, , on the detector rotation around the vertical axis, , and on the scale of the veto calibration, . For illustration, the signal yield variations corresponding to a modification of these parameters are summarized in Table 1. To include these systematic uncertainties in the likelihood, we introduced the following parameterization:
| (8) |
where , correspond to the nominal scenario, giving the event yield . The functions and were obtained from Monte Carlo simulations, changing the detector position and the veto thresholds , and evaluating the expected signal yield, normalized to . This study was repeated independently for both LDM models and for all the LDM masses considered in this work. We neglected the effect of the detector rotation, since it results to a much smaller change in . In the likelihood, given the linear relation between and , we multiplied the latter by , including two Gaussian PDF terms to constrain the nuisance parameters and :
| (9) |
| Syst. uncertainty term | 1- variation | |
|---|---|---|
| Detector vertical position | 5 cm | 0.07 |
| Detector rotation | 5∘ | 0.025 |
| Veto thresholds | phe | 0.05 |
| Energy calibration | 10 | mass-dependent |
| maximum |
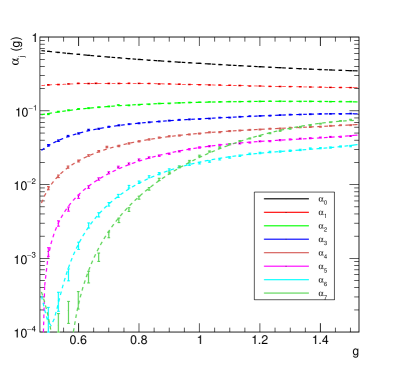
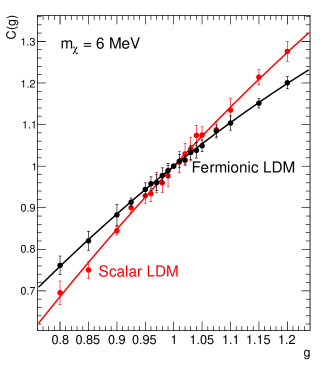
In contrast, the uncertainty in the ECal energy scale affects both the nominal signal yield and the coefficients . The changes in the fractions are due to the modification of the shape of the distribution due to variations of the energy response of each crystal. This results in energy bin-migration. This effect is primarily associated with systematic uncertainties that alter the energy scales of all crystals simultaneously, such as a small mismatch between the true PbWO4 crystal density and the value implemented in the Monte Carlo, or a incorrect description of the passive materials surrounding the detector that were traversed by muons generated by the 10.38-GeV beam, whose ionization signal was used to infer the crystals energy calibration constant. Denoting with the ratio between the assumed energy calibration constants and the (unknown) real ones, we introduced the parameterization , with the constraint . We computed the functions using Monte Carlo by performing simulations with different values of the calibration constants. Since each LDM model has its own specific energy distribution, we repeated the calculation for each mass value, and for both the fermionic and the scalar case. As an example, Fig. 8 shows the behavior of these functions for the fermionic LDM case, with MeV. The nuisance parameter was constrained by adding a further Gaussian PDF term to the likelihood:
| (10) |
where is the uncertainty in the BDX-MINI absolute energy scale. We observe that the functions still satisfy the constraint , since for each value of these have been computed by considering only the events within the signal region.
At the same time, a variation of the crystals energy scale would affect the nominal signal yield due to the lower energy threshold on that defines the signal region, as discussed in the next Section. We thus rewrote the expression of from Eq. 8 as:
| (11) |
with the nominal condition . Similarly as before, we computed the function from Monte Carlo. To account for the uncertainty on the relative crystal-to-crystal response, also including the corresponding time fluctuations, we proceeded as follows. For each value of , we performed different simulations, randomly extracting, for each crystal, a multiplicative energy correction factor from a Gaussian distribution with an average value and a standard deviation of , which is the typical variation of the relative calibration constants observed during the full BDX-MINI run [26]. For each simulation, we computed the number of events within the signal region, normalized to , finally quoting for the average value of this distribution. For illustration, Fig. 9 shows the function for MeV.
The final expression of the likelihood used in the upper limit evaluation procedure reads:
| (12) |
In this procedure, we neglected any correlation among the systematic uncertainty sources - for example, a modification in the detector position could change the energy spectrum of LDM particles passing through it. The validity of this approximation was explicitly checked by looking at shapes of the functions for different detector configurations. No significant variations with respect to the nominal case were found.
We implemented this statistical model with the RooStats software [39], using a toy-MC approach to determine the PDF of the test statistics, and extract from this the CL limit on the POI . In the next section, we describe the procedure adopted to fix the analysis parameters and the likelihood model (number of energy bins, thresholds), reporting the obtained results.
V Results
V.1 Sensitivity optimization
The reach of the experiment was optimized considering simultaneously the effect of data analysis cuts on background minimization and signal maximization.
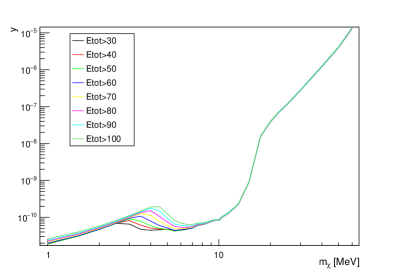
Beam-off data were assumed to correspond to the cosmogenic component of beam-on data. We only used events accepted by the anti-coincidence condition reported in IV.3 to reduce the cosmic background. We used the procedure described in Sec. IV.4 to evaluate the average upper limit on the number of signal events under the hypothesis , also referred to as sensitivity. Through MC simulations, we converted this to the sensitivity on the parameter defined in Sec. I, for different values of . Specifically, we evaluated how the sensitivity varies using different selection cuts: if a cut suppresses the background, while preserving the signal, the exclusion limit is expected to be more stringent. As a first step, we optimized the sensitivity by varying the number and the size of the energy bins. We found that the sensitivity is mostly dependent on the choice of the minimum total energy, and while it depends weakly on the other analysis parameters. Fig. 10 shows the expected sensitivity using the same bin width but different minimum energy. The best sensitivity was achieved by dividing the ECal energy spectrum into seven 45 MeV-wide bins from MeV to plus an 8th bin from to MeV.
The sensitivity obtained using Eq. IV.4 was compared to the one obtained without any binning (Eq. 5) finding an improvement in the exclusion limit of about a factor of two over the entire mass range.
To further enhance the reach we studied the sensitivity as a function of other measured quantities expected to be different for signal and background: hit multiplicity (number of crystals with an energy deposition over a channel dependent threshold), electromagnetic shower direction (defined as a fit of the position of different energy depositions), and energy distribution (defined as the fraction of energy deposited outside the most energetic hit). Although all these variables had some discrimination power, none provided a significant sensitivity improvement. For sake of simplicity, we then decided to quote an exclusion plot only based on the total energy binning.
This study was performed in two scenarios: scalar and fermionic LDM. The results were similar, achieving the best sensitivity when events with total energy MeV and satisfying the veto anti-coincidence condition were considered. The data have then been divided into eight bins according to the total energy deposited: the energy range between and MeV was split into seven equally spaced 45 MeV-wide bins, and a single bin was used for all events from to MeV.
V.2 Upper Limits
In the last step of the analysis, we applied the procedure optimized on the beam-off data set only to the whole beam-on data set, which corresponds to an accumulated charge of EOT. We refer to this process as “unblinding.” To avoid possible long-term fluctuations between beam-off and beam-on data samples, only runs with a significant beam-on and beam-off time were included in the analysis (see Sec. IV.3 for details). Starting from the measured yields of beam-on and beam-off events () we derived a exclusion limit on the LDM yield through the statistical procedure described in Sec. IV.4. MC simulations were used to translate this result to an exclusion limit on the LDM parameter for both fermion and scalar LDM. Fig. 11 shows exclusion limits obtained from BDX-MINI data in the two models.
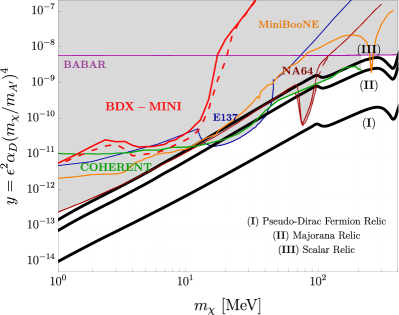
As anticipated, we observe that resonant annihilation enhances the exclusion limits for in the ( MeV MeV) range. In this range, the lowest limit on is obtained for MeV for fermionic LDM, while for scalar LDM lower limits are obtained for MeV. The cut-off at low mass for resonant annihilation is determined by the energy detection threshold. The non resonant contribution is slightly less sensitive, but extends the reach to lower masses down to few MeV. In some selected kinematics, the exclusion limits set by BDX-MINI are comparable to the best existing upper limits.
VI Summary and outlook
In this paper we report on the exclusion limits placed on the production of LDM by the pilot BDX-MINI experiment. The experiment ran in parallel to the Jefferson Lab Hall A physics program, accumulating the considerable charge of EOT. We installed a limited-volume EM calorimeter, surrounded by a hermetic veto system, into an existing well downstream of the Hall A beam dump. This detector was exposed to any DM particles produced by a high intensity 2.176 GeV electron beam in the dump and penetrating the material between the dump and the detector. Given the limited beam energy, no Standard Model particles produced in the dump were expected to reach the detector, except for neutrinos. The main background source for the experiment was cosmic rays, carefully studied with data collected during the beam-off times that were interspersed with the beam-on periods. Simulations of fermionic and scalar dark matter produced in the dump and interacting with electrons in the BDX-MINI calorimeter were used to determine the sensitivity of the experiment. The analysis procedure to detect an excess of counts in the beam-on data sample was optimized using the fully blinded beam-off data sample. A sophisticated statistical procedure, based on a maximum-likelihood approach, was applied to the deposited energy spectrum to optimize the experiment sensitivity. Sources of systematic errors, such as the energy calibration and the detector misalignment, were included in the analysis to provide a reliable and robust result. Two possible scenarios, fermionic and scalar dark matter were investigated. Based on the measured event yields during beam-on and beam-off periods, a 90 CL upper limit on LDM production was derived as a function of a hypothetical DM particle mass. The sensitivity of this pilot experiment covers some kinematics comparable with flagship experiments such as NA64 [41, 19]. Considering the limited size of the BDX-MINI active volume this is a remarkable result, demonstrating the potential of the new generation of beam dump experiments in LDM searches. The full BDX experiment has already been approved to run at Jefferson Lab and, with its improved sensitivity, it has great discovery potential to find hints of Dark Matter or, in case of a null result, to improve existing limits by up to two orders of magnitude.
Acknowledgments
The authors would like to thank the JLab Directorate and Physics Division, and the Italian Istituto Nazionale di Fisica Nucleare for invaluable support during the entire project. We would also like to thank the INFN technical staff for the excellent work in constructing the detector, Hall D Physics technical staff for careful installation, JLab Facilities for design, survey, and logistical support, JLab Networking/Computing for providing connectivity. Special thanks to CLAS12 Collaboration and PANDA Collaboration for providing the PbWO4 crystals. This material is based upon work supported by the U.S. Department of Energy, Office of Science, Office of Nuclear Physics under contract DE-AC05-06OR23177.
References
- Cebrián [2022] S. Cebrián, in 10th Symposium on Large TPCs for Low-Energy Rare Event Detection (2022) arXiv:2205.06833 [physics.ins-det] .
- Arbey and Mahmoudi [2021] A. Arbey and F. Mahmoudi, Prog. Part. Nucl. Phys. 119, 103865 (2021), arXiv:2104.11488 [hep-ph] .
- Steigman and Turner [1985] G. Steigman and M. S. Turner, Nuclear Physics B 253, 375 (1985).
- Roszkowski et al. [2018] L. Roszkowski, E. M. Sessolo, and S. Trojanowski, Rept. Prog. Phys. 81, 066201 (2018), arXiv:1707.06277 [hep-ph] .
- Schumann [2019] M. Schumann, J. Phys. G 46, 103003 (2019), arXiv:1903.03026 [astro-ph.CO] .
- Battaglieri et al. [2017] M. Battaglieri et al., “US Cosmic Visions: New Ideas in Dark Matter 2017: Community Report,” (2017), arXiv:1707.04591v1, arXiv:1707.04591 [hep-ph] .
- Krnjaic et al. [2022] G. Krnjaic et al., (2022), arXiv:2207.00597 [hep-ph] .
- Fabbrichesi et al. [2020] M. Fabbrichesi, E. Gabrielli, and G. Lanfranchi, The Physics of the Dark Photon - A Primer (Springer International Publishing, 2020).
- Filippi and De Napoli [2020] A. Filippi and M. De Napoli, Rev. Phys. 5, 100042 (2020), arXiv:2006.04640 [hep-ph] .
- Liddle [2003] A. R. Liddle, An introduction to modern cosmology, edited by Wiley (2003).
- Coy et al. [2021] R. Coy, T. Hambye, M. H. G. Tytgat, and L. Vanderheyden, Phys. Rev. D 104, 055021 (2021), arXiv:2105.01263 [hep-ph] .
- Holdom [1986] B. Holdom, Phys. Lett. B 166, 196 (1986).
- Batell et al. [2009] B. Batell, M. Pospelov, and A. Ritz, Phys. Rev. D 80, 095024 (2009), arXiv:0906.5614 [hep-ph] .
- Tucker-Smith and Weiner [2001] D. Tucker-Smith and N. Weiner, Phys. Rev. D 64, 043502 (2001), arXiv:hep-ph/0101138 .
- Madhavacheril et al. [2014] M. S. Madhavacheril, N. Sehgal, and T. R. Slatyer, Phys. Rev. D 89, 103508 (2014), arXiv:1310.3815 [astro-ph.CO] .
- Åkesson et al. [2018] T. Åkesson et al. (LDMX), (2018), arXiv:1808.05219 [hep-ex] .
- Beacham et al. [2020] J. Beacham et al., J. Phys. G 47, 010501 (2020), arXiv:1901.09966 [hep-ex] .
- Batell et al. [2014] B. Batell, R. Essig, and Z. Surujon, Phys. Rev. Lett. 113, 171802 (2014), arXiv:1406.2698 [hep-ph] .
- Andreev et al. [2021] Y. M. Andreev et al., Phys. Rev. D 104, L091701 (2021), arXiv:2108.04195 [hep-ex] .
- Bondí [2017] M. Bondí (BDX), EPJ Web Conf. 142, 01005 (2017).
- Izaguirre et al. [2013] E. Izaguirre, G. Krnjaic, P. Schuster, and N. Toro, Phys. Rev. D 88, 114015 (2013), arXiv:1307.6554 [hep-ph] .
- Marsicano et al. [2018a] L. Marsicano, M. Battaglieri, M. Bondí, C. R. Carvajal, A. Celentano, M. De Napoli, R. De Vita, E. Nardi, M. Raggi, and P. Valente, Phys. Rev. Lett. 121, 041802 (2018a), arXiv:1807.05884 [hep-ex] .
- Marsicano et al. [2018b] L. Marsicano, M. Battaglieri, M. Bondí, C. D. R. Carvajal, A. Celentano, M. De Napoli, R. De Vita, E. Nardi, M. Raggi, and P. Valente, Phys. Rev. D 98, 015031 (2018b), arXiv:1802.03794 [hep-ex] .
- Battaglieri et al. [2019] M. Battaglieri et al. (BDX), (2019), arXiv:1910.03532 [physics.ins-det] .
- Aubert et al. [2002] B. Aubert et al. (BaBar), Nucl. Instrum. Meth. A 479, 1 (2002), arXiv:hep-ex/0105044 .
- Battaglieri et al. [2021] M. Battaglieri et al., Eur. Phys. J. C 81, 164 (2021), arXiv:2011.10532 [physics.ins-det] .
- COD [2018] “JLab CODA,” (2018).
- Dalesio et al. [1994] L. R. Dalesio, J. O. Hill, M. Kraimer, S. Lewis, D. Murray, S. Hunt, W. Watson, M. Clausen, and J. Dalesio, Nucl. Instrum. Meth. A 352, 179 (1994).
- Böhlen et al. [2014] T. T. Böhlen, F. Cerutti, M. P. W. Chin, A. Fassò, A. Ferrari, P. G. Ortega, A. Mairani, P. R. Sala, G. Smirnov, and V. Vlachoudis, Nucl. Data Sheets 120, 211 (2014).
- [30] A. Ferrari, P. R. Sala, A. Fasso, and J. Ranft, FLUKA: A multi-particle transport code (Program version 2005).
- Kharashvili [2016] M. Kharashvili, JLAB-TN-16-048, Tech. Rep. (2016).
- Alwall et al. [2007] J. Alwall, P. Demin, S. de Visscher, R. Frederix, M. Herquet, F. Maltoni, T. Plehn, D. L. Rainwater, and T. Stelzer, JHEP 09, 028 (2007), arXiv:0706.2334 [hep-ph] .
- Bjorken et al. [2009] J. D. Bjorken, R. Essig, P. Schuster, and N. Toro, Phys. Rev. D 80, 075018 (2009), arXiv:0906.0580 [hep-ph] .
- Andreopoulos et al. [2010] C. Andreopoulos et al., Nucl. Instrum. Meth. A 614, 87 (2010), arXiv:0905.2517 [hep-ph] .
- Andreopoulos et al. [2015] C. Andreopoulos, C. Barry, S. Dytman, H. Gallagher, T. Golan, R. Hatcher, G. Perdue, and J. Yarba, “The GENIE Neutrino Monte Carlo Generator: Physics and User Manual,” (2015), arXiv:1510.05494 [hep-ph] .
- Berger [2018] J. Berger, (2018), arXiv:1812.05616 [hep-ph] .
- Gillessen and Harney [2005] S. Gillessen and H. L. Harney, Astron. Astrophys. 430, 355 (2005), arXiv:astro-ph/0411660 .
- de Romeri et al. [2020] V. de Romeri, K. J. Kelly, and P. A. N. Machado, J. Phys. Conf. Ser. 1468, 012061 (2020).
- Moneta et al. [2010] L. Moneta, K. Belasco, K. S. Cranmer, S. Kreiss, A. Lazzaro, D. Piparo, G. Schott, W. Verkerke, and M. Wolf, PoS ACAT2010, 057 (2010), arXiv:1009.1003 [physics.data-an] .
- Lees et al. [2017] J. P. Lees et al. (BaBar), Phys. Rev. Lett. 119, 131804 (2017), arXiv:1702.03327 [hep-ex] .
- Banerjee et al. [2019] D. Banerjee et al., Phys. Rev. Lett. 123, 121801 (2019), arXiv:1906.00176 [hep-ex] .
- Aguilar-Arevalo et al. [2018] A. A. Aguilar-Arevalo et al. (MiniBooNE DM), Phys. Rev. D 98, 112004 (2018), arXiv:1807.06137 [hep-ex] .
- Akimov et al. [2021] D. Akimov et al. (COHERENT), (2021), arXiv:2110.11453 [hep-ex] .