Audio Deepfake Detection Based on a Combination of F0 Information and Real Plus Imaginary Spectrogram Features
Abstract.
Recently, pioneer research works have proposed a large number of acoustic features (log power spectrogram, linear frequency cepstral coefficients, constant Q cepstral coefficients, etc.) for audio deepfake detection, obtaining good performance, and showing that different subbands have different contributions to audio deepfake detection. However, this lacks an explanation of the specific information in the subband, and these features also lose information such as phase. Inspired by the mechanism of synthetic speech, the fundamental frequency (F0) information is used to improve the quality of synthetic speech, while the F0 of synthetic speech is still too average, which differs significantly from that of real speech. It is expected that F0 can be used as important information to discriminate between bonafide and fake speech, while this information cannot be used directly due to the irregular distribution of F0. Insteadly, the frequency band containing most of F0 is selected as the input feature. Meanwhile, to make full use of the phase and full-band information, we also propose to use real and imaginary spectrogram features as complementary input features and model the disjoint subbands separately. Finally, the results of F0, real and imaginary spectrogram features are fused. Experimental results on the ASVspoof 2019 LA dataset show that our proposed system is very effective for the audio deepfake detection task, achieving an equivalent error rate (EER) of 0.43%, which surpasses almost all systems.
1. Introduction
As a biometric technology, automatic speaker verification (ASV) (Reynolds, 1995) has been widely used in various fields. However, spoofing attacks can forge fake audio to deceive ASV. The spoofing attacks mainly include audio playback, text-to-speech (TTS) (Shchemelinin and Simonchik, 2013), and voice conversion (VC) (Kinnunen et al., 2012). Recent spoofing attacks can easily fool existing ASV systems, which requires more advanced audio deepfake detection systems.
To increase the security of the ASV system and reduce the risk of spoofing attacks, the ASVspoof challenge has been successfully held in 2015 (Wu et al., 2015), 2017 (Kinnunen et al., 2017) , 2019 (Todisco et al., 2019) and 2021 (Yamagishi et al., 2021). And then the first Audio Deep Synthesis Detection Challenge (ADD 2022) (Yi et al., 2022) was also successfully held. To improve the performance of the audio deepfake detection system, some researchers divided the whole frequency band into different subbands and explored the impact of different frequency bands on the audio deepfake detection task. In (Chettri et al., 2020), it was proposed that the whole frequency band was divided into various disjoint subbands for research. And they proposed a joint subband modeling framework that uses different subnetworks to learn specific features of subbands. In (Wang and Yamagishi, 2021), a bandpass filter was used to filter or mask part of the specified frequency band, and the experimental results showed that the frequency band of 0.1-2.4KHz contains useful information to distinguish bonafide and fake speech. In (Zhang et al., 2021), the spectrogram was divided into two parts, high-frequency and low-frequency, and good performance was achieved in the low-frequency band. The authors concluded that the low subband effectively can avoid overfitting. However, as for (Chettri et al., 2020; Zhang et al., 2021), there is no basis for dividing different subbands. In addition, part of the frequency band information is lost after dividing the subbands.
For LPS, constant Q cepstral coefficients (CQCC), and linear frequency cepstral coefficients (LFCC), these features only contain the magnitude information. Many studies have shown that the phase spectrogram also contains a lot of speech information and is important for speech quality and intelligibility (Paliwal et al., 2011; Fan et al., 2020). Therefore, for the spectrogram of a speech signal, both the magnitude and phase information are indispensable. To make full use of the phase information, researchers have made many useful attempts. For example, In (Xiao et al., 2015), the group delay (GD) was applied as the phase information to acquire good performance. In (Liu et al., 2015), it was proposed to use the magnitude and phase information to extract super vectors, which also achieve good performance for speaker verification anti-spoofing. Whereas, due to the irregularity of the phase information, it cannot be used directly. It is still a challenging problem in making full use of the phase information.
In addition, for audio deepfake detection, it is particularly important to find discriminative features of bonafide and fake speech. In the field of speech synthetic, in order to make the generated speech sound more realistic and natural, researchers have introduced many speech characteristics, such as fundamental frequency (F0), energy, and duration. For example, in (Łańcucki, 2021), a new text-to-speech (TTS) model was proposed. The model predicts pitch contours during inference so that the generated speech can better match the semantics of the speech. This indicates that F0 is an important speech characteristic to improve speech naturalness. However, TTS and VC algorithms have difficulty in simulating the F0 contours of real speech. In (De Leon et al., 2012), the authors proposed to extract features from statistical measures of pitch patterns, also achieveing good performance for audio deepfake dectetion task. This further indicate that F0 is an important discriminative feature. Unfortunately, the F0 information, like phase information, is difficult to use directly due to the irregularity of its distribution. Therefore, how to use F0 information is also worth studing in this field.
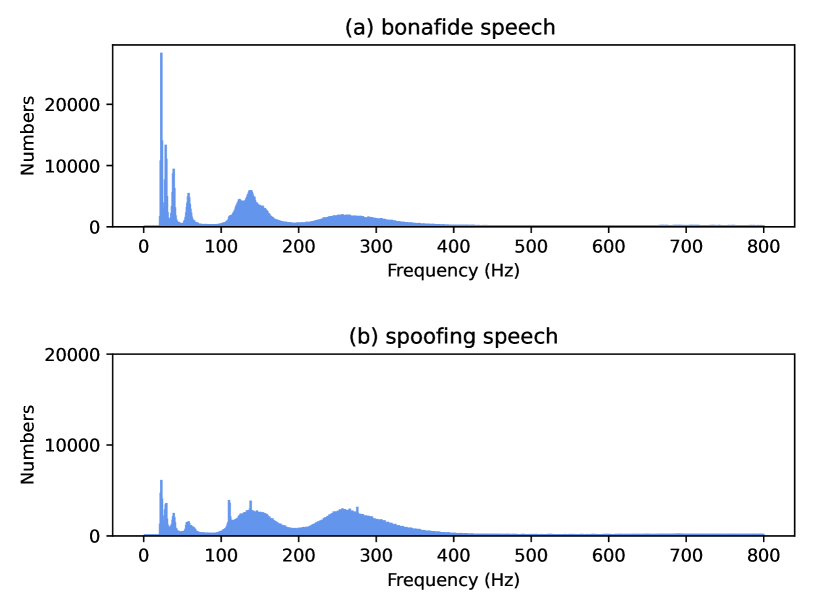
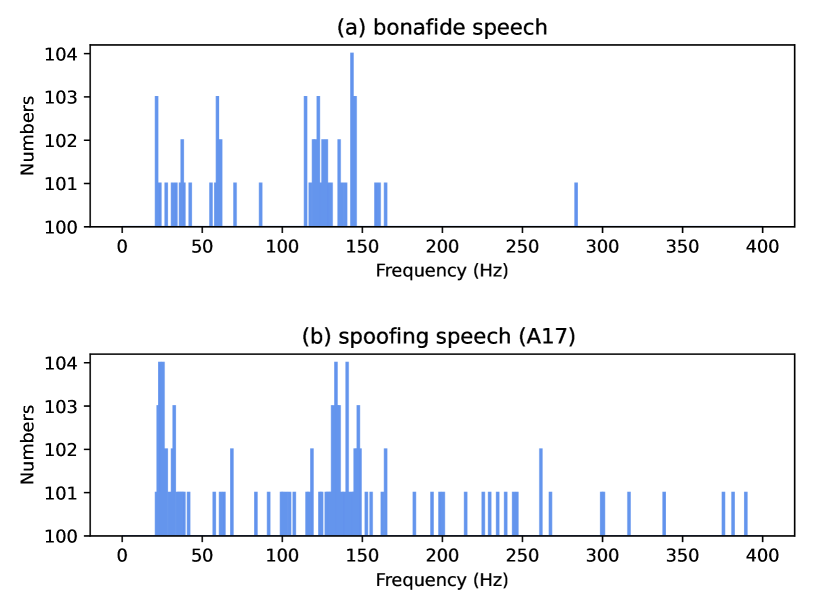
To address the above issues, we propose an F0 subband feature for audio deepfake detection. Fig. 1 shows the number of F0 versus frequency for real speech and fake speech in the ASVspoof 2019 LA evaluation set. In Fig. 2, we choose the real and fake voices of the male voice, and show the F0 distribution at 0-400Hz. It is well known that A17 (waveform filtering) is the most difficult type of spoofing attack to be detected, so we selected the A17 type for fake voice. The horizontal axis is the frequency, and the vertical axis is the nunber of F0 at that frequency. From Fig. 1 and 2 we can observe the following phenomena: 1) Regardless of bonafide speech or fake speech, most of the F0 is distributed between 0-400Hz; 2) In Fig. 1, the F0 distribution of the fake speech is relatively smooth, while the F0 distribution of the real speech has obvious crests, indicating that F0 contains important distinguishing information.; 3) In Fig. 2, in frequency ranging from 0 to 150 Hz, the bonafide speech and spoofing speech have the similar F0 distribution, while they are quite different in frequency from 150 Hz to 400 Hz, where the fake speech has F0 in higher frequencies. Although F0 does range from 50 Hz to 450 Hz in statistics, one utterance spoken by a person cannot have a so large range of frequency in most cases.
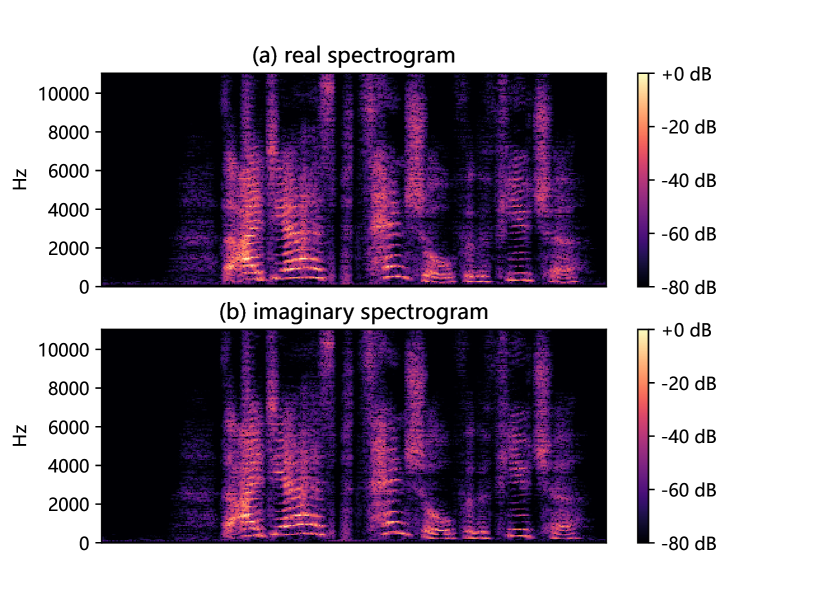
Although it is relatively difficult to find the F0 distribution pattern of real speech and that of synthetic speech, as discussed above, the discriminative information of F0 can be important for the audio deepfake detection task. We propose to use the frequency band containing most of the F0 information as an F0 feature. The experimental results show that the single system based on the F0 subband achieves good performance. However, the F0 subband contains only a very small part of the frequency band information, and other information of speech is also important for the detection task, such as phase spectrogram and information of other frequency bands. Therefore, real and imaginary spectrograms are also selected as input features. Fig. 3 shows the real and imaginary spectrogram of ‘LAT1138215.wav’ on the ASVspoof 2019 LA dataset. From Fig. 3, we can see that the two magnitude spectrograms are very similar because thier only different is the phase part (Eq. (6) and (7)). Therefore, it is not necessary to fully utilize all subbands. We propose to model the low-frequency subbands of the imaginary spectrogram and the high-frequency subbands of the real spectrogram separately so that the multi-scale phase information can be fully utilized and fused to obtain the first-stage result. Finally, the F0 subband and the first-stage results are fused to further improve the performance of the audio deepfake detection system. Experimental results on the ASVspoof 2019 LA dataset show that our proposed system is promising for the audio deepfake detection task, achieving an equivalent error rate (EER) of 0.43%.
The rest of this paper is organized as follows. Section 2 introduces the related works. The proposed method is introduced in section 3. Experiments and results are given in section 4. Section 5 draws conclusions.
2. Relate work
F0 is the most basic parameter of speech, so many synthetic speech (Janyoi and Seresangtakul, 2020; Le Moine et al., 2021) introduce F0 to improve the quality and similarity. The authors of (Ren et al., 2020) have further improved the speech quality by extracting the duration, pitch, and energy in the speech waveform and using the predicted values in their inference. The literature (Qian et al., 2020) significantly improves the speech similarity by improving the autoencoder-based speech transformation to generate speech that is consistent with the target speaker F0. In addition, many studies (Patel and Patil, 2017; Ge et al., 2022; Yang et al., 2019a) show that different subbands contain different discriminative information.
And about how to use the phase information has also been widely studied (Wang et al., 2015; Xiao et al., 2015). The literature (Chen et al., 2022) by taking all the magnitude spectrogram, real spectrogram and imaginary spectrogram as input to make full use of the phase information. The literature (Wang et al., 2017) uses modified relative phase information (MRP) and combines it with Mel frequency cepstrum coefficients (MFCC) and group delay to further improve the performance of fake speech detection system.
3. Our proposed system
In this section, we illustrate our proposed method for audio deepfake detection by subband fusion of F0, imaginary and real spectrograms. Recently, synthetic speech has improved speech quality by introducing F0 information, but the distribution of F0 in real speech is extremely difficult to capture so the difference between F0 is very large. Fig. 1 shows that most of the F0 is distributed at 0-400Hz, therefore, we recommend using the 0-400Hz frequency band as the F0 subband frequency. Furthermore, to introduce other frequency band information and phase information, etc. in the fake speech detection task, we propose to also model the high-frequency subband of the real spectrogram and the low-frequency subband of the imaginary spectrogram. Finally, the performance of the audio deepfake detection system is further improved by a two-stage fusion algorithm.
| Systems | t-DCF | EER(%) | Systems | t-DCF | EER(%) | Systems | t-DCF | EER(%) | Systems | t-DCF | EER(%) |
|---|---|---|---|---|---|---|---|---|---|---|---|
| LPS(F0) | 0.0358 | 1.21 | PA(F0) | 0.1538 | 5.26 | Imag(F0) | 0.3387 | 12.93 | Real(F0) | 0.3060 | 13.59 |
| LPS(Rest) | 0.2450 | 11.51 | PA (Rest) | 0.2099 | 7.20 | Imag(Rest) | 0.3052 | 11.71 | Real(Rest) | 0.3145 | 11.36 |
| LPS(L) | 0.0537 | 1.76 | PA (L) | 0.1251 | 4.48 | Imag(L) | 0.1371 | 5.44 | Real(L) | 0.1430 | 5.84 |
| LPS(H) | 0.3542 | 13.27 | PA (H) | 0.4054 | 17.64 | Imag(H) | 0.4596 | 18.96 | Real(H) | 0.4598 | 26.40 |
| LPS(Full) | 0.1378 | 4.80 | PA (Full) | 0.1351 | 4.67 | Imag(Full) | 0.2585 | 10.51 | Real(Full) | 0.2711 | 10.23 |
3.1. F0 subband
The proposed F0 subband is based on the LPS. Firstly, the time domain raw waveform is converted into time-frequency (T-F) domain by short-time Fourier transformation (STFT).
| (1) |
where is the time index of raw waveform . means the operation of STFT. and are the corresponding real and imaginary part of STFT, respectively. is the index of time frame and is the index of frequency bin. and are the number of frequency bins and time frames, respectively. The full frequency bands of LPS can be acquired as follows:
| (2) |
where is the full frequency band of LPS.
From Fig. 1 we can find that most of the F0 is distributed between 0-400 Hz. Therefore, the 0-400 Hz of LPS is applied as our F0 subband .
| (3) |
3.2. Real and imaginary spectrogram
The F0 subband removes the phase information and most of the band information, so we consider using real and imaginary spectrograms to solve this problem. First, the phase angle and magnitude are expressed as follows:
| (4) |
| (5) |
The full frequency band of the real spectrogram and imaginary spectrogram can be represented as follows:
| (6) |
| (7) |
is the phase angle obtained above.
Inspired by (Zhang et al., 2021), we divide the real spectrogram and imaginary spectrogram into two subbands, namely low-frequency (0-4000 Hz) subband and high-frequency (4000-8000 Hz) subband. Fig. 3 shows the real and imaginary spectrogram of ‘LAT1138215.wav’ on the ASVspoof 2019 LA dataset. From Fig. 3 we can see that the real and imaginary spectrogram are almost similar, so we consider that it is not necessary to fully utilize all the frequency bands of the real and imaginary spectrogram.
Moreover, according to Eq. (6) and (7), we can see that the phase information contained in the real spectrogram is of another scale for the imaginary spectrogram. Therefore, we propose that using the low subband of the imaginary spectrogram and the high subband of the real spectrogram to complement each other will get better results.
| (8) |
| (9) |
| Stage | Block |
|---|---|
| conv2d, , stride , padding | |
| Conv | BatchNorm, ReLU |
| maxpool, , stride , padding | |
| Layer1 | [SENet Block, 16, stride ] |
| Layer2 | [SENet Block, 32, stride ] |
| Layer3 | [SENet Block, 64, stride ] |
| Layer4 | [SENet Block, 128, stride ] |
| Global Average Pooling, A-Softmax | |
is the low-frequency subband of the imaginary spectrogram, and is the high-frequency subband of the real spectrogram.
| Systems | t-DCF | EER(%) |
|---|---|---|
| LPS(F0+Rest) | 0.0186 | 0.59 |
| LPS(L+H) | 0.0375 | 1.41 |
| PA(F0+Rest) | 0.0825 | 3.03 |
| PA(L+H) | 0.0860 | 3.16 |
| Imag(F0+Rest) | 0.1621 | 6.59 |
| Imag(L+H) | 0.1406 | 4.25 |
| Real(F0+Rest) | 0.1736 | 7.20 |
| Real(L+H) | 0.1676 | 5.01 |
| Imag(F0)+Real(Rest) | 0.1658 | 7.15 |
| Imag(L)+Real(H) | 0.1644 | 4.89 |
| Imag(Rest)+Real(F0) | 0.1742 | 6.56 |
| Imag(H)+Real(L) | 0.1469 | 4.43 |
| Systems | t-DCF | EER(%) | Systems | t-DCF | EER(%) |
| PA(F0+Rest)+ LPS(F0) | 0.0184 | 0.63 | Imag(F0+Rest)+ LPS(F0) | 0.0368 | 1.18 |
| PA(F0+Rest)+ LPS(L) | 0.0286 | 0.89 | Imag(F0+Rest)+ LPS(L) | 0.0477 | 1.72 |
| PA(F0+Rest)+ LPS(F0+Rest) | 0.0267 | 0.98 | Imag(F0+Rest)+ LPS(F0+Rest) | 0.0501 | 1.85 |
| PA(F0+Rest)+ LPS(L+H) | 0.0341 | 1.30 | Imag(F0+Rest)+ LPS(L+H) | 0.0654 | 2.52 |
| PA(L+H)+ LPS(F0) | 0.0226 | 0.70 | Imag(L+H)+ LPS(F0) | 0.0159 | 0.47 |
| PA(L+H)+ LPS(L) | 0.0326 | 1.09 | Imag(L+H)+ LPS(L) | 0.0271 | 0.85 |
| PA(L+H)+ LPS(F0+Rest) | 0.0178 | 0.58 | Imag(L+H)+ LPS(F0+Rest) | 0.0158 | 0.48 |
| PA(L+H)+ LPS(L+H) | 0.0287 | 0.99 | Imag(L+H)+ LPS(L+H) | 0.0462 | 1.54 |
| Systems | t-DCF | EER(%) | Systems | t-DCF | EER(%) |
| Real(F0+Rest) + LPS(F0) | 0.0321 | 1.03 | (Imag(H)+Real(L)) + LPS(F0) | 0.0165 | 0.50 |
| Real(F0+Rest) + LPS(L) | 0.0481 | 1.64 | (Imag(H)+Real(L)) + LPS(L) | 0.0299 | 0.89 |
| Real(F0+Rest) + LPS(F0+Rest) | 0.0512 | 1.68 | (Imag(H)+Real(L)) + LPS(F0+Rest) | 0.0156 | 0.49 |
| Real(F0+Rest) + LPS(L+H) | 0.0664 | 2.47 | (Imag(H)+Real(L)) + LPS(L+H) | 0.0482 | 1.56 |
| Real(L+H) + LPS(F0) | 0.0156 | 0.50 | (Imag(L)+Real(H)) + LPS(F0) | 0.0143 | 0.43 |
| Real(L+H) + LPS(L) | 0.0278 | 0.89 | (Imag(L)+Real(H)) + LPS(L) | 0.0266 | 0.84 |
| Real(L+H) + LPS(F0+Rest) | 0.0133 | 0.44 | (Imag(L)+Real(H)) + LPS(F0+Rest) | 0.0212 | 0.66 |
| Real(L+H) + LPS(L+H) | 0.0448 | 1.42 | (Imag(L)+Real(H)) + LPS(L+H) | 0.0429 | 1.40 |
3.3. F0, imaginary and real spectrogram subbands fusion
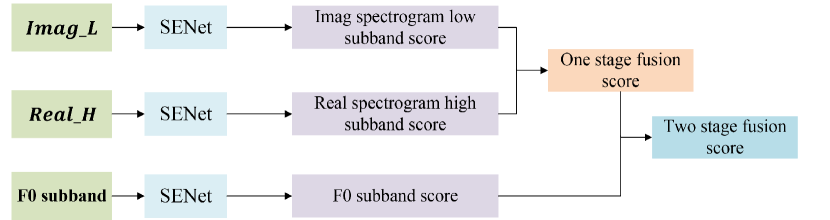
Inspired by (Zhang et al., 2021), the squeeze-and-excitation ResNet (SENet) (Hu et al., 2018) is applied as the classifier of different subbands. Those different subbands are fed into each SENet to obtain their scores. In order to make full use of other frequency bands and phase information, we propose a two-stage fusion algorithm to further improve the performance of the audio deepfake detection system. Fig. 4 shows our proposed two-stage fusion framework. Firstly, the scores of and are fused:
| (10) |
where the and represent the scores of and , respectively. The fusion score of the first stage is expressed as . Thus, contains most of the speech information, including other frequency band and multi-scale phase information. is the weight of the fisrt-stage fusion.
Finally, the score of F0 is fused with to improve the performance of audio deepfake detection:
| (11) |
where is the final fusion score, is the F0 subband score . is the weight of the second-stage fusion.
4. Experiments and Results
4.1. Dataset
The ASVspoof 2019 database contains two subsets: LA and PA. The experiments in this paper are based on the LA subset. The LA subset contains three types of spoofing attacks: TTS, VC, and audio replay. The LA subset is divided into three parts, training, development, and evaluation. The training and development sets share the same six attacks (A01-A06), including four TTS and two VC algorithms. The evaluation set includes two known attacks (A16 and A19) and 11 unknown attacks (A07-A15, A17, and A18).
The training set is used to train the model, the development set is used to select the model with the best performance, and finally, the evaluation set is used for evaluation.
In order to quantitatively evaluate the performance of different audio deepfake detection systems, in this paper, all experiments are used EER and the minimum normalized tandem detection cost function (min t-DCF) as evaluation indicators. The EER is the working point where the false rejection rate (FRR) and false acceptance rate (FAR) are equal.
4.2. Experimental setup
As for the STFT, we set the Blackman window length and hop length of short-time Fourier transform to 1728 and 130, respectively. Therefore, the dimension of the spectrogram is 865. In order to facilitate batch processing, we fix the number of the frame at 600 by truncation or concatenating.
F0 subband in our experiment is based on LPS feature extraction. From Fig. 1 we can find that most of the F0 is distributed between 0-400 Hz. Therefore, we apply the 0-400 Hz LPS as our F0 subband. Therefore, the first 0-45 dimension is used as the F0 subband, and finally, the feature size of the F0 subband is 45600.
For the imaginary spectrogram, we choose dimensions 0-433 as low-frequency subbands; for the real spectrogram, we choose 433-865 dimensions as high-frequency subbands. Finally, the feature sizes of the low-frequency subbands of the imaginary spectrogram and the high-frequency subbands of the real spectrogram have dimensions 433600 and 432600, respectively. In addition, we also use the phase angle (PA) as our contrast feature, and the subband division is the same as the other features.
Inspired by (Zhang et al., 2021), we use SENet34 (Hu et al., 2018) as deep neural network classifier in the experiment. Table 2 illustrates the architecture of SENet34, including strides, channels, and repeat times. In addition, during the experiment, we use Adam as the optimizer, and the parameters of the optimizer are set to: , , and weight decay . The number of the epoch is 32.
and are the weight coefficient of our two-stage fusion algorithm, both set to 0.5.
(a) Single systems System t-DCF EER% CQCC+GMM (B1) LFCC+GMM (B2) LFCC-LCNN (Lavrentyeva et al., 2019) FFT-LCNN (Lavrentyeva et al., 2019) LFCC-Siamese CNN (Lei et al., 2020) FFT-LCGRNN (Gomez-Alanis et al., 2020) RW-Resnet (Ma et al., 2021) Ling et al. (Ling et al., 2021) FFT-L-SENet (Zhang et al., 2021) AASIST (Gomez-Alanis et al., 2020) LPS(F0) (ours) 0.0358 1.21
4.3. Experimental results
4.3.1. Effectiveness of F0 subband
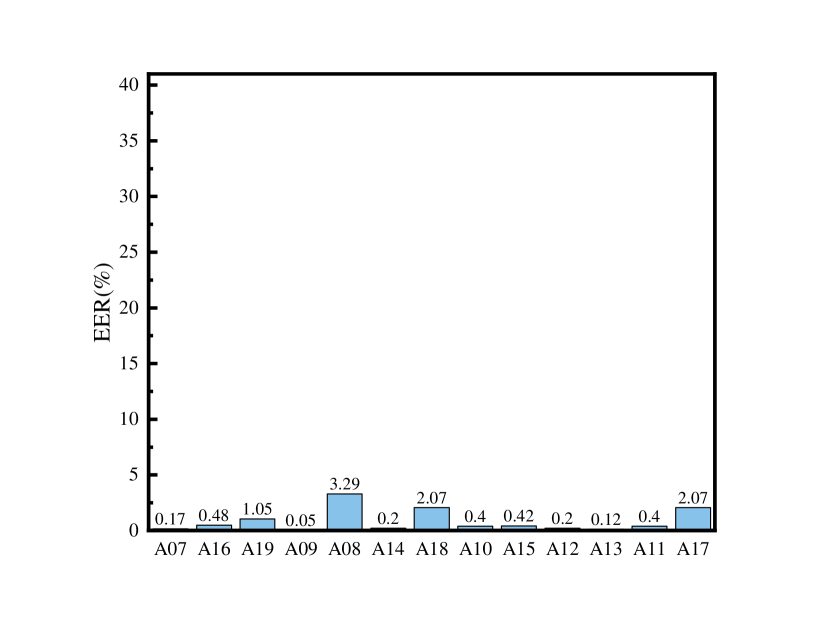
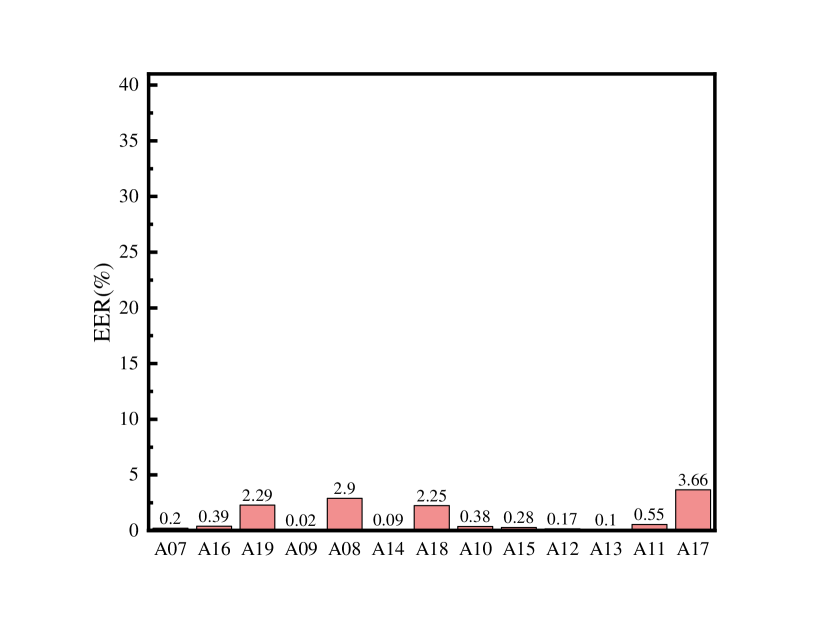
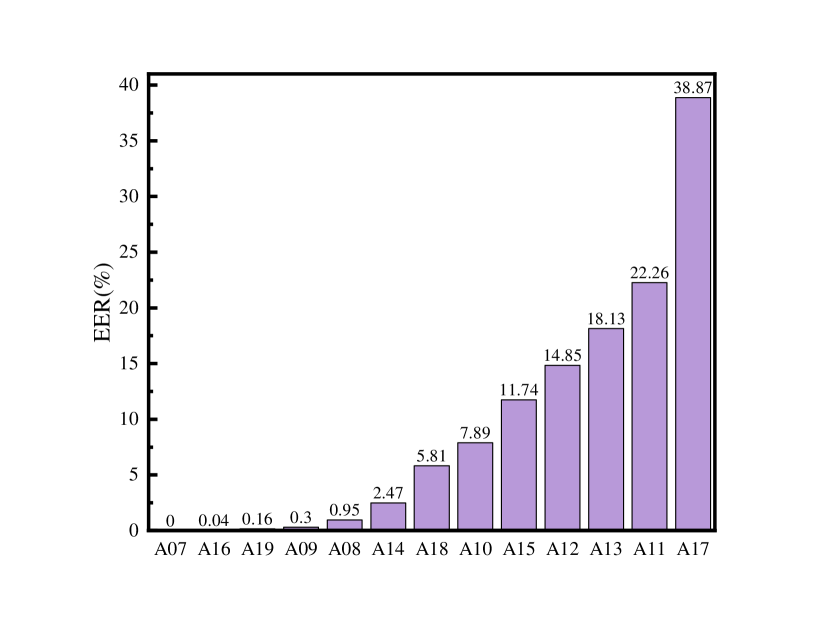
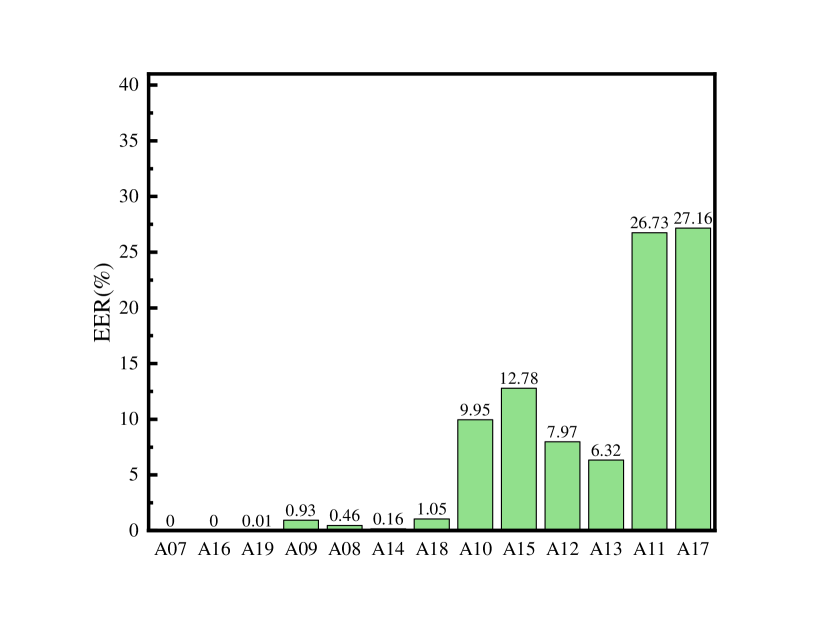
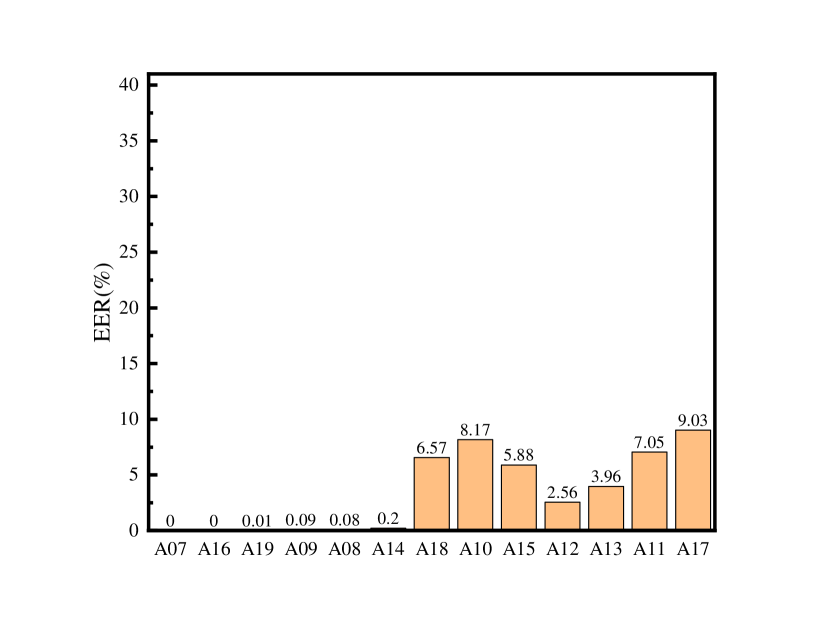
Table 1 shows the minimum t-DCF and EER results of different frequency bands. “F0” represents the subbands with the widest fundamental frequency distribution. “Rest” represents the full bands except F0 subband. “L” and “H” denote the low and high subbands, respectively. “Full” represents the full frequency bands. Fig.5 shows the detailed performance of LPS in different attacks of the evaluation set.
1) In the LPS feature, the EER of the F0 subband is 1.21%, and the EER of the low subband is 1.72%. We believe that the identification ability of LPS low subband is mainly derived from the F0 subband. This is because the low subband (0-4000Hz) has ten times frequency band information than the F0 (0-400Hz), but in the audio deepfake detection, The performance in the task is much worse. The experimental results show that the F0 subband is an important identification feature.
2) For the PA, real and imaginary spectrogram features, the performance of modeling their subbands individually is poor. This may be due to the fact that these features all contain phase information and the irregularity of the phase information leads to their poor modeling performance individually.
3) In the Fig.5(a) and 5(b), we can see that the F0 sub-band feature are good for the invisible attack. For the infamous attacks such as A17 (waveform filtering), the F0 subband can still capture different information with a real speech. We believe that these synthetic speech may be the lack of details of F0 information.
4) High-frequency information is important for some attack types. Even if the features of high -frequency features are not well performed in terms of overall performance, we can see that in the Fig.5(c) ,Fig.5(d) and 5(e), compared to the lower frequency features, these features are very effective for A07 (vocoder), A16(waveform concatenation), A19 (spectral filtering) and A08 (neural waveform), which is also our motivation to combine the high-frequency feature.
4.3.2. Fusion results of various frequency bands
Table 3 and Table 4 show the minimum t-DCF and EER results for the first and second stage fusion systems, respectively. “+” denotes the fusion operation. From the Table 3 and Table 4 we can observe the following results:
1) The non -intersecting sub -band can complement each other. Regardless of the frequency band division method, its systems can further improve performance after fusion. For example, ‘LPS (F0+Rest)’ can get 0.59% EER results.
2) Phase information is indispensable. In order to verify the importance of phase, we model the phase angle (PA). After the fusion of the phase angle, its performance has been greatly improved. For example, the EER results of ‘PA (F0+Rest)+ LPS (F0)’ and PA ‘(L+H)+ LPS (F0)’ were 0.63% and 0.70%, respectively.
3) The fusion of the imag spectrogram and real spectrogram can get the best results. ‘Imag(L+ H)+ LPS (F0)’ can obtain 0.47% EER. After replacing this high-frequency part to the real spectrogram, ‘(Imag (L)+ Real (H))+ LPS (F0)’ can get 0.43% EER. We think this is the income by different scale phase information. Alternatively, ‘Real(L+H) + LPS(F0+Rest)’ also obtains good results, but this requires the embedding of four systems and ‘(Imag (L)+ Real (H))+ LPS (F0)’ is clearly more competitive.
4.3.3. Comparison with other systems
We compare our proposed system with other systems based on the ASVspoof 2019 LA dataset. Among them, Table 5a shows 10 single systems that perform well, B1 and B2 being the baseline systems on the ASVspoof 2019 LA dataset. As can be seen from Table 5a, our proposed single system based on the F0 subband obtains 1.21% EER and 0.0358 t-DCF, and only a small gap with the top-ranked system. This is because we fix the classifier, using more advanced classifiers can further improve the performance of the F0 subband. The experimental results show that F0 is an effective discriminant feature. This not only provides a basis for dividing frequency bands but also proposes a method to fully utilize the F0 information.
Table 5b shows six primary systems that perform well, our proposed fusion system based on the F0 subband of LPS and different subbands of the real and imag spectrogram achieves 0.43% EER, outperforming the second-ranked system among all known systems (EER1.12%). This is because for the LFCC-Capsule Fusion System (Luo et al., 2021), T45 (Lavrentyeva et al., 2019), T60 (Chettri et al., 2019) and Ling et al. (Ling et al., 2021) the features are based on the magnitude spectrogram, and for the FFT-L- SENet (Zhang et al., 2021) system, whose features are based on low frequency and magnitude spectrogram, which will lead to loss of information and phase information in high frequency. Although the RW-Resnet (Ma et al., 2021) and RAWNet2 (Tak et al., 2021) systems are based on the original waveform without losing speech information, the original waveform is affected by many factors, and it is difficult to effectively distinguish between real and fake speech. In addition, the T05 is obtained from 7 single systems, including 2 ResNet systems, 4 MobileNet systems, and a DenseNet system. However, the system we proposed only includes 3 single systems, so we think that the system we propose is relatively simple, and we can further improve performance by improving the classifier.
5. Conclusions
In this paper, we propose an audio deepfake detection method based on the F0 subband, which not only fully uses the F0 information, but also provides a new and effective basis for frequency band division. The F0 distribution of the synthetic speech is quite different to that of the real speech, which motivates us to use F0 information as a discrimination. However, it is difficult to model F0 alone. So we use the frequency bands containing most F0 information as the F0 subband feature. The experimental results show that the F0 subband is an effective identification feature. In addition, to make full use of voice information, we first model the low subband of imaginary spectrogram and the high subband of the real spectrogram. Finally, it is fused with the F0 subband by a two-stage fusion method. The results on ASVspoof 2019 LA dataset shows that our proposed method is very effective for audio deepfake detection, and obtaining a minimum t-DCF of 0.0143 and an EER of 0.43%. For future work, we will consider using more speech time-variant characteristics as discriminative features, and make full use of all the effective information of speech to further improve the performance of the audio deepfake detection system.
6. Acknowledgements
This work is supported by the National Key Research and Development Program of China (No. 2021ZD0201502), the National Natural Science Foundation of China (NSFC) (No.61972437), the Open Research Projects of Zhejiang Lab (NO. 2021KH0AB06), the Open Projects Program of National Laboratory of Pattern Recognition (NO. 202200014), and the National Environmental Protection Engineering and Technology Center for Road Traffic Noise Control.
References
- (1)
- Chen et al. (2022) Jun Chen, Zilin Wang, Deyi Tuo, Zhiyong Wu, Shiyin Kang, and Helen Meng. 2022. FullSubNet+: Channel Attention FullSubNet with Complex Spectrograms for Speech Enhancement. In ICASSP 2022-2022 IEEE International Conference on Acoustics, Speech and Signal Processing (ICASSP). IEEE, 7857–7861.
- Chettri et al. (2020) Bhusan Chettri, Tomi Kinnunen, and Emmanouil Benetos. 2020. Subband Modeling for Spoofing Detection in Automatic Speaker Verification. In Proceedings of Odyssey 2020: The Speaker and Language Recognition Workshop. ISCA.
- Chettri et al. (2019) B Chettri, D Stoller, V Morfi, Martínez Ramírez, E Benetos, and Bob Sturm. 2019. Ensemble models for spoofing detection in automatic speaker verification. In Proc. Interspeech 2019. 1018–1022.
- De Leon et al. (2012) Phillip L De Leon, Bryan Stewart, and Junichi Yamagishi. 2012. Synthetic Speech Discrimination using Pitch Pattern Statistics Derived from Image Analysis.
- Fan et al. (2020) Cunhang Fan, Jianhua Tao, Bin Liu, Jiangyan Yi, Zhengqi Wen, and Xuefei Liu. 2020. End-to-end post-filter for speech separation with deep attention fusion features. IEEE/ACM Transactions on Audio, Speech, and Language Processing 28 (2020), 1303–1314.
- Ge et al. (2022) Wanying Ge, Jose Patino, Massimiliano Todisco, and Nicholas Evans. 2022. Explaining deep learning models for spoofing and deepfake detection with SHapley Additive exPlanations. In ICASSP 2022-2022 IEEE International Conference on Acoustics, Speech and Signal Processing (ICASSP). IEEE, 6387–6391.
- Gomez-Alanis et al. (2020) Alejandro Gomez-Alanis, Jose A Gonzalez-Lopez, and Antonio M Peinado. 2020. A kernel density estimation based loss function and its application to asv-spoofing detection. IEEE Access 8 (2020), 108530–108543.
- Hu et al. (2018) Jie Hu, Li Shen, and Gang Sun. 2018. Squeeze-and-excitation networks. In Proceedings of the IEEE conference on computer vision and pattern recognition. 7132–7141.
- Janyoi and Seresangtakul (2020) Pongsathon Janyoi and Pusadee Seresangtakul. 2020. Tonal Contour Generation for Isarn Speech Synthesis Using Deep Learning and Sampling-Based F 0 Representation. Applied Sciences 10, 18 (2020), 6381.
- Kinnunen et al. (2017) Tomi Kinnunen, Md. Sahidullah, Héctor Delgado, Massimiliano Todisco, Nicholas Evans, Junichi Yamagishi, and Kong Aik Lee. 2017. The ASVspoof 2017 Challenge: Assessing the Limits of Replay Spoofing Attack Detection. In Proc. Interspeech 2017. 2–6.
- Kinnunen et al. (2012) Tomi Kinnunen, Zhi-Zheng Wu, Kong Aik Lee, Filip Sedlak, Eng Siong Chng, and Haizhou Li. 2012. Vulnerability of speaker verification systems against voice conversion spoofing attacks: The case of telephone speech. In 2012 IEEE International Conference on Acoustics, Speech and Signal Processing (ICASSP). IEEE, 4401–4404.
- Łańcucki (2021) Adrian Łańcucki. 2021. Fastpitch: Parallel text-to-speech with pitch prediction. In ICASSP 2021-2021 IEEE International Conference on Acoustics, Speech and Signal Processing (ICASSP). IEEE, 6588–6592.
- Lavrentyeva et al. (2019) G Lavrentyeva, A Tseren, M Volkova, A Gorlanov, A Kozlov, and S Novoselov. 2019. STC antispoofing systems for the AsVspoof2019 challenge. In Proc. Interspeech 2019. 1033–1037.
- Le Moine et al. (2021) Clément Le Moine, Nicolas Obin, and Axel Roebel. 2021. Towards end-to-end F0 voice conversion based on Dual-GAN with convolutional wavelet kernels. In 2021 29th European Signal Processing Conference (EUSIPCO). IEEE, 36–40.
- Lei et al. (2020) Zhenchun Lei, Yingen Yang, Changhong Liu, and Jihua Ye. 2020. Siamese Convolutional Neural Network Using Gaussian Probability Feature for Spoofing Speech Detection. In Proc. Interspeech. 1116–1120.
- Ling et al. (2021) Hefei Ling, Leichao Huang, Junrui Huang, Baiyan Zhang, and Ping Li. 2021. Attention-Based Convolutional Neural Network for ASV Spoofing Detection. In Proc. Interspeech 2021. 4289–4293.
- Liu et al. (2015) Yi Liu, Yao Tian, Liang He, Jia Liu, and Michael T Johnson. 2015. Simultaneous utilization of spectral magnitude and phase information to extract supervectors for speaker verification anti-spoofing. In Sixteenth Annual Conference of the International Speech Communication Association.
- Luo et al. (2021) Anwei Luo, Enlei Li, Yongliang Liu, Xiangui Kang, and Z Jane Wang. 2021. A Capsule Network Based Approach for Detection of Audio Spoofing Attacks. In ICASSP 2021-2021 IEEE International Conference on Acoustics, Speech and Signal Processing (ICASSP). IEEE, 6359–6363.
- Ma et al. (2021) Youxuan Ma, Zongze Ren, and Shugong Xu. 2021. RW-Resnet: A Novel Speech Anti-Spoofing Model Using Raw Waveform. In Proc. Interspeech 2021. 4144–4148.
- Paliwal et al. (2011) Kuldip Paliwal, Kamil Wójcicki, and Benjamin Shannon. 2011. The importance of phase in speech enhancement. Speech Communication 53, 4 (2011), 465–494.
- Patel and Patil (2017) Tanvina B Patel and Hemant A Patil. 2017. Significance of source–filter interaction for classification of natural vs. spoofed speech. IEEE Journal of Selected Topics in Signal Processing 11, 4 (2017), 644–659.
- Qian et al. (2020) Kaizhi Qian, Zeyu Jin, Mark Hasegawa-Johnson, and Gautham J Mysore. 2020. F0-consistent many-to-many non-parallel voice conversion via conditional autoencoder. In ICASSP 2020-2020 IEEE International Conference on Acoustics, Speech and Signal Processing (ICASSP). IEEE, 6284–6288.
- Ren et al. (2020) Yi Ren, Chenxu Hu, Xu Tan, Tao Qin, Sheng Zhao, Zhou Zhao, and Tie-Yan Liu. 2020. FastSpeech 2: Fast and High-Quality End-to-End Text to Speech. In International Conference on Learning Representations.
- Reynolds (1995) Douglas A Reynolds. 1995. Speaker identification and verification using Gaussian mixture speaker models. Speech Communication 17, 1-2 (1995), 91–108.
- Shchemelinin and Simonchik (2013) Vadim Shchemelinin and Konstantin Simonchik. 2013. Examining Vulnerability of Voice Verification Systems to Spoofing Attacks by Means of a TTS System. In Proceedings of the 15th International Conference on Speech and Computer-Volume 8113. 132–137.
- Tak et al. (2020) H. Tak, J.Patino, A. NAutsch, N. Evans, and M. Todisco. 2020. Spoofing attack detection using the non-linear fusion of sub-band classifiers. In Proc. Interspeech. 1106–1110.
- Tak et al. (2021) Hemlata Tak, Jose Patino, Massimiliano Todisco, Andreas Nautsch, Nicholas Evans, and Anthony Larcher. 2021. End-to-end anti-spoofing with RawNet2. In ICASSP 2021-2021 IEEE International Conference on Acoustics, Speech and Signal Processing (ICASSP). IEEE, 6369–6373.
- Todisco et al. (2019) Massimiliano Todisco, Xin Wang, Ville Vestman, Md. Sahidullah, Héctor Delgado, Andreas Nautsch, Junichi Yamagishi, Nicholas Evans, Tomi H. Kinnunen, and Kong Aik Lee. 2019. ASVspoof 2019: Future Horizons in Spoofed and Fake Audio Detection. In Proc. Interspeech 2019. 1008–1012.
- Wang et al. (2017) Longbiao Wang, Seiichi Nakagawa, Zhaofeng Zhang, Yohei Yoshida, and Yuta Kawakami. 2017. Spoofing speech detection using modified relative phase information. IEEE Journal of selected topics in signal processing 11, 4 (2017), 660–670.
- Wang et al. (2015) Longbiao Wang, Yohei Yoshida, Yuta Kawakami, and Seiichi Nakagawa. 2015. Relative phase information for detecting human speech and spoofed speech. In Sixteenth Annual Conference of the International Speech Communication Association.
- Wang and Yamagishi (2021) Xin Wang and Junichi Yamagishi. 2021. Investigating self-supervised front ends for speech spoofing countermeasures. arXiv preprint arXiv:2111.07725 (2021).
- Wu et al. (2015) Zhizheng Wu, Tomi Kinnunen, Nicholas Evans, Junichi Yamagishi, Cemal Hanilçi, Md. Sahidullah, and Aleksandr Sizov. 2015. ASVspoof 2015: the first automatic speaker verification spoofing and countermeasures challenge. In Proc. Interspeech 2015. 2037–2041.
- Xiao et al. (2015) Xiong Xiao, Xiaohai Tian, Steven Du, Haihua Xu, Engsiong Chng, and Haizhou Li. 2015. Spoofing speech detection using high dimensional magnitude and phase features: the NTU approach for ASVspoof 2015 challenge.. In Interspeech. 2052–2056.
- Yamagishi et al. (2021) Junichi Yamagishi, Xin Wang, Massimiliano Todisco, Md Sahidullah, Jose Patino, Andreas Nautsch, Xuechen Liu, Kong Aik Lee, Tomi Kinnunen, Nicholas Evans, et al. 2021. ASVspoof 2021: accelerating progress in spoofed and deepfake speech detection. In ASVspoof 2021 Workshop-Automatic Speaker Verification and Spoofing Coutermeasures Challenge.
- Yang et al. (2019a) Jichen Yang, Rohan Kumar Das, and Haizhou Li. 2019a. Significance of subband features for synthetic speech detection. IEEE Transactions on Information Forensics and Security 15 (2019), 2160–2170.
- Yang et al. (2019b) Y. Yang, H. Wang, H. Dinkel, Z. Chen, S. Wang, Y. Qian, and K. Yu. 2019b. The sjtu robust anti-spoofing systems for the asvspoof 2019 challenge. In Proc. Interspeech. 1038–1042.
- Yi et al. (2022) Jiangyan Yi, Ruibo Fu, Jianhua Tao, Shuai Nie, Haoxin Ma, Chenglong Wang, Tao Wang, Zhengkun Tian, Ye Bai, Cunhang Fan, et al. 2022. Add 2022: the first audio deep synthesis detection challenge. In ICASSP 2022-2022 IEEE International Conference on Acoustics, Speech and Signal Processing (ICASSP). IEEE, 9216–9220.
- Zhang et al. (2021) Yuxiang Zhang, Wenchao Wang, and Pengyuan Zhang. 2021. The Effect of Silence and Dual-Band Fusion in Anti-Spoofing System. In Proc. Interspeech 2021. 4279–4283.