SMART: Sentences as Basic Units for Text Evaluation
Abstract
Widely used evaluation metrics for text generation either do not work well with longer texts or fail to evaluate all aspects of text quality. In this paper, we introduce a new metric called SMART to mitigate such limitations. Specifically, We treat sentences as basic units of matching instead of tokens, and use a sentence matching function to soft-match candidate and reference sentences. Candidate sentences are also compared to sentences in the source documents to allow grounding (e.g., factuality) evaluation. Our results show that system-level correlations of our proposed metric with a model-based matching function outperforms all competing metrics on the SummEval summarization meta-evaluation dataset, while the same metric with a string-based matching function is competitive with current model-based metrics. The latter does not use any neural model, which is useful during model development phases where resources can be limited and fast evaluation is required. Finally, we also conducted extensive analyses showing that our proposed metrics work well with longer summaries and are less biased towards specific models.
1 Introduction
One major obstacle in the progress of text generation tasks (e.g., document summarization, long-form question answering, data-to-text generation, etc.) is automatic evaluation. Traditionally, automatic metrics that rely on discrete token-level matching such as ROUGE Lin (2004) and BLEU Papineni et al. (2002) have been utilized to check whether system outputs are of high quality across four dimensions Kryscinski et al. (2019); Yuan et al. (2021): coherence, factuality, fluency, and informativeness. These metrics do not correlate well with human judgments on all four dimensions of text quality Fabbri et al. (2021). Because of this, the evaluation is usually coupled with human elicitation studies that ask humans to rate texts. These studies can be expensive and nearly impossible to reproduce.
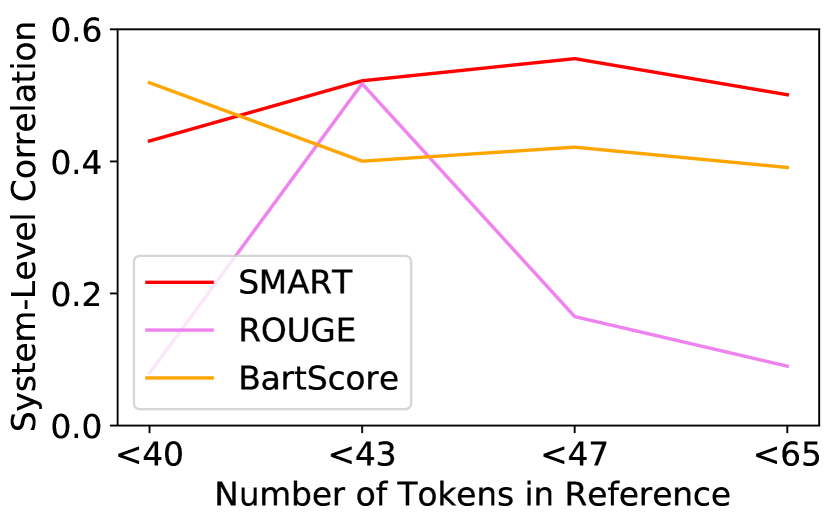
More recently, pretrained language models are leveraged for automatically evaluating system-generated texts Zhang* et al. (2020); Sellam et al. (2020); Yuan et al. (2021), which have shown improvements on correlation with human judgments. Nevertheless, both ROUGE and LM-based metrics have three major drawbacks. Firstly, these metrics are not good at evaluating long and multi-sentence texts. Figure 1 illustrates system-level rank correlations of ROUGE in different text lengths, which shows that after a certain length, ROUGE drastically decreases its evaluative power. By design, ROUGE is also not robust to evaluating possibly shuffled information in long outputs, hurting its performance on evaluating coherence. On the other hand, LM-based metrics such as the state-of-the-art BARTScore Yuan et al. (2021), are constrained to the length limitation of the pretrained LM used, thus they are not able to evaluate outputs longer than this limit. Secondly, most of these metrics only use reference texts during evaluation. This restricts the capability of the metrics from evaluating dimensions of text quality that requires grounding to the source. Yuan et al. (2021) suggested to use the source document during evaluation, however their evaluation is still limited to short documents because of length limitations in LMs. Finally, LM-based metrics can be very slow, which hinders usage in the model development stages, where quick evaluation is necessary. As such, most practitioners use ROUGE in these stages, which can lead to suboptimal modeling.
In this paper, we propose an automatic metric called SMART (Sentence MAtching for Rating Text). To support long and multi-sentence texts, we treat sentences as basic units of matching instead of tokens. Since sentences most likely do not have exact matches, we use a soft-matching function that returns a matching score between 0 and 1, given a pair of sentences. We experiment with several string-based and powerful model-based soft-matching functions with SMART (see §5). Moreover, to allow grounded evaluation, we also include the source in the calculation of the metric. Similar to ROUGE, we introduce multiple SMART versions using sentence n-gram overlap and longest common subsequence. We show that SMART with BLEURT Sellam et al. (2020) as a soft-matching function outperforms all the approaches we compared against on all four dimensions of quality in the SummEval dataset Fabbri et al. (2019). Moreover, a faster variant of SMART, which does not use any neural model for text matching, shows competitive correlations with human judgments. Finally, our extensive analyses show that SMART works better with longer summaries and is less biased towards specific models. We will release and maintain a toolkit containing scripts to easily run evaluation using SMART.
2 Related Work
String-based Text Evaluation
Evaluation in conditional generation tasks such as machine translation and document summarization is a long-standing problem. Traditionally, evaluation involves human elicitation studies that score texts based on different metrics of quality, such as adequacy, fidelity, and fluency in machine translation Hovy (1999), and coherence, conciseness, fluency, readability, and content relevance in summarization Mani (2001). Automatic metrics based on token n-gram matching have been developed to replace these expensive and time-consuming studies, in which ROUGE Lin (2004) and BLEU Papineni et al. (2002) are most widely used in summarization and translation, respectively. Several extensions to token n-gram matching have been proposed, such as using paraphrases, synonyms Lavie and Agarwal (2007), and word embeddings Ng and Abrecht (2015) to handle cases that are semantically equivalent, and downweighting common n-grams to focus more on salient ones Vedantam et al. (2015). Popović (2015) instead use character-level n-gram matching to also match words that are conjugated differently and support morphologically rich languages.
Model-based Text Evaluation
With the introduction and success of pretrained language models such as BERT Devlin et al. (2019) and BART Lewis et al. (2020), evaluation metrics that leverage them have been proposed. BERTScore Zhang* et al. (2020) leverages contextualized token embeddings from BERT and obtains pairwise matching of tokens from reference and system summaries. MoverScore Zhao et al. (2019) extends BERTScore by instead having many-to-one soft alignments using Word Mover’s Distance (WMD; Kusner et al., 2015). BLEURT Sellam et al. (2020) fine-tunes BERT to predict human scores with large-scale synthetic training data. BARTScore Yuan et al. (2021) uses BART and treats evaluation as a text generation problem, using likelihood of predicting the system summary given the source document or the reference summary. Clark et al. (2019) and Zhao et al. (2019) also explored sentence-level matching with WMD using (contextualized) sentence embeddings, however they show no concrete improvements over other model-based metrics Fabbri et al. (2021). In contrast, we show that our metric which uses sentence-level matching correlates better with human judgments than all competing models.
Factuality in summarization Falke et al. (2019); Maynez et al. (2020) is usually evaluated separately since most automatic metrics are focused on informativeness and do not include the source document in the metric calculation. Factuality-specific metrics can be divided into three approaches: natural language inference (NLI) based approaches Falke et al. (2019); Maynez et al. (2020); Laban et al. (2022), where a summary is considered factual if all its facts are entailed by the source document, model-based approaches Kryscinski et al. (2020); Deng et al. (2021), where a model is trained to detect factual errors in the summary, and question answering (QA) based approaches Durmus et al. (2020); Wang et al. (2020); Honovich et al. (2021), where questions generated in a factual summary should be answerable using the source. While we also compare correlations of automatic metrics with human judgments on factuality, the goal of our work is to find holistic metrics for evaluation that can also effectively evaluate other dimensions of text quality. Our results show that other dimensions such as coherence, fluency, and informativeness also benefit in the use of the source documents in the metric. Finally, our results also show that our metric is at least comparable with both NLI- and QA-based factuality specific metrics Honovich et al. (2021, 2022) in evaluating factuality, while outperforming them in evaluating other dimensions of quality. While there are meta-evaluation datasets that focus mainly on factual consistency evaluation Falke et al. (2019); Wang et al. (2020); Honovich et al. (2022), we leave exploration of our metrics on those datasets as future work.
3 Problem Definition
We use document summarization – the task of generating concise and accurate summaries of input documents Mani (2001) – to explain our metric, but the proposed metric can be easily adapted to other text generation tasks.
Let be a list of source documents, be a list of summaries generated for by a candidate system, and be a list of reference summaries produced by human annotators for . Note that can be a nested list, i.e., for each example, there can be multiple references. Moreover, let be a list of dimensions of summary quality, and let be a list of human-annotated scores for in terms of a certain summary quality . For each summary quality , the problem is to devise an evaluation metric that outputs a list of scores that correlates well with . Note that, unlike most of previous work on summarization evaluation Lin (2004); Clark et al. (2019); Bhandari et al. (2020); Fabbri et al. (2021), we also take into account source documents when calculating metric . This ensures that the metric can evaluate quality dimensions that require looking at the source.
We define the list of summary quality as the following four dimensions of summary quality, defined as follows (based on definitions in Fabbri et al., 2021 and Yuan et al., 2021):
-
•
Coherence: The summary should be well-structured and well-organized. The summary should not just be a heap of related information, but should build from sentence to sentence to a coherent body of information about a topic.
-
•
Factuality: The summary should only contain statements that are entailed by the source document. The summary should not contain hallucinated facts that either do not exist in the source or contradict facts from the source.
-
•
Fluency: The summary should have no formatting problems, capitalization errors or obviously ungrammatical sentences (e.g., fragments, missing components) that make the text difficult to read.
-
•
Informativeness: The summary should include only important information from the source document. The summary should not include redundant information and information that are considered excessive and non-salient.
4 Sentence Matching for Rating Text
We now describe our proposed metric, SMART (Sentence MAtching for Rating Text), which has two key ideas. Firstly, we treat sentences as basic units of matching between system and reference summaries, instead of tokens. At sentence-level, exactly matching sentences are most likely non-existent (in datasets with abstractive reference summaries), thus we instead utilize soft-matching functions to compare sentences. Similar to ROUGE, we present two types of SMART: n-gram overlap (SMART-N) and longest common subsequence (SMART-L). Secondly, SMART allows to compare the candidate system summary with both the reference summary and the source document. This is particularly important when evaluating dimensions of summary quality that rely on the source document such as factuality.
4.1 SMART-N
In order for SMART to work, summaries should be split into sentences. Let and be the sequence of sentences of the reference and the candidate system summary. SMART-N finds pairs of sentence n-grams in and that have the highest matching scores given by a sentence matching function that returns a score between 0 and 1 (detailed description in Section 5).
Formally, given as the number of sentences in the sentence n-gram, SMART-N can be calculated as follows:
| (1) | ||||
| (2) | ||||
| (3) | ||||
| (4) | ||||
| (5) |
where is the sentence matching function, , , and are precision, recall, and f-measure, respectively. Note that unlike ROUGE, the numerators of precision and recall are different due to the use of a soft-matching function, thus they are calculated separately. In our experiments, we used SMART-1 and SMART-2111 In special cases where either the candidate or the reference is a single-sentence summary, a normal implementation of SMART-2 would return zero since one of the summaries would have zero sentence bigrams. To mitigate this issue, we pad summaries with a blank sentence on both sides when calculating SMART-2. This ensures that we get a non-zero score for single-sentence summaries. In fact, SMART-2 reduces to SMART-1 in this case. , but SMART-N can be easily extended to work with larger s.
4.2 SMART-L
SMART-L is essentially the Longest Common Subsequence (LCS) of sentences in the reference and the candidate system summary. However, the original LCS algorithm requires an exact match to work. We instead use a soft version of LCS, where the task is defined as: Given two sequences and and a matching function , find two soft-subsequences and of length with and , maximizing the sum .
Unlike normal subsequences, soft-subsequences allow repetition of sentences as long as they do not go back to previous sentences (hence the use of operator). This relaxation helps in cases where the meaning of a sentence on one side spans over multiple sentences on the other side. Furthermore, Soft-LCS is similar but different from a simple sequence alignment problem since the weight of the match depends on both the positions of the items in the sequence and the items themselves. It is a less-restricted version of the Heaviest Common Subsequence (HCS; Jacobson and Vo, 1992) since the matching function is relaxed to allow the use of a soft match (which is essentially an exact mismatch) in the subsequence.
It turns out that Soft-LCS can be solved using a dynamic programming algorithm similar to that of LCS, which is illustrated as a pseudocode in Figure 2. The main difference is that since we do not require an exact match, we always take the maximum among three cases: (1) choosing to soft-match and , (2) choosing to soft-match and , and (3) choosing to skip .
Given the Soft-LCS function, we can then calculate SMART-L as follows:
| (6) | ||||
| (7) | ||||
| (8) | ||||
| (9) | ||||
| (10) |
4.3 Comparing with Source
Some dimensions of summary quality require access to source to be effectively evaluated. To cover those dimensions, SMART also compares the candidate system summary with the source, in addition to comparison with the reference summary. Let be the sequence of sentences of the source document. SMART that uses both source and reference is calculated as follows. We first calculate two SMART scores that (1) compares candidate system summary with reference summary , and (2) compares with source document . Then, we aggregate the scores by taking their maximum. For example, SMART-N is calculated as:
| (11) |
4.4 Multiple References
Finally, when there are multiple reference summaries, we calculate SMART for each reference, and aggregate them by taking their maximum, as also commonly done in previous work Fabbri et al. (2021). This is intuitive since the candidate system summary only needs to match with at least one of the reference.
4.5 Shorter Acronym
We use the following template to describe SMART variants in a space-efficient manner:
S[1|2|L]-m
where m is the sentence matching function of choice. For example, SMART-1 with a BLEURT Sellam et al. (2020) matching function can be shortened into S1-BLEURT.
5 Sentence Matching Functions
The scores we get from SMART depend on the sentence matching function match. We investigate six different sentence matching functions widely used in both machine translation and document summarization literature. Specifically, we compare three string-based and three model-based matching functions. The former do not rely on accelerators (GPUs/TPUs) while the latter leverage pretrained neural models. Thus, we expect string-based matching functions to be inferior, but they are good alternatives for faster evaluation or when accelerators are not available.
ROUGE Lin (2004)
A popular document summarization evaluation metric, it measures the number of overlapping textual units. As with most summarization work, we explored three types of textual units: unigrams (ROUGE-1), bigrams (ROUGE-2), and longest common subsequence (ROUGE-L).
BLEU Papineni et al. (2002)
A popular machine translation evaluation metric, it is a precision-focused metric that calculates n-gram overlap between two texts and also includes a brevity penalty.
CHRF Popović (2015)
Another machine translation evaluation metric, it calculates character-based n-gram overlap between system and reference sentences. Unlike ROUGE and BLEU which operate at the token level, CHRF is more effective especially in morphologically-rich languages as it does not require any tokenization, lemmatization, and stemming Mathur et al. (2020); Kocmi et al. (2021).
BERTScore Zhang* et al. (2020)
A model-based metric that leverages contextualized token embeddings from BERT(-like models). It computes similarity scores by aligning tokens from reference and candidate summaries, and token alignments are computed greedily to maximize cosine similarity.
T5-ANLI Honovich et al. (2022)
Another model-based metric mainly used to evaluate factuality, which uses T5 Raffel et al. (2020) fine-tuned on the ANLI dataset Nie et al. (2020) to produce a score between 0 (not entailed) and 1 (entailed) given a premise and a hypothesis. We use the source/reference as premise and the candidate summary as hypothesis.
BLEURT Sellam et al. (2020)
A supervised model-based metric that uses BERT that is trained to predict human judgment scores using a small-scale dataset. To make it more robust, the model is first pretrained with a large-scale synthetic dataset. Moreover, it is optimized using several objectives including ROUGE, BLEU, BERTScore, and entailment. BLEURT has been shown to be effective in evaluating sentence match in machine translation, thus we expect it to be the better matching function among all matching functions.
One advantage of SMART is that it is easily extensible by changing the matching functions to better ones. This means that a more domain-specific matching function can be used for evaluation towards specific domains, or a better-performing sentence matching metric can be used to improve overall evaluation.
6 Experiments and Results
6.1 Experimental Setting
Dataset and Evaluation
We conducted experiments on the SummEval dataset Fabbri et al. (2021), a document summarization meta-evaluation suite consisting of summaries from the CNN/DM dataset Hermann et al. (2015). Annotation is done in two stages and using experts to ensure high quality and high agreement across annotators. There are 1600 data points (16 systems 100 examples) in total, each of which includes a score between 1 to 5 for each of the four dimensions of summary quality, which represents the average score given by three experts. Each data point also includes 11 reference summaries: the original summary from the CNN/DM dataset and 10 human-written abstractive summaries from Kryscinski et al. (2020). For evaluation, we use system-level correlation using Kendall tau, where we first take the average score for each system and take the correlation.222 While they claimed to report system-level correlation, the BARTScore paper Yuan et al. (2021) actually calculated summary-level correlation Louis and Nenkova (2013), where they first get correlation for each system and then take the average. Since we use evaluation metrics to rank systems, we report system-level correlation following Fabbri et al. (2021).
Implementation Details
The sentence matching functions are implemented as follows. We used the rouge-score333https://pypi.org/project/rouge-score/ Python library with default settings (i.e., without stemmer and no sentence-splitting of summaries with newlines) to calculate token-level ROUGE. We used the implementation of BLEU and CHRF in sacrebleu444https://pypi.org/project/sacrebleu/. We used the widely used default version of BERTScore555https://github.com/Tiiiger/bert_score, which uses the roberta-large model in the transformers library Wolf et al. (2020). For T5-ANLI, we used the same implementation as in Honovich et al. (2022), where T5-11B is fine-tuned with 25K training steps on ANLI Nie et al. (2020), treating both contradiction and neutral pairs as not entailed. Finally, for BLEURT Sellam et al. (2020), we used the BLEURT-20 checkpoint666https://github.com/google-research/bleurt suggested by the authors which also supports non-English languages. Sentences are split using nltk777https://pypi.org/project/nltk/. For all experiments, we report f-measure scores whenever available, such as in ROUGE, BERTScore, and SMART. We also report the version of SMART that considers both source and reference as in Eq 11.
| Match Fn. | S. Type | Coh | Fac | Flu | Inf | |
| SMART with String-based Matching Functions | ||||||
| ROUGE-1 | S1 | .233 | .733∗ | .494 | .500∗ | .490 |
| S2 | .217 | .683 | .477 | .417 | .448 | |
| SL | .267 | .700 | .460 | .467 | .473 | |
| ROUGE-2 | S1 | .183 | .650 | .477 | .417 | .432 |
| S2 | .183 | .650 | .477 | .417 | .432 | |
| SL | .217 | .650 | .444 | .383 | .423 | |
| ROUGE-L | S1 | .233 | .733∗ | .527∗ | .500∗ | .498 |
| S2 | .217 | .683 | .477 | .417 | .448 | |
| SL | .267 | .700 | .460 | .467 | .473 | |
| BLEU | S1 | .300 | .733∗ | .527∗ | .467 | .507 |
| S2 | .283 | .717 | .510 | .450 | .490 | |
| SL | .317 | .717 | .460 | .483 | .494 | |
| CHRF | S1 | .300 | .733∗ | .494 | .500∗ | .507 |
| S2 | .300 | .700 | .460 | .433 | .473 | |
| SL | .367∗ | .733∗ | .494 | .500∗ | .523 | |
| SMART with Model-based Matching Functions | ||||||
| BERTScore | S1 | .317 | .683 | .561 | .517 | .519 |
| S2 | -.017 | .383 | .276 | .183 | .207 | |
| SL | .383 | .683 | .527 | .583 | .544 | |
| T5-ANLI | S1 | .117 | .550 | .444 | .350 | .365 |
| S2 | .133 | .533 | .360 | .333 | .340 | |
| SL | .117 | .483 | .343 | .350 | 323 | |
| BLEURT | S1 | .433 | .667 | .644∗ | .667 | .603 |
| S2 | .417 | .750∗ | .628∗ | .528 | .594 | |
| SL | .567∗ | .567 | .611 | .733∗ | .619 | |
6.2 SMART with Different Matching Functions
We first compare different variants of SMART using the six matching functions described in Section 5. Table 1 shows their system-level correlations, where Coh, Fac, Flu, and Inf stand for coherence, factuality, fluency, and informativeness, respectively. Among string-based matching functions, CHRF performs the best in terms of average correlation, followed by BLEU. This shows that machine translation metrics are better sentence matchers. Among model-based matching functions, BLEURT performs the best by a large margin; SMART with BLEURT significantly outperforms all the other model-based variants on all dimensions of summary quality. We believe that this is because BLEURT is optimized to match sentences, as well as to predict ROUGE, BLEU, BERTScore, and entailment scores. Interestingly, T5-ANLI as a matching function underperforms even in the factuality dimension. We posit that this is because sentences are passed to the matching function without their neighboring context.
| Metric | Coh | Fac | Flu | Inf | |
|---|---|---|---|---|---|
| String-based Metrics | |||||
| ROUGE-1 | .350 | .550 | .527 | .583 | .503 |
| ROUGE-2 | .233 | .600 | .494 | .433 | .440 |
| ROUGE-L | .117 | .117 | .259 | .350 | .211 |
| BLEU | .217 | .050 | .326 | .383 | .244 |
| CHRF | .350 | .617 | .561 | .550 | .519 |
| S1-CHRF | .300 | .733 | .494 | .500 | .507 |
| S2-CHRF | .300 | .700 | .460 | .433 | .473 |
| SL-CHRF | .367 | .733 | .494 | .500 | .523 |
| Source-free Model-based Metrics | |||||
| BERTScore | .333 | -.030 | .142 | .200 | .161 |
| MoverScore | .217 | -.050 | .259 | .350 | .194 |
| BLEURT | .533 | .200 | .410 | .467 | .403 |
| SMS | .267 | .600 | .360 | .400 | .407 |
| Source-dependent Model-based Metrics | |||||
| PRISM | .233 | .600 | .360 | .367 | .390 |
| Q2 | .250 | .750 | .577 | .450 | .507 |
| T5-ANLI | .250 | .583 | .544 | .517 | .473 |
| BARTScore | .350 | .617 | .494 | .450 | .478 |
| BARTScore+CNN† | .550 | .317 | .594 | .583 | .511 |
| S1-BLEURT | .433 | .667 | .644 | .667 | .603 |
| S2-BLEURT | .417 | .750 | .628 | .583 | .594 |
| SL-BLEURT | .567 | .567 | .611 | .733 | .619 |
6.3 SMART Compared to Other Text Evaluation Metrics
We compared SMART with three types of metrics: string-based metrics, source-free and source-dependent model-based metrics.
String-based metrics include: (1-3) ROUGE-1/2/L Lin (2004) measuring token-level overlap between reference and output summaries; (4) BLEU Papineni et al. (2002) measuring token-level overlap between reference and output summaries with a focus on precision; (5) CHRF Popović (2015) measuring character-based n-gram overlap between reference and output summaries; and (6-8) S1/2/L-CHRF, our best SMART metric using a string-based matching function from Table 1.
Source-free model-based metrics include: (9) BERTScore Zhang* et al. (2020): A metric that relies on BERT(-like) models Devlin et al. (2019) and computes an aggregation of the token-level similarity scores; (10) MoverScore Zhao et al. (2019): measures the semantic distance between BERT n-gram embeddings of reference and candidate summaries using Word Mover’s Distance (WMD; Kusner et al., 2015); (11) BLEURT Sellam et al. (2020): finetunes BERT using a combination of real and synthetic training data with gold-/silver-standard human judgment scores; and (12) Sentence Mover’s Similarity (SMS; Clark et al., 2019): uses an extension of WMD that works with sentences instead of tokens.
Source-dependent model-based metrics include: (13) PRISM Thompson and Post (2020): leverages a zero-shot paraphrasing model and uses probabilities from force-decoding the candidate summary given the source as input; (14) Q2 Honovich et al. (2021): employs question generation and question answering models and checks whether answers from the summary are entailed by answers from source; (15) T5-ANLI Honovich et al. (2022): fine-tunes T5 Raffel et al. (2020) using the ANLI dataset Nie et al. (2020) to produce an entailment score given the source as premise and the summary as hypothesis; (16-17) BARTScore(+CNN) Yuan et al. (2021): evaluates text using probabilities from force-decoding the candidate summary given the source as input using BART Lewis et al. (2020) without (with) finetuning with CNN/DM summarization dataset Hermann et al. (2015); and (18-20) S1/2/L-BLEURT: Our best SMART metric using a model-based matching function from Table 1.
Table 2 reports the system-level correlations of different metrics for each quality dimension. For all quality dimensions, SMART with BLEURT matching function has the highest correlation, where SL-BLEURT evaluates coherence and informativeness better, and S1-BLEURT and S2-BLEURT evaluate factuality and fluency better, respectively. On average, SL-BLEURT performs best, followed by S1-BLEURT and S2-BLEURT, all three of which outperforming BARTScore+CNN, which is finetuned on the same summarization dataset as SummEval. S2-BLEURT also performs comparably with Q2 in factuality evaluation. Given that each of the SMART metrics are better at evaluating different quality dimensions, it is therefore recommended to use them as a set, similar to how ROUGE metrics are used. We can also see in the table that source-dependent metrics are better than source-free ones, signifying the importance of the use of source documents during summary evaluation. Among source-free metrics, SMS performs the best, showing the superiority of sentence-level matching metrics against the token-level ones. Among string-based metrics, SL-CHRF performs the best, with a competitive system-level correlation when compared with BARTScore+CNN on average. This shows that SMART achieves comparable evaluation power with previous LM-based metrics even without using any pretrained language models.
6.4 Ablation Studies
We present various ablation studies on the different components of SMART in Table 3. For simplicity, we report on SMART-X, an average of SMART-l, SMART-2 and SMART-L.888From here on, we use X to correspond to the average of the three [1|2|L] variants of ROUGE or SMART. The first block contains SMART-X that uses only either precision or recall, both of which have substantially lower system-level correlation than f-measure. The recall variant performs better, which follows results from traditionally recall-oriented evaluation metrics in summarization Lin (2004).
| Component | Coh | Fac | Flu | Inf | |
|---|---|---|---|---|---|
| SX-BLEURT | .450 | .750 | .661 | .650 | .628 |
| using precision or recall | |||||
| precision | .083 | .017 | .259 | .350 | .177 |
| recall | .283 | .683 | .410 | .383 | .440 |
| using a different source/reference aggregation | |||||
| ref-only | -.100 | -.300 | -.092 | -.033 | -.131 |
| src-only | .267 | .700 | .460 | .433 | .465 |
| average | .400 | .750 | .577 | .600 | .582 |
| minimum | .267 | .700 | .427 | .467 | .465 |
| using a different reference summary | |||||
| ref-only (CNN/DM) | -.100 | -.300 | -.059 | -.033 | -.123 |
| ref-only (best system) | .367 | .100 | .410 | .500 | .344 |
| max (CNN/DM) | .500 | .767 | .711 | .667 | .661 |
| max (best system) | .667 | .467 | .745 | .867 | .686 |
The second block contains different ways to aggregate SMART scores that compare candidate summaries (1) to the source documents and (2) to the reference summaries. When using only one of the two scores (i.e., reference- or source-only), SMART scores significantly perform worse, which implies that using both source and reference is necessary for SMART to work. We also tried aggregation through taking the average or the minimum, both of which perform worse than taking the maximum as in Eq 11.
One interesting finding is that using only the reference summaries to calculate SMART gives negative correlation scores on all dimensions. Given the findings from Fabbri et al. (2021) that CNN/DM summaries are worse than system summaries in terms of human ratings, we further investigated using different reference summaries for SMART. Specifically, we tried (1) replacing the set of reference summaries from SummEval into the original summary from CNN/DM, and (2) treating the best system summary according to the average human score as the reference. As can be seen in the third block of Table 3, CNN/DM reference summaries correlate negatively on all dimensions. When using the best system summary as the reference, SMART now obtains positive correlations across all dimensions. The correlation further improves when SMART uses both the source and the new reference.
7 Further Analyses
SMART Works Well with Longer Summaries
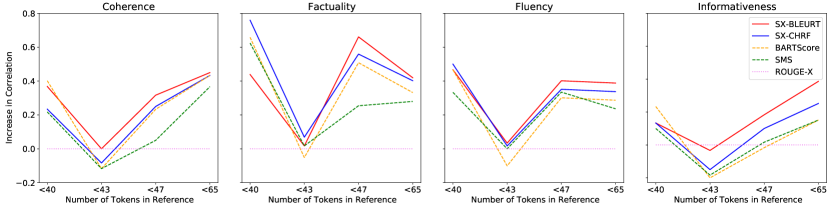
We divided the datasets into four buckets based on the average number of tokens in the reference summary, where the first bucket contains the shortest reference summaries. For each bucket, we then calculated system-level correlation for all competing metrics. For each quality dimension, we report the relative increase in correlation with respect to ROUGE-X, which is illustrated in Figure 3. As can be seen in the figure, in general, all metrics perform better relative to ROUGE as the number of tokens increases from 43 tokens, which shows that ROUGE is not suitable for long summary evaluation. Interestingly, ROUGE also underperforms in the first bucket, which means that it is also not good at evaluating short summaries. Among the competing metrics, SX-BLEURT (and SX-CHRF) correlate the best (and second best) when the there are more tokens in the source/reference.
| Metric | (Rank Diff) | Pairwise Acc. | |
|---|---|---|---|
| ROUGE-X | 5.012 | 63.33 | |
| SMS | 5.500 | 63.33 | |
| BARTScore | 4.717 | 67.50 | |
| SX-CHRF | 5.232 | 65.00 | |
| Coh | SX-BLEURT | 4.228 | 72.50 |
| ROUGE-X | 4.228 | 70.00 | |
| SMS | 2.915 | 80.83 | |
| BARTScore | 2.915 | 80.83 | |
| SX-CHRF | 2.062 | 86.67 | |
| Fac | SX-BLEURT | 2.151 | 87.50 |
| ROUGE-X | 3.969 | 72.50 | |
| SMS | 4.650 | 67.50 | |
| BARTScore | 4.031 | 75.00 | |
| SX-CHRF | 3.824 | 74.17 | |
| Flu | SX-BLEURT | 2.646 | 83.33 |
| ROUGE-X | 3.841 | 75.00 | |
| SMS | 4.783 | 70.00 | |
| BARTScore | 4.500 | 72.50 | |
| SX-CHRF | 4.198 | 75.00 | |
| Inf | SX-BLEURT | 2.739 | 82.50 |
SMART is Less Biased towards Specific Models
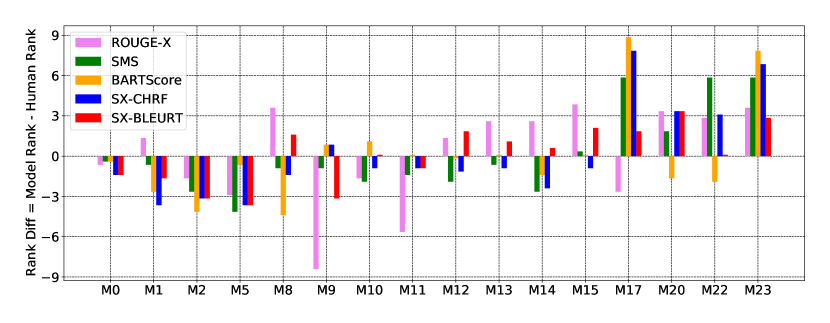
While we acknowledge that all automatic metrics are not perfect as shown in Table 2, their rankings should not be hugely different from human rankings. Moreover, they should not be biased towards a single summarization model. To this end, we get the difference in rankings given by humans and by the automatic metrics for each summarization model for each quality dimension. Figure 4 illustrates the resulting differences averaged over all dimensions of summary quality, in which we have two interesting observations. Firstly, all automatic metrics are in general biased towards ranking extractive systems higher. This suggests that a separate extractive and abstractive model evaluation is necessary using current automatic metrics. We leave exploration of metrics that are equally unbiased towards both extractive and abstractive for future work. Secondly, we found that BARTScore scores BART (M22 in Figure 4; Lewis et al., 2020) significantly higher than all the other models (BARTScore of BART is vs. on average without BART). This problem is amplified when BARTScore is finetuned using the CNN/DM dataset ( vs. ). This shows that using pretrained encoder-decoder models for summary evaluation induces bias towards summarization models finetuned on the same model.
In Figure 4, we can see that SX-BLEURT is the least biased since its rank differences with human scores are closer to zero. To quantitatively measure if the above statement is true, we use two measures. The first one is the standard deviation of the rank difference, where the score closest to zero can be considered the least biased. The second measure is the pairwise ranking accuracy, where for all pairs of system, we check whether human and metric rankings are equivalent. Table 4 shows these numbers, which show that SX-BLEURT has the lowest standard deviation of the rank difference and the highest pairwise rank accuracy across all quality dimensions. This entails that the metric is the least biased among the competing metrics.
8 Conclusions
In this paper, we proposed SMART (Sentence Matching for Rating Text), a new metric for evaluating generated text given both a source document and a reference text. SMART makes use of a sentence-level soft-matching function to match sentences, which can either be string-based or model-based depending on the available resources. This function can easily be replaced with new and better ones, which allows us to create a better SMART metric. We provided two types of SMART based on n-gram overlap and longest common subsequence, and our extensive experiments showed that SMART evaluates document summaries better in terms of all four dimensions of summary quality: coherence, factuality, fluency, and informativeness. Our analyses also showed that SMART is better as summary length increases and is less biased than other competing metrics. Based on our findings, we recommend using SMART-[1|2|L]-BLEURT for high quality evaluation (e.g., when comparing the final model with the state of the art), and using SMART-[1|2|L]-CHRF for fast evaluation (e.g., ablation studies and model development phases). Both versions are also suitable for multilingual texts, since BLEURT was finetuned using a multilingual BERT and CHRF is designed to handle morphologically-rich languages.
8.1 Limitations and Future Work
We acknowledge several limitations of our work. Firstly, while our proposed metric is designed to work on text generation tasks including long-form question answering and dialog response generation, our experiments are limited to using a news summarization meta-evaluation suite. This is due to the availability of meta-evaluation suite that holistically evaluates text on different dimensions of text quality. We plan to create a meta-evaluation suite using datasets with longer outputs and from non-news domains.
Currently, SMART assumes single-source inputs, which makes it non-trivial to use for evaluating texts in tasks with multi-source inputs. While this can be mitigated by concatenating documents in chronological order, there may be cases where such ordering is not possible. Ultimately, finding an efficient way to extend the (soft version of) longest common subsequence algorithm into multiple sources is necessary, which we plan to explore in the future.
Finally, we plan to maintain an open-source toolkit which includes scripts to easily run evaluation using SMART, and is updated accordingly when new features, such as better matching functions or support for multi-source inputs.
References
- Bhandari et al. (2020) Manik Bhandari, Pranav Narayan Gour, Atabak Ashfaq, Pengfei Liu, and Graham Neubig. 2020. Re-evaluating evaluation in text summarization. In Proceedings of the 2020 Conference on Empirical Methods in Natural Language Processing (EMNLP), pages 9347–9359, Online. Association for Computational Linguistics.
- Clark et al. (2019) Elizabeth Clark, Asli Celikyilmaz, and Noah A. Smith. 2019. Sentence mover’s similarity: Automatic evaluation for multi-sentence texts. In Proceedings of the 57th Annual Meeting of the Association for Computational Linguistics, pages 2748–2760, Florence, Italy. Association for Computational Linguistics.
- Deng et al. (2021) Mingkai Deng, Bowen Tan, Zhengzhong Liu, Eric Xing, and Zhiting Hu. 2021. Compression, transduction, and creation: A unified framework for evaluating natural language generation. In Proceedings of the 2021 Conference on Empirical Methods in Natural Language Processing, pages 7580–7605, Online and Punta Cana, Dominican Republic. Association for Computational Linguistics.
- Devlin et al. (2019) Jacob Devlin, Ming-Wei Chang, Kenton Lee, and Kristina Toutanova. 2019. BERT: Pre-training of deep bidirectional transformers for language understanding. In Proceedings of the 2019 Conference of the North American Chapter of the Association for Computational Linguistics: Human Language Technologies, Volume 1 (Long and Short Papers), pages 4171–4186, Minneapolis, Minnesota. Association for Computational Linguistics.
- Durmus et al. (2020) Esin Durmus, He He, and Mona Diab. 2020. FEQA: A question answering evaluation framework for faithfulness assessment in abstractive summarization. In Proceedings of the 58th Annual Meeting of the Association for Computational Linguistics, pages 5055–5070, Online. Association for Computational Linguistics.
- Fabbri et al. (2019) Alexander Fabbri, Irene Li, Tianwei She, Suyi Li, and Dragomir Radev. 2019. Multi-news: A large-scale multi-document summarization dataset and abstractive hierarchical model. In Proceedings of the 57th Annual Meeting of the Association for Computational Linguistics, pages 1074–1084, Florence, Italy. Association for Computational Linguistics.
- Fabbri et al. (2021) Alexander R. Fabbri, Wojciech Kryściński, Bryan McCann, Caiming Xiong, Richard Socher, and Dragomir Radev. 2021. SummEval: Re-evaluating summarization evaluation. Transactions of the Association for Computational Linguistics, 9:391–409.
- Falke et al. (2019) Tobias Falke, Leonardo F. R. Ribeiro, Prasetya Ajie Utama, Ido Dagan, and Iryna Gurevych. 2019. Ranking generated summaries by correctness: An interesting but challenging application for natural language inference. In Proceedings of the 57th Annual Meeting of the Association for Computational Linguistics, pages 2214–2220, Florence, Italy. Association for Computational Linguistics.
- Graham and Baldwin (2014) Yvette Graham and Timothy Baldwin. 2014. Testing for significance of increased correlation with human judgment. In Proceedings of the 2014 Conference on Empirical Methods in Natural Language Processing (EMNLP), pages 172–176, Doha, Qatar. Association for Computational Linguistics.
- Hermann et al. (2015) Karl Moritz Hermann, Tomáš Kočiský, Edward Grefenstette, Lasse Espeholt, Will Kay, Mustafa Suleyman, and Phil Blunsom. 2015. Teaching machines to read and comprehend. In Proceedings of the 28th International Conference on Neural Information Processing Systems - Volume 1, NIPS’15, page 1693–1701, Cambridge, MA, USA. MIT Press.
- Honovich et al. (2022) Or Honovich, Roee Aharoni, Jonathan Herzig, Hagai Taitelbaum, Doron Kukliansy, Vered Cohen, Thomas Scialom, Idan Szpektor, Avinatan Hassidim, and Yossi Matias. 2022. TRUE: Re-evaluating factual consistency evaluation. In Proceedings of the 2022 Conference of the North American Chapter of the Association for Computational Linguistics: Human Language Technologies, pages 3905–3920, Seattle, United States. Association for Computational Linguistics.
- Honovich et al. (2021) Or Honovich, Leshem Choshen, Roee Aharoni, Ella Neeman, Idan Szpektor, and Omri Abend. 2021. : Evaluating factual consistency in knowledge-grounded dialogues via question generation and question answering. In Proceedings of the 2021 Conference on Empirical Methods in Natural Language Processing, pages 7856–7870, Online and Punta Cana, Dominican Republic. Association for Computational Linguistics.
- Hovy (1999) Eduard H Hovy. 1999. Toward finely differentiated evaluation metrics for machine translation. In Proceedings of the EAGLES Workshop on Standards and Evaluation Pisa, Italy, 1999.
- Jacobson and Vo (1992) Guy Jacobson and Kiem-Phong Vo. 1992. Heaviest increasing/common subsequence problems. In Annual Symposium on Combinatorial Pattern Matching, pages 52–66. Springer.
- Kocmi et al. (2021) Tom Kocmi, Christian Federmann, Roman Grundkiewicz, Marcin Junczys-Dowmunt, Hitokazu Matsushita, and Arul Menezes. 2021. To ship or not to ship: An extensive evaluation of automatic metrics for machine translation. In Proceedings of the Sixth Conference on Machine Translation, pages 478–494, Online. Association for Computational Linguistics.
- Kryscinski et al. (2019) Wojciech Kryscinski, Nitish Shirish Keskar, Bryan McCann, Caiming Xiong, and Richard Socher. 2019. Neural text summarization: A critical evaluation. In Proceedings of the 2019 Conference on Empirical Methods in Natural Language Processing and the 9th International Joint Conference on Natural Language Processing (EMNLP-IJCNLP), pages 540–551, Hong Kong, China. Association for Computational Linguistics.
- Kryscinski et al. (2020) Wojciech Kryscinski, Bryan McCann, Caiming Xiong, and Richard Socher. 2020. Evaluating the factual consistency of abstractive text summarization. In Proceedings of the 2020 Conference on Empirical Methods in Natural Language Processing (EMNLP), pages 9332–9346, Online. Association for Computational Linguistics.
- Kusner et al. (2015) Matt J. Kusner, Yu Sun, Nicholas I. Kolkin, and Kilian Q. Weinberger. 2015. From word embeddings to document distances. In Proceedings of the 32nd International Conference on International Conference on Machine Learning - Volume 37, ICML’15, page 957–966. JMLR.org.
- Laban et al. (2022) Philippe Laban, Tobias Schnabel, Paul N. Bennett, and Marti A. Hearst. 2022. SummaC: Re-visiting NLI-based models for inconsistency detection in summarization. Transactions of the Association for Computational Linguistics, 10:163–177.
- Lavie and Agarwal (2007) Alon Lavie and Abhaya Agarwal. 2007. METEOR: An automatic metric for MT evaluation with high levels of correlation with human judgments. In Proceedings of the Second Workshop on Statistical Machine Translation, pages 228–231, Prague, Czech Republic. Association for Computational Linguistics.
- Lewis et al. (2020) Mike Lewis, Yinhan Liu, Naman Goyal, Marjan Ghazvininejad, Abdelrahman Mohamed, Omer Levy, Veselin Stoyanov, and Luke Zettlemoyer. 2020. BART: Denoising sequence-to-sequence pre-training for natural language generation, translation, and comprehension. In Proceedings of the 58th Annual Meeting of the Association for Computational Linguistics, pages 7871–7880, Online. Association for Computational Linguistics.
- Lin (2004) Chin-Yew Lin. 2004. ROUGE: A package for automatic evaluation of summaries. In Text Summarization Branches Out, pages 74–81, Barcelona, Spain. Association for Computational Linguistics.
- Louis and Nenkova (2013) Annie Louis and Ani Nenkova. 2013. Automatically assessing machine summary content without a gold standard. Computational Linguistics, 39(2):267–300.
- Mani (2001) Inderjeet Mani. 2001. Automatic summarization, volume 3. John Benjamins Publishing.
- Mathur et al. (2020) Nitika Mathur, Johnny Wei, Markus Freitag, Qingsong Ma, and Ondřej Bojar. 2020. Results of the WMT20 metrics shared task. In Proceedings of the Fifth Conference on Machine Translation, pages 688–725, Online. Association for Computational Linguistics.
- Maynez et al. (2020) Joshua Maynez, Shashi Narayan, Bernd Bohnet, and Ryan McDonald. 2020. On faithfulness and factuality in abstractive summarization. In Proceedings of the 58th Annual Meeting of the Association for Computational Linguistics, pages 1906–1919, Online. Association for Computational Linguistics.
- Ng and Abrecht (2015) Jun-Ping Ng and Viktoria Abrecht. 2015. Better summarization evaluation with word embeddings for ROUGE. In Proceedings of the 2015 Conference on Empirical Methods in Natural Language Processing, pages 1925–1930, Lisbon, Portugal. Association for Computational Linguistics.
- Nie et al. (2020) Yixin Nie, Adina Williams, Emily Dinan, Mohit Bansal, Jason Weston, and Douwe Kiela. 2020. Adversarial NLI: A new benchmark for natural language understanding. In Proceedings of the 58th Annual Meeting of the Association for Computational Linguistics, pages 4885–4901, Online. Association for Computational Linguistics.
- Papineni et al. (2002) Kishore Papineni, Salim Roukos, Todd Ward, and Wei-Jing Zhu. 2002. Bleu: a method for automatic evaluation of machine translation. In Proceedings of the 40th Annual Meeting of the Association for Computational Linguistics, pages 311–318, Philadelphia, Pennsylvania, USA. Association for Computational Linguistics.
- Popović (2015) Maja Popović. 2015. chrF: character n-gram F-score for automatic MT evaluation. In Proceedings of the Tenth Workshop on Statistical Machine Translation, pages 392–395, Lisbon, Portugal. Association for Computational Linguistics.
- Raffel et al. (2020) Colin Raffel, Noam Shazeer, Adam Roberts, Katherine Lee, Sharan Narang, Michael Matena, Yanqi Zhou, Wei Li, Peter J Liu, et al. 2020. Exploring the limits of transfer learning with a unified text-to-text transformer. J. Mach. Learn. Res., 21(140):1–67.
- Sellam et al. (2020) Thibault Sellam, Dipanjan Das, and Ankur Parikh. 2020. BLEURT: Learning robust metrics for text generation. In Proceedings of the 58th Annual Meeting of the Association for Computational Linguistics, pages 7881–7892, Online. Association for Computational Linguistics.
- Thompson and Post (2020) Brian Thompson and Matt Post. 2020. Automatic machine translation evaluation in many languages via zero-shot paraphrasing. In Proceedings of the 2020 Conference on Empirical Methods in Natural Language Processing (EMNLP), pages 90–121, Online. Association for Computational Linguistics.
- Vedantam et al. (2015) R. Vedantam, C. Zitnick, and D. Parikh. 2015. Cider: Consensus-based image description evaluation. In 2015 IEEE Conference on Computer Vision and Pattern Recognition (CVPR), pages 4566–4575, Los Alamitos, CA, USA. IEEE Computer Society.
- Wang et al. (2020) Alex Wang, Kyunghyun Cho, and Mike Lewis. 2020. Asking and answering questions to evaluate the factual consistency of summaries. In Proceedings of the 58th Annual Meeting of the Association for Computational Linguistics, pages 5008–5020, Online. Association for Computational Linguistics.
- Wolf et al. (2020) Thomas Wolf, Lysandre Debut, Victor Sanh, Julien Chaumond, Clement Delangue, Anthony Moi, Pierric Cistac, Tim Rault, Remi Louf, Morgan Funtowicz, Joe Davison, Sam Shleifer, Patrick von Platen, Clara Ma, Yacine Jernite, Julien Plu, Canwen Xu, Teven Le Scao, Sylvain Gugger, Mariama Drame, Quentin Lhoest, and Alexander Rush. 2020. Transformers: State-of-the-art natural language processing. In Proceedings of the 2020 Conference on Empirical Methods in Natural Language Processing: System Demonstrations, pages 38–45, Online. Association for Computational Linguistics.
- Yuan et al. (2021) Weizhe Yuan, Graham Neubig, and Pengfei Liu. 2021. BARTScore: Evaluating generated text as text generation. In Advances in Neural Information Processing Systems.
- Zhang* et al. (2020) Tianyi Zhang*, Varsha Kishore*, Felix Wu*, Kilian Q. Weinberger, and Yoav Artzi. 2020. Bertscore: Evaluating text generation with bert. In International Conference on Learning Representations.
- Zhao et al. (2019) Wei Zhao, Maxime Peyrard, Fei Liu, Yang Gao, Christian M. Meyer, and Steffen Eger. 2019. MoverScore: Text generation evaluating with contextualized embeddings and earth mover distance. In Proceedings of the 2019 Conference on Empirical Methods in Natural Language Processing and the 9th International Joint Conference on Natural Language Processing (EMNLP-IJCNLP), pages 563–578, Hong Kong, China. Association for Computational Linguistics.