On irregularities in the cosmic ray spectrum of eV range
S. P. Knurenko and I. S. Petrov
Yu. G. Shafer Institute of Cosmophysical Research and Aeronomy, Yakutsk, Russia
* igor.petrov@mail.ysn.ru
![[Uncaptioned image]](/html/2208.00597/assets/TIFR.png) 21st International Symposium on Very High Energy Cosmic Ray Interactions (ISVHE- CRI 2022)
21st International Symposium on Very High Energy Cosmic Ray Interactions (ISVHE- CRI 2022)
Online, 23-27 May 2022
10.21468/SciPostPhysProc.?
Abstract
Existing small, medium and large arrays for the study of cosmic rays of ultra-high energies are aimed for obtaining information about our galaxy and extragalactic space, namely to search and study astronomical objects that produce the flux of relativistic particles. The drift and interaction of such particles with magnetic fields and shock waves taking place in interstellar space causes the same interest. The shape of the energy spectrum of cosmic rays in the energy range eV, where the "knee" and the "second knee" are observed, can be formed as a superposition of the partial spectra of various chemical elements. Verification of galactic models, using recent experimental spectral data, makes it possible to study the nature of the galactic and extragalactic components of cosmic rays. The paper presents the result of the energy spectrum of cosmic rays in the range eV of measurements obtained with the Small Cherenkov array — a part of the Yakutsk array.
1 Introduction
The study of ultra-high energy cosmic rays has the following goals: determination of anisotropy, energy spectrum and mass composition. These are important to advance our understanding of the origin, acceleration and propagation of cosmic rays of different energies. There are different methods for different energy ranges: for energies eV — direct measurements on satellites [1, 2, 3] and on balloons [4, 5] for energies greater than eV — indirect measurements by extensive air showers method, i.e. by tracking the cascade processes in the atmosphere and detecting charged particles fluxes. Since the spectrum of cosmic rays is very wide, there are experiments with different sizes: compact ones with an area of s < 1 km2 — air showers up to energies of eV, average sized arrays with s < 20 km2 — air showers up to energies of eV and huge arrays such as Auger [6], Telescope Array [7] for even greater energies.
2 The Small Cherenkov Array
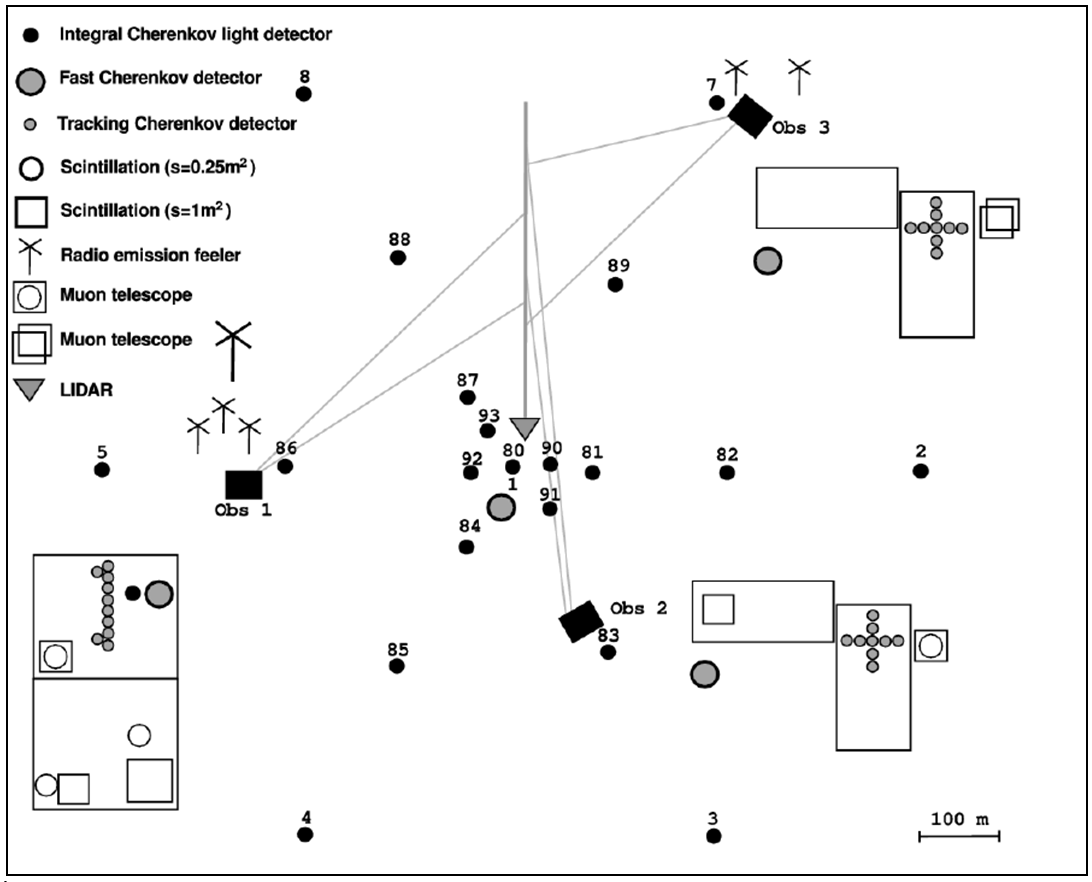
The Small Cherenkov array is a part of the Yakutsk array with an area of 1 km2 and is aimed to register air showers with energies eV (Fig. 1). The distinctive feature of the Small Cherenkov is that it measures several components of air showers like muons, electrons and Cherenkov radiation, unlike other compact arrays like KASCADE [8] or TUNKA [9]. Such hybrid measurements provide a broader outlook at the development of the shower, including longitudinal development, registering the spatial distribution of electrons, muons and Cherenkov light at sea level [10, 11]. The longitudinal profile is measured via the flux of Cherenkov photons by the Cherenkov tracking detectors [11, 12].
3 Air Shower Measurement Simulation at the Small Cherenkov Array
The measurement precision was determined by full Monte Carlo simulation. The precision of air shower characteristics is shown in Table 1.
| ) | ||||||||
|---|---|---|---|---|---|---|---|---|
| 2 | 9.7 | 0.15 | 0.17 | - | - | - | - | 1.3 |
| 10 | 7.2 | 0.11 | 0.15 | - | - | - | - | 1.0 |
| 100 | 15.5 | 0.27 | 0.15 | 0.25 | - | - | - | 1.7 |
| 200 | 14.6 | 0.32 | 0.20 | 0.20 | 0.22 | 0.25 | 1.4 | |
| 1000 | 16.7 | 0.35 | - | - | 0.20 | 0.17 | 0.19 | 1.3 |
Measurements are also affected by light loss of aerosol particles in the atmosphere. In addition, the transparency of the atmosphere depends on climate, e.g. the non standard atmosphere formed above the Yakutsk array in winter. As shown in the papers [12, 14], near-ground mists and haze during winter can cause significant attenuation of the Cherenkov light flux up to 30-40 % at distances of 100-400 m from the shower axis, while under excellent weather conditions losses do not exceed 10%. At the Yakutsk array, the atmosphere is observed regularly [14] and these atmospheric measurements are taken into account when determining characteristics of air showers, in particular, energy and depth of maximum development [15].
In addition, the simulation algorithm included the simulation of the trigger conditions, taking into account the detector’s threshold, and fluctuations of the threshold in the conditions of background noise while measuring the flux of Cherenkov light. The Yakutsk array uses two triggers aimed for different energy ranges: eV — Small Cherenkov array trigger; eV — main trigger from ground scintillation detectors. Fig. 2 shows the implementation scheme of the Small Cherenkov array trigger triangles for air showers with energies of eV
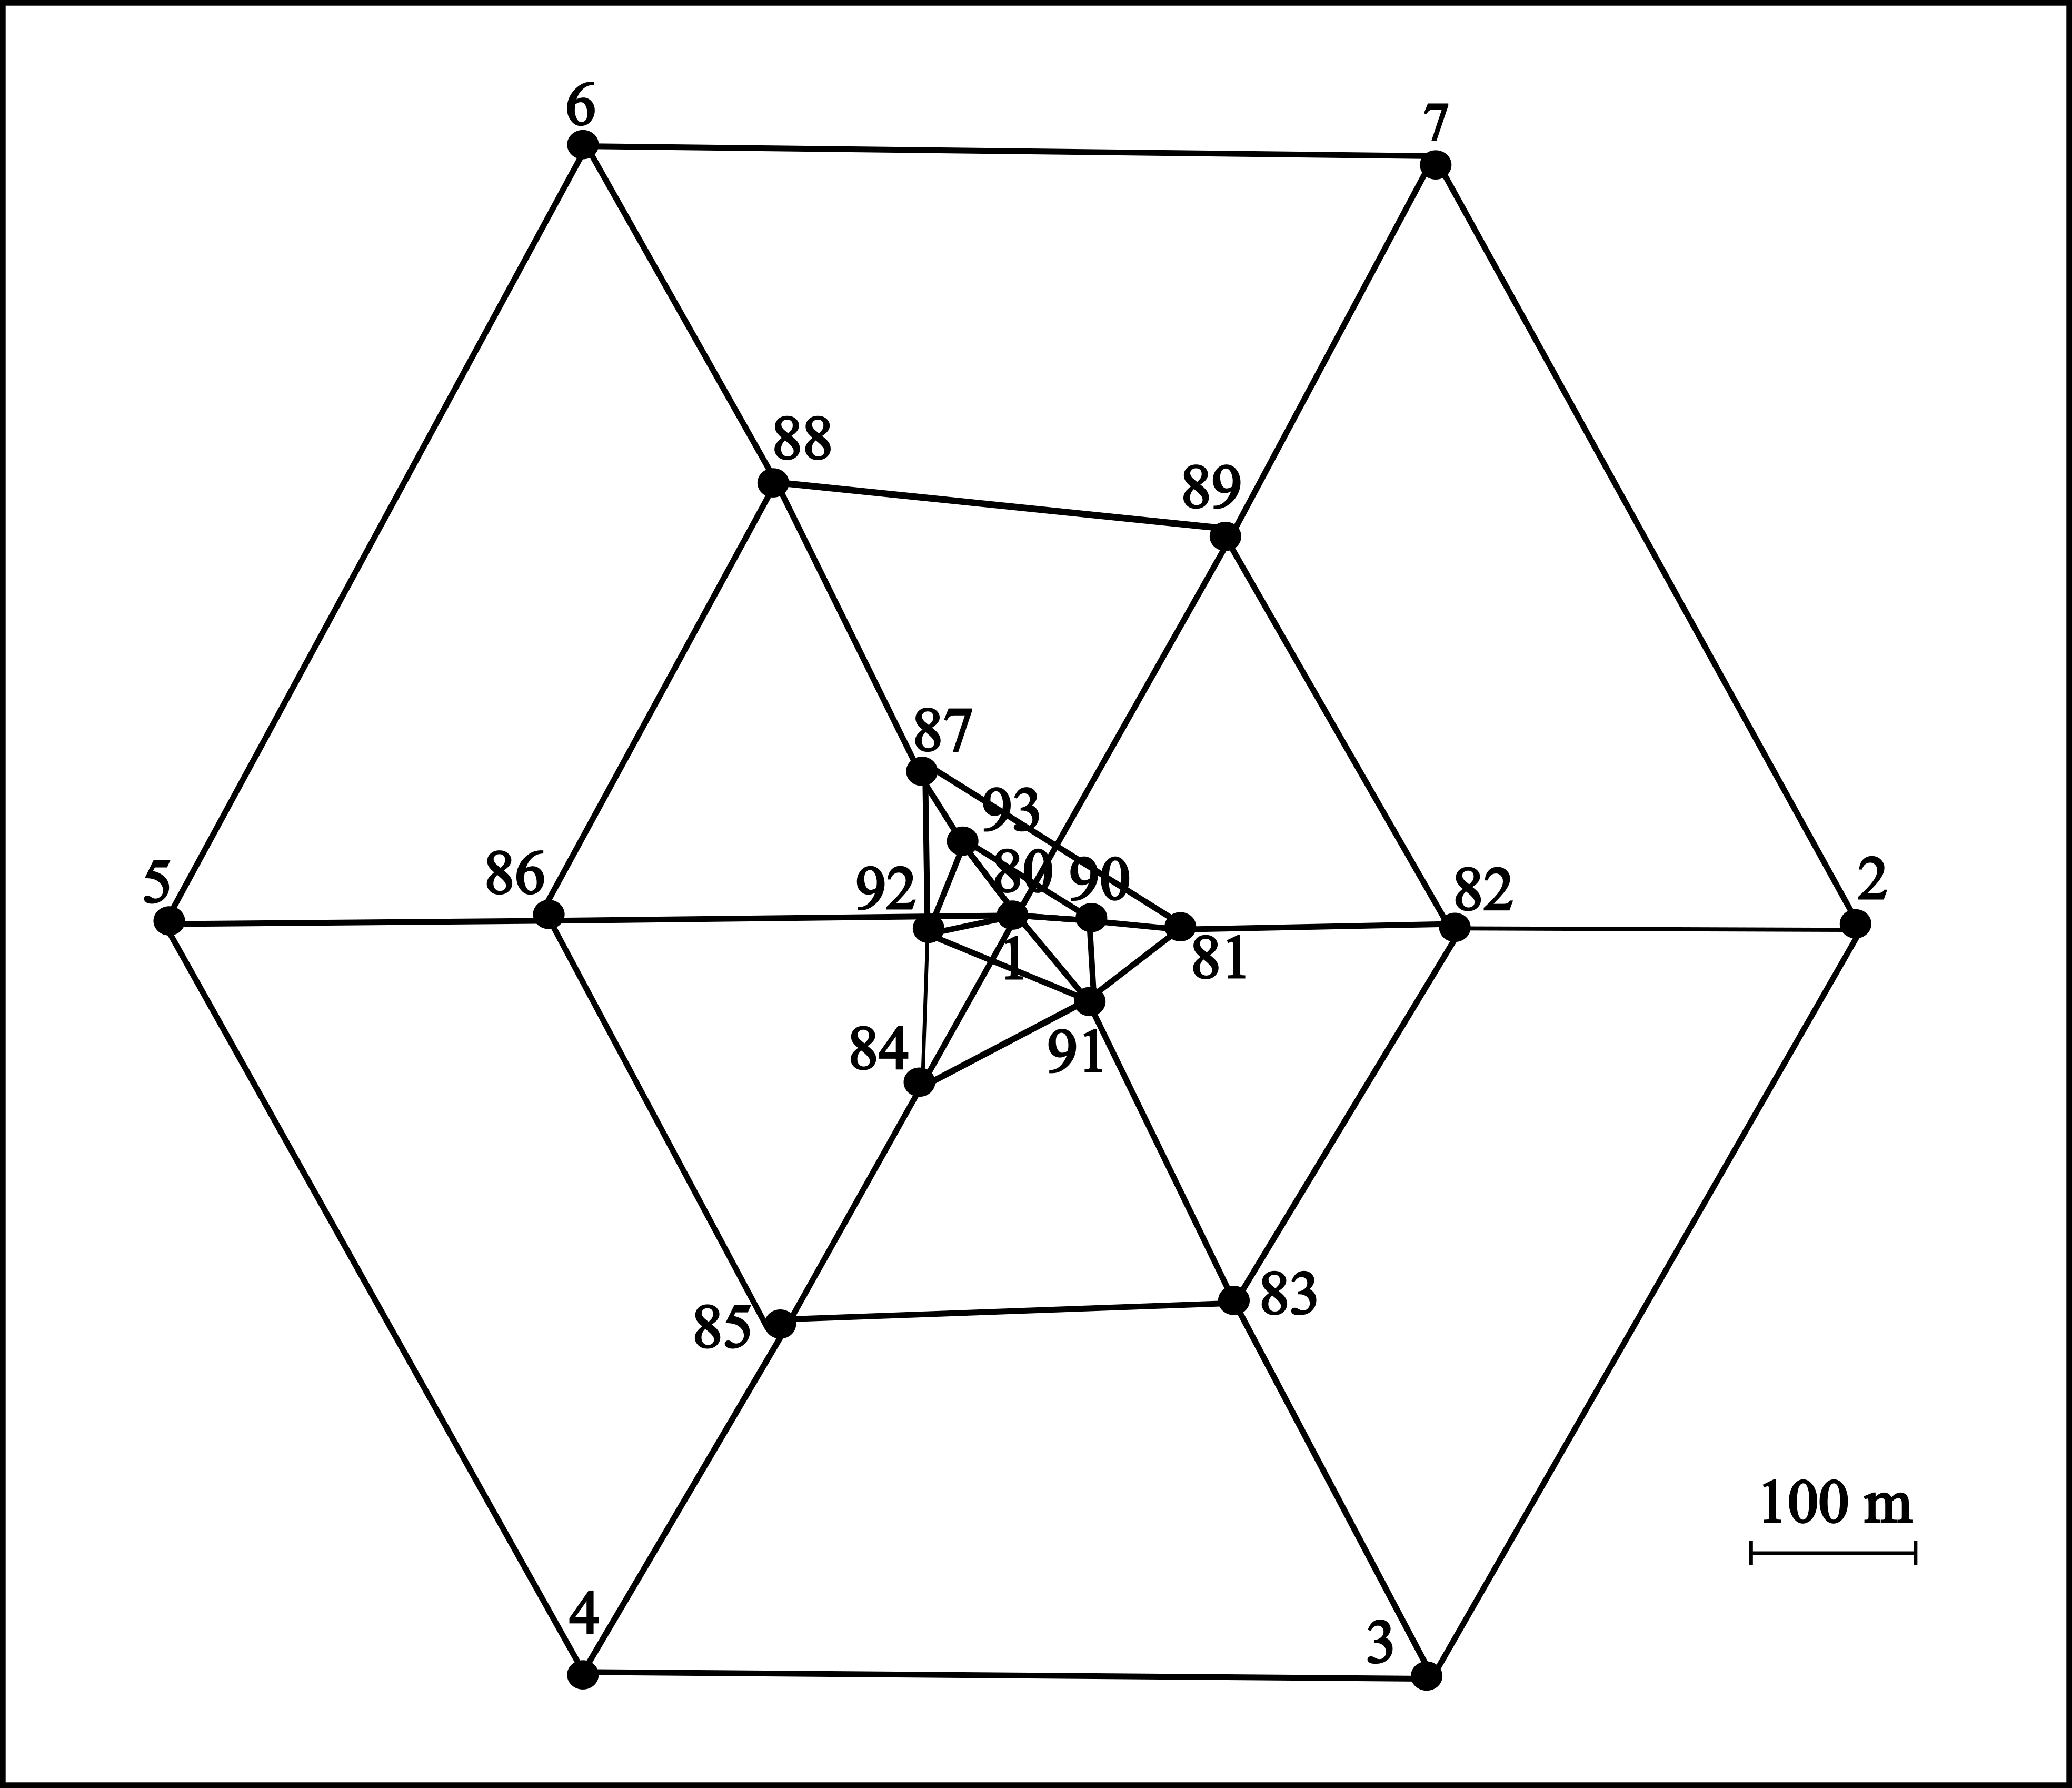
Since different triggers select air shower events with different energies, there should be a transition effect — at the energy boundary, the effective collection area of showers will vary. For large showers, it is underestimated, and for small showers, on the contrary, it is overestimated. With a correction of the effective area for events with high-energy showers, this effect is estimated as 15%.
4 Air Shower Energy Estimation
The accuracy of the estimated number of charged particles at sea level is 10-25%, and for the total flux of Cherenkov light it is 10-15% for air showers with energies < 5 eV. The accuracy is good enough to get the necessary information to obtain the parameters of air showers. The calorimetric method is used for the energy estimation which takes all measured air shower components into account: electrons, muons, and the total Cherenkov light flux. Data were recorded at the Small Cherenkov array for the period 1994 to 2014.
At the Yakutsk array, the primary energy of the particle that produced the air shower is determined with the energy balance method:
| (1) |
The parameters of formula (1) were determined empirically, for energies in the range eV. More information about the method can be found in [12].
The energy estimation with the parameters Q (100), Q (200) and Q (400) has lower uncertainty since the dependence on the zenith angle is weak. We used the following formulas to determine these parameters:
| (2) |
| (3) |
| (4) |
where Q (100), Q (200), Q (400) — Cherenkov light flux density at the distances 100, 200 and 400 m respectively.
We can estimate the energy scattered in the atmosphere above the observation level by electrons with the following equation:
| (5) |
where is the total flux of Cherenkov light; — proportionality coefficient, depends on the transparency of the atmosphere , and the longitudinal development of the shower (energy spectrum of secondary particles and its dependence on the age of the shower), which is expressed through , measured at the array.
The energy carried to the observation level by electrons is
| (6) |
where is the total number of charged particles at sea level, and is the absorption range of the shower particles [12].
Fig. 3 shows the dependence of on energy and comparison of the experimental data with QGSJetII-03 [16] simulations taken from [17]. The parameter — is the energy transferred to the electromagnetic component of the air shower and is equal to , and — total air shower energy.
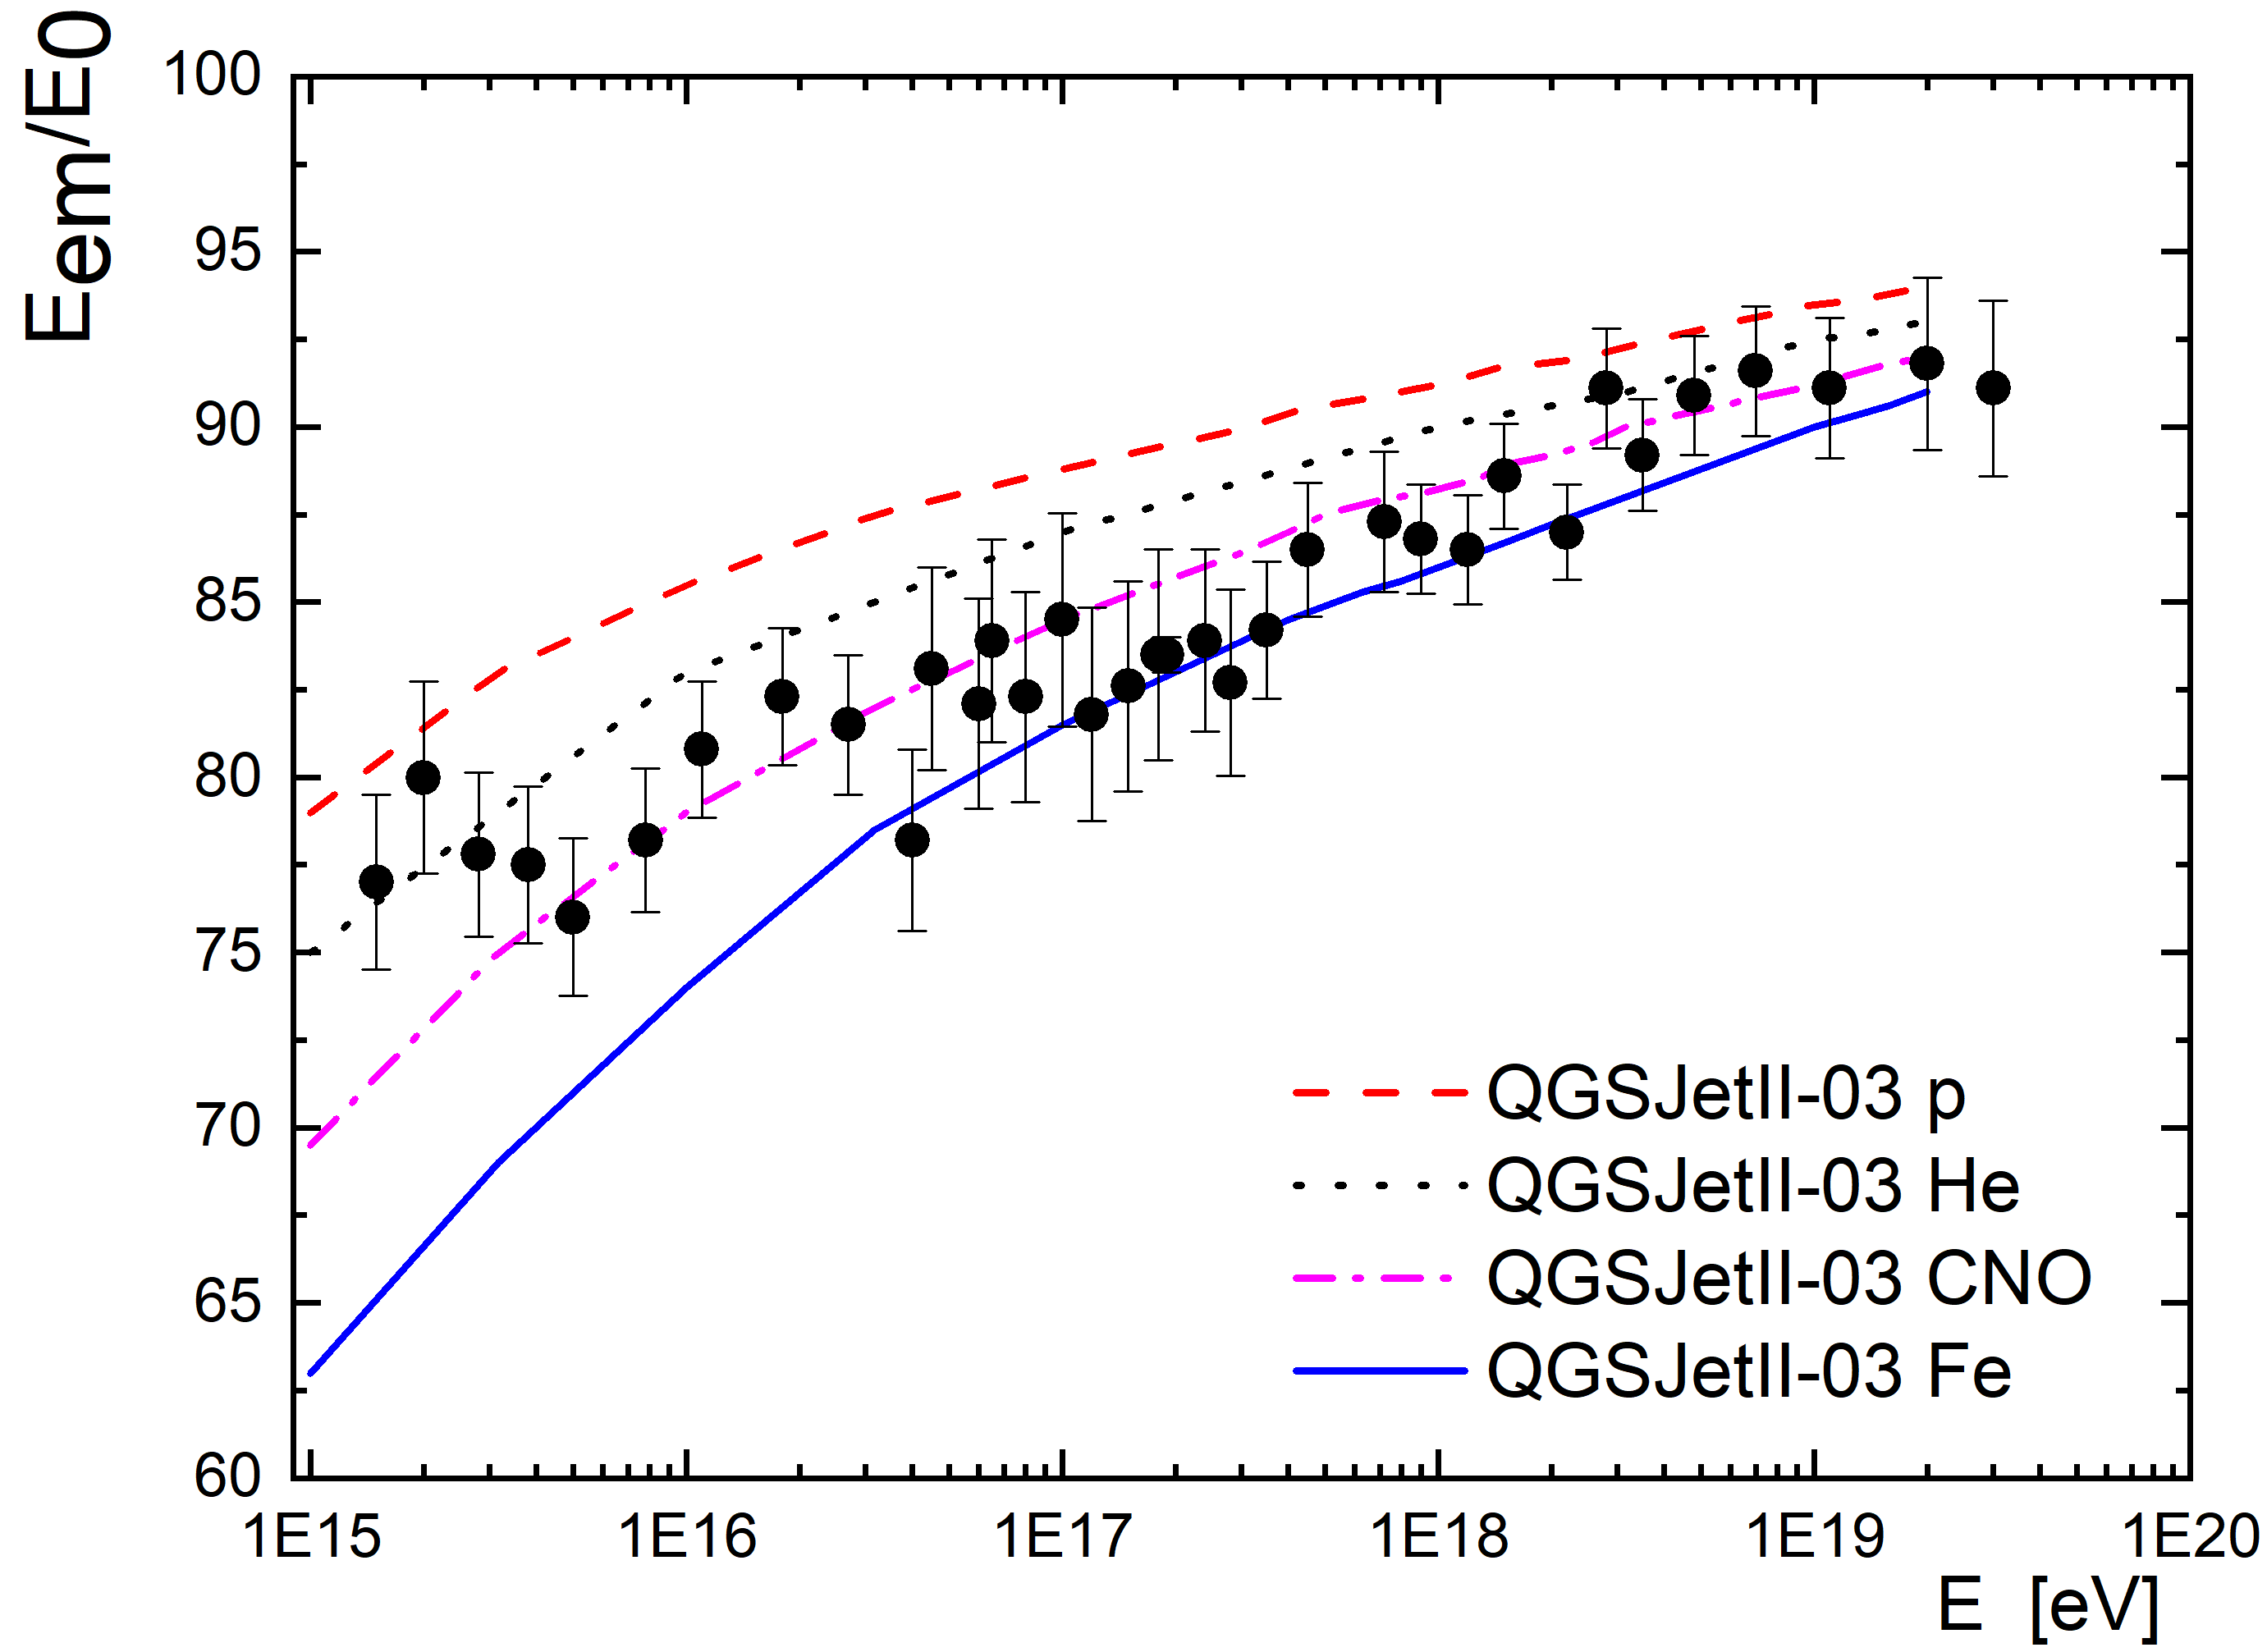
As can be seen from Fig. 3 on average, the experimental data are consistent with calculations based on the QGSjet-03 model of hadron interactions and a mixed composition of primary particles.
5 Energy spectrum of air showers
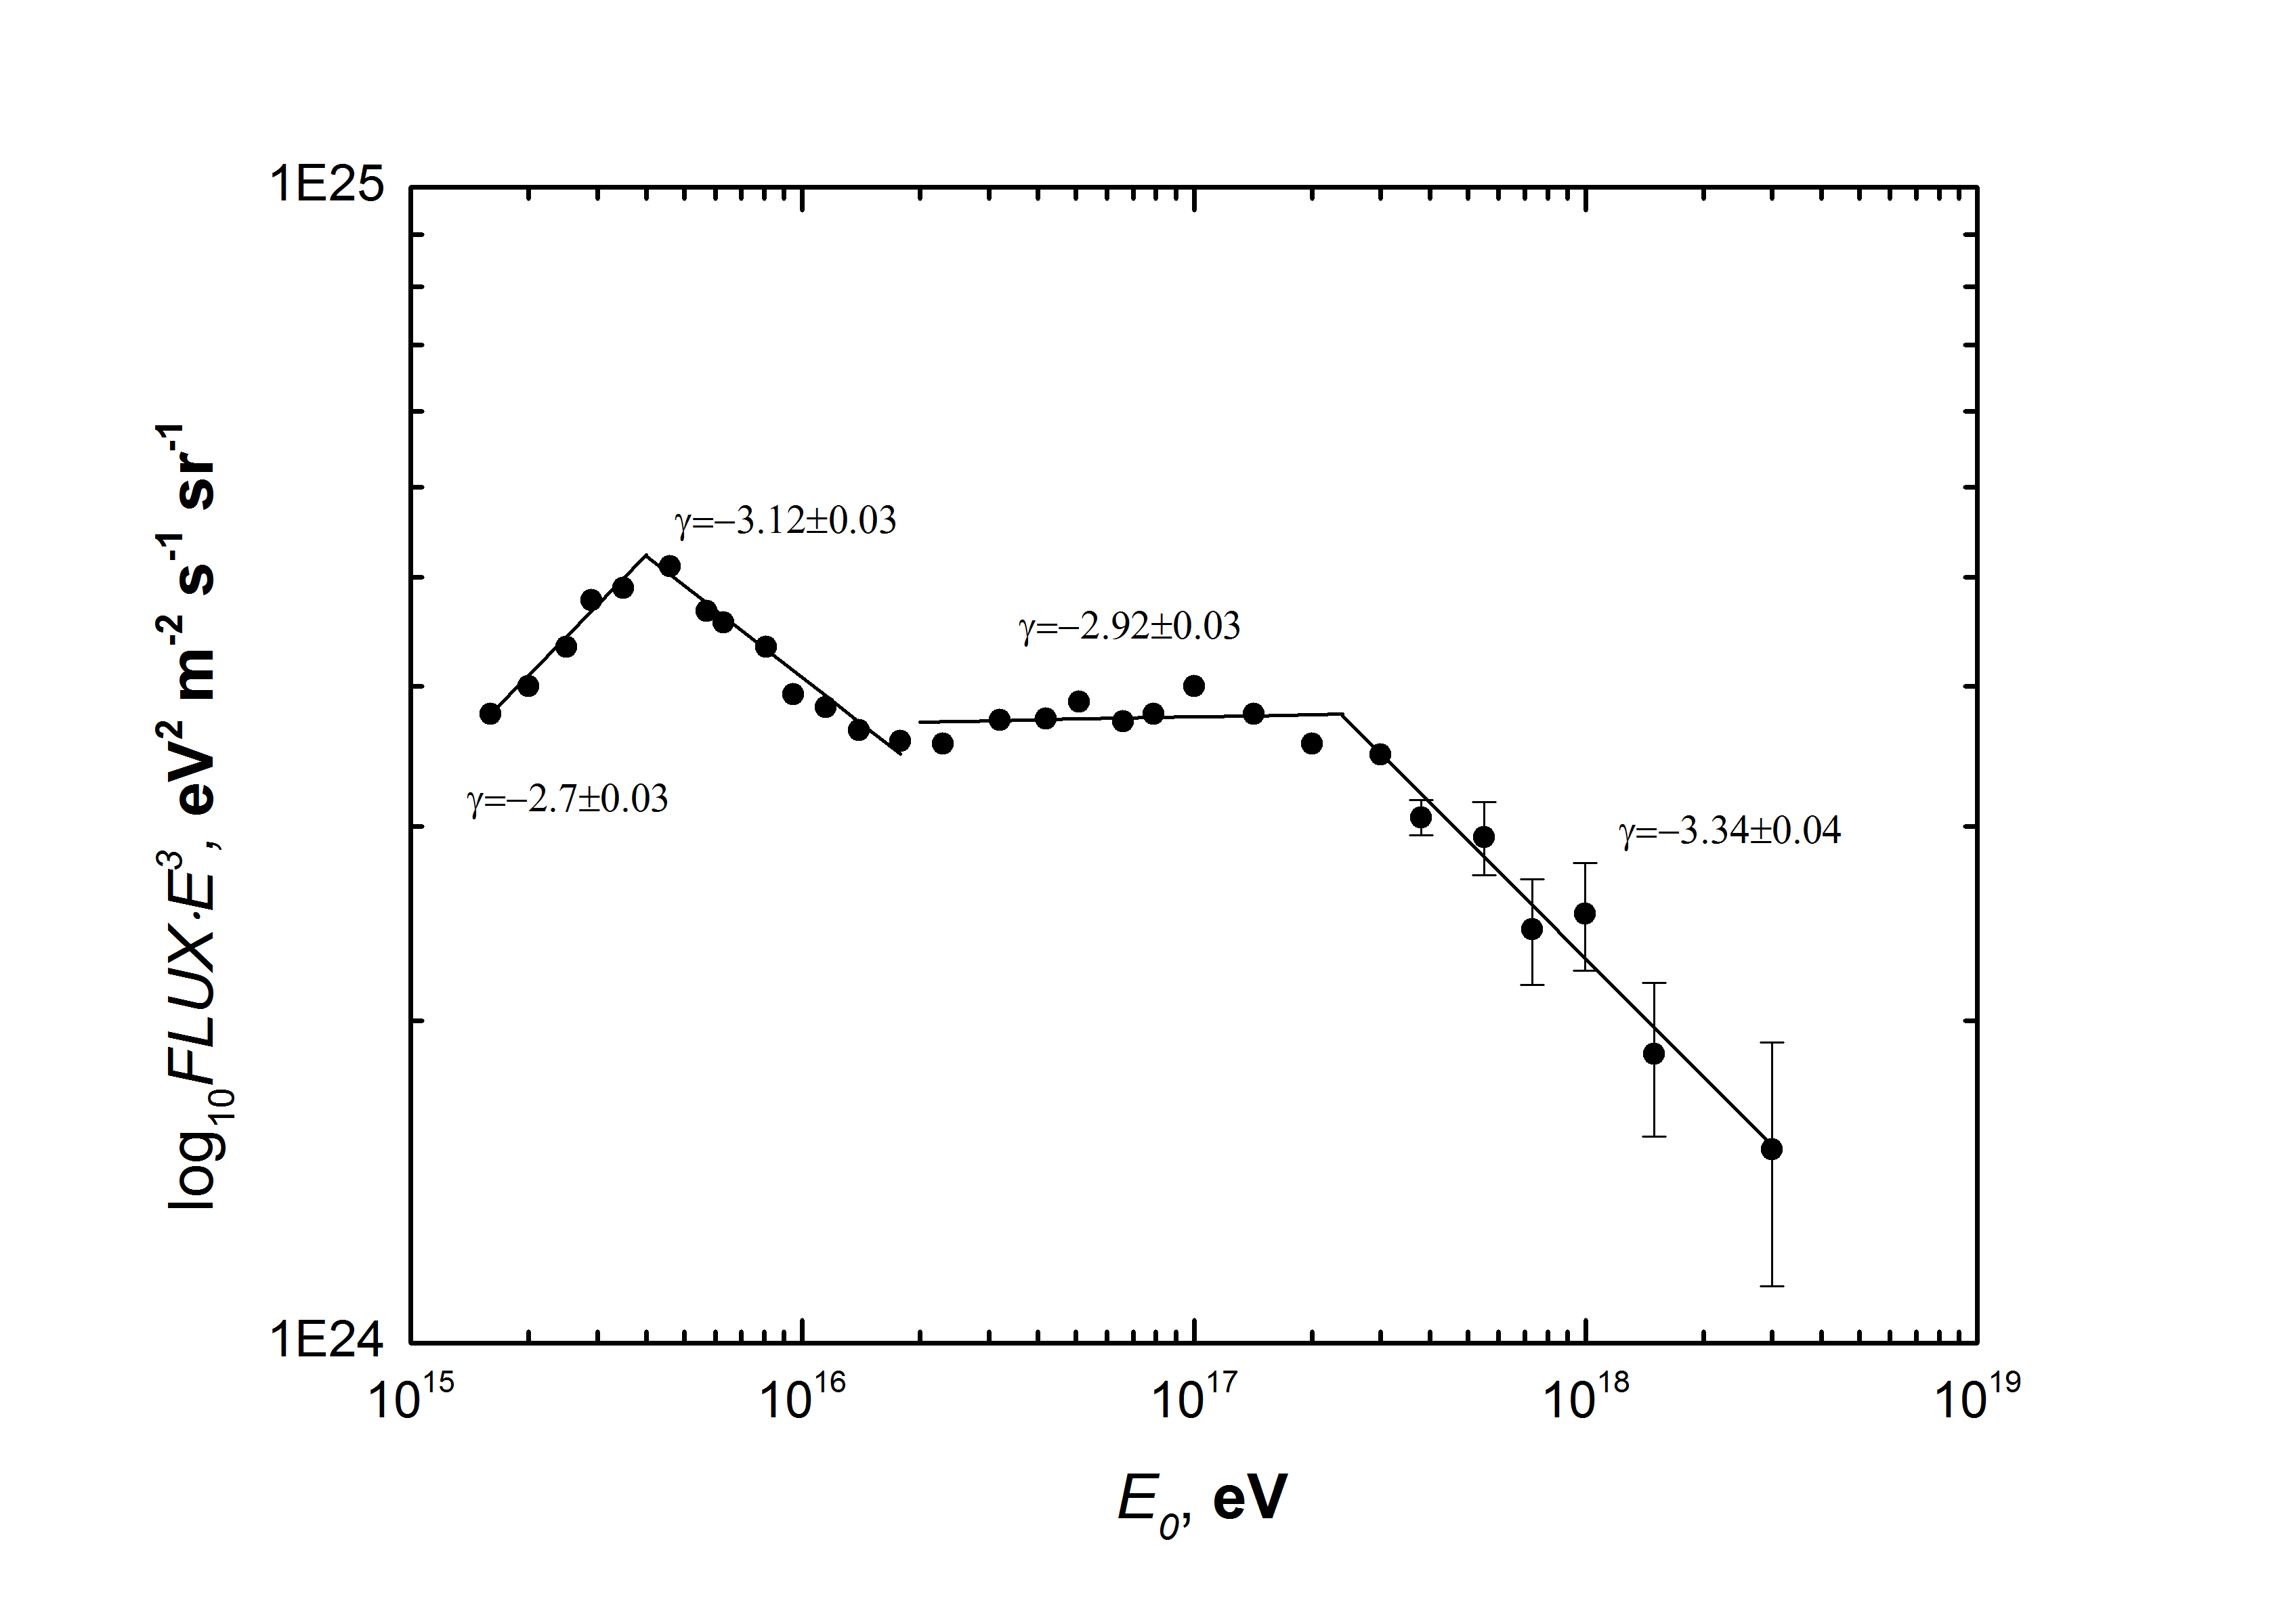
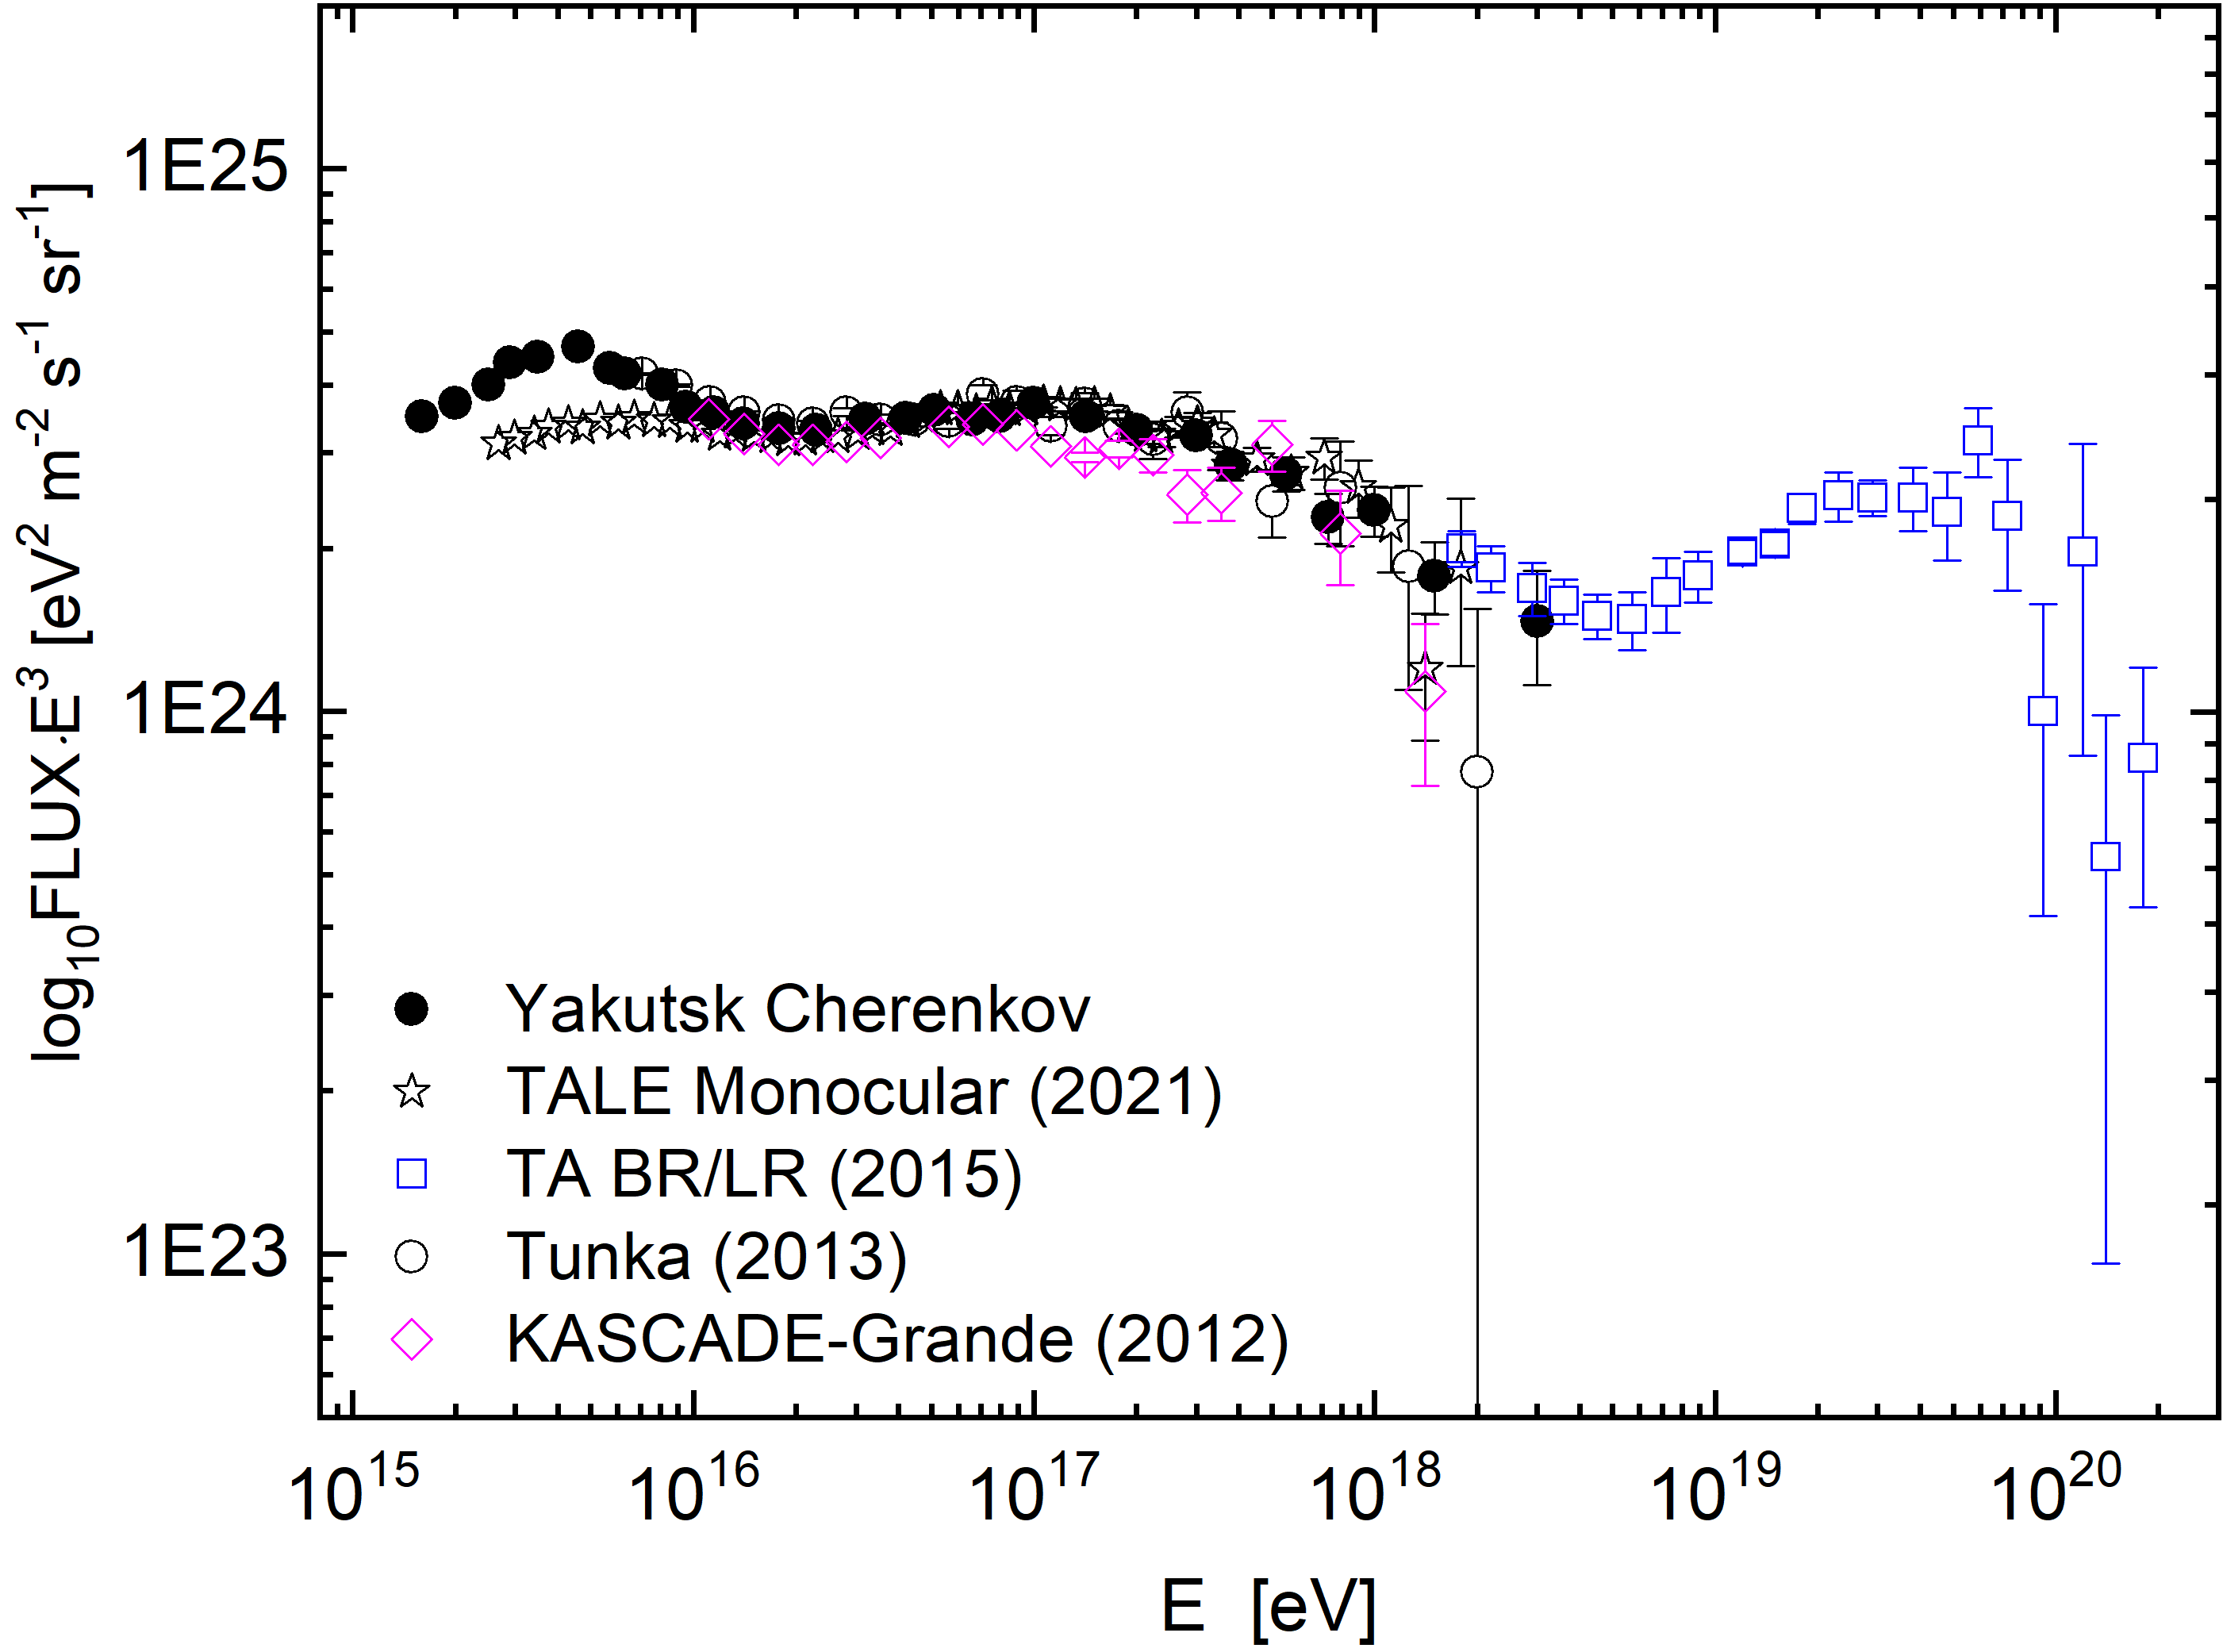
Using data of the Small Cherenkov array from 1994 to 2014, we estimated the intensity of air showers in a given intervals of energy and the zenith angle per unit of the effective area of the array. Fig. 4a shows the resulting spectrum for eV.
a)
b)
As can be seen from Fig. 4a, the obtained spectrum has two features at the energy eV (first knee) and at the energy eV (second knee). The first knee is characterized by the slope and and the second knee and .
Fig. 4b shows a comparison with other experiments: TALE [18], TA BR / LR [19], KASCADE-Grande [8] and Tunka [9]. There is a good agreement of the spectra in the energy range eV. All experiments have a break in the spectrum at eV. The discrepancies in the spectrum is partly due to the different methods of energy estimation at various air shower experiments and to some extent by the different effective thresholds of the experiments themselves. Table 2 shows the comparison of spectrum slopes between different experiments.
| Energy | Yakutsk | Tunka | KASCADE-Grande | TALE |
|---|---|---|---|---|
| , eV | ||||
| - | - | - | ||
| - | ||||
6 Conclusion
Using a large dataset of Cherenkov light measurements registered for the period 1994-2014 years, air shower energy is estimated by the energy balance method and the spectrum of cosmic rays in the energy range eV is obtained. At the energy of eV spectrum slope changes from -2.92 to -3.34, which is associated with astrophysical processes in our galaxy, as well as with extragalactic processes. The “second knee” phenomenon can be explained as a transition from galactic to extragalactic cosmic rays.
Funding information
This work was carried out in the framework of research project No. AAAA-A21-121011990011-8 by the Ministry of Science and Higher Education of the Russian Federation.
References
- [1] O. Adriani, G. C. Barbarino, G. A. Balizevskaya and et al., PAMELA Measurements of Cosmic-Ray Proton and Helium Spectra, Science 332, 69 (2011), 10.1126/science.1199172.
- [2] M. Aguilar, D. Aisa, B. Alpat and et al., Precision Measurement of the Proton Flux in Primary Cosmic Rays from Rigidity 1 GV to 1.8 TV with the Alpha Magnetic Spectrometer on the International Space Station, Phys. Rev. Lett. 114, 171103 (2015), 10.1103/PhysRevLett.114.171103.
- [3] D. Green and E. A. Hays, Measurement of the Cosmic-ray Proton Spectrum with the Fermi Large Area Telescope, Proc. of Sci. 301, 159 (2018), 10.22323/1.301.0159.
- [4] A. Panov, J. A. Jr., H. Ahn and et al., Energy spectra of abundant nuclei of primary cosmic rays from the data of ATIC-2 experiment: Final results, Bull. of the RAoS: Physics 73, 564 (2009), 10.3103/S1062873809050098.
- [5] E. Seo, H. Ahn, P. Allison and et al., CREAM: 70 days of flight from 2 launches in Antarctica, Adv. Space Res. 42, 1656 (2008), 10.1016/j.asr.2007.03.056.
- [6] A. Aab, P. Abreu, M. Aglietta and et al., The Pierre Auger Cosmic Ray Observatory, NIM A 798, 172 (2015), 10.1016/j.nima.2015.06.058.
- [7] T. Abu-Zayyad, R. Aida, M. Allen and et al, The surface detector array of the Telescope Array experiment, NIM A 689, 87 (2012), 10.1016/j.nima.2012.05.079.
- [8] W. Apel, J. Arteaga-Velazquez, K. Bekk and et al., The spectrum of high-energy cosmic rays measured with KASCADE-Grande, Astropart. Phys. 36, 183 (2012), 10.1016/j.astropartphys.2012.05.023.
- [9] V. Prosin, S. Berezhnev, N. Budnev and et al., Tunka-133: Results of 3 year operation, NIM A 756, 94 (2014), 10.1016/j.nima.2013.09.018.
- [10] S. Knurenko, V. Kolosov and Z. Petrov, Cerenkov radiation of cosmic ray extensive air showers. Part 3. Longitudinal development of showers in the energy region of eV, 27 ICRC (Hamburg) 1, 157 (2001).
- [11] S. Knurenko, V. Kolosov, Z. Petrov and et al., Sci. and Edu. 4, 46 (1998).
- [12] S. Knurenko, A. Ivanov, I. Sleptsov and A. Sabourov, Estimation of the energy of the electron-photon component of cosmic rays on the basis of data for Cherenkov light from ultrahigh-energy extensive air showers, JETP Lett. 83, 473 (2006), 10.1134/S0021364006110014.
- [13] S. Knurenko, Z. Petrov and I. Petrov, Second knee on the spectrum of cosmic ray at energies ev by long-termn observations of small cherenkov eas array, Physics of Atomic Nuclei 82, 732 (2019), 10.1134/S106377881966027X.
- [14] S. Knurenko and I. S. Petrov, Atmospheric circulation influence during winter on change of air pressure, temperature and spectral transparency at Yakutsk Array, Proc. SPIE 9292, 92925B (2014), 10.1117/12.2074877.
- [15] S. Knurenko and I. S. Petrov, Comparison of the relative transparency of the atmosphere measured by attenuation of Cherenkov light, Proc. SPIE 10466, 1046659 (2017), 10.1117/12.2286013.
- [16] S. Ostapchenko, QGSJET-II: towards reliable description of very high energy hadronic interactions, Nucl. Phys. B, Proc. Suppl. 151(1), 143 (2006), 10.1016/j.nuclphysbps.2005.07.026.
- [17] R. U. Abbasi, M. Abe, T. Abu-Zayyad and et al., The Cosmic Ray Energy Spectrum between 2 PeV and 2 EeV Observed with the TALE Detector in Monocular Mode, ApJ 865, 74 (2018), 10.3847/1538-4357/aada05.
- [18] T. Abu-Zayyad, R. Abbasi, M. Allen and et al, Cosmic ray energy spectrum measured by the tale fluorescence detector, PoS 395, 347 (2022), 10.22323/1.395.0347.
- [19] R. Abbasi, M. Abe, T. Abu-Zayyad and et al, The energy spectrum of cosmic rays above eV measured by the fluorescence detectors of the Telescope Array experiment in seven years, Astropart. Phys. 80, 131 (2016), 10.1016/j.astropartphys.2016.04.002.