Early results from GLASS-JWST. VII: evidence for lensed, gravitationally bound proto-globular clusters at z=4 in the Hubble Frontier Field A2744111Based on observations collected with JWST under the ERS program 1324 (PI T. Treu)
Abstract
We investigate the blue and optical rest-frame sizes (Å) of three compact star-forming regions in a galaxy at z=4 strongly lensed () by the Hubble Frontier Field galaxy cluster A2744 using GLASS-ERS JWST/NIRISS imaging at , and with PSF . In particular, the Balmer break is probed in detail for all multiply-imaged sources of the system. With ages of a few tens of Myr, stellar masses in the range M⊙ and optical/ultraviolet effective radii spanning the interval pc, such objects are currently the highest redshift (spectroscopically-confirmed) gravitationally-bound young massive star clusters (YMCs), with stellar mass surface densities resembling those of local globular clusters. Optical (4000Å, JWST-based) and ultraviolet (1600Å, HST-based) sizes are fully compatible. The contribution to the ultraviolet underlying continuum emission (Å) is %, which decreases by a factor of two in the optical for two of the YMCs (Å rest-frame), reflecting the young ages ( Myr) inferred from the SED fitting and supported by the presence of high-ionization lines secured with VLT/MUSE. Such bursty forming regions enhance the sSFR of the galaxy, which is Gyr-1. This galaxy would be among the extreme analogs observed in the local Universe having high star formation rate surface density and high occurrence of massive stellar clusters in formation.
1 Introduction
The hierarchical nature of star formation emerges whenever the available spatial resolution increases. This is evident from studies of local Universe starburst galaxies (e.g., Adamo et al., 2020a; Mehta et al., 2021; Calzetti et al., 2015a) and at cosmological distance, , where clumps of sub-kpc size typically populate star-forming galaxies (Elmegreen et al., 2009; Genzel et al., 2011; Livermore et al., 2015; Iani et al., 2021; Zanella et al., 2015, 2019; Guo et al., 2018; Sok et al., 2022). Such clumps, when observed through gravitational lensing amplification, break down into smaller star-forming complexes, each of a pc scale (e.g. Rigby et al., 2017; Johnson et al., 2017; Cava et al., 2018; Dessauges-Zavadsky et al., 2019; Vanzella et al., 2021; Meštrić et al., 2022). When magnification is large enough to resolve them, clumps break down into single stellar clusters, with sizes smaller than a few tens of parsecs, as exemplified by the exceptional Sunburst galaxy at z=2.37 (e.g. Vanzella et al., 2020, 2022) or the candidate globular cluster precursors identified at (e.g., by Vanzella et al., 2017a, 2019; Welch et al., 2022).
For reasons summarized below, the ultimate goal in the study of the star-forming modes is the identification of single star clusters at all epochs (or at least the most massive gravitationally-bound ones, with stellar mass M⊙). Meeting this goal requires accessing angular scales smaller than milli-arcsec, roughly corresponding to physical scales smaller than 25 pc at =2(6). Young massive star clusters (YMCs) are key sources of mechanical and radiative feedback and efficient producers of ionizing radiation (e.g., Heckman et al., 2011; Bik et al., 2018) and eventually key actors in shaping and modulating the star formation activity of the host galaxy (Sirressi et al., 2022; James et al., 2016; Calzetti et al., 2015b). Star clusters might also play a role in regulating the leakage of ionizing radiation by carving ionized channels in the interstellar medium (ISM, Rivera-Thorsen et al., 2019; Vanzella et al., 2020, 2022, and references therein), making them additional contributors to cosmic reionization (e.g., He et al., 2020).
Currently, the only way to access such tiny physical scales at high redshift is to exploit gravitational lensing at large magnification (). However, given the small cosmic volume probed so far in the high magnification regime (which scales as A() ), only a few cases are currently known (e.g., Rigby et al., 2017; Welch et al., 2022; Vanzella et al., 2022, and references therein). A common limitation in such studies is the difficulty to access optical rest-frame wavelengths at high angular resolution, i.e. FWHM. Up to now, and in absence of assistance from strong lensing magnification, this resolution can only be achieved with the Hubble Space Telescope (HST) in the blue bands, probing rest-frame UV only.
In this work, we report on multi band James Webb Space Telescope (JWST)/NIRISS imaging and spectroscopy (Doyon et al., 2012) of an exceptionally magnified system, at =4. The observations in the F115W, F150W and F200W filters provide, for the first time, detailed constraints in the optical rest-frame of the three massive star clusters identified in the galaxy.
We assume a flat cosmology with = 0.3, = 0.7 and km s-1 Mpc-1. All magnitudes are given in the AB system (Oke & Gunn, 1983).
2 JWST/NIRISS imaging and spectroscopy of HFF A2744
JWST/NIRISS observations centered on the Hubble Frontier Field A2744 (HFFs, Lotz et al., 2017) were acquired on June 28-29 2022. The cluster was observed with the wide field slitless spectroscopy (WFSS) mode, that provides an average spectral resolution of R=150. The spectra and associated direct imaging were obtained using the F115W, F150W and F200W blocking filters, providing a full spectral coverage between 1.0 and 2.2m. The observations have an exquisite PSF of from blue to red (as measured from four non-saturated stars in the field). Imaging integration time was 2830s while 10400s were split evenly between the two orthogonal GR150R and GR150C grisms. Details on the data acquisition, observing strategy and data reduction are described by Treu et al. (2022) and Roberts-Borsani et al. (2022). NIRISS pre-imaging has been projected on a final pixel scale of , to mitigate the effects of the sharp PSF at the observed wavelengths and to match the pixel scale of existing HST images. In addition to the new JWST/NIRISS data, we also make use of archival VLT/MUSE data (Mahler et al., 2018; Richard et al., 2021; Bergamini et al., 2022) and Hubble Frontier Field imaging (Lotz et al., 2017).
3 A super-magnified source at z=4
3.1 The ultraviolet view: HST and VLT/MUSE
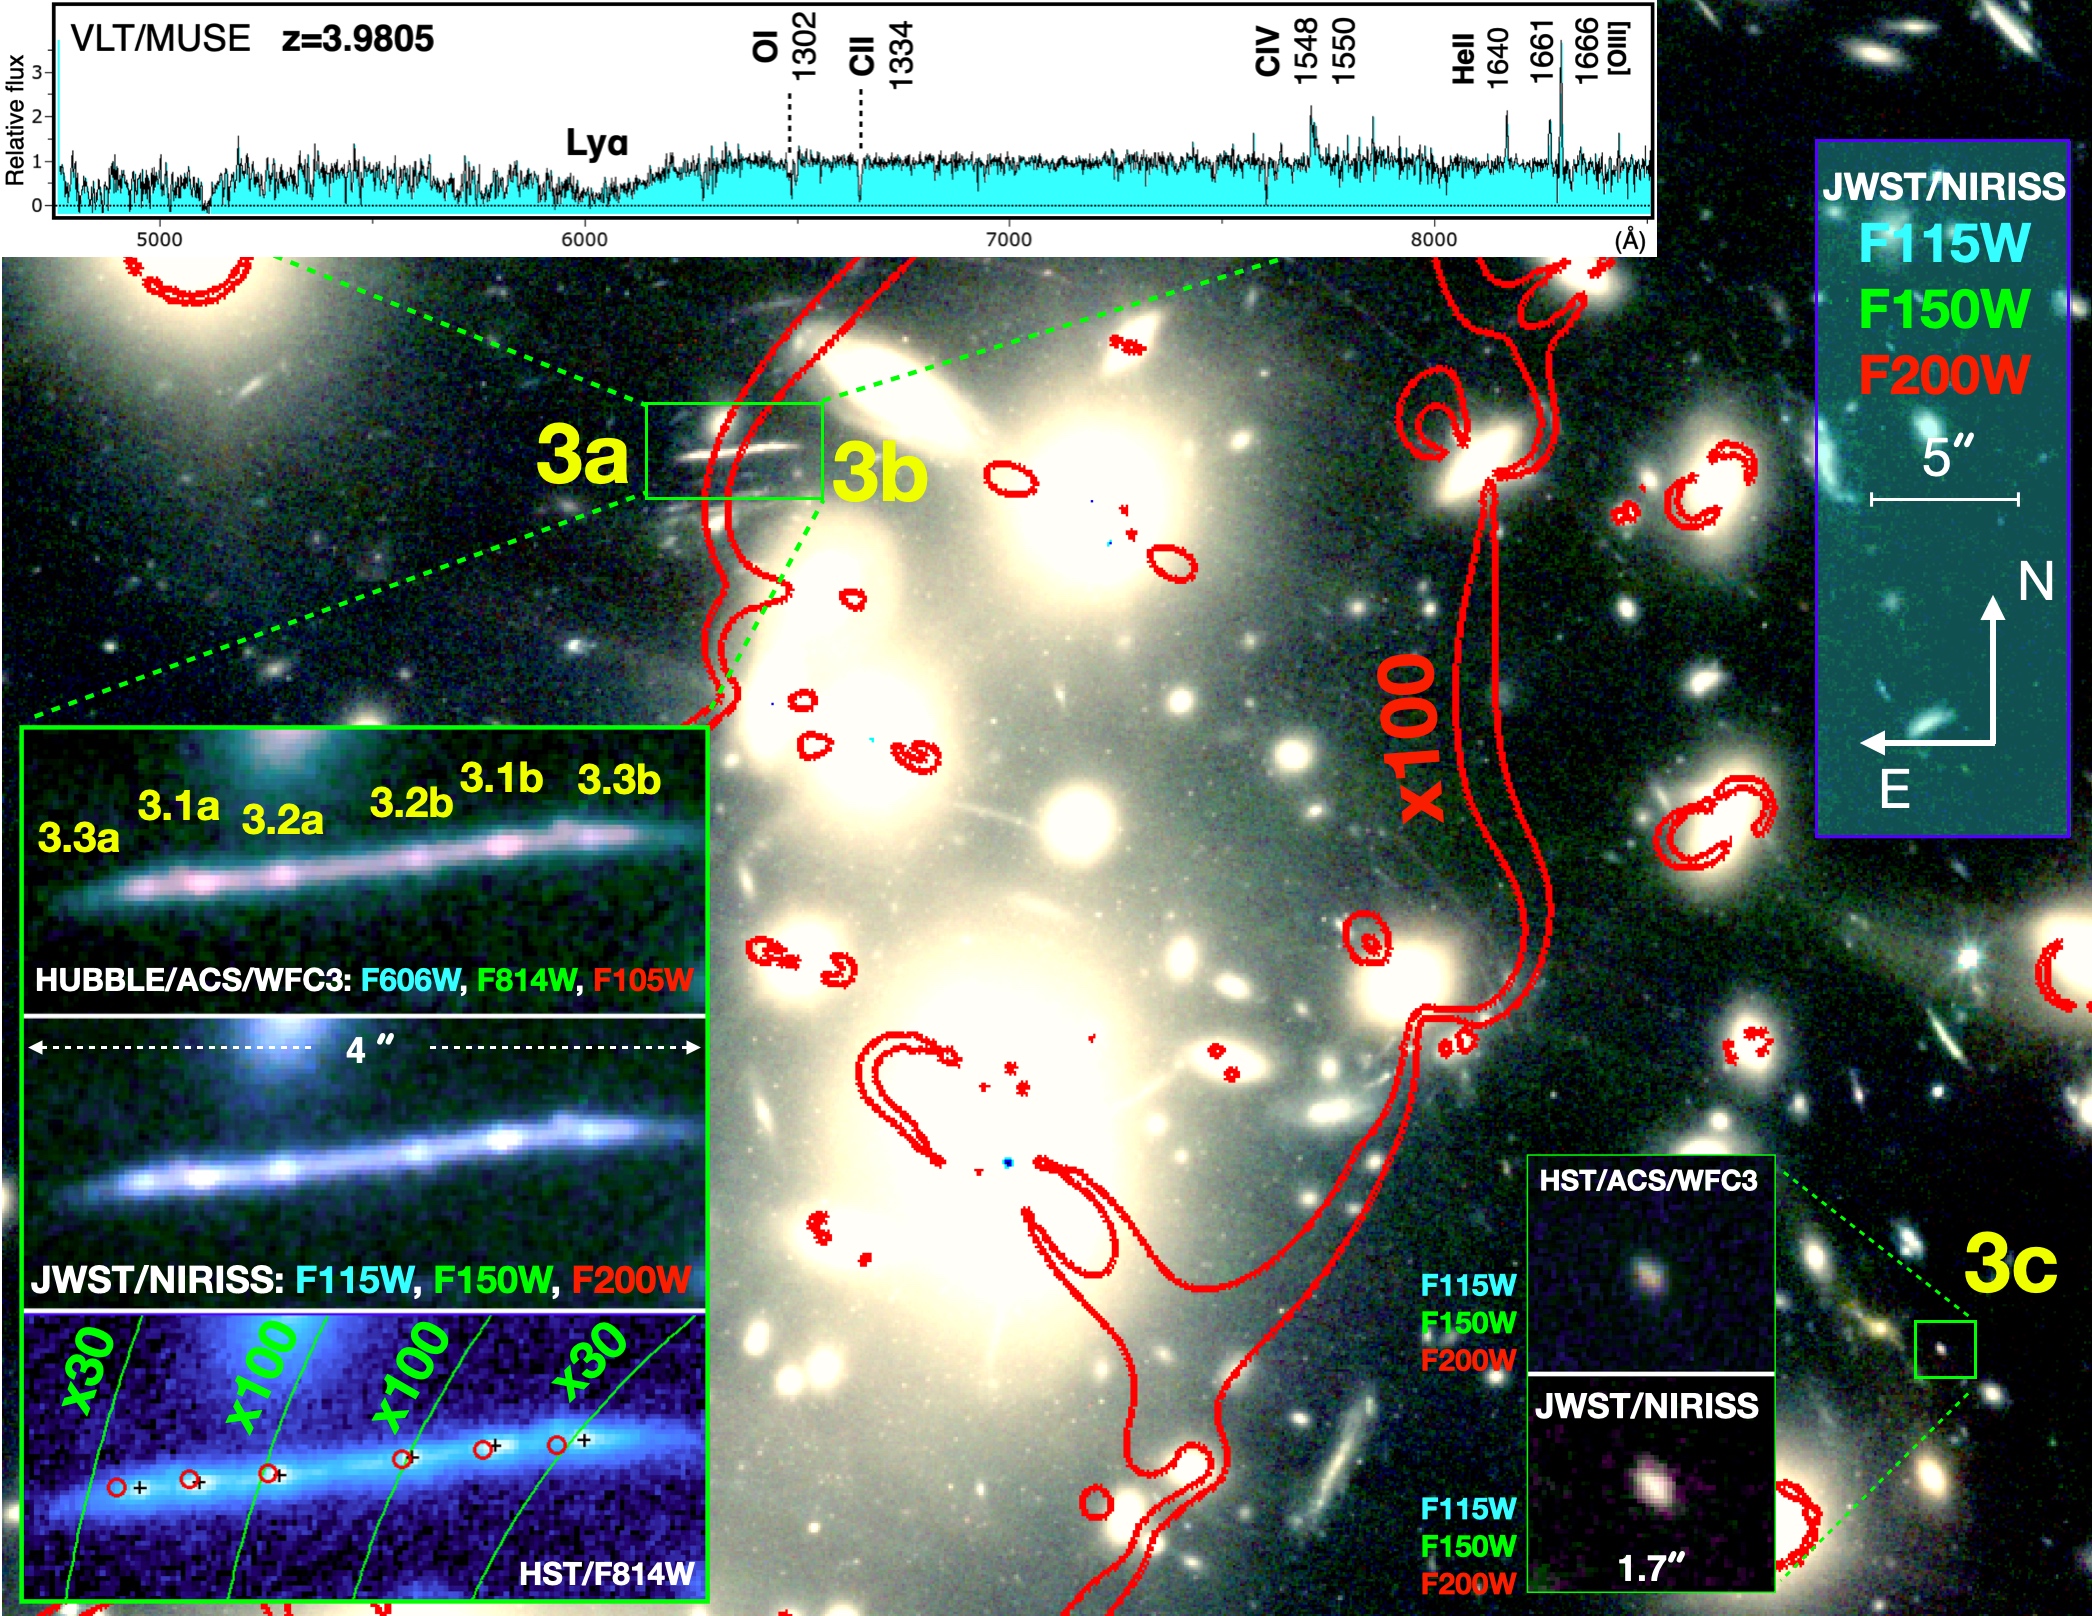
We focus here on “System 3”, a highly magnified source confirmed at z=3.9805 and observed with VLT/MUSE by Mahler et al. (2018). System 3 is split into three multiple images (3a, 3b and 3c in Figure 1, see also Bergamini et al. 2022). Images 3a,b straddle the critical line, which produces large magnification values resulting in a bright arclet with a total magnitude F814W (at Å rest-frame). Based on the recent high-precision lens model described in Bergamini et al. (2022), the arclet is split into two images which lie on both sides of the critical line at z=3.9805. In each image, (at least) three additional compact star-forming regions appear mirrored on each side and are subjected to total magnification () values spanning the interval , with a large associated tangential stretch () as reported in the Table 1 (see also Figure 1). Such a mirrored triplet of star-forming regions is evident in all space-based bands obtained with HST and JWST (Figure 2). The rest-frame ultraviolet high signal to noise ratio VLT/MUSE spectrum of the arclet shows absorption lines and high-ionization nebular emission lines in emission (Civ, Heii, Oiii]), along with the absence of Ly. The third least magnified counter-image (3c) is too faint and not confirmed with VLT/MUSE spectroscopy.
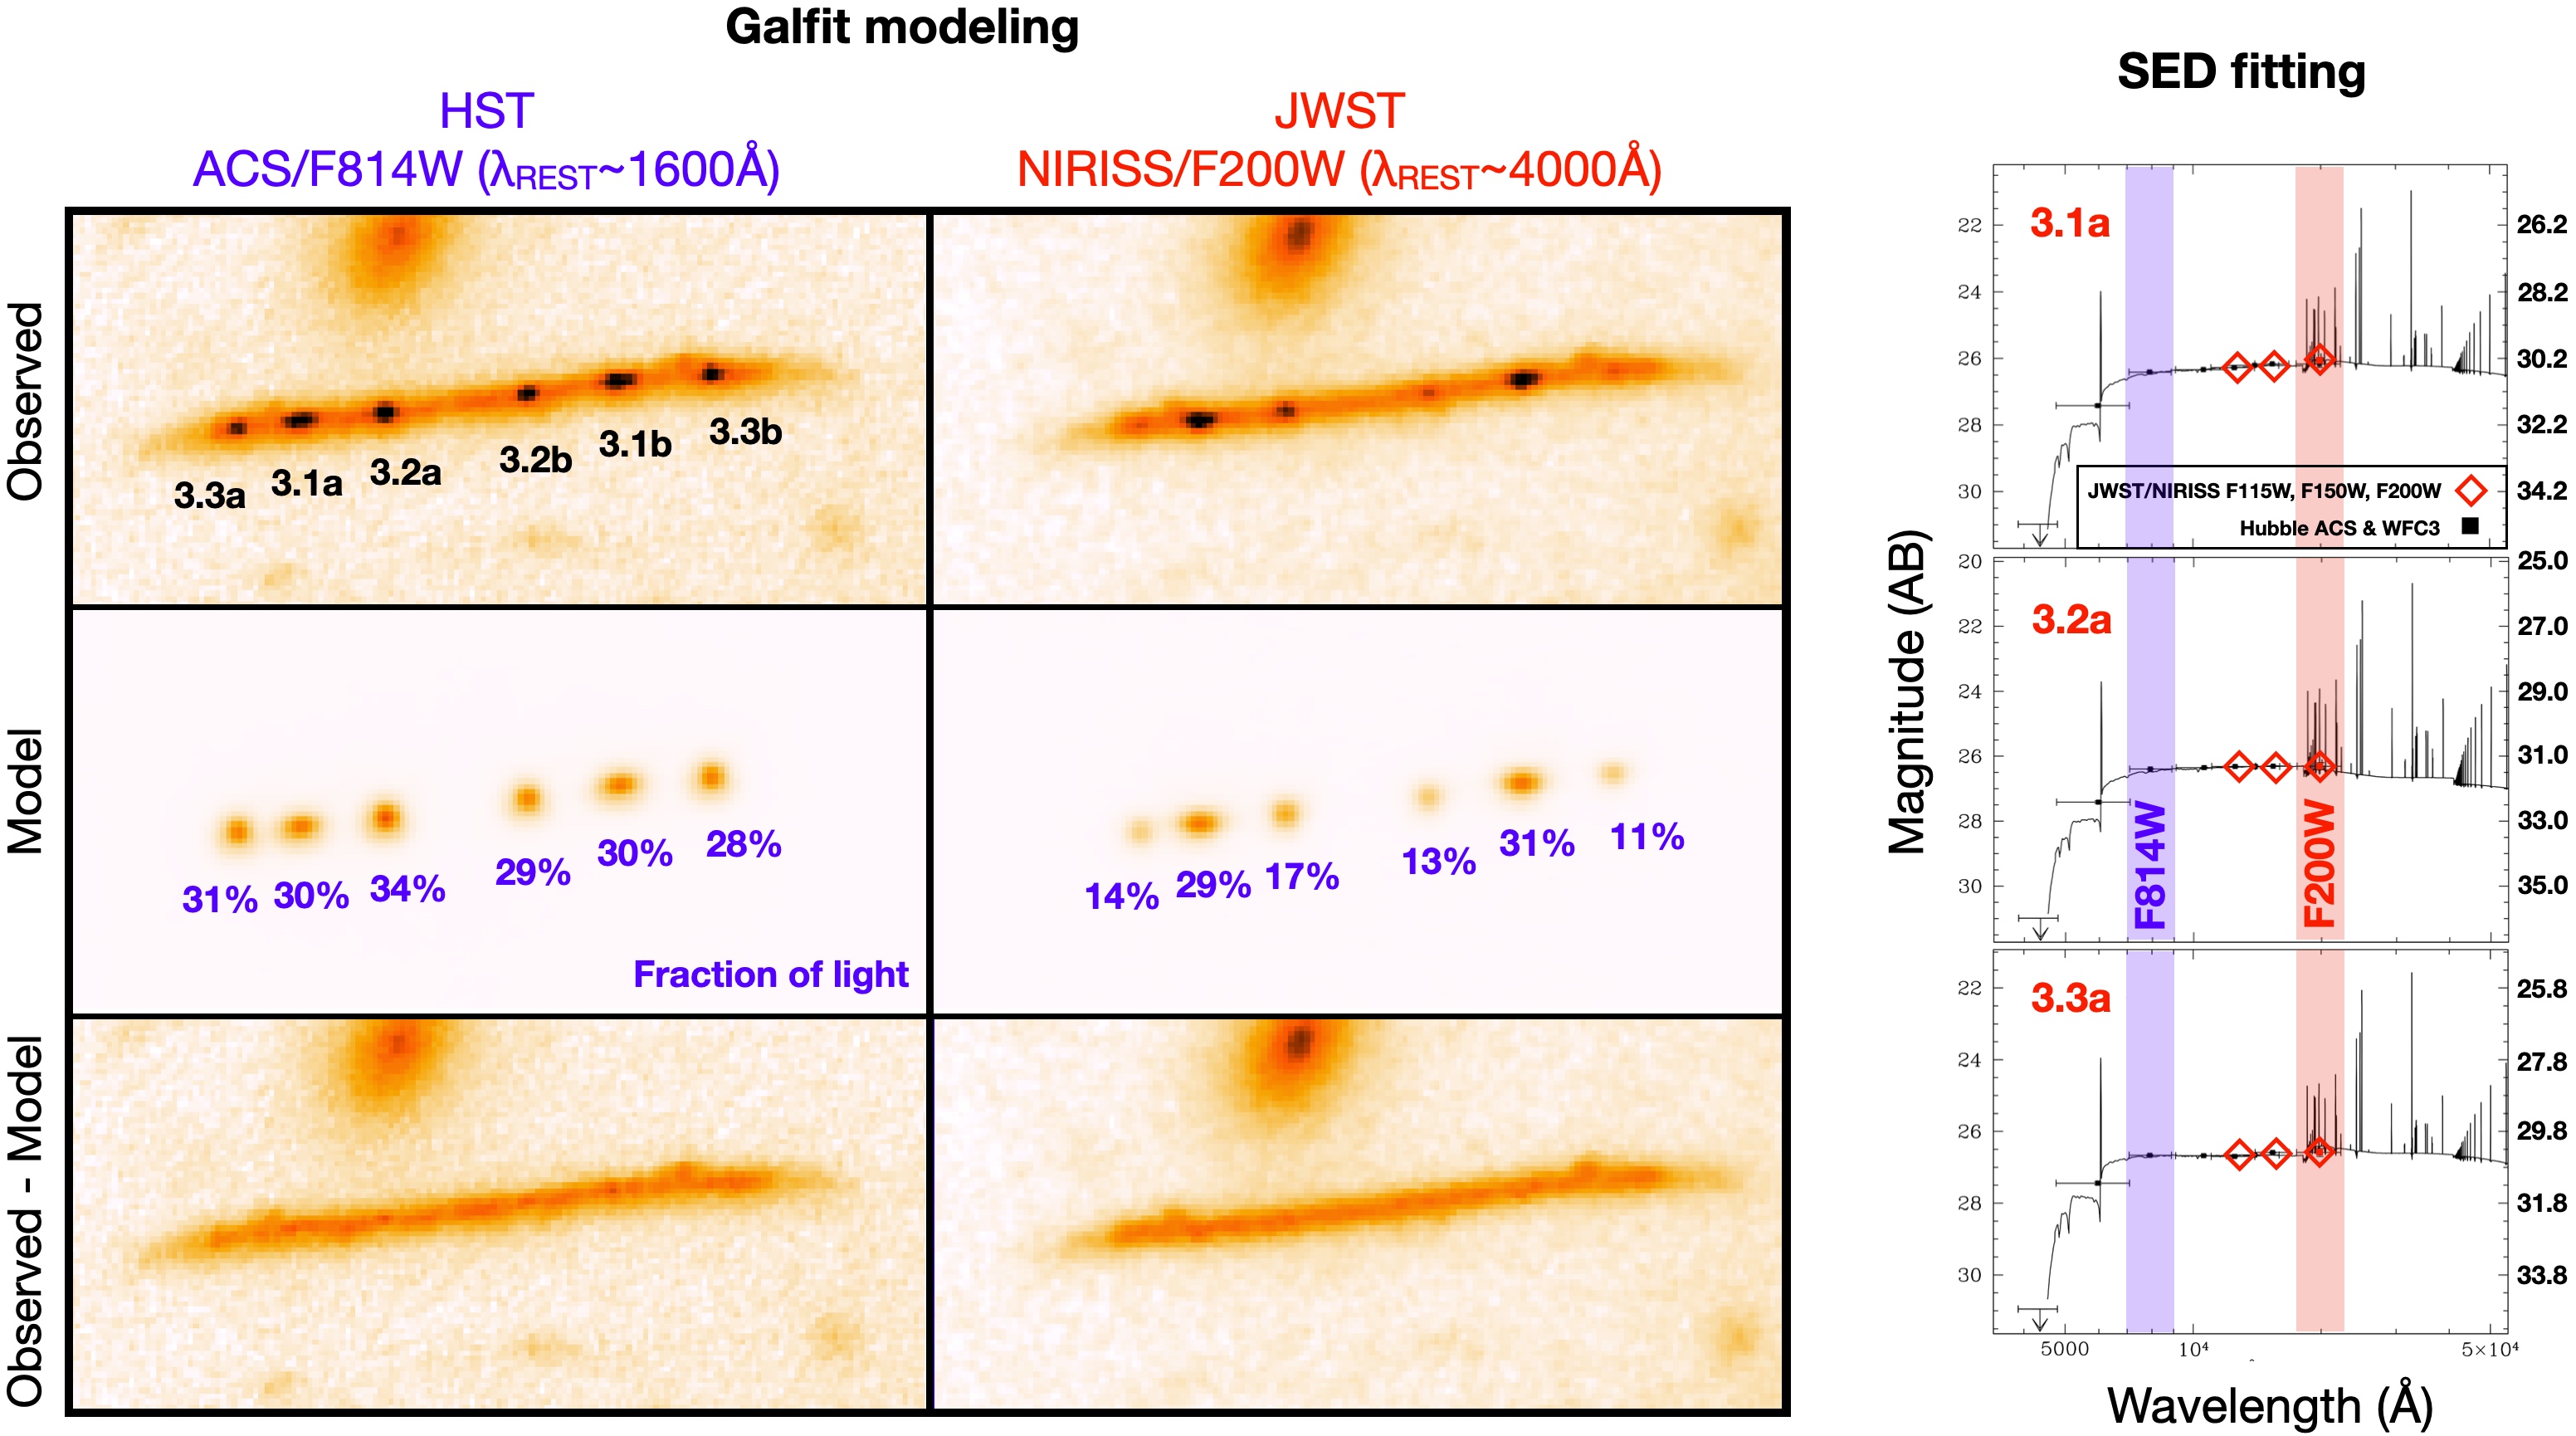
GALFIT fitting (Peng et al., 2010) of each star-forming knot was performed in the HST F814W image following the usual methodology described in, e.g., Vanzella et al. (2022). Residual images were visually inspected and checked so that the remaining underlying median signal was of the same level as the median value calculated in the “intra-knot” regions. In this way, only the signal from the clean arclet, free from the nucleated knots, is left after subtracting the GALFIT models (see Figure 3). We adopt a Sersic index (and note that equivalent results are obtained with Gaussian profiles). Only the multiple imaged knot 3.1 (mirrored a,b) appears elongated along the tangential shear with an effective radius R pixel, whereas the others appear barely resolved with an R pixel. The inferred total magnitudes span the range , with a typical uncertainty of 0.3 mags (and corresponding to 30.5-31.5 intrinsic). The sizes and absolute magnitudes in the HST/F814W band are reported in Table 1, while Figure 3 shows the modeled knots and the residual diffuse arclet after subtraction.
3.2 A sharp rest-frame optical view: JWST/NIRISS
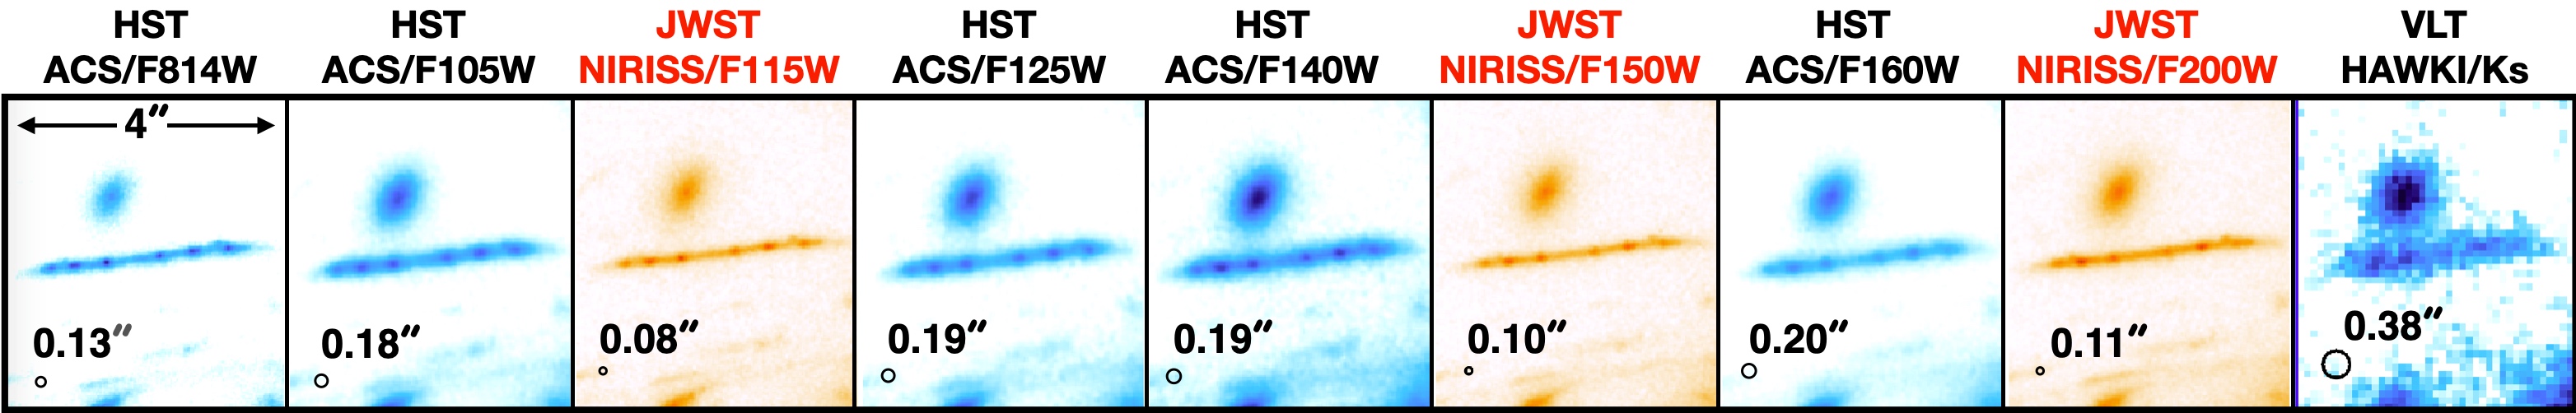
The three JWST/NIRISS filters used for pre-imaging probe the 2300Å, 3000Å and 4000Å rest-frame. Although these wavelengths were partially covered by the HST WFC3/F125W and F140W/F160W filters, the new JWST/NIRISS images have an angular resolution about two times sharper than HST. The PSF was extracted from non-saturated stars in the same field of view and used in the GALFIT runs. JWST/NIRISS imaging produces nearly diffraction-limited images at the observed wavelengths which are undersampled in the raw data (Roberts-Borsani et al., 2022). The final PSF FWHM are , and in the F115W, F150W and F200W, respectively (see Figure 2). F200W (K-band), instead, is unique at this stage and probes spatial scales four times sharper than the ground-based VLT/HAWKI (Kissler-Patig et al., 2008). Furthermore, it is at least 2.5 magnitudes deeper. We show the F200W image (4000Å rest-frame) of the arclet in Figure 3, where it appears clear that the optical sizes are not dissimilar from the ultraviolet ones. Size and morphology were determined with GALFIT following the same procedure applied to the HST data. Results are listed in Table 1.
3.3 Very large magnification
The predicted image 3c can be used to probe the magnification the system is subject to by looking at the relative magnifications among multiple images (e.g., Vanzella et al., 2017a). In particular, the flux ratio f(3[a+b])/f(3c) measured in the F814W band is which sets a stringent lower limit to the magnification of 3(a+b):
| (1) |
where is well constrained from the lens model (Bergamini et al., 2022). Such a lower limit is due to the fact that only a portion of the galaxy is probed at positions 3a (or 3b) and that the magnification gradient is not included in this estimate. The inferred value is in line with a very high magnification regime. The lens model predictions therefore accurately reproduce the magnification and positions of all multiple images/knots (see Figure 1). The total magnifications () derived at the predicted positions are and 100 for images 3.3(a,b), 3.1(a,b) and 3.2(a,b), respectively. These values are dominated by the tangential magnification (), such that and 60 with statistical uncertainties not larger than 20% at two sigma. The de-lensed effective radii (parsec) in the ultraviolet (HST-based) and optical (JWST-based) wavelengths are reported in Table 1 and are fully consistent with each other within uncertainties.
3.4 Physical properties of the star forming knots
Physical quantities of each star forming knot of the arclet have been derived with Spectral Energy Distribution (SED) fitting, along with the host galaxy probed by image 3c. The extraction of the HST and JWST photometry for this specific source is described in Appendix 5. We use standard BC03 (Bruzual & Charlot, 2003) templates and adopt the following priors: Chabrier initial mass function, exponentially declining star-formation histories with e-folding times of Gyr, and the extinction laws from both Small Magellanic Cloud (Prevot et al., 1984) and Calzetti et al. (2000). We considered the following range of physical parameters: , Age 1Myr (defined as the onset of the star-formation episode) and metallicity Z/Z⊙ = 0.02, 0.2, 1.0. The best-fit de-lensed values are reported in Table 1. The three nucleated star-forming regions show a rather flat ultraviolet slope (, ), stellar masses in the range M⊙, ages in the range Myr and SFR of a few percent yr-1, with E(B-V) . The entire galaxy hosting the three compact star forming regions is probed by image 3c and its properties are also reported in Table 1.
4 Young massive stellar clusters at
Despite the large magnification stretch, the very compact observed sizes of the three stellar systems imply they are truly small, and eventually having sizes comparable to those of young massive star clusters in the local Universe. To explore if they are gravitationally-bound star clusters we derive the dynamical age (which is the ratio between the age of the system and crossing time TCR, Gieles & Portegies Zwart 2011). This quantity has been extensively used to identify bound star clusters in the local Universe (e.g., Adamo et al., 2020b; Ryon et al., 2017, and recently for the first time at cosmological distance, Vanzella et al. 2022).
In particular, the crossing time expressed in Myr is defined as , where M and are the stellar mass and the effective radius, respectively, and is the gravitational constant. Stellar systems evolved for more than a crossing time have , suggestive of being bound. In calculating we assume that all the involved quantities have an uncertainty of 50%, except the magnification for which we take 30% (corresponding to 3-sigma statistical error, Bergamini et al. 2022). Sources 3.1, 3.2 and 3.3 (“a” or “b” groups) have which implies they are gravitationally-bound objects. Given their extremely small sizes (R20 pc), they likely are the highest redshift, spectroscopically confirmed, stellar clusters probed so far. The specific star formation rates (sSFR) are significantly large Gyr-1, along with their stellar mass surface densities which resemble those ones observed in local globular (or young massive) clusters (Table 1). Such objects result to be relatively young ( Myr old), though not as young as other cases showing spectral signatures like p-cygni profiles of Nv and/or Civ and/or very blue colors indicating Myr stellar populations (Vanzella et al., 2022). Rather, their properties resemble those of another lensed physical pair of stellar systems (likely massive star clusters) at z=3.222 which shows a similar flat ultraviolet slope (), absence of Ly emission, the presence of high-ionization nebular lines and ages of the same order of magnitude as those derived here ( Myr, Vanzella et al., 2021, Appendix C; see also the SED fits in Vanzella et al. 2017b).
By means of the JWST/NIRISS resolution in the K-band (NIRISS/F200W), we can compare the fraction of optical light (4000Å rest-frame) the star clusters contribute to the underlying host region to the corresponding fraction measured in the ultraviolet (1600Å rest-frame, HST/F814W). Two out of the three stellar clusters (3.3 and 3.2) are more prominent in the UV (contributing to 30% of the light inferred within the adopted circular aperture of ) and significantly decrease to in the F200W band. Instead, in the case of system 3.1, such fraction of light remains constant in both bands (Figure 3). Such behaviors are consistent with the inferred young ages for 3.2 and 3.3 (decreasing flux) and with the relatively older age for 3.1 (constant flux). Similar results have been recently observed in the local starburst galaxy Haro11 which hosts a multitude of massive stellar clusters (Sirressi et al., 2022).
Finally, the host galaxy, as probed by image 3c, has a relatively low stellar mass, M⊙, and a high star formation rate surface density (, yr-1 kpc-2) log, for which a high occurrence of forming star clusters is expected from studies of local analog dense starburst galaxies, showing large star cluster formation efficiencies (Adamo et al., 2020b, a).
5 Summary and conclusions
In this work, we study a highly magnified galaxy at z=4, straddling the critical line of the Hubble Frontier Field cluster A2744. Several star forming regions are revealed as very compact objects, despite the large tangential stretch provided by gravitational lensing. In particular, the new JWST/NIRISS imaging of the system allows us to:
probe the star forming knots at unprecedented angular resolution in the near-infrared (JWST/NIRISS F200W, corresponding to rest-frame optical), matching the existing high-resolution rest-frame ultraviolet view from HST/F814W. The identified nucleated forming knots show comparable effective radii in the ultraviolet and in the optical, spanning the range pc.
derive SED fitting locally for each compact region taking advantage of the wavelength coverage of JWST/NIRISS that encompasses the rest-frame Balmer-break region at .
Such parsec-scale sources are inferred to be a few tens of Myr old gravitationally-bound stellar clusters, with estimated stellar masses of M⊙. This makes them among the highest redshift young massive star clusters confirmed to date. The inferred stellar mass surface densities also resemble those of local young massive star clusters and globular clusters, suggesting they may be potential globular cluster precursors.
The search and characterization of the (high mass tail) stellar cluster population at high redshift will be soon performed with JWST/NIRCam (Rieke et al., 2005) imaging in the lensed fields, allowing us to extend the study presented here to redder wavelengths, until Å rest-frame at z=4, or Å rest-frame up to redshift . This highlights the potential of JWST to directly witness the formation of globular clusters during and/or immediately after the epoch of reionization.
| ID | M1600 | M4000 | Mass | Age | SFR | R | R | sSFR | ||||
|---|---|---|---|---|---|---|---|---|---|---|---|---|
| HST | JW | [M⊙] | [Myr] | [ yr-1] | [pc] | [pc] | [Gyr-1] | [M⊙ pc-2] | ||||
| 3.1a | -15.09 | -16.19 | 13.8 | 15.2 | 12.5 | 1602 | 49.0 | 30.3 | ||||
| 3.2a | -14.16 | -14.56 | 3.2 | 3.8 | 42.3 | 3979 | 105.1 | 65.2 | ||||
| 3.3a | -14.86 | -15.01 | 11.4 | 11.4 | 37.7 | 650 | 33.3 | 20.2 | ||||
| 3.1b | -15.14 | -16.09 | 15.3 | 14.5 | 15.9 | 1547 | 46.8 | 27.3 | ||||
| 3.2b | -13.79 | -14.09 | 3.0 | 4.0 | 37.4 | 2772 | 102.7 | 62.2 | ||||
| 3.3b | -15.22 | -15.10 | 10.9 | 13.1 | 42.6 | 610 | 31.4 | 19.1 | ||||
| 3c | -18.17 | -19.32 | 279.4 | 270.9 | 8.9 | 201 | 3.8 | 2.7 |
Note. — Column (1) lists the IDs of the sources; from top to bottom the coordinates are (3.5893762, -30.3938584) - (3.5892221, -30.3938434) - (3.5894880, -30.3938704) - (3.5888077, -30.3937976) - (3.5889706, -30.3938143) - (3.5886425, -30.3937845) - (3.5766318, -30.4018181); (2) and (3) show the absolute magnitudes at 1600Å and 4000Å; (4), (5) and (6) report the stellar mass, age and SFR derived from the SED fitting; the effective radii at 1600Å and 4000Å are shown in columns (7) and (8); the dynamical age in units of crossing time (), the specific star formation rate (sSFR) and the stellar mass surface density in columns (9), (10) and (11), respectively; total and tangential magnifications are listed in columns (12) and (13). Uncertainties on the radii are of the order of 50%, while magnifications have a statistical 3-sigma error of 30% (Bergamini et al., 2022).
Appendix A JWST/NIRISS photometry probing the rest-optical at z=4
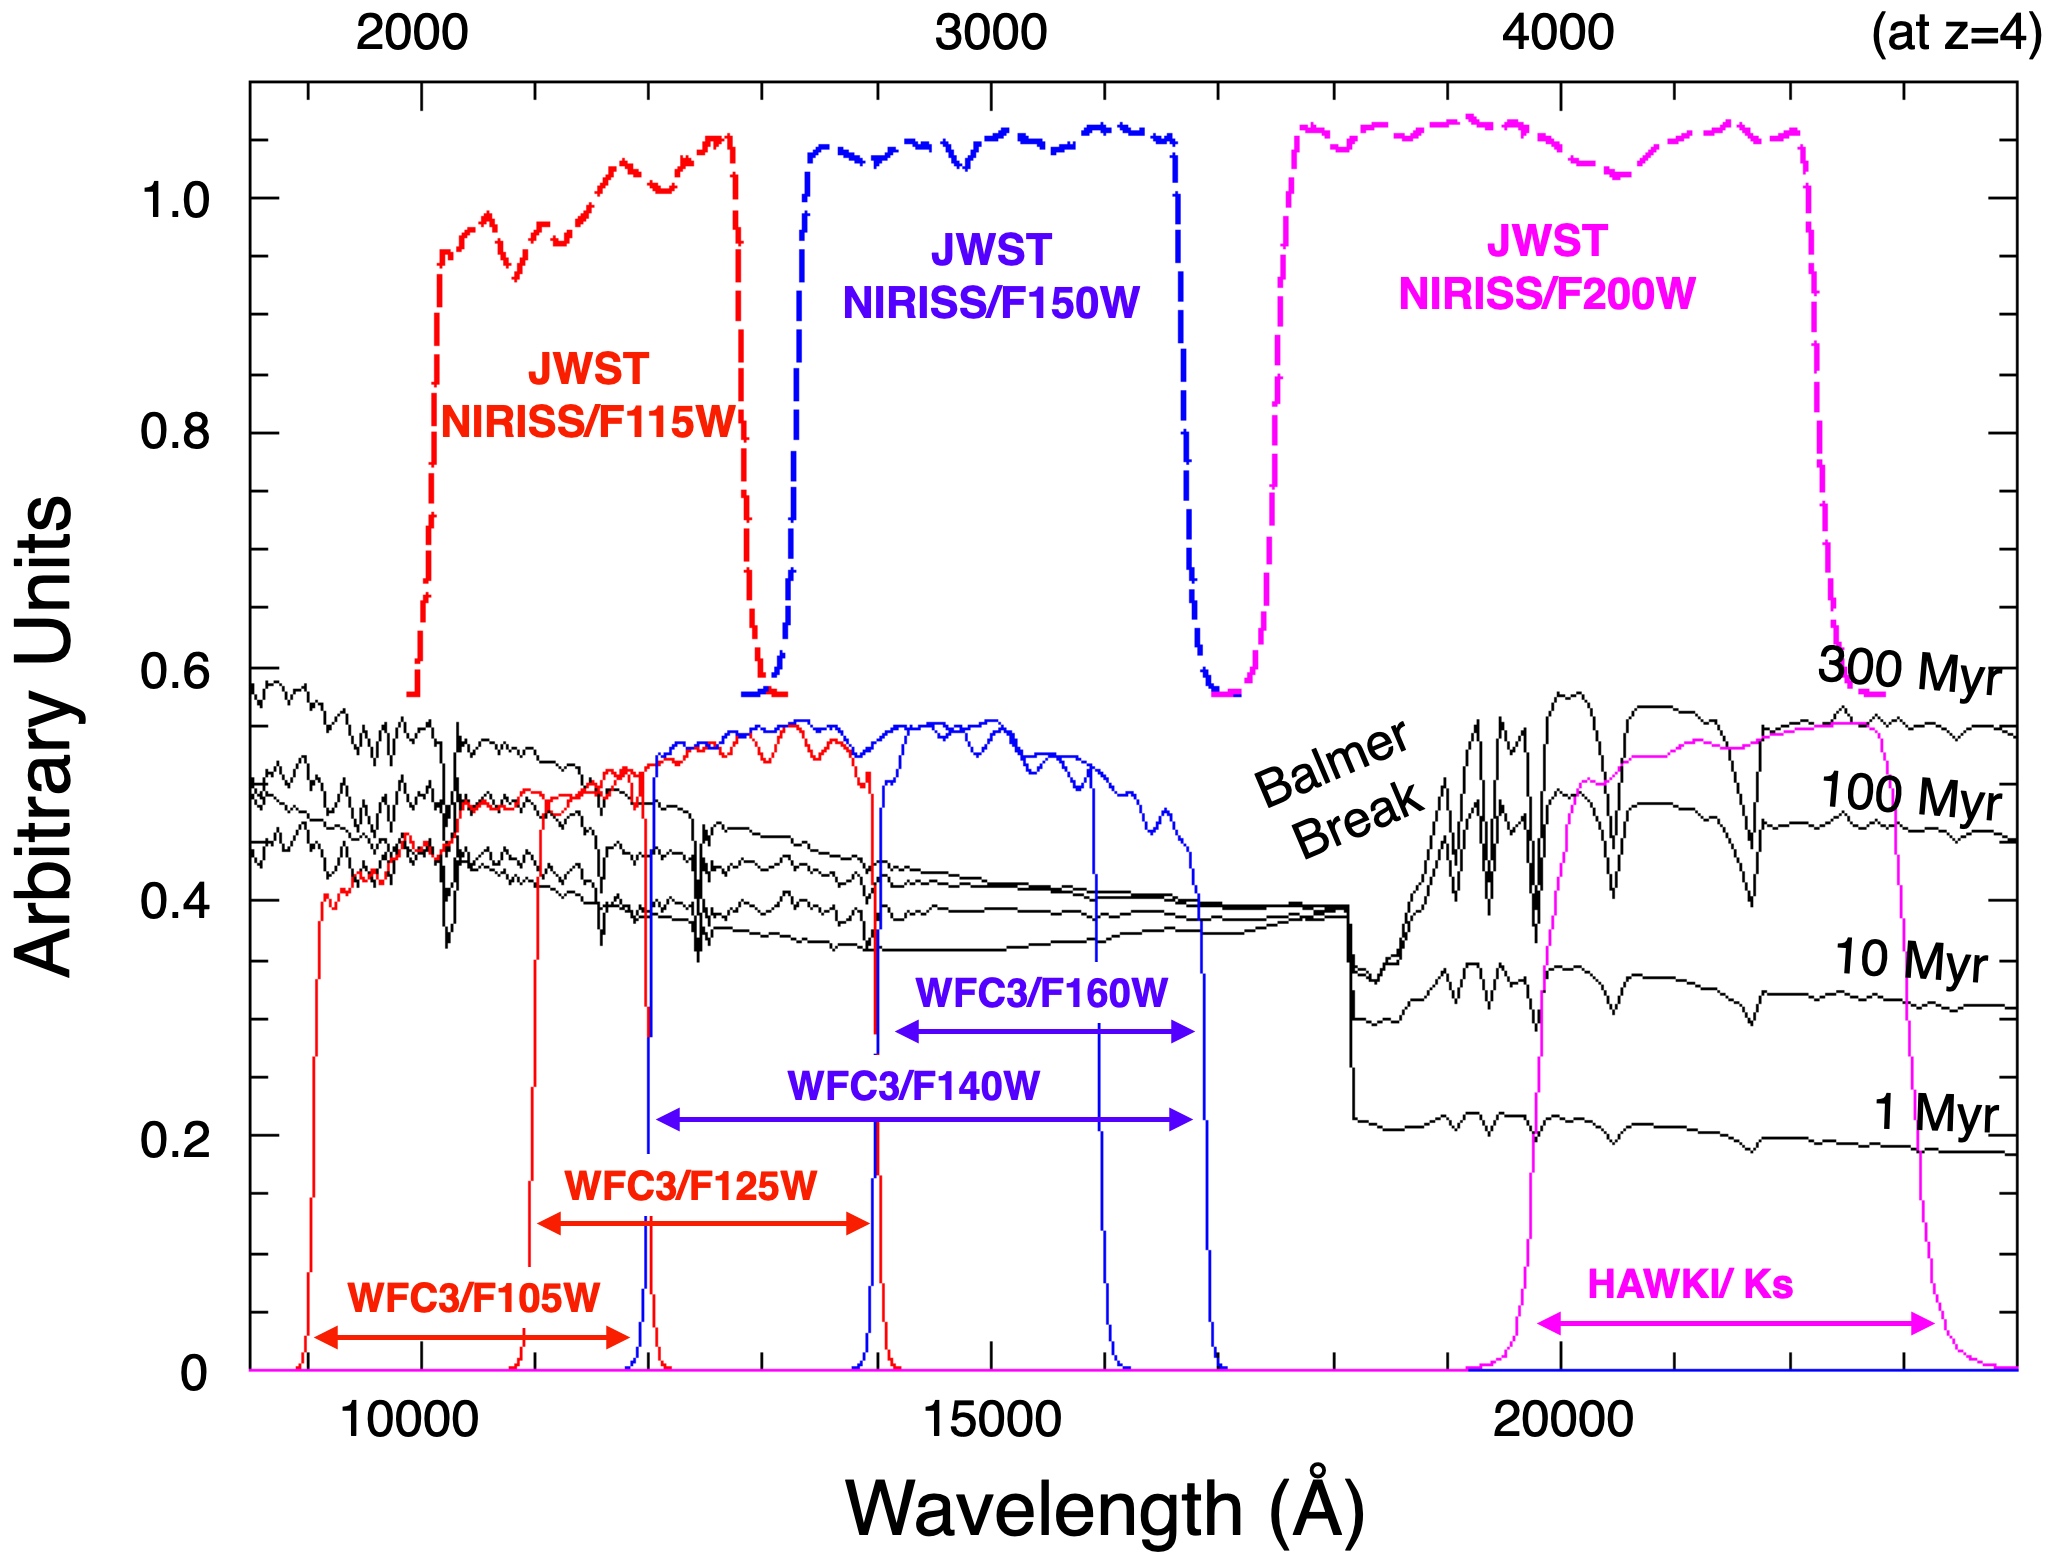
Figure 4 shows the three NIRISS filters F115W, F150W and F200W compared to the available Hubble Frontier Field ones, HST/WFC3 F105W, F125W, F140W and F160W, along with the ground-based VLT/HAWKI Ks-band. For visualization-only-purpose, four spectral templates placed at z=3.9805 showing the Balmer break at ages of 1, 10, 100, 300 Myr are also superimposed (extracted from Starburst99 library, Leitherer et al. 2014). The NIRISS/F200W filter probes the Balmer break at an unprecedented angular resolution. The photometry of each knot was extracted from PSF-matched HST images (Merlin et al., 2016) adopting circular apertures of diameter (as we did recently in a study of compact high-z clumps by Meštrić et al. 2022). Given the superposition of HST and NIRISS filters in the wavelength range and the relatively flat ultraviolet slope of the sources (Figure 3), we anchor the NIRISS/F150W magnitude to HST WFC3/F140W and F160W (by imposing the NIRISS/F150W flux to match the mean flux computed among the two HST bands bracketing the NIRISS/F150W). We then apply the same shift to NIRISS/F115W and F200W. This makes HST and JWST/NIRISS colors consistent. The colors of the SED in the wavelength range are consistent to those observed previously for the full arclet (Castellano et al., 2016), though here the JWST/NIRISS angular resolution allows us to probe unprecedented spatial scales in the near-infrared.
The normalization of the SED of each knot is subsequently calculated from the total magnitude inferred with Galfit in the reference band, HST/F814W (such normalization introduces an additional uncertainty of about 30%). SEDs were then injected into the SED-fitting code which provided the physical quantities. The stellar mass and the star formation rate have been de-lensed (divided by ) to infer the intrinsic properties reported in Table 1.
References
- Adamo et al. (2020a) Adamo, A., Zeidler, P., Kruijssen, J. M. D., et al. 2020a, Space Sci. Rev., 216, 69, doi: 10.1007/s11214-020-00690-x
- Adamo et al. (2020b) Adamo, A., Hollyhead, K., Messa, M., et al. 2020b, arXiv e-prints, arXiv:2008.12794. https://arxiv.org/abs/2008.12794
- Bergamini et al. (2022) Bergamini, P., Acebron, A., Grillo, C., et al. 2022, arXiv e-prints, arXiv:2207.09416. https://arxiv.org/abs/2207.09416
- Bik et al. (2018) Bik, A., Östlin, G., Menacho, V., et al. 2018, A&A, 619, A131, doi: 10.1051/0004-6361/201833916
- Bruzual & Charlot (2003) Bruzual, G., & Charlot, S. 2003, MNRAS, 344, 1000, doi: 10.1046/j.1365-8711.2003.06897.x
- Calzetti et al. (2000) Calzetti, D., Armus, L., Bohlin, R. C., et al. 2000, ApJ, 533, 682, doi: 10.1086/308692
- Calzetti et al. (2015a) Calzetti, D., Lee, J. C., Sabbi, E., et al. 2015a, AJ, 149, 51, doi: 10.1088/0004-6256/149/2/51
- Calzetti et al. (2015b) Calzetti, D., Johnson, K. E., Adamo, A., et al. 2015b, ApJ, 811, 75, doi: 10.1088/0004-637X/811/2/75
- Castellano et al. (2016) Castellano, M., Amorín, R., Merlin, E., et al. 2016, A&A, 590, A31, doi: 10.1051/0004-6361/201527514
- Cava et al. (2018) Cava, A., Schaerer, D., Richard, J., et al. 2018, Nature Astronomy, 2, 76, doi: 10.1038/s41550-017-0295-x
- Dessauges-Zavadsky et al. (2019) Dessauges-Zavadsky, M., Richard, J., Combes, F., et al. 2019, Nature Astronomy, 3, 1115, doi: 10.1038/s41550-019-0874-0
- Doyon et al. (2012) Doyon, R., Hutchings, J. B., Beaulieu, M., et al. 2012, in Society of Photo-Optical Instrumentation Engineers (SPIE) Conference Series, Vol. 8442, Space Telescopes and Instrumentation 2012: Optical, Infrared, and Millimeter Wave, ed. M. C. Clampin, G. G. Fazio, H. A. MacEwen, & J. Oschmann, Jacobus M., 84422R, doi: 10.1117/12.926578
- Elmegreen et al. (2009) Elmegreen, B. G., Elmegreen, D. M., Fernandez, M. X., & Lemonias, J. J. 2009, ApJ, 692, 12, doi: 10.1088/0004-637X/692/1/12
- Genzel et al. (2011) Genzel, R., Newman, S., Jones, T., et al. 2011, ApJ, 733, 101, doi: 10.1088/0004-637X/733/2/101
- Gieles & Portegies Zwart (2011) Gieles, M., & Portegies Zwart, S. F. 2011, MNRAS, 410, L6, doi: 10.1111/j.1745-3933.2010.00967.x
- Guo et al. (2018) Guo, Y., Rafelski, M., Bell, E. F., et al. 2018, ApJ, 853, 108, doi: 10.3847/1538-4357/aaa018
- He et al. (2020) He, C.-C., Ricotti, M., & Geen, S. 2020, MNRAS, 492, 4858, doi: 10.1093/mnras/staa165
- Heckman et al. (2011) Heckman, T. M., Borthakur, S., Overzier, R., et al. 2011, ApJ, 730, 5, doi: 10.1088/0004-637X/730/1/5
- Iani et al. (2021) Iani, E., Zanella, A., Vernet, J., et al. 2021, MNRAS, 507, 3830, doi: 10.1093/mnras/stab2376
- James et al. (2016) James, B. L., Auger, M., Aloisi, A., Calzetti, D., & Kewley, L. 2016, ApJ, 816, 40, doi: 10.3847/0004-637X/816/1/40
- Johnson et al. (2017) Johnson, T. L., Rigby, J. R., Sharon, K., et al. 2017, ApJ, 843, L21, doi: 10.3847/2041-8213/aa7516
- Kissler-Patig et al. (2008) Kissler-Patig, M., Pirard, J. F., Casali, M., et al. 2008, A&A, 491, 941, doi: 10.1051/0004-6361:200809910
- Leitherer et al. (2014) Leitherer, C., Ekström, S., Meynet, G., et al. 2014, ApJS, 212, 14, doi: 10.1088/0067-0049/212/1/14
- Livermore et al. (2015) Livermore, R. C., Jones, T. A., Richard, J., et al. 2015, MNRAS, 450, 1812, doi: 10.1093/mnras/stv686
- Lotz et al. (2017) Lotz, J. M., Koekemoer, A., Coe, D., et al. 2017, ApJ, 837, 97, doi: 10.3847/1538-4357/837/1/97
- Mahler et al. (2018) Mahler, G., Richard, J., Clément, B., et al. 2018, MNRAS, 473, 663, doi: 10.1093/mnras/stx1971
- Mehta et al. (2021) Mehta, V., Scarlata, C., Fortson, L., et al. 2021, ApJ, 912, 49, doi: 10.3847/1538-4357/abed5b
- Merlin et al. (2016) Merlin, E., Amorín, R., Castellano, M., et al. 2016, A&A, 590, A30, doi: 10.1051/0004-6361/201527513
- Meštrić et al. (2022) Meštrić, U., Vanzella, E., Zanella, A., et al. 2022, arXiv e-prints, arXiv:2202.09377, doi: 10.48550/arXiv.2202.09377
- Oke & Gunn (1983) Oke, J. B., & Gunn, J. E. 1983, The Astrophysical Journal, 266, 713, doi: 10.1086/160817
- Peng et al. (2010) Peng, C. Y., Ho, L. C., Impey, C. D., & Rix, H.-W. 2010, AJ, 139, 2097, doi: 10.1088/0004-6256/139/6/2097
- Prevot et al. (1984) Prevot, M. L., Lequeux, J., Maurice, E., Prevot, L., & Rocca-Volmerange, B. 1984, A&A, 132, 389
- Richard et al. (2021) Richard, J., Claeyssens, A., Lagattuta, D., et al. 2021, A&A, 646, A83, doi: 10.1051/0004-6361/202039462
- Rieke et al. (2005) Rieke, M. J., Kelly, D., & Horner, S. 2005, in Society of Photo-Optical Instrumentation Engineers (SPIE) Conference Series, Vol. 5904, Cryogenic Optical Systems and Instruments XI, ed. J. B. Heaney & L. G. Burriesci, 1–8, doi: 10.1117/12.615554
- Rigby et al. (2017) Rigby, J. R., Johnson, T. L., Sharon, K., et al. 2017, ApJ, 843, 79, doi: 10.3847/1538-4357/aa775e
- Rivera-Thorsen et al. (2019) Rivera-Thorsen, T. E., Dahle, H., Chisholm, J., et al. 2019, Science, 366, 738, doi: 10.1126/science.aaw0978
- Roberts-Borsani et al. (2022) Roberts-Borsani, G., Morishita, T., Treu, T., et al. 2022, arXiv e-prints, arXiv:2207.11387. https://arxiv.org/abs/2207.11387
- Ryon et al. (2017) Ryon, J. E., Gallagher, J. S., Smith, L. J., et al. 2017, ApJ, 841, 92, doi: 10.3847/1538-4357/aa719e
- Sirressi et al. (2022) Sirressi, M., Adamo, A., Hayes, M., et al. 2022, MNRAS, 510, 4819, doi: 10.1093/mnras/stab3774
- Sok et al. (2022) Sok, V., Muzzin, A., Jablonka, P., et al. 2022, ApJ, 924, 7, doi: 10.3847/1538-4357/ac2f40
- Treu et al. (2022) Treu, T., Roberts-Borsani, G., Bradac, M., et al. 2022, ApJ, in press, arXiv:2206.07978. https://arxiv.org/abs/2206.07978
- Vanzella et al. (2017a) Vanzella, E., Calura, F., Meneghetti, M., et al. 2017a, MNRAS, 467, 4304, doi: 10.1093/mnras/stx351
- Vanzella et al. (2017b) Vanzella, E., Castellano, M., Meneghetti, M., et al. 2017b, ApJ, 842, 47, doi: 10.3847/1538-4357/aa74ae
- Vanzella et al. (2019) Vanzella, E., Calura, F., Meneghetti, M., et al. 2019, MNRAS, 483, 3618, doi: 10.1093/mnras/sty3311
- Vanzella et al. (2020) Vanzella, E., Caminha, G. B., Calura, F., et al. 2020, MNRAS, 491, 1093, doi: 10.1093/mnras/stz2286
- Vanzella et al. (2021) Vanzella, E., Caminha, G. B., Rosati, P., et al. 2021, A&A, 646, A57, doi: 10.1051/0004-6361/202039466
- Vanzella et al. (2022) Vanzella, E., Castellano, M., Bergamini, P., et al. 2022, A&A, 659, A2, doi: 10.1051/0004-6361/202141590
- Welch et al. (2022) Welch, B., Coe, D., Zitrin, A., et al. 2022, arXiv e-prints, arXiv:2207.03532. https://arxiv.org/abs/2207.03532
- Zanella et al. (2015) Zanella, A., Daddi, E., Le Floc’h, E., et al. 2015, Nature, 521, 54, doi: 10.1038/nature14409
- Zanella et al. (2019) Zanella, A., Le Floc’h, E., Harrison, C. M., et al. 2019, MNRAS, 489, 2792, doi: 10.1093/mnras/stz2099