Collisional Pumping of H2O and CH3OH Masers in C-Type Shock Waves
A.V. Nesterenok
Ioffe Physical-Technical Institute, Politekhnicheskaya St. 26, Saint Petersburg, 194021 Russia
e-mail: alex-n10@yandex.ru
Abstract
The collisional pumping of H2O and CH3OH masers in magnetohydrodynamic nondissociative C-type shocks is considered. A grid of C-type shock models with speeds in the range km s-1 and preshock gas densities cm-3 is constructed. The large velocity gradient approximation is used to solve the radiative transfer equation in molecular lines. The para-H2O 183.3 GHz and ortho-H2O 380.1 and 448.0 GHz transitions are shown to be inverted and to have an optical depth along the shock velocity at relatively low gas densities in the maser zone, cm-3. Higher gas densities, cm-3, are needed for efficient pumping of the remaining H2O masers. Simultaneous generation of H2O and class I CH3OH maser emission in a shock is possible at preshock gas densities cm-3 and shock speeds in the range km s-1. The possibility of detecting class I CH3OH and para-H2O 183.3 GHz masers in star-forming regions and near supernova remnants is investigated.
Keywords: cosmic masers, radiative transfer, shocks, star-forming regions.
DOI: 10.1134/S1063773722060044
Introduction
Shocks in the interstellar medium are observed at the formation stage of stars, during their evolution, and at the final evolutionary stage of massive stars – supernova explosions. At the star formation stage the protostellar bipolar outflows interact with the protostar envelope and the parent molecular cloud to produce shocks. After the explosion of a supernova its outer layers expand into the interstellar medium with a huge velocity, sweeping up the interstellar gas and forming a shock. In this paper we consider magnetohydrodynamic (MHD) nondissociative C-type shocks propagating in dense molecular clouds. The chemical reactions in the shock-heated gas and the sputtering of icy grain mantles change significantly the chemical composition of the gas and, at the same time, make it possible to diagnose the physical conditions through the observation of molecular and atomic lines. The more transitions of various molecules are observed in the shock-heated gas, the more accurate is the determination of physical parameters – the shock speed and the gas density and temperature. In this paper we investigate the physical conditions under which an intense H2O and CH3OH maser emission arises in shocks.
Shocks can be nondissociative (C-type, there is no dissociation of molecules at the shock front) and dissociative (J-type) (Draine and McKee 1993). The shock type depends on the magnetic field strength, the gas flow speed, and the gas ionization fraction. H2O maser emission can be generated in the postshock region of shocks of both types. If the gas flow speed is higher than the propagation speed of perturbations in the medium (the speed of sound and the magnetosonic speed), then a J-type shock is formed. In J-type shocks the physical parameters change in a narrow region of space with a size of the order of the mean free path of atoms and molecules. The gas in such shocks is heated to temperatures K, and there is a complete dissociation of molecules. Behind the shock front H2 molecules are formed on dust grains, and the release of thermal energy during H2 formation maintains a gas temperature of K. Elitzur et al. (1989) and Hollenbach et al. (2013) showed that the generation of an intense H2O 22.23 GHz maser emission is possible in the warm gas behind the front of a J-type shock. However, gas temperatures K are needed for efficient pumping of most H2O maser lines in the millimeter and submillimeter wavelength ranges (Gray et al. 2016).
If the gas flow speed is lower than the magnetosonic speed, but higher than the speed of sound for the neutral gas component, then a C-type shock is formed. In such shocks the changes in physical parameters at the shock front are determined by the diffusion of ions (and charged dust grains) and neutral gas through one another, and the gas parameters (temperature and density) undergo gradual changes. Since the kinetic energy of the gas flows is converted to thermal energy in a vast shock region, the gas is heated to temperatures much lower than those in J-type shocks: K. Passing through the front of a C-type shock, the gas remains molecular. In this case, the gas temperature at and behind the shock front, where the pumping of masers occurs, can be higher than that in the maser zone of J-type shocks: K (Kaufman and Neufeld 1996a). Previously it has been shown that relatively high gas densities, cm-3, are needed to pump H2O masers (Neufeld and Melnick 1991; Kaufman and Neufeld 1996a; Yates et al. 1997; Gray et al. 2016, 2022). The sizes of 22.23 GHz maser emission sources also point to high gas densities in maser spots (Kaufman and Neufeld 1996a). However, Cernicharo et al. (1994, 1999) and Daniel and Cernicharo (2013) showed that some H2O maser transitions (183.3, 325.1, and 380.1 GHz) could be inverted at relatively low gas densities, cm-3.
Methanol masers are divided into two classes: class I masers with a collisional pumping mechanism and class II masers with a radiative pumping mechanism. In star-forming regions class I CH3OH maser emission is generated in shocks – the regions of interaction of the protostellar flows with the surrounding interstellar medium, in expanding HII regions (Voronkov et al. 2014). Class I CH3OH masers are also observed in clouds of the central molecular zone of our Galaxy and near supernova remnants (Salii et al. 2002; Pihlström et al. 2014). Methanol is formed in dark molecular clouds on dust grains in CO hydrogenation reactions (Watanabe and Kouchi 2002). At the shock front methanol falls into the gas phase as a result of the sputtering of icy grain mantles. Methanol has no formation channels in the gas phase and, therefore, methanol maser emission is generated in nondissociative C-type shocks. If the gas temperature at the shock front is sufficiently high, K, then methanol is destroyed in collisional dissociation reactions (Nesterenok 2022). The preshock gas density cm-3 was shown in Nesterenok (2022) to be the most favorable condition for the emergence of an intense class I CH3OH maser emission (the gas density in the maser zone is several-fold higher than the preshock gas density due to gas compression in the shock). The pumping of CH3OH masers can also occur at higher gas densities (McEwen et al. 2014; Leurini et al. 2016). It was shown in Nesterenok (2022) that the optical depth for CH3OH transitions in a shock is small for preshock gas densities cm-3. At these preshock gas densities and at shock speeds when the sputtering of icy grain mantles occurs ( km s-1), the gas temperature at the shock front is K and there is a (partial) dissociation of methanol molecules. Thus, class I CH3OH masers and some H2O transitions have a pumping regime at relatively low gas densities.
This paper is a continuation of our study of maser pumping in shocks begun in Nesterenok (2020, 2021, 2022). The collisional pumping of OH masers at 1720 MHz in shocks near supernova remnants was considered in Nesterenok (2020). In Nesterenok (2021, 2022) we considered the pumping of class I CH3OH masers and studied the coexistence of CH3OH and OH masers in the same source. In this paper we investigate the collisional pumping of H2O masers in C-type shocks for preshock gas densities cm-3, and consider the coexistence of H2O and class I CH3OH masers in the same source.
C-type shock model
The model of a steady-state C-type shock propagating in a dense molecular cloud was developed in Nesterenok (2018) and Nesterenok et al. (2019). The numerical simulations consist of two parts: (1) the simulations of the chemical evolution of the dark molecular cloud and (2) the simulations of the shock propagation. At the start of the simulations of the cloud’s chemical evolution the H atoms are assumed to be bound into H2 molecules, while all of the remaining elements are in the atomic or ionized state (Nesterenok 2022). A detailed description of all the chemical processes that are taken into account in the numerical simulations and a description of the dynamics of the gas components in the shock (neutral gas, ions, electrons, and dust grains) are given in Nesterenok (2018). The chemical reactions that determine the methanol concentration are discussed in Nesterenok (2022).
As a starting point for the shock simulations we chose the age of the molecular cloud at which the methanol abundance relative to the hydrogen nuclei in the icy mantles of dust grains is 10-5. This age depends on the gas density and the cosmic-ray ionization rate. At the same time, the relative abundance of H2O molecules at slightly differs for different gas densities and gas ionization rates and is . According to the observational data, the relative abundance of H2O and CH3OH molecules in the icy mantles of dust grains in molecular clouds lies in the range and , respectively (Boogert et al. 2015). The relative CH3OH abundance adopted in our calculations corresponds to the upper limit of the observed values.
To estimate the preshock magnetic field, we used a power-law dependence of the magnetic field on gas density (Dudorov 1991; Crutcher et al. 2010):
| (1) |
where the values of the parameters are as follows: cm-3, G, , and the number density of hydrogen nuclei . According to the Zeeman molecular line splitting observations, the magnetic field in molecular clouds varies in a wide range, (Crutcher et al. 2010). In most of our calculations we use and the direction of the magnetic field is perpendicular to the shock velocity. The results of our shock model computations in which are also presented.
In cold molecular clouds the ortho-H2-to-para-H2 conversion time scale can be larger than the cloud evolution time, and the ortho-/para-H2 ratio has no time to reach its equilibrium value. The initial ortho-/para-H2 ratio was chosen to be 0.1 – some arbitrary low value. In our calculations we take into account the following processes through which the para-/ortho-H2 interconversion occurs: H2–H collisions, H2–H+ collisions, and H2 formation on dust grains (Nesterenok et al. 2019). When simulating the chemical evolution of a cold molecular cloud, the ortho-/para-H2 ratio changes slowly toward its equilibrium value. In this case, collisions with H+ are the main para-/ortho-H2 interconversion channel.
The cosmic-ray ionization rate in most of our calculations was set equal to s-1, corresponding to the gas ionization rate in cold molecular clouds away from the sources of ionizing radiation (Dalgarno 2006). We also present the results of our shock model computations in which the gas ionization rate was set equal to s-1. This value may be considered as a typical gas ionization rate in molecular clouds in the vicinity of supernova remnants and in clouds in the central molecular zone of our Galaxy (Shingledecker et al. 2016). The shock speeds varied from 5 km s-1 to the limiting C-type shock speed. The limiting speed is determined from the condition of almost complete H2 dissociation. The limiting speeds are approximately 70, 45, 30, and 30 km s-1 for the preshock gas densities , , , and cm-3, respectively (for the gas ionization rate s-1). Table 1 gives the parameters that were used in our numerical simulations of shocks.
| Table 1. Shock parameters | |
|---|---|
| Preshock gas density, | cm-3 |
| Shock speed, | km s-1 |
| Cosmic-ray ionization rate, | , s-1 |
| Initial ortho-H2/para-H2 ratio | 0.1 |
| Parameter characterizing the magnetic field strength, | 0.5, 1 |
| Turbulent velocity, | 0.3 km s-1 |
| Initial relative CH3OH abundance in the icy mantles of dust grains | |
| Initial relative H2O abundance in the icy mantles of dust grains | |
The parameter is defined in Eq. (1).
Calculation of molecular energy level populations
Collisional Rate Coefficients and Spectroscopic Data
The energies of rotational levels and the Einstein coefficients for the H2O molecule were taken from the HITRAN 2020 database (Gordon et al. 2022). In our calculations we took into account 150 rotational energy levels of the para-H2O molecule and 150 energy levels of the ortho-H2O molecule belonging to the ground and first excited vibrational states of the molecule. The energy of the highest H2O level considered is 4500 K. The collisional rate coefficients for transitions between H2O energy levels in collisions of H2O with H2 and electrons were calculated in Faure et al. (2007) and Faure and Josselin (2008). Four data sets for collisions between ortho-/para-H2O and ortho-/para-H2 for the gas temperature range K are given in Faure et al. (2007), with the transitions between 45 lower energy levels of each H2O spin isomer being considered. For the remaining transitions in our calculations we used data from Faure and Josselin (2008). In the calculations of these collisional rate coefficients the ortho-/para-H2 ratio was initially set equal to 3. The collisional rate coefficients for transitions between H2O levels in collisions of H2O with He atoms were taken from Green et al. (1993) and Nesterenok (2013). The collisional rate coefficients for H2O transitions in collisions with H atoms for 45 lower rotational H2O levels were taken from Daniel et al. (2015). The collisions of H2O with H atoms become significant when the shock speed is close to the limiting C-type shock speed and there is a partial dissociation of H2 molecules at the shock front. The abundance of electrons relative to the hydrogen nuclei in the molecular gas is for s-1 and cm-3, and decreases with increasing gas density. The collisions of H2O with electrons are insignificant.
The spectroscopic data and the data on the collisional rate coefficients that were used in our calculations of the CH3OH energy level populations are described in Nesterenok (2016). In our calculations we do not use the extrapolation of the collisional rate coefficients for high gas temperatures – the rate coefficients are assumed to be constant at temperatures above the maximum temperature for which data are available. The sensitivity of the results of our calculations of the CH3OH energy level populations to the collisional rate coefficients at high temperatures was analyzed in Nesterenok (2022). The spin-isomer abundance ratio was assumed to be the following: ortho-/para-H2O = 3 (Emprechtinger et al. 2013) and A-/E-CH3OH = 1 (Nesterenok 2022).
Basic Formulas
In this paper we use the same method of calculating the molecular level populations in a shock as that in Nesterenok (2020, 2022). Below, we briefly outline the ideas of the method. The shock profile obtained as a result of our numerical simulations is divided into layers. For each layer we calculate the H2O and CH3OH energy level populations. The system of equations for the energy level populations of a molecule at some distance in the shock is
| (2) |
Here, is the total number of energy levels, is the probability of radiative transitions from level to level , and is the probability of collisional transitions. The probabilities of radiative transitions are as follows:
| (3) |
where and are the Einstein coefficients for spontaneous and stimulated emission, respectively, and is the radiation intensity averaged over the direction and the line profile. To calculate the radiation intensity, we used the large velocity gradient method (Hummer and Rybicki 1985). This method gives a good approximation if the length scale of the change in physical parameters is much greater than the Sobolev length:
| (4) |
where is the gas velocity and is the line profile width in velocity units (Nesterenok 2020, 2022). The overlap between CH3OH and H2O lines was ignored since for the masers under consideration the line overlap has a minor effect on pumping (McEwen et al. 2014; Gray et al. 2016). The absorption of radiation in molecular lines by dust was taken into account (Hummer and Rybicki 1985; Nesterenok 2016). The dust temperature behind the shock front, where the pumping of masers occurs, is much lower than the gas temperature, . The maximum dust temperature is reached at the shock peak and is 65 K for the model with parameters cm-3 and km s-1. The dust radiation was ignored in our calculations of the radiation intensity in molecular lines. The system of equations (2) was solved by the iteration method.
Once the system of equations (2) for the molecular energy level populations had been solved, we calculated the gain for transitions with level population inversion. The expression for the gain (which is equal to the absorption coefficient with the opposite sign) for a transition in the case of a plane-parallel gas-dust cloud is
| (5) |
where is the cosine of the angle between the gas flow direction in the shock and the line of sight, is the number density of molecules (ortho- or para-H2O, A- or E-type CH3OH spin isomers) at distance in the shock, and are the statistical weights of the energy levels, and is the dust absorption coefficient. The spectral profile of the emission and absorption coefficients in the laboratory frame of reference is given by the expression
| (6) |
where is the transition frequency and is the normalized spectral profile in the frame of reference associated with the gas flow. For the ortho-H2O transition at 22.23 GHz it is necessary to take into account the additional line profile broadening due to the hyperfine splitting of energy levels (Varshalovich et al. 2006; Nesterenok and Varshalovich 2011). The spectral profile of the emission and absorption coefficients in this line is the sum of six components with different intensities. At a gas temperature K the components merge into a single asymmetric profile. For ortho-H2O transitions in the millimeter and submillimeter wavelength ranges the splitting is small compared to the Doppler line profile width.
The optical depth in the line for which there is level population inversion is
| (7) |
The parameter is equal to the ratio of the amplification path length along the line of sight to the shock width. If the shock is seen edge-on, then is large and the maser emission is most intense. In theoretical works is assumed to explain the emission of bright H2O masers (see, e.g., Kaufman and Neufeld 1996a). The optical depth increases with faster than due to the dependence of the spectral line profile on , see Eq. (6) (Nesterenok 2021). The maximum of (7) at fixed is reached at the line center.
For the brightness temperature in a maser line one can write
| (8) |
where is the background radiation temperature and is the absolute value of the optical depth in the maser line. As the radiation intensity in the maser line increases, the rate of induced transitions (the term proportional to in Eqs. (3)) becomes comparable to the rates of collisional and radiative transitions to other levels. In this case, the maser passes to the regime of saturation, and the exponential amplification law changes to a linear one (Strelnitskii 1975). In our paper we did not consider the maser amplification in the saturated regime.
Results
Physical Conditions in the Maser Formation Region
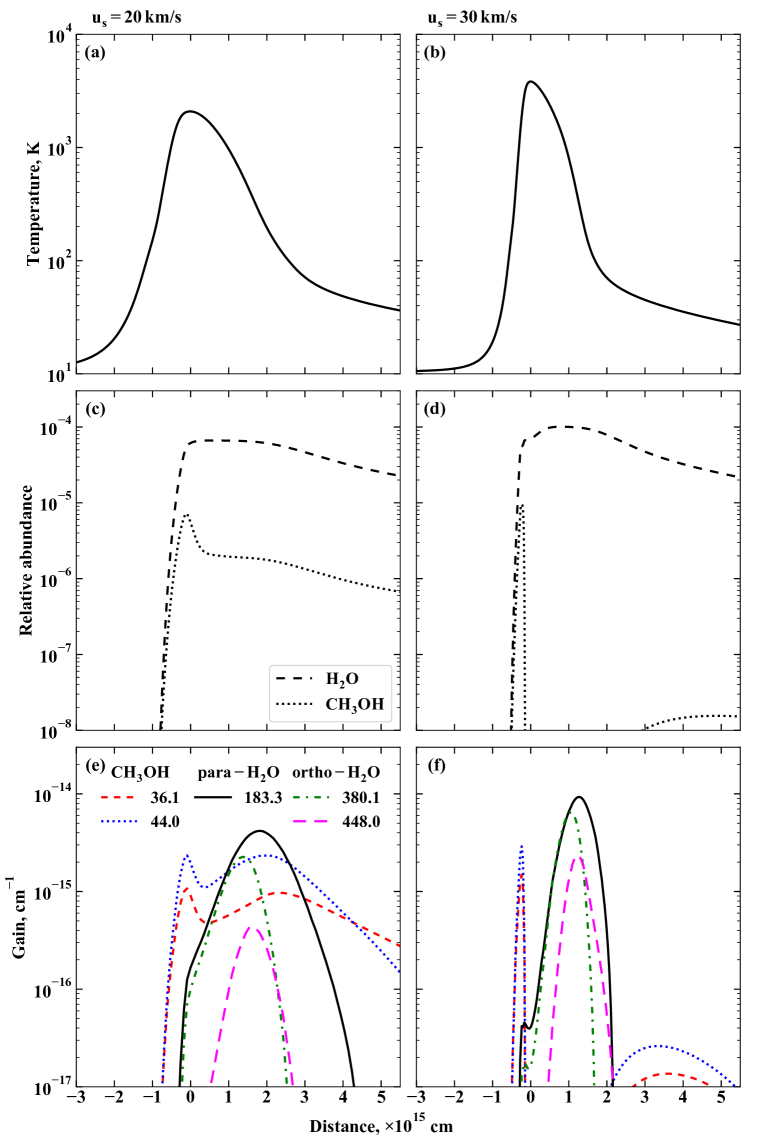
Figure 1 shows plots of the temperature, the relative abundance of H2O and CH3OH molecules, and the gain in maser lines as functions of the distance along the gas flow in the shock. The results are presented for two shock models with speeds and 30 km s-1. The preshock gas density for both shock models is cm-3. The gas temperature rises rapidly to its maximum value (2100 and 3800 K for and 30 km s-1, respectively). Subsequently, the gas temperature falls slowly as a result of the reduction in the gas heating rate and of the gas cooling through radiation in molecular lines. At the shock front the icy mantles of dust grains are sputtered, and a sharp rise in the relative abundance of H2O and CH3OH in the gas phase is observed. Behind the shock front the relative abundance of molecules in the gas falls slowly as a result of adsorption on dust grains. The time scale of this process is yr for cm-3 and K. In the hot gas at the shock front there is destruction of methanol molecules in reactions with H atoms and collisional dissociation reactions. For the shock speed km s-1 methanol is destroyed incompletely and the CH3OH-to-H2O ratio in the postshock region is 0.03. At a higher speed, km s-1, the methanol molecules are destroyed completely in the hot gas at the shock front. On the other hand, the higher the shock speed, the higher the relative H2O abundance in the cooling gas behind the shock front: the H2O column density from the shock peak to the region where the gas temperature drops below 30 K is and cm-2 for and 30 km s-1, respectively. This is because O and OH forming in reactions of molecules with H atoms and collisional dissociation reactions (the destruction of CH3OH, CO2, and other molecules) turn into H2O.
In Figs. 1e and 1f the gain is plotted against the distance for the methanol E 36.1 GHz and A+ 44.0 GHz lines, the para-H2O 183.3 GHz line, and the ortho-H2O 380.1 GHz and 448.0 GHz lines. The size of the shock region where the gain in the para-H2O line at 183.3 GHz drops by a factor of 2 from its maximum value is cm for the shock speed km s-1 and half as much for km s-1. Within this region the gas temperature drops by a factor of 10 (from K to 100 K), whereas the gas density increases by a factor of 2 (from to for km s-1) and the absolute value of the gas velocity gradient decreases by a factor of 5. The gas temperature is the parameter with the largest gradient and, therefore, the position of the gain peak for the maser transitions is determined mainly by the change in gas temperature. In the region where the gain in the 183.3 GHz line reaches its maximum, the gas temperature is K and the gas density is . Higher temperatures are needed for efficient pumping of the 380.1 GHz transition, and the 380.1 GHz maser emission region must be more compact. In the region where the gain in the 380.1 GHz line reaches its maximum the gas temperature is K. The population inversion in the 380.1 GHz line vanishes as soon as the gas temperature drops below 100 K. For the shock speed km s-1 there is energy level population inversion for the CH3OH 36.1 and 44.0 GHz transitions in the wide region from the shock front to the far postshock zone, where the gas temperature drops to 30 K.
The dust absorption coefficient at 183.3 GHz is cm-1 in the shock region, where the gain in the 183.3 GHz maser line is at a maximum (for cm-3). Thus, the dust absorption for the maser transitions is negligible.
Optical Depth in H2O and CH3OH Maser Lines
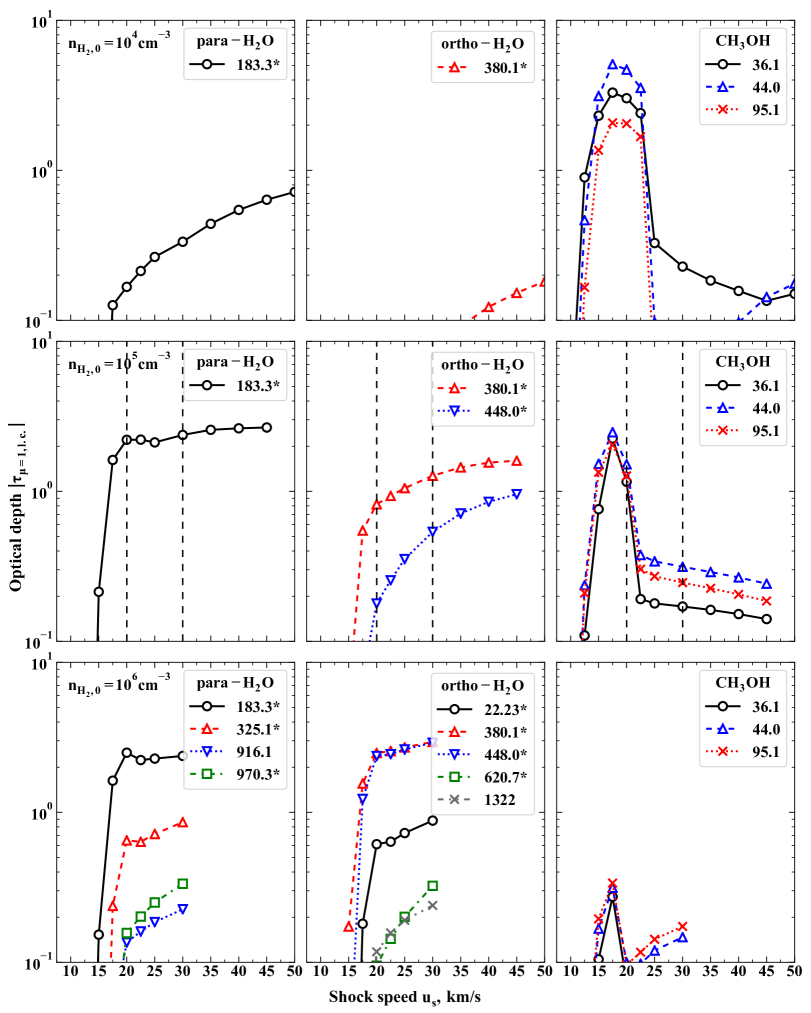
Figure 2 shows the results of our calculations of the optical depth at the line center along the gas flow for the H2O and CH3OH maser transitions. The calculations are presented for the preshock gas densities , , and cm-3. This figure shows all of the inverted H2O transitions for which, according to our calculations, the optical depth . According to our calculations, an optimal condition for the pumping of methanol masers is the gas density range cm-3. At such gas densities the optical depth for the para-H2O transition at 183.3 GHz and the ortho-H2O transitions at 380.1 and 448.0 GHz. At gas densities cm-3 the optical depth for the CH3OH maser transitions is small due to the destruction of methanol molecules in the hot dense gas at the shock front (Nesterenok 2022). At the same time, for many H2O transitions the optical depth at such a gas density.
Figure 3 shows the results of our calculations of the optical depth for the H2O maser transitions for the preshock gas density cm-3. In this case, there is energy level population inversion for a much larger number of H2O transitions than in the case of lower gas densities. The list of transitions is given in Table 2; all transitions belong to the ground vibrational H2O state. According to our calculations, the para-H2O 183.3, 325.1, and 970.3 GHz transitions and the ortho-H2O 22.23, 380.1, 448.0, 620.7, 1296, and 1322 GHz transitions have an optical depth at least in one of the shock models. If the shock is seen edge-on (), then these transitions are strong masers. The well-known ortho-H2O 321.2, and 439.1 GHz maser transitions have an optical depth (Fig. 3). In our calculations we obtained a small optical depth (or the absence of energy level population inversion) for the maser transitions of excited vibrational H2O states.
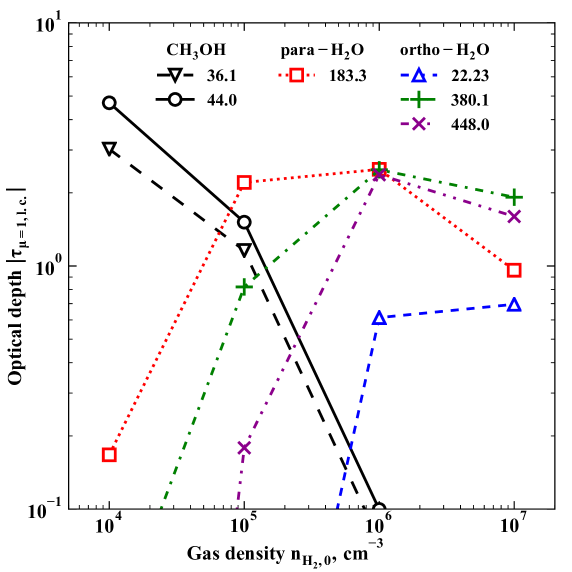
In Fig. 4 the optical depth for the H2O and CH3OH maser transitions is plotted against the preshock gas density , the shock speed in all calculations was set equal to km s-1. As the preshock gas density increases, the optical depth in the CH3OH lines decreases, while for the H2O transitions it increases. At gas densities cm-3 a coexistence of class I CH3OH masers and H2O 183.3 and 380.1 GHz masers is possible. The higher the preshock gas density, the narrower the shock front. The length of the postshock region at which the gain in the 183.3 GHz line drops by a factor of 2 from its maximum value is cm for cm-3 – an order of magnitude less than that for a preshock gas density of cm-3.
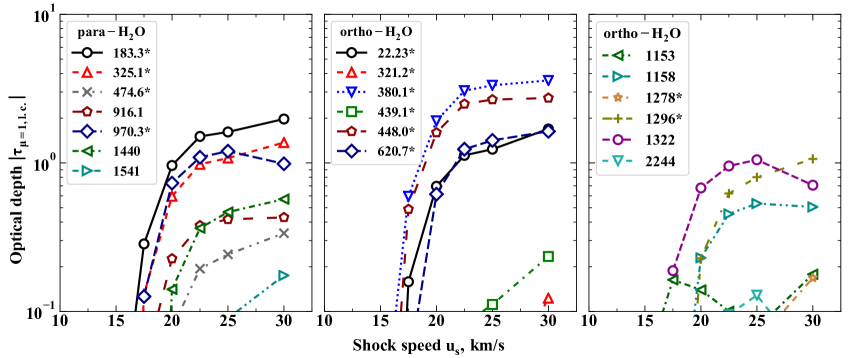
| Table 2. H2O transitions. | |||
|---|---|---|---|
| ortho-H2O | para-H2O | ||
| 22.23* | 183.3* | ||
| 321.2* | 325.1* | ||
| 380.1* | 474.6* | ||
| 439.1* | 916.1 | ||
| 448.0* | 970.3* | ||
| 620.7* | 1440 | ||
| 1153 | 1541 | ||
| 1158 | |||
| 1278* | |||
| 1296* | |||
| 1322 | |||
| 2244 | |||
The list of transitions for which the optical depth at least in one of the shock models for the preshock gas density cm-3. All transitions belong to the ground vibrational H2O state. The H2O transitions whose emission was observed in astrophysical objects are designated by an asterisk (Neufeld et al. 2017; Pereira-Santaella et al. 2017). The frequencies are given in GHz, ”truncated” values are used.
Effect of the ortho-/para-H2 Ratio on Maser Pumping
In the hot gas at the shock front H2–H collisions are the main para-H2/ortho-H2 interconversion mechanism. If the gas temperature and the number density of H atoms in the gas are sufficiently high, then the ortho-/para-H2 ratio has time to reach its equilibrium value determined by the gas temperature (Nesterenok 2019). For shock speeds less than some value of u0 the para-H2-to-ortho-H2 conversion in the heated gas at the shock front is inefficient. In this case, the main collisional partner of molecules in collisions is para-H2. The value of is and 20 km s-1 for the preshock gas densities and cm-3, respectively ( s-1). In particular, in a shock with parameters cm-3 and km s-1 the ortho-/para-H2 ratio increases from 0.02 to 0.5 as the gas passes through the shock front. We performed calculations in which the ortho-/para-H2 ratio was initially set equal to 3 in the shock model with these parameters. The difference of the results of our calculations for the optical depth in the para-H2O 183.3 GHz line is about 3%. This result is explained by the fact that the H2O–H2 collisional rate coefficients have a small difference for ortho- and para-H2 for gas temperatures above 300 K (Faure et al. 2007). For the CH3OH 36.1, 44.0, and 95.1 GHz transitions the optical depth is smaller by % for an ortho-/para-H2 ratio of 3. The influence of the ortho-/para-H2 ratio on the pumping of H2O masers is minor and significant for CH3OH masers.
Effect of the Gas Ionization Rate and the Magnetic Field Strength on the Generation of H2O and CH3OH Maser Emission
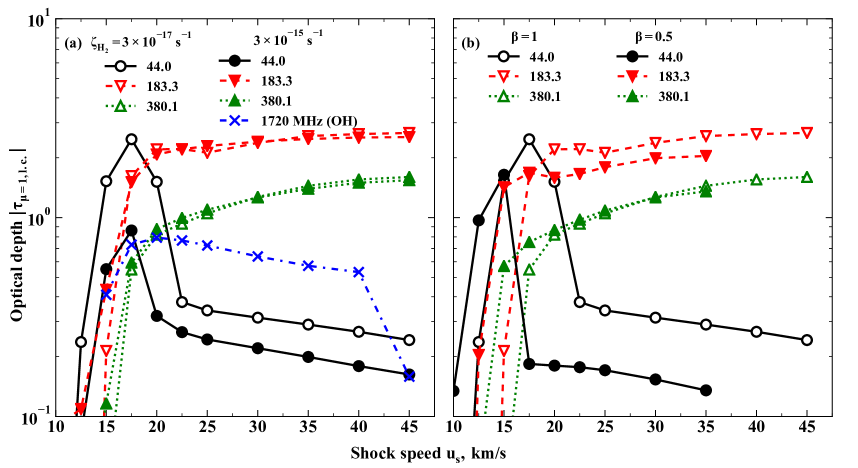
In Fig. 5 the optical depth is plotted against the shock speed for the H2O, CH3OH, and OH maser transitions; the preshock gas density is cm-3. Figure 5a presents the results of our calculations for two values of the cosmic-ray ionization rate: and s-1. The results of our calculations for the OH transition between the sublevels of the ground rotational state at 1720 MHz were taken from Nesterenok (2022). At high cosmic-ray ionization rates methanol is destroyed in the postshock region in ion–molecule reactions and reactions of photodissociation by cosmic-ray-induced ultraviolet radiation. The optical depths in the CH3OH maser transitions are considerably smaller at high values of the gas ionization rate than those at low ones (Fig. 5a) (see also Nesterenok (2022)). In contrast, the OH molecule is formed in H2O photodissociation reactions and ion–molecule reactions involving H3O+. High gas ionization rates, s-1, are needed for the existence of OH 1720 MHz maser emission. The fraction of the H2O molecules destroyed in the maser zone as a result of these reactions is % (for s-1). Therefore, the influence of the gas ionization rate on the optical depth for the H2O maser transitions is minor. Figure 5b presents the optical depths in the H2O and CH3OH maser lines for two values of the magnetic field ( and 1), while the gas ionization rate in both cases is s-1. The lower the value of the magnetic field, the narrower the shock front and the higher gas temperature at the shock front. As a result, the optical depths in the H2O and CH3OH lines are smaller in the case of a weaker magnetic field. The icy mantles of dust grains are sputtered at lower shock speeds. Therefore, the curve of the dependence of the optical depth on the shock speed is shifted leftward for (Fig. 5b).
Table 3 gives the brightness temperature of masers calculated from Eq. (8) for the shock parameters cm-3, km s-1, , and two values of the gas ionization rate, and s-1. The parameter was chosen to be 5 in these estimates (where is the cosine of the angle between the line of sight and the shock velocity direction). The background radiation temperature was set equal to K for CH3OH and H2O masers and K for an OH 1720 MHz maser (Hoffman et al. 2005). According to our estimates, the CH3OH masers pass to the saturation regime when the brightness temperature becomes K, while the para-H2O 183.3 GHz maser becomes saturated at K. The lower limits on the brightness temperature given in Table 3 are equal to the maximum brightness temperature of a maser in the unsaturated regime . In this case, the maser saturation should be taken into account in the brightness temperature calculations, which is beyond the scope of this study. Thus, for the gas ionization rate s-1, the preshock gas density cm-3, and the shock speed km s-1 a coexistence of class I CH3OH, H2O (183.3 GHz), and OH (1720 MHz) masers in one source is possible (provided that the shock velocity direction is perpendicular to the line of sight, ).
Table 3. Brightness temperature of OH, CH3OH, and H2O masers
Transition
s-1
s-1
1720 MHz (OH)
–
K
44.0 GHz (CH3OH)
K
K
36.1 GHz (CH3OH)
K
K
183.3 GHz (H2O)
K
K
The shock parameters are cm-3, km s-1, and ; the ratio of the maser amplification path length to the shock width is . The lower limit on the brightness temperature for CH3OH masers implies that the masers are saturated.
Discussion
Comparison with the Results of Previous Studies
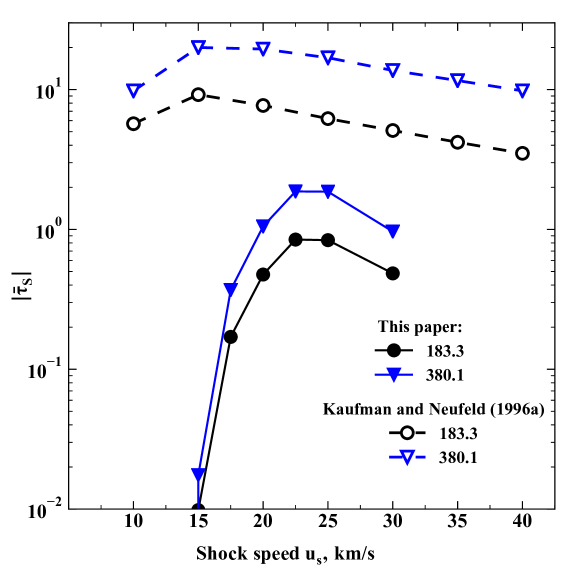
Kaufman and Neufeld (1996a) published a C-type shock model and studied the generation of H2O maser emission in shocks of this type. They considered preshock gas densities cm-3, but ignored the interaction of dust grains and gas (adsorption, desorption, the sputtering of icy grain mantles). The gas-phase O-to-H2O conversion reactions were the source of H2O in the gas in their model, whereas in our model H2O is formed on dust grains. At the shock front H2O ends up in the gas as a result of the sputtering of icy grain mantles; the gas-phase H2O formation reactions also make a contribution. Figure 6 shows the average Sobolev optical depth for the H2O 183.3 and 380.1 GHz maser transitions obtained in our calculations and in Kaufman and Neufeld (1996a) (see Fig. 8 in their paper). The results are presented for the preshock gas density cm-3 (for the determination of the Sobolev optical depth and the method of averaging this parameter in the maser zone, see Kaufman and Neufeld 1996a and 1996b). The relative H2O abundance in the postshock gas is in the model of Kaufman and Neufeld (1996a, 1996b). In our model the maximum relative H2O abundance in the cooling postshock gas is – a factor of 4 lower. In addition, according to our calculations, the width of the postshock region where the maser emission is generated is a factor of smaller than that in the model of Kaufman and Neufeld (1996a, 1996b). The lowest shock speed at which the icy mantles of dust grains are sputtered is km s-1 for cm-3 – this explains the absence of maser emission at low shock speeds in our model. At low shock speeds no evaporation of the icy mantles of dust grains due to grain heating occurs, since the dust temperature is not high enough in our shock model ( K for km s-1). However, this effect can take place for other dust model parameters or at a higher preshock gas density (Hartquist et al. 1995). At shock speeds km s-1 the dissociation of H2 molecules occurs at the shock front, and the shock becomes a J-type shock. These effects explain the difference between the results of our calculations and the results of Kaufman and Neufeld (1996a). Flower and Pineau des Forêts (2010) also studied the H2O excitation and emission in C-type shocks, but the results for inverted transitions were not discussed in their paper.
Cernicharo et al. (1994) performed numerical simulations of the pumping of para-H2O masers using the large velocity gradient method to solve the radiative transfer equation. They showed that there is level population inversion for the para-H2O 183.3 and 325.1 GHz transitions at relatively low temperatures and gas densities: K and cm-3. It also follows from our calculations that efficient pumping of para-H2O 183.3 GHz and ortho-H2O 380.1 and 448.0 GHz masers occurs at low gas densities: for the preshock gas density cm-3 (Fig. 2). There is energy level population inversion for the para-H2O 325.1 GHz transition for cm-3, but the optical depth is small, . High gas densities, cm-3 (Figs. 2 and 3), are needed for the generation of an intense ortho-H2O 22.23 GHz maser emission ().
Observations of H2O 183.3, 380.1, and 448.0 GHz Masers
Cernicharo et al. (1990, 1994) discovered a spatially distributed para-H2O 183.3 GHz maser emission in Orion A-IRc2 using observations with the IRAM telescope. The size of the region from where the emission comes is or pc, which is much larger than the sizes of the maser spots observed in the 22.23 GHz line in the same object, cm (Genzel et al. 1981). Doty (2000) used the model of a molecular core with a protostar at the center to study the excitation of the para-H2O 183.3 GHz maser line. Doty (2000) showed that a high relative H2O abundance, , much higher than the relative H2O abundance in the gas phase in the cold parts of molecular cores, (van Dishoeck et al. 2013), is needed to explain the observational data in Orion A-IRc2. This implies that the mechanisms of H2O liberation from the icy mantles of dust grains, such as shocks, need to be invoked.
The observations of the para-H2O 183.3 GHz emission were carried out toward the low-mass protostars HH7-11, L1448-mm, and Serpens SMM1 (Cernicharo et al. 1996; van Kempen et al. 2009). Cernicharo et al. (1996) published the observations of the para-H2O 183.3 GHz emission toward the group of Herbig-Haro objects HH7-11 performed with the IRAM telescope. The emission is generated in a vast region ( or pc) that spatially coincides with the flows near the close binary system SVS 13 visible in CO lines. The emission spectrum has a high-velocity component; the spatial emission peak of this component coincides with HH11. The variability of the radiation intensity points to the maser effect. The brightness temperature of the emission component is K. If the emission is assumed to be generated in compact sources whose sizes are much smaller than the telescope’s angular resolution ( or 0.02 pc), then the brightness temperature of the 183.3 GHz masers is K. The H2O masers at 22.23 GHz are located near SVS 13 within (Rodríguez et al. 2002).
Van Kempen et al. (2009) published the observations in the 183.3 GHz line toward the low-mass protostar Serpens SMM1 performed with SMA. The SMA beam sizes were , corresponding to a linear distance in the source AU (if the distance to the object is taken to be 440 pc; Ortiz-León et al. 2017). Three spatial emission components that coincide with the flow from the protostar and are at a distance of AU from it were detected in Serpens SMM1. The brightness temperature of the components lies in the range K, where it was assumed in the estimates that the emission fills completely the SMA beam. If the sizes of the 183.3 GHz emission region is assumed to be cm (corresponding to the shock model with the preshock gas density cm-3), then the brightness temperature in the maser line for the brightest component is K. Such brightness temperatures of the H2O 183.3 GHz maser are reproduced in a C-type shock model with parameters cm-3, km s-1, and . Moscadelli et al. (2006) observed H2O 22.23 GHz masers toward Serpens SMM1 with VLBA. The 22.23 GHz maser emission sources are located at a distance AU from the protostar (probably, inside an accretion disk), while the sizes of the maser spots are AU. Thus, the para-H2O 183.3 GHz masers, along with the class I CH3OH masers, are indicators of the gas flows interacting with the protostar envelope and the interstellar medium, whereas the H2O 22.23 GHz masers emerge in the immediate vicinity of protostars.
The generation of para-H2O 183.3 GHz and ortho-H2O 380.1 and 448.0 GHz maser emission is possible at lower gas densities than those for the ortho-H2O 22.23 GHz transition. The emission in these lines provides an additional possibility for diagnosing the physical conditions in astrophysical objects (for example, König et al. 2017). The ortho-H2O 380.1 and 448.0 GHz transitions cannot be observed with ground-based telescopes in astrophysical objects of our Galaxy due to absorption in the Earth’s atmosphere. However, these transitions can be observed toward galaxies in the local Universe and at cosmological distances, where the emission in these lines is shifted to a frequency range accessible to observation (Pereira-Santaella et al. 2017; Kuo et al. 2019; Yang et al. 2020). In particular, using the ALMA radio interferometer, Kuo et al. (2019) observed ortho-H2O 380.1 GHz emission toward the lensed quasar QSO MG J0414+0534 at redshift . The recorded emission may be a maser one in nature – according to the estimates by Kuo et al. (2019), the isotropic (unlensed) line luminosity is .
Absence of H2O 22.23 GHz Masers Associated with Supernova Remnants
Claussen et al. (1999) searched for H2O 22.23 GHz emission toward three supernova remnants in which the OH maser emission at 1720 MHz was known: W28, W44, and IC 443. Woodall and Gray (2007) searched for 22.23 GHz emission toward 18 supernova remnants (they also included supernova remnants where no OH emission was recorded in their sample). The 22.23 GHz emission was not detected in any of the sources. Using the C- and J-type shock models, Woodall and Gray (2007) performed numerical simulations of the pumping of H2O 22.23 GHz masers. The preshock gas density in their numerical simulations varied in the range cm-3 – the collisional pumping of OH masers at 1720 MHz is efficient precisely at these preshock gas densities. Woodall and Gray (2007) showed that there is no H2O 22.23 GHz maser emission at these gas densities. The same conclusions follow from our calculations – the optical depth in the 22.23 GHz line is for the preshock gas density cm-3. At the same time, the generation of para-H2O 183.3 GHz maser emission is possible for this preshock gas density (just as in the ortho-H2O 380.1 and 448.0 GHz lines, but these lines is difficult to observe in Galactic objects due to absorption in the Earth’s atmosphere). Note that OH 1720 MHz and CH3OH 36.1 and 44.0 GHz maser emission was observed near the supernova remnants W28 and W44 (Pihlström et al. 2014; McEwen et al. 2016).
Conclusions
We investigated the collisional pumping of H2O and CH3OH masers in C-type shocks. Within the models considered here we showed that the para-H2O 183.3 GHz and ortho-H2O 380.1 and 448.0 GHz transitions could be inverted at relatively low preshock gas densities, cm-3. The generation of H2O and CH3OH maser emission in the same postshock region is possible at these gas densities and shock velocities km s-1. We showed that the effect of the ortho-/para-H2 ratio on the pumping of H2O masers in a shock is minor and it is significant on the pumping of CH3OH masers. No H2O 22.23 GHz maser emission associated with supernova remnants has been detected previously. The relatively low gas densities in shocks in supernova remnants are most likely responsible for the absence of 22.23 GHz maser emission. According to our calculations, for preshock gas densities cm-3 the optical depth in the 22.23 GHz line along the gas flow in the shock is small, . Our numerical simulations suggest that para-H2O 183.3 GHz emission can be detected in those supernova remnant regions where the 1720 MHz OH and class I CH3OH maser emission is generated. The para-H2O 183.3 GHz maser emission provides an additional possibility to investigate the physical conditions in protostellar flows in star-forming regions and near supernova remnants.
For me it is a great honor to devote this paper to the memory of my teacher and scientific adviser, academician Dmitrii Aleksandrovic Varshalovich (1934–2020) of the Russian Academy of Sciences. Under his leadership I began to investigate the interstellar medium and cosmic masers. Dmitrii Aleksandrovic will always remain in memory as an outstanding scientist and a remarkable man.
References
1. A. C. A. Boogert, P. A. Gerakines, and D. C. B. Whittet, Ann. Rev. Astron. Astrophys. 53, 541 (2015).
2. J. Cernicharo, C. Thum, H. Hein, D. John, P. Garcia, and F. Mattioco, Astron. Astrophys. 231, L15 (1990).
3. J. Cernicharo, E. González-Alfonso, J. Alcolea, R. Bachiller, and D. John, Astrophys. J. 432, L59 (1994).
4. J. Cernicharo, R. Bachiller, and E. González-Alfonso, Astron. Astrophys. 305, L5 (1996).
5. J. Cernicharo, J. R. Pardo, E. González-Alfonso, E. Serabyn, T. G. Phillips, D. J. Benford, and D. Mehringer, Astrophys. J. 520, L131 (1999).
6. M. J. Claussen, W. M. Goss, and D. A. Frail, Astron. J. 117, 1387 (1999).
7. R. M. Crutcher, B. Wandelt, C. Heiles, E. Falgarone, and T. H. Troland, Astrophys. J. 725, 466 (2010).
8. A. Dalgarno, Proc. Natl. Acad. Sci. U. S. A. 103, 12269 (2006).
9. F. Daniel and J. Cernicharo, Astron. Astrophys. 553, A70 (2013).
10. F. Daniel, A. Faure, P. J. Dagdigian, M.-L. Dubernet, F. Lique, and G. Pineau des Forêts, Mon. Not. R. Astron. Soc. 446, 2312 (2015).
11. E. F. van Dishoeck, E. Herbst, and D. A. Neufeld, Chem. Rev. 113, 9043 (2013).
12. S. D. Doty, Astrophys. J. 535, 907 (2000).
13. B. T. Draine and C. F. McKee, Ann. Rev. Astron. Astrophys. 31, 373 (1993).
14. A. E. Dudorov, Sov. Astron. 35, 342 (1991).
15. M. Elitzur, D. J. Hollenbach, and C. F. McKee, Astrophys. J. 346, 983 (1989).
16. M. Emprechtinger, D. C. Lis, R. Rolffs, P. Schilke, R. R. Monje, C. Comito, C. Ceccarelli, D. A. Neufeld, et al., Astrophys. J. 765, 61 (2013).
17. A. Faure, N. Crimier, C. Ceccarelli, P. Valiron, L. Wiesenfeld, and M. L. Dubernet, Astron. Astrophys. 472, 1029 (2007).
18. A. Faure and E. Josselin, Astron. Astrophys. 492, 257 (2008).
19. D. R. Flower and G. Pineau des Forêts, Mon. Not. R. Astron. Soc. 406, 1745 (2010).
20. R. Genzel, M. J. Reid, J. M. Moran, and D. Downes, Astrophys. J. 244, 884 (1981).
21. I. E. Gordon, L. S. Rothman, R. J. Hargreaves, R. Hashemi, E. V. Karlovets, F. M. Skinner, E. K. Conway, C. Hill, et al., J. Quant. Spectrosc. Radiat. Transfer 277, 107949 (2022).
22. M. D. Gray, A. Baudry, A. M. S. Richards, E. M. L. Humphreys, A. M. Sobolev, and J. A. Yates, Mon. Not. R. Astron. Soc. 456, 374 (2016).
23. M. D. Gray, S. Etoka, A. M. S. Richards, and B. Pimpanuwat, Mon. Not. R. Astron. Soc. 513, 1354 (2022).
24. S. Green, S. Maluendes, and A. D. McLean, Astrophys. J. Suppl. Ser. 85, 181 (1993).
25. T. W. Hartquist, K. M. Menten, S. Lepp, and A. Dalgarno, Mon. Not. R. Astron. Soc. 272, 184 (1995).
26. I. M. Hoffman, W. M. Goss, C. L. Brogan, and M. J. Claussen, Astrophys. J. 627, 803 (2005).
27. D. Hollenbach, M. Elitzur, and C. F. McKee, Astrophys. J. 773, 70 (2013).
28. D. G. Hummer and G. B. Rybicki, Astrophys. J. 293, 258 (1985).
29. M. J. Kaufman and D. A. Neufeld, Astrophys. J. 456, 250 (1996a).
30. M. J. Kaufman and D. A. Neufeld, Astrophys. J. 456, 611 (1996b).
31. T. A. van Kempen, D. Wilner, and M. Gurwell, Astrophys. J. 706, L22 (2009).
32. S. König, S. Martín, S. Muller, J. Cernicharo, K. Sakamoto, L. K. Zschaechner, E. M. L. Humphreys, T. Mroczkowski, et al., Astron. Astrophys. 602, A42 (2017).
33. C.-Y. Kuo, S. H. Suyu, V. Impellizzeri, and J. A. Braatz, Publ. Astron. Soc. Jpn. 71, 57 (2019).
34. S. Leurini, K. M. Menten, and C. M. Walmsley, Astron. Astrophys. 592, A31 (2016).
35. B. C. McEwen, Y. M. Pihlström, and L. O. Sjouwerman, Astrophys. J. 793, 133 (2014).
36. B. C. McEwen, Y. M. Pihlström, and L. O. Sjouwerman, Astrophys. J. 826, 189 (2016).
37. L. Moscadelli, L. Testi, R. S. Furuya, C. Goddi, M. Claussen, Y. Kitamura, and A. Wootten, Astron. Astrophys. 446, 985 (2006).
38. A. V. Nesterenok, Astron. Lett. 39, 717 (2013).
39. A. V. Nesterenok, Mon. Not. R. Astron. Soc. 455, 3978 (2016).
40. A. V. Nesterenok, Astrophys. Space Sci. 363, 151 (2018).
41. A. V. Nesterenok, Astron. Lett. 46, 449 (2020).
42. A. V. Nesterenok, J. Phys.: Conf. Ser. 2103, 012012 (2021).
43. A. V. Nesterenok, Mon. Not. R. Astron. Soc. 509, 4555 (2022).
44. A. V. Nesterenok and D. A. Varshalovich, Astron. Lett. 37, 456 (2011).
45. A. V. Nesterenok, D. Bossion, Y. Scribano, and F. Lique, Mon. Not. R. Astron. Soc. 489, 4520 (2019).
46. D. A. Neufeld and G. J. Melnick, Astrophys. J. 368, 215 (1991).
47. D. A. Neufeld, G. J. Melnick, M. J. Kaufman, H. Wiesemeyer, R. Güsten, A. Kraus, K. M. Menten, O. Ricken, et al., Astrophys. J. 843, 94 (2017).
48. G. N. Ortiz-León, S. A. Dzib, M. A. Kounkel, L. Loinard, A. J. Mioduszewski, L. F. Rodríguez, R. M. Torres, G. Pech, et al., Astrophys. J. 834, 143 (2017).
49. M. Pereira-Santaella, E. González-Alfonso, A. Usero, S. García-Burillo, J. Martín-Pintado, L. Colina, A. Alonso-Herrero, S. Arribas, et al., Astron. Astrophys. 601, L3 (2017).
50. Y. M. Pihlström, L. O. Sjouwerman, D. A. Frail, M. J. Claussen, R. A. Mesler, and B. C. McEwen, Astron. J. 147, 73 (2014).
51. L. F. Rodríguez, G. Anglada, J. M. Torrelles, J. E. Mendoza-Torres, A. D. Haschick, and P. T. P. Ho, Astron. Astrophys. 389, 572 (2002).
52. S. V. Salii, A. M. Sobolev, and N. D. Kalinina, Astron. Rep. 46, 955 (2002).
53. C. N. Shingledecker, J. B. Bergner, R. Le Gal, K. I. Öberg, U. Hincelin, and E. Herbst, Astrophys. J. 830, 151 (2016).
54. V. S. Strelnitskii, Sov. Phys. Usp. 17, 507 (1975).
55. D. A. Varshalovich, A. V. Ivanchik, and N. S. Babkovskaya, Astron. Lett. 32, 29 (2006).
56. M. A. Voronkov, J. L. Caswell, S. P. Ellingsen, J. A. Green, and S. L. Breen, Mon. Not. R. Astron. Soc. 439, 2584 (2014).
57. N. Watanabe and A. Kouchi, Astrophys. J. 571, L173 (2002).
58. J. M. Woodall and M. D. Gray, Mon. Not. R. Astron. Soc. 378, L20 (2007).
59. C. Yang, E. González-Alfonso, A. Omont, M. Pereira-Santaella, J. Fischer, A. Beelen, and R. Gavazzi, Astron. Astrophys. 634, L3 (2020).
60. J. A. Yates, D. Field, and M. D. Gray, Mon. Not. R. Astron. Soc. 285, 303 (1997).
Translated by V. Astakhov