Some Practice for Improving the Search Results of E-commerce
Abstract.
In the Amazon KDD Cup 2022, we aim to apply natural language processing methods to improve the quality of search results that can significantly enhance user experience and engagement with search engines for e-commerce. We discuss our practical solution for this competition, ranking 6th in task one, 2nd in task two, and 2nd in task 3. The code is available at https://github.com/wufanyou/KDD-Cup-2022-Amazon.
1. Problem Description
The organizer provides a dataset called the Shopping Queries Dataset (Reddy et al., 2022). It is a large-scale, manually annotated dataset composed of challenging customer queries. The data is multilingual and includes English, Japanese, and Spanish queries. It comprises query-result pairs with annotated four classes of relevance (ESCI labels):
-
•
Exact (E): the item is relevant for the query and satisfies all the query specifications;
-
•
Substitute (S): the item is somewhat relevant: it fails to fulfill some aspects of the query, but the item can be used as a functional substitute;
-
•
Complement (C): the item does not fulfill the query but could be used in combination with an exact item;
-
•
Irrelevant (I): the item is irrelevant, or it fails to fulfill a central aspect of the query.
The primary objective of this competition is to build new ranking strategies and, simultaneously, identify interesting categories of results (i.e., substitutes) that can be used to improve the customer experience when searching for products. The three different tasks for this KDD Cup competition using our Shopping Queries Dataset are:
-
T1.
Query-Product Ranking
-
T2.
Multiclass Product Classification
-
T3.
Product Substitute Identification
Task one (T1) aims at ranking the relevance of a subset of the ESCI dataset by using Normalized Discounted Cumulative Gain (nDCG) score to measure the performance. The organizer designed a customized Discounted Cumulative Gain (DCG) of 1.0, 0.1, 0.01 and 0.0, for Exact, Substitute, Complement and Irrelevant respectively.
Task two (T2) aims to classify each product as being an Exact, Substitute, Complement, or Irrelevant match for the query. The Micro-F1 (equivalent to accuracy here) will be used to evaluate the methods. Task three (T3) is a binary classification problem that tries to distinguish whether a query product pair is a Substitute or not and uses the Micro-F1 score as well to measure the performance.
T1 uses a subset of ECSI dataset, while T2 and T3 use the same dataset. It is natural to treat this competition as two different problems. In the rest of the paper, we will use short-term T2T3 to represent tasks two and three. This inner difference among tasks is also reflected on the final leaderboard that the final ranking of T1 and T2T3 are not correlated well. The setup also involves a potential data leakage, which we will discuss further in section 2.
2. Explore Data Analysis
ECSI dataset contains three tables, which are
product_catalogue, train and test. The test is also decomposed into public and private where the latter one is unseen to us. In this section, we make our special observation of product_catalogue and train that play an important role in the final leaderboard.
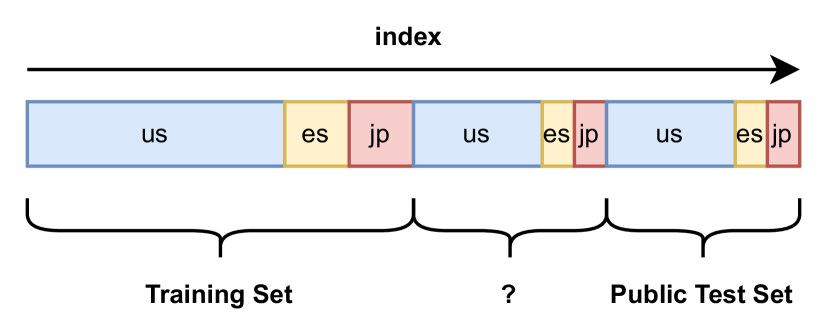
T1 and T2T3 use different product_catalogue tables. Figure 2 shows the order of product entries in T2T3. T1 remains a similar pattern unless it is started with es entries (es us jp). There is a part of products that have not been used in the both training set and the public test set, and we conjecture those entries are unique in the private test set.
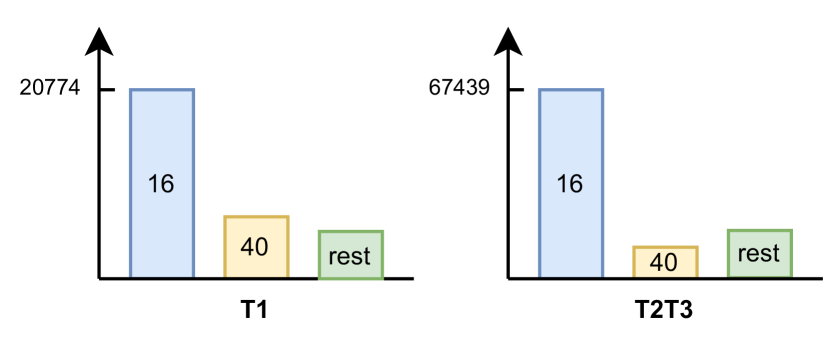
Let us have another investigation about train. Figure 3 shows the histogram of products grouped by queries in T1 and T2T3. Generally, most queries will sample 16 and 40 products for training and test sets. And this distribution is slightly different between T1 and T2T3, while we know that there are fewer Exact labels in T1. So associated with this prior knowledge, using this product number as a feature to calibrate the prediction will make some improvement in the leaderboard.
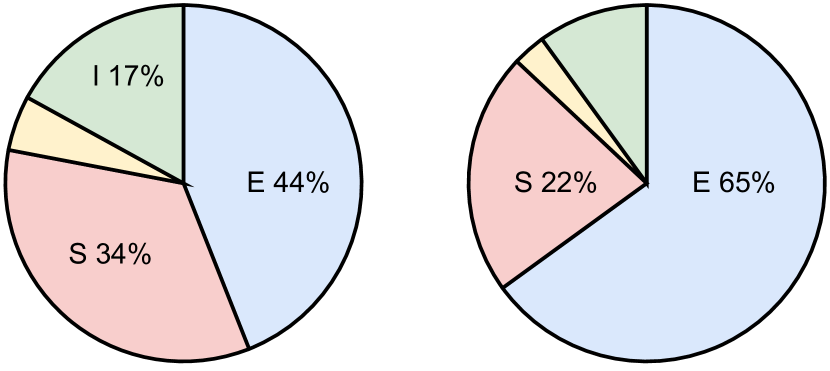
Another important piece of information in the training set is that the proportion of ESCI labels in T1 and T2T3 are different (Figure 4). This difference creates a well-known data leakage for most participants in T2T3 that distinguishing whether a query-product pair is in T1 will improve results. However, it isn’t easy to use this information directly in the private test set.
Besides the above-described deep dive, some other patterns will help to improve the scores. Here is the summary of that information:
-
E1.
The order of the product catalog is not randomized (training set private test set public test set).
-
E2.
Most products are used once.
-
E3.
The ESCI label proportion is different between T1 and T2T3.
-
E4.
Most queries have 16 or 40 product numbers and the label distribution of those queries are slightly different.
-
E5.
The product id is called ASIN and will be identical to ISBN (starts with digits) if the product has ISBN.
-
E6.
Most query products group has fewer unique brand numbers than product numbers and the product with the most frequent brand tends to be labeled as Exact.
-
E7.
At least one product in a query-products group will be labeled as Exact, and the label of the query-product pair is affected by other labels in this group as well.
Combining those explorations, we could significantly improve scores for all three tasks. A detailed feature engineering will be introduced in Section 3.2.
3. Proposed Solution
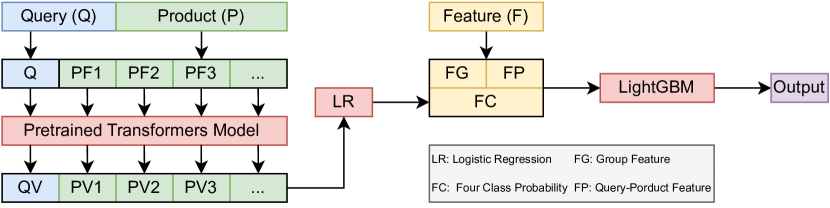
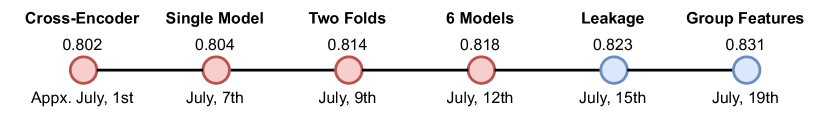
Figure 1 shows the general schema of our proposed solution for Amazon KDD CUP 2022 for all three tasks. As we planned to attend to all three tasks, for efficiency, we have to train the cross-encoders once and use them for all three tasks. This strategy makes this two-stage solution the only choice. So we trained all cross-encoders with all data from T1 and T2T3 in two folds and then combined the four class probabilities with other essential features, using lightGBM to fuse and calibrate the prediction and adapt results to different tasks. Figure 5 shows the milestone of the public leaderboard score for T2. In the following, we will discuss those milestones in detail.
3.1. Cross-Encoder Architecture
In the first stage, we applied the classical cross encoder (Reimers and Gurevych, 2019) architecture with only minor modifications. As the product context has multiple fields (title, brand, and so on), we use neither the CLS token nor mean (max) pooling to get the latent vector of the query-product pair. Instead, we concatenate the hidden states of a predefined token (query, title, brand color, etc.). This small modification yields about a 0.002 increase in the T2 public leaderboard (0.802 0.804).
In the final solution, we ensembled three cross-encoders for each language that differ from pre-trained models, the training data, or the input fields. For Engish entries, we used DeBERTaV3 (He et al., 2021), BigBird (Zaheer et al., 2020) and COCO-LM (Meng et al., 2021). While for Japanese and Spanish ones, we used a multi-language version of DeBERTaV3. All those pre-trained data could be found at Huggerface. Table 1 shows the average accuracy for each model for T2. By ensemble of all models, the score for the public leaderboard for task two is 0.818.
| Locale | Pretrained Model | Accuracy |
|---|---|---|
| us | bigbird-roberta-base | 0.7587 |
| cocolm-base | 0.7588 | |
| debertav3-base | 0.7585 | |
| es | mdeberta-v3-base | 0.7347 |
| jp | mdeberta-v3-base | 0.7006 |
3.2. Feature Engineering
Once stacking a lot of models has tiny improvements for both local and online tests, we start to do some feature engineering based on our exploration in section 2.
3.2.1. Leakage Features
Combining E1, E2, and E3 together, we designed a feature that measures the percentage of product_id in Task 1 product list grouped by query_id. This feature gives us a 0.005 improvement in the T2 public leaderboard and remains effective for the private test set, and that’s why we are extremely closed to first place in T2 (0.0001 difference).
3.2.2. Query product number features
Based on E4, we use the product number for each query as a feature and obtain an approximate 0.002 improvement in the T2 public leaderboard.
3.2.3. Product ID features
Based on E5, we designed features that measure whether the product_id is ISBN or not and whether the query-products group has an ISBN product or not. This feature gives us an approximate 0.001 improvement in the T2 public leaderboard.
3.2.4. Brand Features
Based on E6, we designed features that measure the unique number of brands in a query-products group and whether the brand of the product is the most frequent one in the group. This feature gives us an approximate 0.001 improvement in the T2 public leaderboard.
3.2.5. Group Features
Based on E7, we designed several stats (min, medium, and max) of the cross encoder output probability grouped by query_id. This feature gives us a 0.008 improvement in the T2 public leaderboard.
3.3. LightGBM model
3.3.1. T1
As the ECSI label distribution is different in T1 and T2T3, for T1, we train the lightGBM model with T1 data only to simulate this distribution and calculate the expected gain for each query-product pair as:
| (1) |
where , and are the probability output of lightGBM for label Exact, Substitute and Irrelevant respectively. Then we sort the query-product list by this gain. This method is slightly better than using LambdaRank (Burges et al., 2006) with the same label gain (0,0.01,0.1,1) in LightGBM.
3.3.2. T2T3
We use full data from T1 and T2T3, and use lightGBM to train either a four-class classifier (T2) or a binary classifier (T3).
3.3.3. Model ensemble
For T1, T2, and T3, we average the gain or the prediction from 6 models (3 models x 2 folds) for each language to make a final decision.
4. Inference Acceleration
During the code submission round, the organizer proposed a 120 minutes time limit for all three tasks. This time limit requests us to provide a more efficient solution.
4.1. Knowledge Distillation
We use knowledge distillation (Hinton et al., 2015) to improve the model’s performance. This knowledge distillation is applied to English entries only. We used all data and trained large versions of DeBERTaV3, BigBird, and COCO-LM. Then we used a linear combination loss of cross-entropy (loss between prediction and ground truth) and mean-square-error (logit difference between student model and teacher model).
4.2. Other Inference Acceleration Strategies
Here are we listed some other inference acceleration strategies:
-
A1.
Pre-process product token and save it as an HDF5 file.
-
A2.
Transfer all models to ONNX with FP16 precision.
-
A3.
Pre-sort the product id to reduce the side impact of batch zero padding.
-
A4.
Use a relatively small mini-batch size () when inference.
References
- (1)
- Burges et al. (2006) Christopher Burges, Robert Ragno, and Quoc Le. 2006. Learning to rank with nonsmooth cost functions. Advances in neural information processing systems 19 (2006).
- He et al. (2021) Pengcheng He, Jianfeng Gao, and Weizhu Chen. 2021. Debertav3: Improving deberta using electra-style pre-training with gradient-disentangled embedding sharing. arXiv preprint arXiv:2111.09543 (2021).
- Hinton et al. (2015) Geoffrey Hinton, Oriol Vinyals, Jeff Dean, et al. 2015. Distilling the knowledge in a neural network. arXiv preprint arXiv:1503.02531 2, 7 (2015).
- Meng et al. (2021) Yu Meng, Chenyan Xiong, Payal Bajaj, Paul Bennett, Jiawei Han, Xia Song, et al. 2021. Coco-lm: Correcting and contrasting text sequences for language model pretraining. Advances in Neural Information Processing Systems 34 (2021), 23102–23114.
- Reddy et al. (2022) Chandan K. Reddy, Lluís Màrquez, Fran Valero, Nikhil Rao, Hugo Zaragoza, Sambaran Bandyopadhyay, Arnab Biswas, Anlu Xing, and Karthik Subbian. 2022. Shopping Queries Dataset: A Large-Scale ESCI Benchmark for Improving Product Search. arXiv:2206.06588
- Reimers and Gurevych (2019) Nils Reimers and Iryna Gurevych. 2019. Sentence-bert: Sentence embeddings using siamese bert-networks. arXiv preprint arXiv:1908.10084 (2019).
- Zaheer et al. (2020) Manzil Zaheer, Guru Guruganesh, Kumar Avinava Dubey, Joshua Ainslie, Chris Alberti, Santiago Ontanon, Philip Pham, Anirudh Ravula, Qifan Wang, Li Yang, et al. 2020. Big bird: Transformers for longer sequences. Advances in Neural Information Processing Systems 33 (2020), 17283–17297.