Six-center Assessment of CNN-Transformer with Belief Matching Loss for Patient-independent Seizure Detection in EEG
Abstract
Neurologists typically identify epileptic seizures from electroencephalograms (EEGs) by visual inspection. This process is often time-consuming, especially for EEG recordings that last hours or days. To expedite the process, a reliable, automated, and patient-independent seizure detector is essential. However, developing a patient-independent seizure detector is challenging as seizures exhibit diverse characteristics across patients and recording devices. In this study, we propose a patient-independent seizure detector to automatically detect seizures in both scalp EEG and intracranial EEG (iEEG). First, we deploy a convolutional neural network with transformers and belief matching loss to detect seizures in single-channel EEG segments. Next, we extract regional features from the channel-level outputs to detect seizures in multi-channel EEG segments. At last, we apply postprocessing filters to the segment-level outputs to determine seizures’ start and end points in multi-channel EEGs. Finally, we introduce the minimum overlap evaluation scoring as an evaluation metric that accounts for minimum overlap between the detection and seizure, improving upon existing assessment metrics. We trained the seizure detector on the Temple University Hospital Seizure (TUH-SZ) dataset and evaluated it on five independent EEG datasets. We evaluate the systems with the following metrics: sensitivity (SEN), precision (PRE), and average and median false positive rate per hour (aFPR/h and mFPR/h). Across four adult scalp EEG and iEEG datasets, we obtained SEN of 0.617-1.00, PRE of 0.534-1.00, aFPR/h of 0.425-2.002, and mFPR/h of 0-1.003. The proposed seizure detector can detect seizures in adult EEGs and takes less than 15s for a 30 minutes EEG. Hence, this system could aid clinicians in reliably identifying seizures expeditiously, allocating more time for devising proper treatment.
keywords:
Transformer; Belief Matching; Electroencephalogram; Patient-independent Seizure Detection.1 Introduction
Epilepsy is a brain disorder characterized by the manifestations of sudden unprovoked seizures [1]. Seizures are diverse and vary significantly across patients in etiology, severity, and symptoms [2]. Most electrographic seizures last from 30 seconds to two minutes, where a seizure lasting longer than five minutes is a medical emergency [3]. Epilepsy is diagnosed when a patient experiences two or more recurring seizures [4]. Around 1% of the world population is diagnosed with epilepsy [5]. Moreover, approximately 10% of the population will experience a seizure within their lifetime [6]. Overall, provoked and unprovoked seizures occur in about 3.5 and 4.2 per 10000 individuals annually, respectively [5]. After a seizure episode, the likelihood of encountering another seizure event increases to about 50%, bringing the individual to a much greater risk of relapsing [7].
To detect seizures, an electroencephalogram (EEG) can be utilized to measure the electrical activity in the brain [5]. Scalp EEG records the brain activity with surface electrodes, while intracranial EEG (iEEG) measures the signals directly via implanted electrodes [8]. However, visual inspection of EEGs can be time-consuming [9]. There is a need for automated detectors that can detect seizures reliably and quickly. Most progress has been made toward patient-specific detectors, as seizure morphologies vary across patients. Consequently, designing a seizure detector that can detect seizures in any patient can be challenging but tremendously helpful for clinicians.
In recent studies on automated seizure detection from EEG, the detectors are validated mainly on two public seizure datasets: the Temple University Hospital seizure (TUH-SZ) dataset [10, 11, 12] and the Children’s Hospital Boston Massachusetts Institute of Technology (CHB-MIT) dataset [13, 14, 15, 11]. In many studies, different models are proposed, including wavelet analysis [16, 17, 18], machine learning models [19], convolutional neural networks (CNNs) [13, 10, 15, 12, 20], recurrent neural networks (RNNs) [10], long short-term memory (LSTM) [21], transformer [22], transfer learning [23, 24, 25, 26], quickest detection [27], and temporal graph convolutional networks (TGCNs) [28].
The seizure detectors proposed in these studies are similar in architecture and/or implementation. The detectors first divide the EEGs into short multi-channel segments (segment-level), before classifying each segment as normal against seizure. Then, using the segment-level outputs, they determine the start and end points of the seizures in full EEGs. The main innovation in these studies lies in the design of the segment-level detector, where most studies propose increasingly deep and complex neural networks with millions of parameters [22, 28].
Unfortunately, computationally intensive models may not necessarily improve patient-independent seizure detection due to the associated increased risk of overfitting [29, 28]. To resolve the bottleneck, we require a fresh perspective on this problem. As we will explain in the following, we address certain drawbacks of existing seizure detectors and resolve some of their weaknesses in this study.
First, most modern seizure detectors identify seizures at the segment-level directly. Since these detectors are trained on multi-channel EEG segments, they can only handle a fixed number of EEG electrodes (e.g., 21). To apply those models to EEGs with a different number of electrodes (e.g., 32), the models need to be retrained. In practice, the number of electrodes may vary, and this limitation is a severe impediment to clinical applications.
To overcome this, we proposed a seizure detector that starts by detecting seizures in single-channel segments (channel-level detection). We evaluate three variations of CNN for the channel-level detector: CNN with softmax loss (CNN-SM), CNN with belief matching (BM) loss (CNN-BM), and a CNN cascaded with a transformer and BM loss (CNN-TRF-BM). The BM loss is used to improve confidence performance, making the distribution of the probability predicted similar to the actual distribution of probability observed in training data. Meanwhile, the transformer is deployed to extract long-range patterns across the signals via self-attention, which the CNNs cannot. Several existing studies have proposed detectors that detect seizures at the channel-level [30, 31, 32]. However, some of these also analyzed single-channel EEGs instead of multi-channel EEGs [30]. Consequently, there is no segment-level detection, making them unsuitable for detecting seizures in multi-channels EEGs.
To resolve the restriction on the fixed number of channels, we aggregate the channel-level outputs and group them into five distinct brain regions. Then, we compute statistical features from each region, which can be done for an arbitrary number of electrodes. This approach allows us to apply the detectors to EEGs with any number of electrodes and both scalp EEG and iEEGs. In this study, we trained the proposed seizure detector on a large scalp EEG dataset (TUH-SZ dataset) and evaluated it on five independent scalp EEG and iEEG datasets. In comparison, existing seizure detectors for scalp EEGs and iEEGs are often trained and analyzed separately [22].
Finally, a good evaluation metric to measure the effectiveness of seizure detectors is necessary. Such metrics score a detection from the automated system based on how much it overlaps with a manually annotated seizure(s). Unfortunately, most studies use different evaluation approaches to assess the detectors, making comparison studies challenging. Several evaluation metrics have been proposed, including epoch-based sampling (EBS), any-overlap (OVLP), time-aligned event scoring (TAES) [33], and increased margin scoring (IMS) [34]. However, these metrics do not reflect real-world clinical requirements.
For instance, Reus et al. and Koren et al. only reported IMS, which consider a detection correct as long as the detection is within 30s and 120s before the start or after the end of the seizure, respectively. Allowing this significant error margin could lead to huge uncertainty and low precision during detection. Meanwhile, Fürbass [13] determine that a seizure is detected as long as a detection appears within a seizure event. These approaches ignored the amount of overlap required, making their measurement approach extremely lenient. Either way, it is inappropriate in clinical practice.
Therefore, we introduce the minimum overlap evaluation scoring (MOES), which requires the detection from the automated system to have a minimum overlap duration of 10s and a minimum overlap of 30% with a ground truth seizure for it to be considered correct. In contrast, OVLP and TAES require a non-zero (e.g., 0.1%) and perfect (100%) overlap, respectively, which tends to under- or over-penalize the detector. By requiring a non-trivial overlap, albeit not necessarily a perfect overlap, the MOES metric has an adequate tolerance for clinical practice.
In summary, this paper performs the following:
-
1.
We developed a patient-independent seizure detector that can be applied to scalp EEG and iEEG, regardless of the number of electrodes.
-
2.
We utilize a BM loss to improve the calibration performance, which is critical for decision-making. However, such approaches are rarely applied in EEG analysis, as most studies favour softmax (SM) loss. Unfortunately, many existing classification algorithms are not optimized for obtaining accurate probabilities, and their predictions may be miscalibrated.
-
3.
We apply CNN with transformers as a transformer can extract long-range patterns, which a CNN cannot. Transformers had been explored for seizure detection (see [22]) but have yet to apply at the channel-level.
-
4.
We train the proposed detector on one scalp EEG dataset and test it on five independent scalp EEG and iEEG datasets. Seizure detectors are usually not assessed simultaneously on multiple datasets and not on scalp EEGs and iEEGs.
-
5.
We introduce the minimum overlap evaluation scoring (MOES) to assess the performance of seizure detectors. In contrast to existing metrics, the MOES metric requires a non-trivial but not necessarily perfect overlap between the detection and ground truth seizure(s) for the detection to be considered correct. Existing metrics are too lenient or strict on the overlap criteria, resulting in inaccurate results.
2 Materials and Methods
2.1 Dataset
We analyze six public EEG datasets in this study:
-
1.
Temple University Hospital Seizure (TUH-SZ) dataset [35]
-
2.
Children’s Hospital Boston Massachusetts Institute of Technology (CHB-MIT) dataset [36]
-
3.
Helsinki University Hospital (HUH) dataset [37]
-
4.
Sleep Wake Epilepsy Center at ETH Zurich (SWEC-ETHZ) dataset [38]
-
5.
International Epilepsy Electrophysiology Portal (IEEGP) dataset [39]
-
6.
Epilepsy iEEG Multicenter (EIM) dataset [40]
Information on the six scalp EEG and iEEG datasets analyzed in the study. Information Details TUH-SZ CHB-MIT HUH SWEC-ETHZ IEEGP EIM EEG Details Patient Type Human Human Human Human Human/Dog Human Patient Age Group Adult Paediatric Neonatal Adult Adult Adult EEG Type scalp EEG scalp EEG scalp EEG iEEG iEEG iEEG (Hz) 250-1000 256 256 512 400-5000 250-1000 Channel Name Available Available Available Unavailable Unavailable Unavailable Channel-level Annotation Yes No No No No No Seizure Label, Type Yes, 8 No No No No No No of Channels 19,21 23,24,26 21 36-100 16-72 53-216 Number of Patients and EEGs Patients 637 24 75 16 12 31 All EEGs 5,610 683 75 100 12 102 Non-Seizure EEGs 4,450 545 22 0 0 0 Seizure EEGs 1,150 138 54 100 12 102 Seizure Events 3,050 185 517 100 12 102 Duration All EEGs (in hours) 922 980 114 13.5 7.20 7.96 Non-SZ EEGs (in hours) 681 792 35.0 0 0 0 SZ EEGs (in hours) 242 188 78.6 13.5 7.20 7.96 Average (All) (in minutes) 9.84 86.1 89.64 8.1 36 4.68 Average SZ (in seconds) 54.3 54.4 90.5 95.9 37.3 103.7
Information about the six datasets is summarized in Table 2.1. The TUH-SZ dataset is the largest among those six datasets, with the most annotated seizure events. Hence, we utilized the TUH-SZ dataset as the primary source to train the entire seizure detector pipeline.
Firstly, the seizure detector is trained and evaluated with the TUH-SZ dataset via 4-fold cross-validation (CV). We assign approximately the same number of patients and seizures to each fold. Next, using the trained detector, we further assess it on five other independent EEG datasets. In this way, we examine the generalizability of the detector on different EEG datasets with different EEG types and patient age groups.
For all the EEGs, a order Butterworth notch filter at 60Hz (USA) and 50Hz (EU) is applied to remove electrical interference [41]. Next, a 1Hz high-pass filter ( order) is implemented to reject DC shifts and baseline fluctuations [42]. Finally, all the EEGs are downsampled to a sampling frequency of 128Hz. At last, we convert all scalp EEGs to bipolar montage, as the TUH-SZ dataset is annotated in the bipolar montage. As the montage for the iEEGs is incompatible with the bipolar montage, we keep the montage of the iEEGs at monopolar.
![[Uncaptioned image]](/html/2208.00025/assets/x1.png)
The three EEG scales: channel-, segment-, and EEG-level detection.
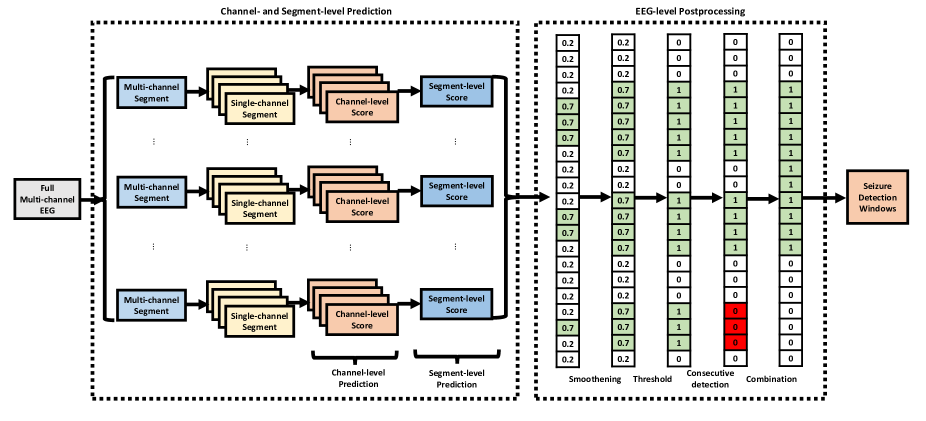
2.2 Seizure Detector Pipeline
We perform seizure detection first at individual channels (channel-level detection), followed by multi-channel segments (segment-level detection). At last, we detect the start and end points of the seizures in the entire multi-channel EEG (EEG-level detection) [43, 41, 42] (see Figure 2.1). The proposed seizure detector is displayed in Figure 1. The pipeline consists of a channel-level deep learning classifier, a segment-level machine learning classifier, and multiple EEG-level post-processing modules. The seizure detectors are implemented on NVIDIA GeForce GTX1080 GPUs in Keras 2.2.0 and TensorFlow 2.6.0.
2.3 Channel-level Seizure Detector
The channel-level seizure detector computes the seizure probability for single-channel EEG segments. The window length adopted in the literature ranges between 1s to 30s. However, is too short to capture long-range seizure morphology, while is too long to capture short seizures. Therefore, we tested window lengths seconds. In this study, we deploy three channel-level seizure detectors based on convolutional neural networks (CNN):
-
1.
CNN with softmax (SM) loss: CNN-SM
-
2.
CNN with belief matching (BM) loss: CNN-BM
-
3.
CNN-transformer with BM loss: CNN-TRF-BM.
2.3.1 CNN-SM Model
The CNN-SM model is a CNN with a SM loss function. The input is the raw single-channel signal of length . The architecture contains five convolutional layers with 8, 16, 32, 64, and 128 filters, respectively, with two fully connected layers. To minimize the loss, we applied the Adam optimizer with an initial learning rate equal to . The batch size during training is set to 1000. Also, we implemented class weights that are inversely proportional to the class frequency in the training data during training. This allows us to optimize the loss function on an imbalanced dataset without overfitting [43]. Finally, we optimized parameters within the CNN via nested CV on the training data, with an 80:20% split for training and validation.
2.3.2 CNN-BM Model
The CNN-BM model has the same architecture as the CNN-SM model, except that the BM loss replaces the SM loss. The BM loss is shown to yield better uncertainty estimates and generalization performance than the SM loss, an important property required for seizure detection [44]. The BM framework is formulated from a Bayesian perspective that views binary classification as distribution matching. The BM loss is defined as:
| (1) |
where and is the -th training data and its label, respectively, is the total number of samples, and , where W are the weights of the neural network classifier. is the evidence lower bound (ELBO) [44] and is defined as , where z is the categorical probability about the label, is the target distribution, is the approximate distribution, and KL is the KL-divergence. We refer to [44] for more information on the BM loss.
2.3.3 CNN-TRF-BM Model
The CNN-TRF-BM model contains the CNN and the transformer. The architecture is the same as in the CNN-BM model, but we insert an additional transformer encoder between the final convolutional layer and the flattening layer (see [45]). We implemented a transformer in tandem with the CNN, as the CNN alone cannot model correlations between distant data points, such as seizure morphologies (see Figure 2(a) and (b)). The transformer can compensate for this limitation by extracting long-range information from the CNN features. The transformer encoder contains eight heads, and the number of hidden layer neurons in the forward feed network (FFN) is 1024. As input to the transformer, we extract 1s segments with 25% overlap from the -second single-channel segment.
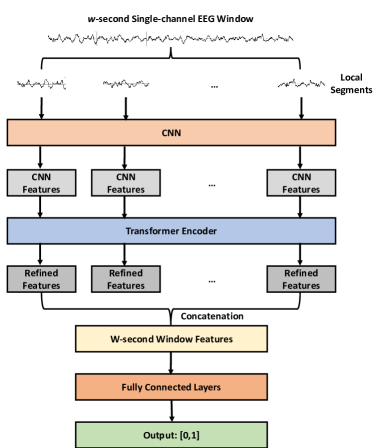
(a) CNN with transformer encoder.
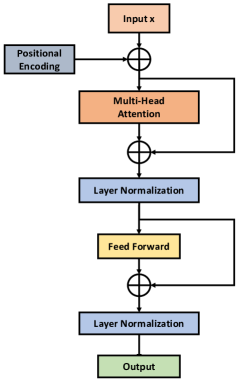
(b) Transformer encoder.
2.4 Segment-level Seizure Detector
Next, we rely on the outputs of the channel-level detectors to detect seizures in multi-channel segments. The channel-level detectors yield seizure probabilities for each EEG channel, which we arrange into regions according to the scalp topology: frontal, central, occipital, and parietal. Besides those four local regions, we also define a “global" region containing all channels. From each region, we extract seven statistical features: mean, median, standard deviation, maximum value, minimum value, and value at 25% and 75% percentile. As there are five regions, we extract features. From all channel-level outputs, we compute the normalized histogram features (5 bins, range [0,1]) and include them into the feature set, bringing the total features to .
In the iEEGs, the channel locations are unavailable; hence we cannot group the iEEG channels into local regions. Instead, we replace the four local regions with the global region. In this scenario, only features are unique, and the remaining ones are duplicates. In any case, the number of segment-level features is , regardless of the number of channels or the availability of the channel locations. This approach ensures that the number of features is consistent during the training and evaluation of any dataset. The features will be the inputs to an XGBoost for training and validation, and we determined the hyperparameters via grid search CV.
2.5 Channel- and Segment-level Evaluation Metric
We assess the channel- and segment-level seizure classifiers through the following metrics: accuracy (ACC), balanced accuracy (BAC), sensitivity (SEN), specificity (SPE), F1 score (F1), and expected calibration error (ECE) [46]. As the seizure and non-seizure classes are imbalanced, we evaluate the results mainly in BAC [43].
2.6 EEG-level Seizure Detector
Finally, we perform seizure detection on full EEGs by determining the start and end time of the seizures, if any. First, we apply a sliding window of length with an overlap duration to the multi-channel EEG, extracting multi-channel segments. The overlap duration is set to 1s. Next, we perform segment-level detection on each segment, resulting in seizure probabilities . Finally, we conduct three post-processing steps to the seizure probability sequence :
-
1.
We apply 1D smoothing filters with an overlap of 1 sample. We tested various filter lengths (3, 5, or 7s) and filter types (mean, median, or max). The smoothing filter removes isolated seizure detections (usually false positives (FPs) such as artifacts) and smoothens regions with significant confidence variations to stabilize the detections.
-
2.
Next, we perform thresholding to the seizure probabilities to round them to zeros (seizure-free) or ones (seizure). We tested threshold values .
-
3.
Then, we identify consecutive ones of length smaller than , and replace the 1s with 0s. Selecting a large removes many short detections, leading to fewer FPs and more FNs, as the system may miss short seizures. We tested .
Finally, we identify the remaining sequences of consecutive 1s, and determine their start and end time. The final output of the EEG-level seizure detector is the start and end times of the detected seizures.
2.7 EEG-level Seizure Detection Evaluation Metric
We assess the accuracy of the detections via EEG-level seizure detection evaluation metric. There are several well-established evaluation metrics, such as epoch-based sampling (EBS) [33], any-overlap (OVLP) [33], time-aligned event scoring (TAES) [33], and increased margin scoring (IMS) [34]. However, these metrics do not accurately reflect the clinical requirement of a seizure detector. Hence, we define a new metric, the minimum overlap evaluation scoring (MOES). In this metric, there needs to be a non-trivial overlap between the detection and the seizure, while it does not need to be perfect.
We elaborate on the limitations of the existing seizure evaluation metrics in the supplementary methods section. In short, OVLP metric considers a detection correct as long as it has a non-zero overlap with the annotation, which is too lenient and leads to overly optimistic results. On the other hand, TAES metric is too strict as it requires a perfect overlap between the detection and annotation, leading to overly pessimistic results.
2.8 Minimum Overlap Evaluation Scoring (MOES)
The minimum overlap evaluation scoring (MOES) determines the overlap duration between the detection () and seizure () window, and vice versa, before deciding if the detection is correct or the seizure is captured. Based on existing literature, only seizures of at least 10s are annotated typically [47]. Therefore, the minimum overlap duration of the detection(s) with the seizure should be 10s. However, these criteria do not account for the duration of the seizure or the detection. Therefore, even if the detection correctly detected over 10s of a seizure, the system should be penalised if the majority of the detection did not capture any seizure. To resolve this, we compute the detection overlap (DOL) and the seizure overlap (SOL), which measures the fraction of the detection that overlaps with any seizures, and vice versa, as:
| (2) |
| (3) |
where and is the index of a detection and a seizure, respectively, is the sum of all the overlaps with any seizures with detection , and is the sum of all the overlaps with any seizures with seizure .
In this study, we set a minimum DOL and SOL of 0.3 (30%) to ensure that a significant portion of the detection overlaps with the seizures and vice versa. In OVLP metric, the DOL is set to be 0+%, while in TAES it is 100%. The first option is too lenient in practice, while the latter is too strict.
A high DOL implies that the detection overlaps well with the seizure(s). Meanwhile, a high SOL indicates that the seizure is well captured by the detection(s). If the DOL is low, the detection should be discarded and treated as a false positive (FP). Similarly, if the SOL is low, the seizure should be treated as a false negative (FN). More details on how MOES approaches different detection cases are elaborated in the extended version of the paper.
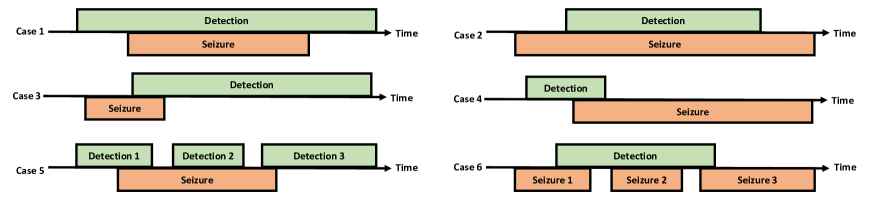
This approach allows us to consider different cases (see Figure 3):
-
•
Case 1: The detection window encapsulates the seizure window almost perfectly. Therefore, the , while (close to 1). In this case, the is a TP as the is correct.
-
•
Case 2: The detection window is encapsulated by the seizure window almost perfectly. Therefore, the , while (close to 1). In this case, the is a TP as the is correct.
-
•
Case 3: The detection window overlaps with the seizure window, however, the detection window protrudes the seizure window by a significant margin. In this case, while the can be greater than 0.3, the is low (less than 0.3). As , we consider the as a false alarm (FP). As a result, the is considered as a FN.
-
•
Case 4: The seizure window overlaps the detection window, however, the seizure window protrudes the detection window by a significant margin. In this case, while the can be greater than 0.3, the is low (less than 0.3). As , we consider the as missed (FN). As a result, the is considered as a FP.
-
•
Case 5: Multiple detection windows (1, 2, 3) overlap with the annotated seizure. The majority of the is detected, hence the is high (greater than 0.3). However, the vary for each detection, though all of them clipped the seizure to a certain extent.
-
1.
would have , hence it is a correct detection.
-
2.
would have , hence it is a correct detection.
-
3.
would have , hence it is a false detection.
As , we consider the as captured, hence a true positive. Meanwhile, the and are correct (TP) and is considered as a FP.
-
1.
-
•
Case 6: Multiple seizure windows (1, 2, 3) overlap with a detection window. The majority of the had capture seizures, hence the is high (greater than 0.3). However, the vary for each seizure, though all of them clipped the detection to a certain extent.
-
1.
would have , hence the seizure is detected well.
-
2.
would have , hence the seizure is detected well.
-
3.
would have , hence the seizure is not detected.
As , we consider the as correct, hence it is not a FP. Meanwhile, the and are one TP each and is missed and is considered as a false negative.
-
1.
In other words, the detections and seizures are analyzed separately. By investigating the seizures, we can compute the TP. Firstly, we check what detections overlap with the . For the seizure to be considered a TP, the following two conditions must be met simultaneously:
-
1.
.
-
2.
for all detections overlapping with .
The first condition implies that is sufficiently captured by one or more detections. The second condition makes sure that each of those detections sufficiently covers a seizure ( and potentially also other seizures). If both conditions are met simultaneously, the seizure is accurately detected and is a TP. Otherwise, the seizure is missed, and it is a FN. Indeed, imagine that 2 detections on the left and right of the seizure last very long and cover together almost the entire EEG. Then the entire EEG is covered by detections, and the seizure would not be properly detected. The two detections could have very low DOL. Consequently, the seizure in that EEG will be considered a FN instead of a TP.
Next, by investigating the detections, we compute the FPs. We first determine what seizures overlap with . The detection is considered a FP, as long as any of the following two conditions are met:
-
1.
-
2.
for all seizures overlapping with .
Note that it is important to compute TPs from the perspective of the seizure. Indeed, multiple detections may overlap with the same seizure (see Figure 3, case 6). However, as there is only one seizure event, we only can have one TP or one FN associated with a seizure event. Therefore, we need to compute the TPs from the perspective of the seizures. Computing TP from the perspective of the detection windows may result in multiple TPs for a single seizure event, which is undesirable.
Finally, the detection may start earlier or later than the annotated seizure. We compute the detection offset as:
| (4) |
where are the duration of the window length, is the start time of the detection, is the start time of the annotated seizure. We added in the offset as we require a minimum window of length to detect seizures. To more accurately detect the onset of a seizure, one may slide the window in smaller steps around the onset of a detection. However, this goes beyond the scope of this work, as we are mainly interested in detecting seizures, irrespective of their onset times.
2.9 EEG-level Seizure Detection Performance Metrics
We measure the performance of EEG-level seizure detection with sensitivity (SEN), precision (PRE), and false positive per hour (FPR/h). We report both the average FPR/h (aFPR/h) and median FPR/h (mFPR/h). We mainly focus on the mFPR/h in this study as they are more robust to outliers compared to the average.
3 Results

3.1 Channel-level Seizure Detection
We performed channel-level seizure detection with three channel-level detectors: CNN-SM, CNN-BM, and CNN-TRF-BM. We summarized the results in Table 3.2. In addition, all the precision-recall (PR) curves can be found in Figure 4.
On the TUH-SZ dataset, the proposed channel-level detectors achieve high BAC, SEN, and SPE across all window lengths. Moreover, the ECE improved for all window lengths (except for 3s) when the SM loss is replaced with the BM loss (CNN-SM against CNN-BM). However, the ECE is slightly larger for the CNN-TRF-BM model. The performance peaks at a for all three models. Overall, the CNN-TRF-BM model attained the best results, followed by the CNN-BM and the CNN-SM model. As the channel-level detector attains good results on the TUH-SZ dataset, using it as the primary training dataset seems promising.
Next, we assessed the channel-level detector, trained on the TUH-SZ dataset, on the five EEG datasets. The detectors achieve high BACs on the CHB-MIT, SWEC-ETHZ, and EIM datasets, but yield poor BACs on the HUH and IEEGP datasets. For those datasets, seizures have only been annotated on the level of segments instead of channels; therefore, it is impossible to assess the channel detector reliably. Without channel-level annotations, we must assume that all channels within a multi-channel segment contain seizures. However, this is unlikely as seizures sometimes only occur in certain regions. In particular, focal seizures occur only in one hemisphere or at a few electrodes. Consequently, channels that do not exhibit seizures may be mislabelled as “seizures", leading to errors during training and testing. However, segment-level and EEG-level detection results are reliable for those datasets.
3.2 Segment-level Seizure Detection
Next, we performed segment-level seizure detection using the outputs from the three channel-level detectors. The segment-level detection results on the six EEG datasets are displayed in Table 3.2.
On the TUH-SZ dataset, the proposed segment-level detectors achieve high BAC, SEN, and SPE across all window lengths, similarly to the channel-level results. However, the ECE reported at the segment-level is much greater than the channel-level counterparts, as the segment-level detector model does not minimize ECE. Similarly, the performance peaks at a . Again, the CNN-TRF-BM model outshines the other two models.
Next, we evaluated the segment-level seizure detector on the other five datasets. We obtained excellent performance on all the datasets at various window lengths, except for the HUH dataset. The segment-level detectors obtain high BACs on the IEEGP dataset, even when the channel-level results on this dataset are not satisfactory.
Overall, the performance peaks at different window lengths across the six datasets. This might be due to the discrepancy in seizure types, patient types, and patient age groups across the different datasets. For instance, for datasets with many short seizures, one should deploy a window length of 3s as it can capture shorter seizures, while a window length of 20s would be suboptimal.
Channel-level seizure detection results for different CNN models across six EEG datasets. Dataset W CNN-SM CNN-BM CNN-TRF-BM ECE ACC BAC SEN SPE F1 ECE ACC BAC SEN SPE F1 ECE ACC BAC SEN SPE F1 TUH-SZ Scalp EEG Adult 3 0.043 0.824 0.832 0.808 0.855 0.827 0.046 0.837 0.842 0.827 0.856 0.839 0.052 0.824 0.832 0.773 0.89 0.826 5 0.043 0.84 0.836 0.769 0.902 0.84 0.035 0.845 0.842 0.862 0.821 0.848 0.03 0.85 0.83 0.767 0.892 0.849 10 0.044 0.815 0.826 0.809 0.844 0.821 0.021 0.848 0.844 0.78 0.908 0.848 0.056 0.772 0.76 0.868 0.653 0.758 20 0.044 0.836 0.845 0.812 0.877 0.837 0.027 0.845 0.851 0.834 0.868 0.846 0.033 0.852 0.858 0.828 0.889 0.853 HUH Scalp EEG Neonatal 3 0.259 0.506 0.491 0.187 0.794 0.454 0.399 0.403 0.403 0.249 0.903 0.496 0.408 0.4 0.4 0.245 0.902 0.492 5 0.28 0.532 0.511 0.12 0.902 0.445 0.481 0.354 0.354 0.168 0.957 0.423 0.377 0.427 0.427 0.289 0.879 0.526 10 0.228 0.527 0.507 0.217 0.796 0.482 0.403 0.417 0.417 0.264 0.912 0.511 0.508 0.358 0.358 0.168 0.974 0.423 20 0.271 0.574 0.534 0.131 0.937 0.485 0.457 0.385 0.385 0.211 0.952 0.464 0.527 0.343 0.343 0.145 0.986 0.403 CHB-MIT Scalp EEG Paediatric 3 0.259 0.617 0.756 0.569 0.942 0.649 0.269 0.568 0.74 0.51 0.97 0.601 0.25 0.582 0.747 0.528 0.966 0.617 5 0.181 0.669 0.763 0.56 0.966 0.668 0.205 0.62 0.739 0.494 0.984 0.616 0.095 0.742 0.808 0.666 0.95 0.755 10 0.126 0.786 0.816 0.743 0.889 0.79 0.137 0.724 0.782 0.635 0.928 0.733 0.205 0.663 0.748 0.515 0.981 0.649 20 0.129 0.777 0.78 0.592 0.969 0.758 0.141 0.777 0.782 0.606 0.959 0.765 0.153 0.755 0.756 0.534 0.978 0.733 SWEC-ETHZ iEEG Adult 3 0.069 0.803 0.721 0.56 0.882 0.804 0.127 0.814 0.725 0.557 0.892 0.813 0.107 0.814 0.726 0.56 0.891 0.814 5 0.066 0.828 0.718 0.502 0.935 0.819 0.108 0.834 0.723 0.514 0.933 0.826 0.097 0.798 0.73 0.614 0.847 0.805 10 0.084 0.772 0.726 0.648 0.805 0.785 0.112 0.805 0.74 0.628 0.853 0.812 0.094 0.844 0.737 0.535 0.939 0.837 20 0.074 0.837 0.781 0.615 0.914 0.836 0.099 0.827 0.777 0.635 0.89 0.83 0.12 0.863 0.79 0.594 0.953 0.857 IEEGP iEEG Adult 3 0.358 0.536 0.536 0.453 0.952 0.613 0.346 0.533 0.533 0.444 0.975 0.608 0.351 0.532 0.532 0.445 0.968 0.606 5 0.417 0.512 0.512 0.416 0.991 0.578 0.398 0.502 0.502 0.404 0.993 0.567 0.317 0.553 0.553 0.473 0.95 0.626 10 0.317 0.574 0.574 0.508 0.9 0.651 0.352 0.562 0.562 0.479 0.976 0.631 0.386 0.523 0.523 0.428 0.998 0.59 20 0.465 0.531 0.531 0.438 0.995 0.592 0.406 0.546 0.546 0.458 0.985 0.614 0.433 0.505 0.505 0.407 0.999 0.561 EIM iEEG Adult 3 0.201 0.653 0.662 0.583 0.741 0.643 0.128 0.658 0.669 0.579 0.759 0.649 0.144 0.659 0.666 0.588 0.745 0.651 5 0.205 0.65 0.684 0.52 0.848 0.633 0.135 0.652 0.687 0.518 0.855 0.638 0.154 0.66 0.653 0.626 0.679 0.653 10 0.207 0.659 0.641 0.658 0.624 0.65 0.154 0.666 0.663 0.622 0.704 0.66 0.155 0.665 0.701 0.536 0.866 0.653 20 0.221 0.671 0.703 0.57 0.835 0.662 0.15 0.674 0.695 0.594 0.796 0.669 0.139 0.667 0.716 0.541 0.89 0.658
Segment-level seizure detection results for different CNN models across six EEG datasets. Dataset W CNN-SM CNN-BM CNN-TRF-BM ECE ACC BAC SEN SPE F1 ECE ACC BAC SEN SPE F1 ECE ACC BAC SEN SPE F1 TUH-SZ Scalp EEG Adult 3 0.051 0.818 0.736 0.888 0.584 0.817 0.027 0.820 0.733 0.901 0.565 0.816 0.262 0.823 0.751 0.885 0.616 0.824 5 0.036 0.804 0.779 0.856 0.702 0.804 0.033 0.810 0.789 0.856 0.722 0.811 0.248 0.814 0.794 0.856 0.732 0.815 10 0.039 0.815 0.817 0.783 0.850 0.815 0.031 0.833 0.833 0.815 0.852 0.833 0.027 0.832 0.831 0.800 0.862 0.831 20 0.268 0.833 0.823 0.766 0.881 0.833 0.031 0.841 0.829 0.771 0.888 0.841 0.251 0.856 0.846 0.795 0.897 0.855 HUH Scalp EEG Neonatal 3 0.193 0.514 0.510 0.514 0.507 0.534 0.130 0.776 0.776 0.746 0.926 0.803 0.259 0.614 0.614 0.577 0.735 0.710 5 0.200 0.470 0.545 0.376 0.714 0.471 0.232 0.746 0.746 0.709 0.932 0.784 0.303 0.533 0.533 0.429 0.869 0.618 10 0.353 0.407 0.575 0.192 0.957 0.349 0.366 0.651 0.651 0.581 1 0.695 0.467 0.455 0.455 0.292 0.984 0.514 20 0.357 0.413 0.575 0.183 0.968 0.349 0.414 0.628 0.628 0.533 0.817 0.691 0.444 0.426 0.426 0.251 0.994 0.483 CHB-MIT Scalp EEG Paediatric 3 0.122 0.789 0.801 0.804 0.798 0.789 0.117 0.798 0.811 0.819 0.804 0.801 0.258 0.833 0.847 0.808 0.886 0.837 5 0.105 0.814 0.824 0.762 0.887 0.808 0.126 0.811 0.816 0.700 0.932 0.808 0.256 0.822 0.824 0.715 0.932 0.819 10 0.118 0.874 0.841 0.745 0.936 0.867 0.100 0.875 0.831 0.686 0.976 0.862 0.104 0.879 0.837 0.698 0.976 0.866 20 0.362 0.921 0.838 0.699 0.976 0.910 0.104 0.918 0.815 0.650 0.979 0.906 0.334 0.929 0.847 0.711 0.982 0.920 SWEC-ETHZ iEEG Adult 3 0.585 0.335 0.546 0.981 0.110 0.267 0.532 0.769 0.776 0.808 0.680 0.821 0.278 0.415 0.579 0.959 0.199 0.358 5 0.487 0.417 0.600 0.980 0.220 0.380 0.355 0.584 0.601 0.514 0.886 0.659 0.234 0.541 0.649 0.917 0.381 0.529 10 0.231 0.717 0.763 0.871 0.655 0.731 0.131 0.455 0.472 0.311 0.992 0.509 0.196 0.751 0.768 0.841 0.695 0.766 20 0.226 0.806 0.832 0.881 0.773 0.819 0.151 0.449 0.463 0.296 0.996 0.493 0.261 0.877 0.872 0.858 0.874 0.883 IEEGP iEEG Adult 3 0.289 0.753 0.753 0.727 0.884 0.787 0.308 0.636 0.535 0.952 0.118 0.542 0.376 0.720 0.720 0.769 0.474 0.760 5 0.311 0.722 0.722 0.779 0.439 0.759 0.278 0.658 0.555 0.968 0.143 0.559 0.325 0.737 0.737 0.706 0.892 0.778 10 0.306 0.692 0.692 0.631 1 0.738 0.326 0.726 0.679 0.808 0.551 0.697 0.334 0.670 0.670 0.604 1 0.712 20 0.290 0.621 0.621 0.571 0.720 0.690 0.345 0.757 0.705 0.883 0.528 0.733 0.398 0.616 0.616 0.429 0.991 0.648 EIM iEEG Adult 3 0.292 0.650 0.553 0.953 0.152 0.556 0.180 0.372 0.545 0.939 0.150 0.310 0.201 0.631 0.505 0.999 0.010 0.495 5 0.279 0.568 0.459 0.893 0.025 0.468 0.280 0.577 0.670 0.904 0.436 0.575 0.203 0.654 0.538 0.989 0.087 0.543 10 0.262 0.654 0.568 0.909 0.227 0.586 0.224 0.841 0.809 0.785 0.832 0.849 0.218 0.715 0.646 0.926 0.366 0.655 20 0.204 0.648 0.644 0.603 0.685 0.611 0.246 0.833 0.850 0.886 0.808 0.846 0.224 0.780 0.745 0.881 0.609 0.749
3.3 EEG-level Seizure Detection
Next, we performed EEG-level seizure detection based on the outputs of the segment-level detector. We summarized the results for the six datasets in Table 3.3. The EEG-level performance is computed according to MOES, as it is more suitable for clinical practice than existing metrics. We also considered other existing evaluation metrics for comparison in Table 3.3.
On the TUH-SZ dataset, the CNN-TRF-BM model leads to the most promising results, followed by the CNN-BM and the CNN-SM model. The CNN-TRF-BM EEG-level seizure detector attained a respectable SEN, PRE, aFPR/h, mFPR/h, and median offset of 0.772, 0.429, 0.425, 0, and -2.125s, respectively. While the aFPR/h is high, the mFPR/h is extremely low. This implies that the aFPR/h is skewed by a small number of EEGs containing an exceptionally huge amount of false detection. While the SEN is similar across all three models, the CNN-TRF-BM model reported the best PRE, which is critical for clinical deployment.
Similarly, we evaluated the EEG-level seizure detectors on the five scalp EEG and iEEG datasets. The CNN models yield high SEN, decent PRE, and low aFPR/h and mFPR/h on the CHB-MIT, SWEC-ETHZ, and EIM datasets. Meanwhile, on the HUH and IEEGP datasets, the model achieves low SEN (0.254 and 0.450, respectively), high PRE (0.841 and 0.917, respectively), and low mFPR/h (0.347 and 0, respectively). The poorer results on the HUH dataset align with our expectations since it is a neonatal dataset. The morphology of neonatal seizures differs vastly from adult seizures. Since the model has been trained on adult scalp EEG, it struggles to detect seizures in neonatal scalp EEGs. Meanwhile, the IEEGP dataset contains some dog iEEGs, which could have different seizure patterns from adult humans. However, we observed that the detection performance is comparable for human and dog EEGs. Hence, the proposed detector can detect some neonate and dog seizures with high PRE, which can be tremendously valuable.
We also determined the detection offset, defined as the average duration between the start time of the seizure and the start time of its corresponding detection (see Table 3.3), which can be negative. A negative offset does not imply forecasting, as the EEG data is analyzed offline [48]. Therefore, data from future time intervals are being considered to decide whether an EEG segment is ictal.
In Table 3.3, we compare results for the CNN-TRF-BM model for different evaluation metrics (IMS, OVLP, TAES, and MOES). IMS always leads to the best results, followed by OVLP, MOES, and TAES. The results for MOES are similar to OVLP and IMS, despite MOES having a more stringent condition. This implies that the proposed seizure detector detects most seizures with at least 10s overlap and with 30% overlap between the seizure and detection. The results for the TAES metric are the lowest: a slight drop in SEN, much lower PRE, and significantly higher aFPR/h and mFPR/h. While there are significant differences across the different performance metrics, the results obtained by MOES are the most appropriate, as it does not lead to overly optimistic or pessimistic results.
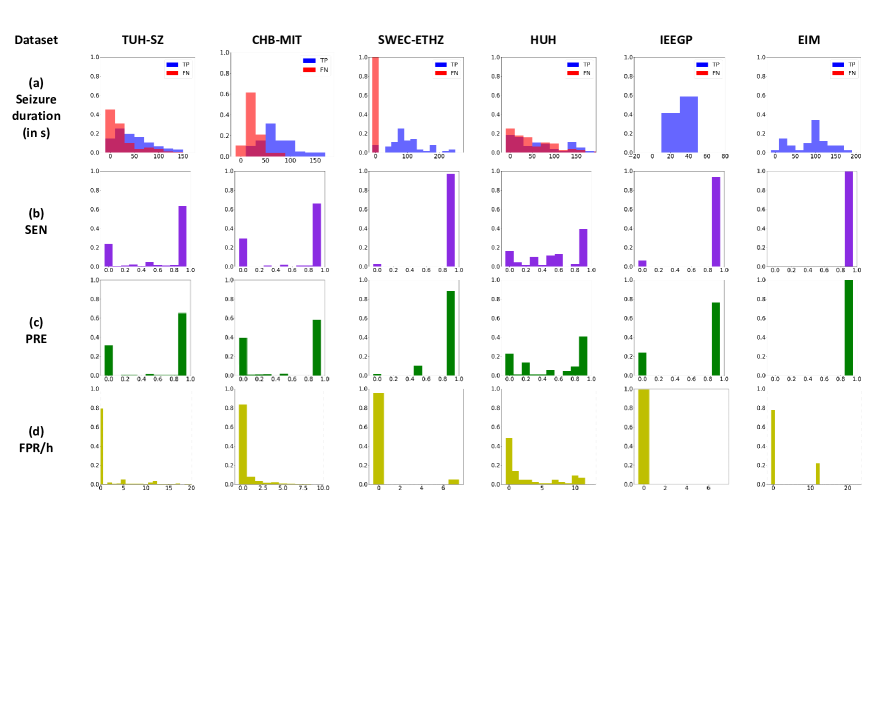
Finally, to determine the effectiveness of the CNN-TRF-BM-based EEG-level seizure detector (Figure 5), we plot the normalized histograms of the TP and FN of seizures detected sorted by event duration, together with the normalized histogram of SEN, PRE, and FPR/h computed from individual EEGs across the datasets. From Figure 5(a), it can be seen that it is easier to detect a long seizure than a short event. Figure 5(b) and 5(c) reveal that the SEN and PRE are high for most EEGs, with only a minority of the files having a poor detection rate. Lastly, Figure 5(d) confirms that the system does not make false detections in most EEGs, as mFPR/h is 0. Taken together, these figures suggest that the proposed detector performs well across most EEGs.
In Table 5, we computed the SEN of short (10s) and long (10s) seizures across the six datasets for various window lengths. As the CHB-MIT and IEEGP datasets do not contain annotated short seizures, we could not compute the SEN for those datasets. We observe that leads to drastic drops in SEN for shorter seizures. On the other hand, a shorter window (3s and 5s) can more reliably capture shorter seizures, at the cost of potentially higher FPR/h.
The proposed seizure detectors, specifically the CNN-TRF-BM-based model, can detect patient-independent seizures at the channel-, segment-, and EEG-level across various scalp EEG and iEEG datasets without retraining. It takes less than 15s computation time to detect seizures in a 30 minutes EEG. Hence, the proposed detector can help automate EEG annotations clinically. However, while the results are appealing for adult human EEG, there is room for improvement for neonatal EEG. One may need to perform additional tuning or retraining to achieve better performance for such cases.
![[Uncaptioned image]](/html/2208.00025/assets/x7.png)
Illustration of the outputs of the proposed CNN-TRF-BM seizure detector applied to an EEG. (a) multi-channel EEG as input; (b) channel-level predictions; (c) segment-level predictions; (d) EEG-level predictions; (e) annotated seizure.
EEG-level seizure detection results for different models evaluated with MOES across six EEG datasets. Dataset W CNN-SM CNN-BM CNN-Transformer-BM SEN PRE aFPR/h mFPR/h Offset SEN PRE aFPR/h mFPR/h Offset SEN PRE aFPR/h mFPR/h Offset TUH-SZ Scalp EEG Adult 3 0.7 0.457 0.803 0 -4.125 0.713 0.49 0.479 0 -4.5 0.772 0.429 0.425 0 -2.125 5 0.704 0.48 0.555 0 -4.5 0.701 0.491 0.413 0 -1.5 0.653 0.476 0.411 0 0.625 10 0.719 0.495 0.466 0 -1 0.701 0.512 0.237 0 1.5 0.671 0.534 0.954 0 0.5 20 0.707 0.467 0.679 0 6.25 0.708 0.49 0.468 0 6 0.655 0.52 1.037 0 2.875 CHB-MIT Scalp EEG Pediatric 3 0.638 0.112 1.721 1.099 0.711 0.613 0.14 0.916 0.539 -2.763 0.7 0.181 1.095 0.616 0.053 5 0.678 0.143 1.514 0.868 -4.474 0.568 0.235 0.600 0.158 2.947 0.571 0.292 0.541 0.224 1.605 10 0.734 0.254 1.041 0.618 0.158 0.704 0.411 0.291 0.026 4.737 0.678 0.377 0.421 0.118 4.684 20 0.803 0.194 1.224 0.592 6.842 0.741 0.244 0.884 0.368 5.237 0.769 0.383 0.445 0.145 1.474 HUH Scalp EEG Neonatal 3 0.298 0.334 2.565 1.094 6 0.623 0.576 2.320 2.276 -3.52 0.515 0.522 2.874 2.843 -2.255 5 0.328 0.372 2.413 0.849 4.25 0.314 0.505 1.977 1.933 3.892 0.253 0.649 0.678 0.623 5.098 10 0.254 0.397 1.671 0.181 11.5 0.214 0.807 0.334 0.303 13.52 0.227 0.818 0.253 0.223 10.853 20 0.276 0.473 1.340 0.186 14.25 0.283 0.686 0.708 0.674 16.333 0.254 0.841 0.374 0.347 15.245 SWEC-ETHZ iEEG Adult 3 0.743 0.758 2.316 1.415 10.781 0.933 0.865 1.286 0.469 -2.156 0.938 0.878 0.895 0.559 7.687 5 0.938 0.949 0.362 0 3.781 0.923 0.752 2.854 2.391 0.312 0.933 0.834 1.784 1.127 4.906 10 0.933 0.785 2.223 0.884 4.187 0.825 0.695 3.265 2.858 15.719 0.857 0.748 2.899 1.648 10.375 20 0.878 0.711 3.897 3.601 14.937 0.911 0.744 2.764 1.259 16.531 0.849 0.727 3.010 2.205 12.5 IEEGP iEEG Adult 3 0.6 0.964 0.523 0 -19 0.583 0.958 0.500 0 -14.5 0.667 0.8 2.200 2 -19 5 0.667 0.8 2.624 2 -17 0.583 0.906 1.595 0 -17 0.617 0.944 1.120 0 -17 10 0.592 0.946 0.750 0 -12 0.45 0.678 5.596 7 -12 0.5 0.753 4.423 5 -12 20 0.567 0.805 3.846 0 -2 0.542 0.906 1.500 0 -2 0.45 0.917 0.500 0 -2 EIM iEEG Adult 3 0.972 1 0 0 -22.083 0.792 0.904 1.245 1.286 -7 1 1 1.523 0 -32.083 5 0.979 0.938 1.080 0 -30.083 1 0.972 0.484 0.452 -15.417 1 1 0.647 0 -23.958 10 1 1 0 0 -23.417 0.931 0.979 0.520 0 10.542 0.931 1 0.830 0 -1.333 20 0.875 0.964 0.494 0.711 5.208 1 1 0 0 -0.792 0.951 1 0.507 0 -3.125
EEG-level seizure detection results by the CNN-TRF-BM-based EEG-level detector evaluated with IMS, OVLP, TAES, and MOES across six EEG datasets. Dataset W IMS OVLP TAES MOES SEN PRE aFPR/h mFPR/h Offset SEN PRE aFPR/h mFPR/h Offset SEN PRE aFPR/h mFPR/h Offset SEN PRE aFPR/h mFPR/h Offset TUH-SZ scalp EEG Adult 3 0.797 0.437 0.412 0 -7.5 0.775 0.43 0.423 0 -2 0.752 0.396 0.804 0.112 -2 0.772 0.429 0.425 0 -2.125 5 0.694 0.494 0.378 0 -4.75 0.659 0.478 0.408 0 0.5 0.652 0.42 1.001 0 0.625 0.653 0.476 0.411 0 0.625 10 0.658 0.588 0.562 0 -2.75 0.656 0.546 0.823 0 0.5 0.66 0.435 1.840 0 -1.5 0.671 0.534 0.954 0 0.5 20 0.682 0.554 0.853 0 -2.25 0.667 0.526 1.026 0 3 0.658 0.358 2.902 0 3.5 0.655 0.52 1.037 0 2.875 CHB-MIT scalp EEG Pediatric 3 0.721 0.185 1.091 0.616 -5.921 0.7 0.181 1.095 0.616 0.053 0.622 0.151 1.126 0.622 0.053 0.7 0.181 1.095 0.616 0.053 5 0.571 0.292 0.541 0.224 -4.395 0.571 0.292 0.541 0.224 1.605 0.52 0.255 0.667 0.336 2.842 0.571 0.292 0.541 0.224 1.605 10 0.672 0.434 0.244 0.053 0.789 0.668 0.402 0.359 0.118 4.895 0.567 0.179 0.780 0.414 1.237 0.678 0.377 0.421 0.118 4.684 20 0.762 0.396 0.391 0.092 -4.368 0.769 0.383 0.445 0.145 1.474 0.597 0.14 1.272 0.623 0.921 0.769 0.383 0.445 0.145 1.474 SWEC-ETHZ iEEG Adult 3 0.938 0.878 0.895 0.559 1.688 0.938 0.878 0.895 0.559 7.687 0.932 0.517 6.379 6.147 7.687 0.938 0.878 0.895 0.559 7.687 5 0.933 0.853 1.620 1.127 -1.094 0.933 0.84 1.729 1.127 4.906 0.913 0.523 6.863 6.259 5.187 0.933 0.834 1.784 1.127 4.906 10 0.86 0.805 2.424 1.327 11.219 0.857 0.755 2.667 1.618 10.656 0.896 0.55 6.168 5.717 6.156 0.857 0.748 2.899 1.648 10.375 20 0.872 0.775 2.435 1.681 8.094 0.858 0.735 2.937 1.716 13.906 0.767 0.5 7.237 7.482 11.094 0.849 0.727 3.010 2.205 12.5 HUH scalp EEG Neonatal 3 0.563 0.554 2.756 2.725 0.402 0.544 0.539 2.795 2.76 -1.912 0.45 0.468 3.183 3.147 -1.912 0.515 0.522 2.874 2.843 -2.255 5 0.284 0.662 0.654 0.6 7.765 0.254 0.649 0.678 0.623 5.059 0.203 0.546 1.237 1.186 4.431 0.253 0.649 0.678 0.623 5.098 10 0.203 0.918 0.053 0.041 14.392 0.215 0.822 0.228 0.203 10.186 0.18 0.564 0.628 0.593 7.843 0.227 0.818 0.253 0.223 10.853 20 0.278 0.865 0.315 0.295 17.059 0.271 0.845 0.374 0.347 16.765 0.173 0.518 1.088 1.057 18.167 0.254 0.841 0.374 0.347 15.245 IEEGP iEEG Adult 3 0.667 0.8 2.200 2 -37 0.667 0.8 2.200 2 -19 0.656 0.466 15.182 15.725 -19 0.667 0.8 2.200 2 -19 5 0.65 1 0 0 -35 0.625 0.958 0.750 0 -17 0.592 0.547 13.431 13.571 -17 0.617 0.944 1.120 0 -17 10 0.55 0.822 3.096 2 -29 0.5 0.777 3.173 0 -12 0.526 0.531 12.339 13.205 -12 0.5 0.753 4.423 5 -12 20 0.467 1 0 0 -20 0.458 0.958 0.250 0 -2 0.36 0.374 15.284 16.997 -2 0.45 0.917 0.500 0 -2 EIM iEEG Adult 3 1 1 0 0 -41.083 1 1 0 0 -32.083 1 0.646 8.380 8.613 -32.083 1 1 1.523 0 -32.083 5 1 1 0 0 -32.958 1 1 0 0 -23.958 0.992 0.662 7.811 8.218 -23.958 1 1 0.647 0 -23.958 10 0.931 1 0 0 0.333 0.931 1 0 0 -1.333 0.975 0.681 7.071 7.547 -15.5 0.931 1 0.830 0 -1.333 20 0.951 1 0 0 -12.125 0.951 1 0 0 -3.125 0.92 0.678 6.603 6.577 -0.208 0.951 1 0.507 0 -3.125
SEN of short (10s) and long (10s) seizures detected by the CNN-TRF-BM-based model across the six datasets according to MOES metric. Dataset W SEN All Seizure Short Seizure Long Seizure TUH-SZ scalp EEG Adult 3 0.772 0.532 0.797 5 0.653 0.431 0.687 10 0.671 0.343 0.72 20 0.655 0.333 0.704 CHB-MIT scalp EEG Paediatric 3 0.7 - 0.75 5 0.571 - 0.631 10 0.678 - 0.728 20 0.769 - 0.819 SWEC-ETHZ iEEG Adult 3 0.938 1 0.931 5 0.933 1 0.926 10 0.857 0 0.912 20 0.849 0 0.868 HUH scalp EEG Neonatal 3 0.515 0.818 0.496 5 0.253 0.091 0.255 10 0.227 0 0.248 20 0.254 0 0.265 IEEGP iEEG Adult 3 0.667 - 0.667 5 0.617 - 0.617 10 0.5 - 0.5 20 0.45 - 0.45 EIM iEEG Adult 3 1 1 1 5 1 1 1 10 0.931 0 0.955 20 0.951 0 0.955
4 Discussion
4.1 Comparison with Existing Patient-independent Detectors
To compare the proposed seizure detector to the state-of-the-art is challenging, as there is a lack of standardized evaluation metrics, datasets, or training and testing procedures for the problem of seizure detection. In addition, the datasets considered in the literature vary in terms of patients (age, type, diversity), clinical settings, EEG type, data quantity and quality, and use case (patient-specific vs patient-independent).
It is especially critical to specify the use case, as patient-specific detectors may yield much better performance than a patient-independent detector, but cannot be readily deployed. Therefore, comparing these two types of detectors is meaningless. Consequently, we consider studies that report patient-independent seizure detection results on the six datasets analyzed in this paper.
4.1.1 Detection on the TUH-SZ Dataset
Numerous patient-independent seizure detectors have been evaluated on the TUH-SZ dataset. Roy et al. utilized different machine learning models and reported a SEN and FPR/h of 0.916 and 137.311 [12]. Meanwhile, Shah et al. applied an LTSM to detect seizures at the segment-level and obtained SEN between 0.33-0.37 and FPR/h between 1.24-20.8 [10]. Ayodele et al. trained a VGGNet and evaluated it on 24 EEGs, attaining a SEN, FPR/h, and offset of 0.7835, 0.9, and 2.32s, respectively [11].
Most results reported are not suitable for clinical application; extremely low SEN or high FPR/h. Additionally, most studies did not report the seizure evaluation metrics. When they do, they utilize EBS and OVLP metrics, which fail to represent the requirements of a seizure detector appropriately. In contrast, the proposed CNN-TRF-BM seizure detector achieved superior results calculated with MOES (SEN, PRE, aFPR/h, and mFPR/h of 0.772, 0.429, 0.425, and 0, respectively), which is suitable for clinical applications. However, to the author’s knowledge, no existing studies have reported the PRE, although it is an essential metric in clinical practice. Moreover, only a few studies reported the offset.
4.1.2 Detection on the CHB-MIT Dataset
In the following, we review the results of the CHB-MIT dataset reported in the literature. Furbass et al. deployed epileptiform wave sequence (EWS) to classify seizures and obtained a SEN and FPR/h of 0.67 and 0.32, respectively [13]. Gómez et al. applied a CNN and achieved a SEN, SPE, and FPR/h of 0.531, 0.931, and 7.8, respectively [15]. Ayodele et al. employed the CHB-MIT and TUH-SZ dataset and reported a SEN, FPR/h, and offset of 0.7145, 0.76, and 2.32s, respectively [11]. Mansouri et al. trained their detector on the CHB-MIT (19 patients) and the TUH-SZ (24 patients) dataset and evaluated the detector on the CHB-MIT dataset [14]. They attained a SEN, SPE, and FPR/h of 0.83, 0.96, and 8, respectively.
The proposed CNN-TRF-BM model achieves better results on the CHB-MIT dataset, with SEN, PRE, aFPR/h, mFPR/h, and offset of 0.678, 0.377, 0.421, 0.118, and 4.684s, respectively. However, we trained our detector with the TUH-SZ dataset instead of the CHB-MIT dataset. The TUH-SZ dataset contains more seizures (3,055 events) compared to CHB-MIT (185 events), giving the model more data to learn from. This shows that training the detector on a different but larger dataset may help improve the performance.
4.1.3 Detection on the SWEC-ETHZ Dataset
No existing seizure detectors had been evaluated on the SWEC-ETHZ dataset in a patient-independent manner. Existing studies only performed patient-specific detection on this dataset [38]. The current study can be the baseline for patient-independent seizure detection on the SWEC-ETHZ dataset.
4.1.4 Detection on the HUH Dataset
No seizure detectors have so far been evaluated on the HUH dataset in a patient-independent manner. Existing studies only evaluated patient-specific seizure detection [49]. The current study is the first to perform patient-independent seizure detection at EEG-level on the HUH dataset. Moreover, we applied a detector trained on adult EEGs to detect seizures in neonatal EEGs and attained promising results. This shows that a detector trained on adult seizures may capture neonatal seizures with a high PRE, despite the substantial age gap. As the model has been trained on adult scalp EEG, it struggles to detect all seizures in neonatal EEGs.
4.1.5 Detection on the IEEGP Dataset
Few studies investigated seizure detection on the IEEGP dataset. All studies are on patient-specific seizure detections [50]. Similarly, accuracy is a poor metric for an imbalanced dataset. Therefore, the current study can be the baseline for patient-independent seizure detection on the IEEGP dataset.
4.1.6 Detection on the EIM Dataset
No earlier studies on seizure detection have been conducted on the EIM dataset. The existing studies aim to predict surgical outcomes [40]. The current study is the first to analyze the EIM dataset for patient-independent seizure detection.
4.2 Commercial Detectors
Several commercial seizure detectors are available in the market, such as Persyst [51], Encevis [52], and BESA [52]. Earlier studies by Reus et al. [34] and Koren et al. [53] have compared the performance of Persyst, Encevis, and BESA. We summarized their findings against the performance of the proposed detector in Table 4.2. Both studies evaluated the commercial detectors on adult scalp EEG datasets; hence, we focus on the TUH-SZ dataset in this section.
The proposed model outperforms the three commercial detectors in the study conducted by Reus et al. by a significant margin. Meanwhile, the proposed system outperforms Persyst and BESA in the study by Koren et al., with Encevis reporting similar results to the current study. However, we report MOES, TAES, OVLP, and IMS metric results. In contrast, Reus et al. and Koren et al. only reported IMS, which is more lenient as they consider a detection correct as long as the detection is within 30s before the start or after the end of the seizure. Koren et al. implemented an altered version of IMS, where the margin is increased to 120s. These metrics introduced a significant margin of error, which is inappropriate in clinical practice.
Performance of commercial seizure detectors against the proposed CNN-TRF-BM detector. Author No of Patients No of Seizures Duration (in hours) Metrics Seizure Detector SEN aFPR/h Reus et al. [34] 283 249 8771 IMS Persyst 14 0.558 0.071 Encevis 1.9.2 0.518 0.229 BESA 2.0 0.430 0.100 Koren et al. [53] 81 790 6900 IMS Persyst 13 0.816 0.9 Encevis 1.7 0.778 0.2 BESA 2.0 0.676 0.7 Current study 637 TUH-SZ 3055 922 MOES CNN-TRF-BM 0.772 0.425 OVLP CNN-TRF-BM 0.775 0.423 IMS CNN-TRF-BM 0.797 0.412
4.3 Transformer for Seizure Detection
We identified two studies that apply transformers for seizure detection [22]. However, these systems did not implement a channel-level detector but headed directly to the segment-level. Thus, the current study is the first to implement a channel-level seizure detector through transformers.
Bhattacharya et al. utilized a transformer for patient-specific seizure detection on the CHB-MIT and IEEGP dataset [22]. For the CHB-MIT and IEEGP datasets, they attained an average SEN of 0.985 and 0.948, and FPR/h of 0.124 and 0, respectively. While they used transformers, there were significant differences in the study performed by Bhattacharya et al. as compared to the current study. Firstly, we followed a patient-independent approach while they designed a patient-specific detector. Secondly, The proposed system can detect seizures at the channel-level. In contrast, their systems can only detect seizures at the segment-level. Thirdly, we implemented BM loss while they utilized the SM loss.
4.4 Training the Detector on the TUH-SZ Dataset Only
Patient-independent seizure detectors that can be readily deployed without retraining are convenient for clinical practice. To replicate this scenario, we only trained the seizure detectors on the TUH-SZ dataset. Earlier, we showed that the proposed seizure detectors yield good performance on six EEG datasets. However, when testing on an independent dataset, we do not know whether the model trained on the TUH-SZ dataset would yield better performance than a model trained on the test dataset.
To address this, we train and test the seizure detectors on the CHB-MIT dataset as the total length of EEG in that dataset is comparable to those in the TUH-SZ dataset. We report the channel-, segment-, and EEG-level results on the CHB-MIT dataset in Table 4.4. The CNN-TRF-BM model yields a SEN, PRE, aFPR/h and mFPR/h of 0.613, 0.088, 0.408, and 0, respectively. In comparison, the model trained on the TUH-SZ dataset yields a SEN, PRE, aFPR/h, and mFPR/h of 0.678, 0.377, 0.421, and 0.118 (see Table 3.3). While the model trained on the CHB-MIT dataset obtained lower FPR, the model trained on the TUH-SZ dataset attained vastly superior SEN and PRE.
This experiment suggests that training and evaluating a model with the same dataset might not necessarily generate the best results. Here, when tested on the CHB-MIT dataset, the detector trained on the TUH-SZ dataset performed better than the model trained on the CHB-MIT dataset. This is because the TUH-SZ dataset contains more seizures (3,055 events) than the CHB-MIT dataset (185 events), allowing the detector to learn from a more diverse dataset. This experiment also suggests that designing neural network-based patient-independent seizure detectors that generalize well across different datasets is possible.
Using a pretrained seizure detector to perform seizure detection on another dataset is not a new concept [24]. Saab et al. trained their detector on the TUH-SZ dataset and evaluated it on their private Stanford dataset, and vice versa [24]. However, they did not achieve better results with this approach. In contrast, we showed that obtaining better results on one dataset with the same approach is possible. Furthermore, training detectors on a large variety of seizures from a large number of patients may boost the robustness of the detectors, allowing them to be deployed effectively in clinical practice.
As we will explain in the next section, the models proposed in this paper contain a small number of parameters compared to the models proposed in Saab et al., therefore, they are less prone to overfitting and are better able to generalize across datasets.
Channel-, segment-, and EEG-level results trained and tested on the CHB-MIT dataset. Dataset Model W Channel-level Segment-level EEG-level ECE ACC BAC SEN SPE F1 ECE ACC BAC SEN SPE F1 SEN PRE aFPR/h mFPR/h Offset CHB-MIT Paediatric scalp EEG 1D CNN-SM 3 0.259 0.617 0.756 0.569 0.942 0.649 0.122 0.789 0.801 0.804 0.798 0.789 0.515 0.042 2.322 0.825 -16.875 5 0.181 0.669 0.763 0.56 0.966 0.668 0.105 0.814 0.824 0.762 0.887 0.808 0.509 0.041 2.371 1 -15.750 10 0.126 0.786 0.816 0.743 0.889 0.79 0.118 0.874 0.841 0.745 0.936 0.867 0.509 0.037 2.588 0.875 -15.750 20 0.129 0.777 0.78 0.592 0.969 0.758 0.362 0.921 0.838 0.699 0.976 0.910 0.509 0.040 2.433 0.875 -21.750 CHB-MIT Paediatric scalp EEG 1D CNN-BM 3 0.269 0.568 0.74 0.51 0.97 0.601 0.117 0.798 0.811 0.819 0.804 0.801 0.510 0.044 2.221 0.750 -7.250 5 0.205 0.62 0.739 0.494 0.984 0.616 0.126 0.811 0.816 0.700 0.932 0.808 0.516 0.028 3.420 0.881 3.500 10 0.137 0.724 0.782 0.635 0.928 0.733 0.100 0.875 0.831 0.686 0.976 0.862 0.503 0.033 2.894 1 -7.000 20 0.141 0.777 0.782 0.606 0.959 0.765 0.104 0.918 0.815 0.650 0.979 0.906 0.515 0.033 2.947 1 -22.500 CHB-MIT Paediatric scalp EEG 1D CNN-TRF-BM 3 0.25 0.582 0.747 0.528 0.966 0.617 0.258 0.833 0.847 0.808 0.886 0.837 0.577 0.214 0.101 0 9.750 5 0.095 0.742 0.808 0.666 0.95 0.755 0.256 0.822 0.824 0.715 0.932 0.819 0.613 0.088 0.408 0 3.625 10 0.205 0.663 0.748 0.515 0.981 0.649 0.104 0.879 0.837 0.698 0.976 0.866 0.515 0.367 0.108 0 -3.375 20 0.153 0.755 0.756 0.534 0.978 0.733 0.334 0.929 0.847 0.711 0.982 0.920 0.568 0.478 0.041 0 1
4.5 Complexity of Seizure Detectors
Most seizure detectors proposed in the literature do not perform channel-level detection and proceed to segment-level detection directly. The main innovation in those studies lies in improving the deep neural networks used for segment-level classification. These deep neural networks typically contain numerous layers (often 10+) and millions of parameters, which require substantial computational power for training. Moreover, such networks tend to overfit specific datasets, leading to poor generalization. We explore whether deeper models lead to better seizure detection performance.
In Table 4.5, we list different deep learning systems and provide information about their design and seizure detection performance. These neural networks for seizure detectors contain many layers, ranging between 2 and 709, and contain 7,600 to 138 million parameters. The inputs to those models also vary significantly, ranging from 5,888 to 228,000 input data points. In contrast, the three proposed seizure detectors only require between 384 to 2,560 input data points for window lengths varying from 5s to 20s. Moreover, the models contain 7 to 15 layers, with 0.16 to 3.5 million parameters for the CNN and CNN-TRF models. The input size, number of layers, and parameters for the proposed models are much smaller than for most of the existing models listed in Table 4.5.
Next, we examined the correlation between model size and performance. The proposed seizure detector models reported higher SEN and lower FPR/h than most models with more parameters and layers. The AUC, ACC, BAC, and F1 were comparable, while the SPE was poorer in our model. However, SPE is only computed in segment-level classification, which is not an EEG-level detection metric. Moreover, the proposed models obtained better AUPRC, SEN, and FPR/h than most existing models with fewer parameters and layers.
Overall, the proposed models outshine models with vastly more parameters, which suggests that designing ever-bigger neural networks for seizure detection may not be a fruitful avenue for research. Instead, alternative pipelines with substantially fewer parameters may perform comparably to the state-of-the-art or even better. In this study, we demonstrated that by first detecting seizures at individual channels, one could vastly reduce the number of parameters while achieving the same or increased level of performance.
Deep learning models in the literature in terms of complexity and performance. Author Model Layers Parameters (in millions) Input Size AUC AUPRC ACC BAC SEN SPE PRE F1 FPR/h Asif et al. [54] SeizureNet 133 45.94 150,528 - - - - - - - 0.896 - Raghu et al. [23] AlexNet 25 62 51,529 - - 0.768 - - - - - - VGG16 41 138 50,176 - - 0.833 - - - - - - VGG19 47 138 50,176 - - 0.818 - - - - - - SqueezeNet 68 1.2 51,529 - - 0.851 - - - - - - GoogleNet 144 7 50,176 - - 0.745 - - - - - - Inceptionv3 316 24 89,401 - - 0.883 - - - - - - DenseNet201 709 20 50,176 - - 0.851 - - - - - - ResNet18 72 11 50,176 - - 0.862 - - - - - - ResNet50 177 23 50,176 - - 0.862 - - - - - - ResNet101 347 29.4 50,176 - - 0.863 - - - - - - Covert et al. [28] TGCN 30 5.5 415,107 0.926 - - 0.809 0.648 0.970 - - - Yuan et al. [55] CNN 4 0.04 17,664 0.957 0.906 0.944 - - - - 0.853 - Zhou et al. [56] CNN 3 0.4 5,888 - - 0.595 0.595 0.618 0.572 - - - Saab et al. [24] ChronoNet 10 12.7 45,600 0.930 - - - - - - 0.770 0.100 Emami et al. [25] VGG16 41 138 50,176 - - - - 0.740 - - - 0.200 Ansari et al. [20] CNN 23 0.0076 54,000 0.830 - - - 0.770 - - - 0.900 Gomez et al. [15] CNN 12 0.314 21,504 - 0.440 0.929 0.731 0.531 0.931 0.514 0.461 7.800 Current study CNN 7 0.16 384 - - - - 0.713 - 0.490 0.581 0 CNN 7 0.26 640 - - - - 0.701 - 0.491 0.578 0 CNN 7 0.52 1,280 - - - - 0.701 - 0.512 0.592 0 CNN 7 1 2,560 - - - - 0.708 - 0.490 0.579 0 Current study CNN-TRF 15 2.3 384 - - - - 0.772 - 0.429 0.552 0 CNN-TRF 15 2.5 640 - - - - 0.653 - 0.476 0.551 0 CNN-TRF 15 2.8 1,280 - - - - 0.671 - 0.534 0.595 0 CNN-TRF 15 3.5 2,560 - - - - 0.655 - 0.520 0.580 0
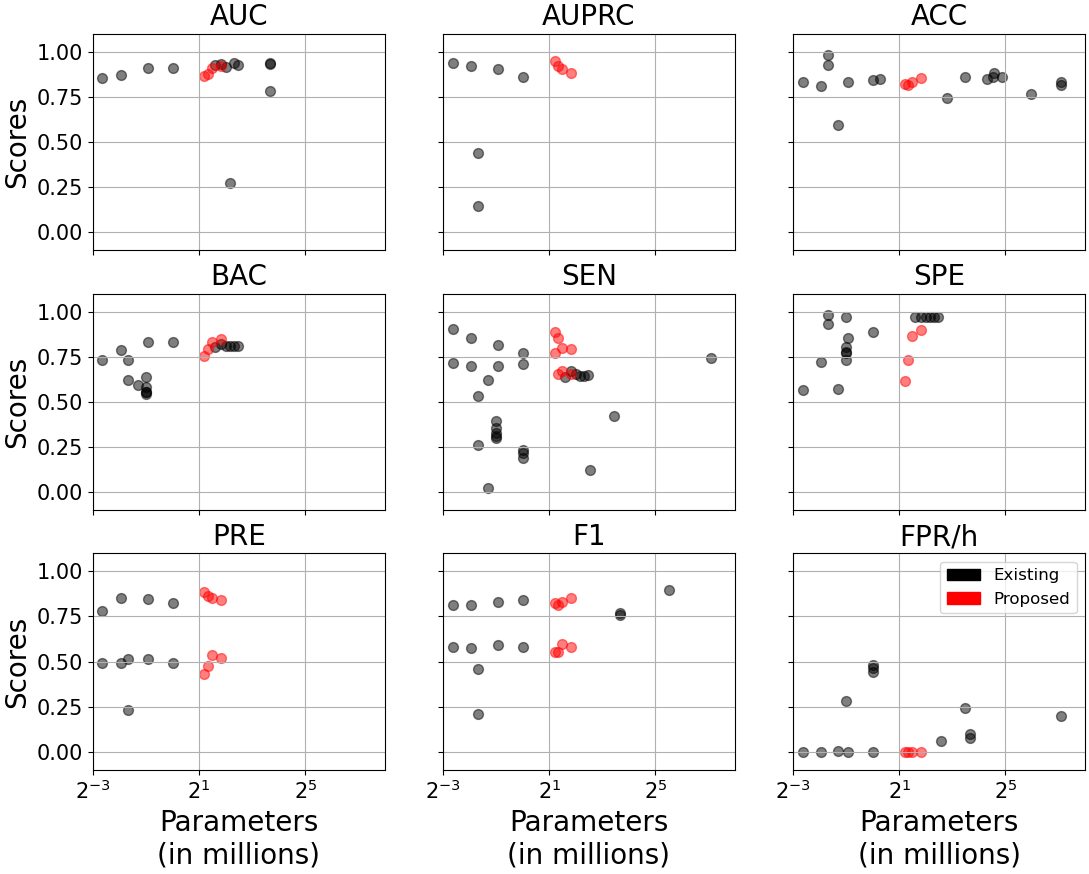
(a) Performance vs. number of parameters.
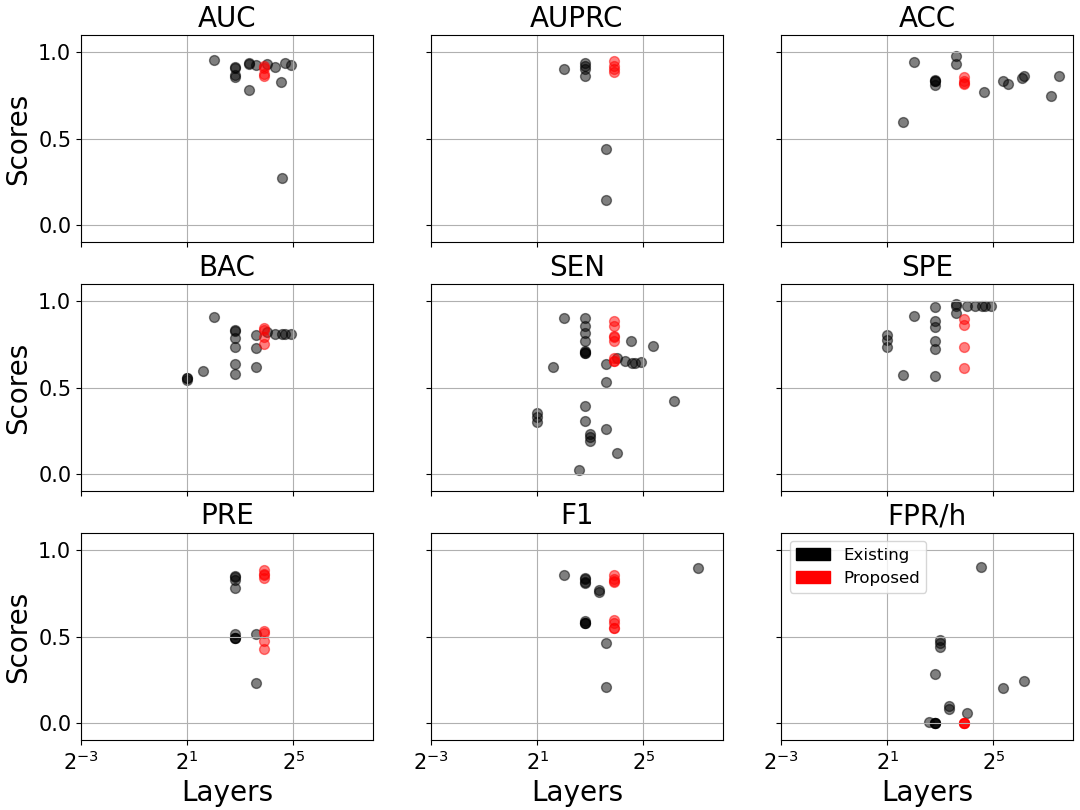
(b) Performance vs. number of layers.
4.6 Benefits of Channel-level Detection
In this study, we proposed to detect seizures starting at channel-level. However, many seizure detectors in the literature detect seizures directly from segment-level. This approach usually requires a fixed number of channels, an important limiting factor for clinical practice as the number of channels may vary. Moreover, this approach may be strongly overfitted to a particular EEG electrode configuration and dataset. Here, we refer to seizure detector pipelines that detect seizures starting from channel-level as 1D models, while detectors that detect seizures starting from segment-level as 2D models.
To further evaluate the benefits of the three proposed 1D seizure detectors, we designed two 2D seizure detectors that directly perform segment-level classification from the EEG signals. Those 2D models are identical to the 1D ones, except that the 1D convolutional filters are replaced with 2D filters. We optimized the 2D CNNs on the TUH SZ dataset with the SM and BM loss, leading to the two different 2D seizure detectors. As all the scalp EEGs in the TUH-SZ dataset contain 20 common channels, we fixed the number of channels to 20. Hence, the input of the 2D segment-level CNN models has dimension , where is the window length. Finally, we combined the 2D segment-level detectors with the same EEG-level pipeline to compute the EEG-level detections.
We trained and evaluated the 2D models on the TUH-SZ dataset for the segment- and EEG-level seizure detection. Next, we deployed the 2D models trained on the TUH-SZ dataset to detect seizures in the CHB-MIT dataset; in this way, we evaluate the model’s generalizability. We only consider the CHB-MIT dataset for the assessment, as it is the only dataset with EEGs with the same 20 common channels. Finally, we trained and evaluated the 2D models on the CHB-MIT dataset, and compared them to the models trained on the TUH-SZ dataset.
We display the segment- and EEG-level results for the TUH-SZ and CHB-MIT datasets in Table 4.6, where the EEG-level results are computed by the MOES metric. When trained and evaluated on the TUH-SZ dataset, the 2D models attain much weaker results for both segment- and EEG-level classification than the 1D models (see Table 3.3 for comparison). Those models also perform poorly on the CHB-MIT dataset, leading to substantially lower SEN and PRE scores than the 1D models. Moreover, when the 2D models were trained and evaluated on the CHB-MIT dataset, we obtained the worst results thus far, with PRE lower than 5% for all cases. These numerical results are in line with many 2D models reported in the literature [56]. Overall, 2D models underperform compared to the 1D models by a considerable margin. In conclusion, the channel-level detector appears vital for superior generalization performance.
Results of 2D seizure detectors on the TUH-SZ and CHB-MIT dataset. Testing Dataset Training Dataset Model W Segment-level EEG-level ECE ACC BAC SEN SPE F1 F1 SEN PRE aFPR/h mFPR/h Offset TUH-SZ EEG Adult TUH-SZ 2D CNN-SM 3 0.106 0.769 0.772 0.717 0.827 0.770 0.544 0.659 0.463 2.555 0 9.125 5 0.119 0.791 0.769 0.672 0.866 0.788 0.538 0.674 0.448 2.764 0 7.000 10 0.149 0.849 0.751 0.566 0.937 0.842 0.530 0.656 0.444 3.020 0 7.500 20 0.160 0.859 0.734 0.534 0.933 0.854 0.510 0.521 0.499 1.741 0 3.250 TUH-SZ EEG Adult TUH-SZ 2D CNN-BM 3 0.106 0.801 0.805 0.753 0.857 0.801 0.574 0.659 0.509 2.095 0 -5.250 5 0.119 0.816 0.791 0.678 0.904 0.812 0.584 0.668 0.519 2.068 0 -7.875 10 0.149 0.857 0.782 0.635 0.929 0.854 0.559 0.658 0.486 2.402 0 -3.750 20 0.160 0.868 0.711 0.468 0.955 0.856 0.528 0.506 0.553 1.499 0 5.250 CHB-MIT Paediatric scalp EEG CHB-MIT 2D CNN-SM 3 0.173 0.717 0.739 0.681 0.797 0.71 0.078 0.520 0.042 2.221 0.134 -16.875 5 0.143 0.732 0.748 0.638 0.858 0.714 0.079 0.503 0.043 3.420 0.520 -17.250 10 0.122 0.782 0.755 0.639 0.871 0.765 0.076 0.503 0.041 2.894 0.201 -16.000 20 0.168 0.872 0.786 0.636 0.936 0.861 0.086 0.509 0.047 2.947 0.418 -16.250 CHB-MIT Paediatric scalp EEG CHB-MIT 2D CNN-BM 3 0.165 0.716 0.732 0.687 0.776 0.707 0.082 0.510 0.044 2.221 0.750 -7.250 5 0.145 0.733 0.748 0.655 0.841 0.716 0.061 0.505 0.032 2.951 0.769 -4.750 10 0.112 0.779 0.75 0.633 0.868 0.759 0.063 0.508 0.034 2.892 1.023 -7.375 20 0.16 0.868 0.783 0.635 0.932 0.858 0.067 0.510 0.036 2.692 0.848 -22.250 CHB-MIT Paediatric scalp EEG TUH-SZ 2D CNN-SM 3 0.233 0.584 0.662 0.365 0.959 0.547 0.303 0.439 0.231 0.391 0.040 -2.737 5 0.159 0.677 0.680 0.429 0.931 0.646 0.292 0.626 0.190 1.372 0.997 -4.658 10 0.148 0.744 0.714 0.290 0.981 0.690 0.383 0.536 0.298 0.821 0.421 -2.447 20 0.083 0.843 0.658 0.265 0.991 0.798 0.370 0.376 0.365 0.113 0 -5.184 CHB-MIT Paediatric scalp EEG TUH-SZ 2D CNN-BM 3 0.357 0.515 0.613 0.239 0.987 0.451 0.426 0.368 0.505 0.129 0 1.526 5 0.383 0.524 0.541 0.084 0.998 0.416 0.115 0.078 0.218 0.072 0 -0.395 10 0.156 0.750 0.648 0.307 0.989 0.696 0.441 0.524 0.380 0.396 0.050 -0.737 20 0.068 0.853 0.691 0.341 0.987 0.817 0.474 0.461 0.488 0.183 0.026 -8.526
5 Conclusions and Future work
This study proposed patient-independent seizure detectors that identify seizures on three EEG scales: channel-, segment- and EEG-level. Firstly, the channel-level detectors detect seizures in single-channel segments through a CNN-based deep learning model. Next, we perform segment-level detection based on statistical features extracted from the channel-level outputs based on different scalp regions. At last, we apply post-processing filters to the segment-level outputs to determine any detected seizures’ start and end times.
We trained and tested the proposed detectors on the TUH-SZ scalp EEG dataset before evaluating the pretrained detectors on five independent scalp EEG and iEEG datasets. Also, we introduced MOES to address some shortcomings of the existing EEG-level seizure detection metrics. To the author’s knowledge, this study is one of the first to incorporate a channel-level detector within the seizure detection system [30]. Moreover, we implemented a pipeline that can detect EEG seizures with any number of electrodes. Furthermore, we demonstrated that a channel-level detector is essential for reliable seizure detection and boosting the generalization performance. Finally, the proposed seizure detector is computationally efficient, with a computation time of less than 15s for a 30 minutes EEG. Hence, the detector may help accelerate and improve EEG annotation in clinical practice.
However, as the seizure detector is based on deep learning, it is nearly impossible to identify the exact features or motifs that contribute significantly to the discrimination process. In future work, we can perform feature extraction before deploying the deep learning models. For instance, we can decompose the time series into different frequency bands. This way, we may understand the contribution and significance of each frequency component of the EEG signals.
Additionally, we will address the problem of detecting artifacts before seizure detection [45]. The artifact detector will be designed to reduce FPR/h and improve the PRE of the seizure detector. Consequently, it can reject artifacts without eliminating important cerebral signals, such as slow waves, sharp waves, and seizures in EEGs. Lastly, we will look into newer and more powerful supervised classification algorithms such as finite element machine and dynamic ensemble algorithm [57, 58].
Conflicts of Interest
The authors have no disclosures to report.
References
- [1] V. K. Jirsa, W. C. Stacey, P. P. Quilichini, A. I. Ivanov and C. Bernard, On the nature of seizure dynamics, Brain 137(8) (2014) 2210–2230.
- [2] V. D. Nunes, L. Sawyer, J. Neilson, G. Sarri and J. H. Cross, Diagnosis and management of the epilepsies in adults and children: summary of updated nice guidance, Bmj 344 (2012).
- [3] S. Jenssen, E. J. Gracely and M. R. Sperling, How long do most seizures last? a systematic comparison of seizures recorded in the epilepsy monitoring unit, Epilepsia 47(9) (2006) 1499–1503.
- [4] M. M. Goldenberg, Overview of drugs used for epilepsy and seizures: etiology, diagnosis, and treatment, Pharmacy and Therapeutics 35(7) (2010) p. 392.
- [5] W. H. Organization, G. C. against Epilepsy, P. for Neurological Diseases, N. W. H. Organization), I. B. for Epilepsy, W. H. O. D. of Mental Health, S. Abuse, I. B. of Epilepsy and I. L. against Epilepsy, Atlas: epilepsy care in the world (World Health Organization, 2005).
- [6] F. F. Ferri, Ferri’s Clinical Advisor 2020 E-Book: 5 Books in 1 (Elsevier Health Sciences, 2019).
- [7] A. T. Berg, Risk of recurrence after a first unprovoked seizure, Epilepsia 49 (2008) 13–18.
- [8] F. Mormann, R. G. Andrzejak, C. E. Elger and K. Lehnertz, Seizure prediction: the long and winding road, Brain 130(2) (2007) 314–333.
- [9] I. Geut, S. Weenink, I. Knottnerus and M. J. van Putten, Detecting interictal discharges in first seizure patients: ambulatory eeg or eeg after sleep deprivation?, Seizure 51 (2017) 52–54.
- [10] V. Shah, M. Golmohammadi, S. Ziyabari, E. Von Weltin, I. Obeid and J. Picone, Optimizing channel selection for seizure detection, 2017 IEEE Signal Processing in Medicine and Biology Symposium (SPMB), , IEEE2017, pp. 1–5.
- [11] K. Ayodele, W. Ikezogwo, M. Komolafe and P. Ogunbona, Supervised domain generalization for integration of disparate scalp eeg datasets for automatic epileptic seizure detection, Computers in Biology and Medicine 120 (2020) p. 103757.
- [12] S. Roy, I. Kiral, M. Mirmomeni, T. Mummert, A. Braz, J. Tsay, J. Tang, U. Asif, T. Schaffter, M. E. Ahsen et al., Evaluation of artificial intelligence systems for assisting neurologists with fast and accurate annotations of scalp electroencephalography data, EBioMedicine (2021) p. 103275.
- [13] F. Fürbass, P. Ossenblok, M. Hartmann, H. Perko, A. Skupch, G. Lindinger, L. Elezi, E. Pataraia, A. Colon, C. Baumgartner et al., Prospective multi-center study of an automatic online seizure detection system for epilepsy monitoring units, Clinical Neurophysiology 126(6) (2015) 1124–1131.
- [14] A. Mansouri, S. P. Singh and K. Sayood, Online eeg seizure detection and localization, Algorithms 12(9) (2019) p. 176.
- [15] C. Gómez, P. Arbeláez, M. Navarrete, C. Alvarado-Rojas, M. Le Van Quyen and M. Valderrama, Automatic seizure detection based on imaged-eeg signals through fully convolutional networks, Scientific reports 10(1) (2020) 1–13.
- [16] O. Faust, U. R. Acharya, H. Adeli and A. Adeli, Wavelet-based eeg processing for computer-aided seizure detection and epilepsy diagnosis, Seizure 26 (2015) 56–64.
- [17] H. Adeli, Z. Zhou and N. Dadmehr, Analysis of eeg records in an epileptic patient using wavelet transform, Journal of neuroscience methods 123(1) (2003) 69–87.
- [18] S. Ghosh-Dastidar, H. Adeli and N. Dadmehr, Mixed-band wavelet-chaos-neural network methodology for epilepsy and epileptic seizure detection, IEEE transactions on biomedical engineering 54(9) (2007) 1545–1551.
- [19] M. Savadkoohi, T. Oladunni and L. Thompson, A machine learning approach to epileptic seizure prediction using electroencephalogram (eeg) signal, Biocybernetics and Biomedical Engineering 40(3) (2020) 1328–1341.
- [20] A. H. Ansari, P. J. Cherian, A. Caicedo, G. Naulaers, M. De Vos and S. Van Huffel, Neonatal seizure detection using deep convolutional neural networks, International journal of neural systems 29(04) (2019) p. 1850011.
- [21] X. Hu, S. Yuan, F. Xu, Y. Leng, K. Yuan and Q. Yuan, Scalp eeg classification using deep bi-lstm network for seizure detection, Computers in Biology and Medicine 124 (2020) p. 103919.
- [22] A. Bhattacharya, T. Baweja and S. Karri, Epileptic seizure prediction using deep transformer model, International Journal of Neural Systems (2021) p. 2150058.
- [23] S. Raghu, N. Sriraam, Y. Temel, S. V. Rao and P. L. Kubben, Eeg based multi-class seizure type classification using convolutional neural network and transfer learning, Neural Networks 124 (2020) 202–212.
- [24] K. Saab, J. Dunnmon, C. Ré, D. Rubin and C. Lee-Messer, Weak supervision as an efficient approach for automated seizure detection in electroencephalography, NPJ digital medicine 3(1) (2020) 1–12.
- [25] A. Emami, N. Kunii, T. Matsuo, T. Shinozaki, K. Kawai and H. Takahashi, Seizure detection by convolutional neural network-based analysis of scalp electroencephalography plot images, NeuroImage: Clinical 22 (2019) p. 101684.
- [26] H. S. Nogay and H. Adeli, Detection of epileptic seizure using pretrained deep convolutional neural network and transfer learning, European neurology 83(6) (2020) 602–614.
- [27] S. Santaniello, S. P. Burns, A. J. Golby, J. M. Singer, W. S. Anderson and S. V. Sarma, Quickest detection of drug-resistant seizures: An optimal control approach, Epilepsy & Behavior 22 (2011) S49–S60.
- [28] I. C. Covert, B. Krishnan, I. Najm, J. Zhan, M. Shore, J. Hixson and M. J. Po, Temporal graph convolutional networks for automatic seizure detection, Machine Learning for Healthcare Conference, , PMLR2019, pp. 160–180.
- [29] S. Roy, I. Kiral-Kornek and S. Harrer, Chrononet: a deep recurrent neural network for abnormal eeg identification, Conference on Artificial Intelligence in Medicine in Europe, , Springer2019, pp. 47–56.
- [30] Y. Lu, Y. Ma, C. Chen and Y. Wang, Classification of single-channel eeg signals for epileptic seizures detection based on hybrid features, Technology and Health Care 26(S1) (2018) 337–346.
- [31] U. R. Acharya, S. L. Oh, Y. Hagiwara, J. H. Tan and H. Adeli, Deep convolutional neural network for the automated detection and diagnosis of seizure using eeg signals, Computers in biology and medicine 100 (2018) 270–278.
- [32] G. Liu, L. Tian and W. Zhou, Patient-independent seizure detection based on channel-perturbation convolutional neural network and bidirectional long short-term memory, International Journal of Neural Systems 32(06) (2022) p. 2150051.
- [33] V. Shah, M. Golmohammadi, I. Obeid and J. Picone, Objective evaluation metrics for automatic classification of eeg events, Biomedical Signal Processing (2021) 223–255.
- [34] E. Reus, G. Visser, J. van Dijk and F. Cox, Automated seizure detection in an emu setting: are software packages ready for implementation?, Seizure (2022).
- [35] V. Shah, E. Von Weltin, S. Lopez, J. R. McHugh, L. Veloso, M. Golmohammadi, I. Obeid and J. Picone, The temple university hospital seizure detection corpus, Frontiers in neuroinformatics 12 (2018) p. 83.
- [36] A. Shoeb, H. Edwards, J. Connolly, B. Bourgeois, S. T. Treves and J. Guttag, Patient-specific seizure onset detection, Epilepsy & Behavior 5(4) (2004) 483–498.
- [37] N. Stevenson, K. Tapani, L. Lauronen and S. Vanhatalo, A dataset of neonatal eeg recordings with seizure annotations, Scientific data 6(1) (2019) 1–8.
- [38] A. Burrello, K. Schindler, L. Benini and A. Rahimi, Hyperdimensional computing with local binary patterns: one-shot learning of seizure onset and identification of ictogenic brain regions using short-time ieeg recordings, IEEE Transactions on Biomedical Engineering 67(2) (2019) 601–613.
- [39] J. B. Wagenaar, B. H. Brinkmann, Z. Ives, G. A. Worrell and B. Litt, A multimodal platform for cloud-based collaborative research, 2013 6th international IEEE/EMBS conference on neural engineering (NER), , IEEE2013, pp. 1386–1389.
- [40] A. Li, C. Huynh, Z. Fitzgerald, I. Cajigas, D. Brusko, J. Jagid, A. O. Claudio, A. M. Kanner, J. Hopp, S. Chen et al., Neural fragility as an eeg marker of the seizure onset zone, Nature neuroscience 24(10) (2021) 1465–1474.
- [41] J. Thomas, P. Thangavel, W. Y. Peh, J. Jing, R. Yuvaraj, S. S. Cash, R. Chaudhari, S. Karia, R. Rathakrishnan, V. Saini et al., Automated adult epilepsy diagnostic tool based on interictal scalp electroencephalogram characteristics: A six-center study, International Journal of Neural Systems (2021) p. 2050074.
- [42] P. Thangavel, J. Thomas, W. Y. Peh, J. Jing, R. Yuvaraj, S. S. Cash, R. Chaudhari, S. Karia, R. Rathakrishnan, V. Saini et al., Time–frequency decomposition of scalp electroencephalograms improves deep learning-based epilepsy diagnosis, International Journal of Neural Systems (2021) p. 2150032.
- [43] W. Y. Peh, J. Thomas, E. Bagheri, R. Chaudhari, S. Karia, R. Rathakrishnan, V. Saini, N. Shah, R. Srivastava, Y.-L. Tan et al., Multi-center validation study of automated classification of pathological slowing in adult scalp electroencephalograms via frequency features, International Journal of Neural Systems (2021) p. 2150016.
- [44] T. Joo, U. Chung and M.-G. Seo, Being bayesian about categorical probability, International Conference on Machine Learning, , PMLR2020, pp. 4950–4961.
- [45] W. Y. Peh, Y. Yao and J. Dauwels, Transformer convolutional neural networks for automated artifact detection in scalp eeg, 2022 44th Annual International Conference of the IEEE Engineering in Medicine & Biology Society (EMBC), , IEEE2022, pp. 3599–3602.
- [46] C. Guo, G. Pleiss, Y. Sun and K. Q. Weinberger, On calibration of modern neural networks, International Conference on Machine Learning, , PMLR2017, pp. 1321–1330.
- [47] P. Afra, C. C. Jouny and G. K. Bergey, Duration of complex partial seizures: an intracranial eeg study, Epilepsia 49(4) (2008) 677–684.
- [48] M. J. Cook, T. J. O’Brien, S. F. Berkovic, M. Murphy, A. Morokoff, G. Fabinyi, W. D’Souza, R. Yerra, J. Archer, L. Litewka et al., Prediction of seizure likelihood with a long-term, implanted seizure advisory system in patients with drug-resistant epilepsy: a first-in-man study, The Lancet Neurology 12(6) (2013) 563–571.
- [49] A. O’Shea, G. Lightbody, G. Boylan and A. Temko, Neonatal seizure detection from raw multi-channel eeg using a fully convolutional architecture, Neural Networks 123 (2020) 12–25.
- [50] B. H. Brinkmann, J. Wagenaar, D. Abbot, P. Adkins, S. C. Bosshard, M. Chen, Q. M. Tieng, J. He, F. Muñoz-Almaraz, P. Botella-Rocamora et al., Crowdsourcing reproducible seizure forecasting in human and canine epilepsy, Brain 139(6) (2016) 1713–1722.
- [51] A. Sierra-Marcos, M. L. Scheuer and A. O. Rossetti, Seizure detection with automated eeg analysis: a validation study focusing on periodic patterns, Clinical neurophysiology 126(3) (2015) 456–462.
- [52] N. Rommens, E. Geertsema, L. J. Holleboom, F. Cox and G. Visser, Improving staff response to seizures on the epilepsy monitoring unit with online eeg seizure detection algorithms, Epilepsy & Behavior 84 (2018) 99–104.
- [53] J. Koren, S. Hafner, M. Feigl and C. Baumgartner, Systematic analysis and comparison of commercial seizure-detection software, Epilepsia 62(2) (2021) 426–438.
- [54] U. Asif, S. Roy, J. Tang and S. Harrer, Seizurenet: Multi-spectral deep feature learning for seizure type classification, Machine Learning in Clinical Neuroimaging and Radiogenomics in Neuro-oncology (2020) 77–87.
- [55] Y. Yuan, G. Xun, K. Jia and A. Zhang, A multi-view deep learning framework for eeg seizure detection, IEEE journal of biomedical and health informatics 23(1) (2018) 83–94.
- [56] M. Zhou, C. Tian, R. Cao, B. Wang, Y. Niu, T. Hu, H. Guo and J. Xiang, Epileptic seizure detection based on eeg signals and cnn, Frontiers in neuroinformatics 12 (2018) p. 95.
- [57] D. R. Pereira, M. A. Piteri, A. N. Souza, J. P. Papa and H. Adeli, Fema: a finite element machine for fast learning, Neural Computing and Applications 32(10) (2020) 6393–6404.
- [58] K. M. R. Alam, N. Siddique and H. Adeli, A dynamic ensemble learning algorithm for neural networks, Neural Computing and Applications 32(12) (2020) 8675–8690.