An overdensity of red galaxies around the hyperluminous dust-obscured quasar W18354355 at
Abstract
Wide-field Infrared Survey Explorer all-sky survey has discovered a new population of hot dust-obscured galaxies (Hot DOGs), which has been confirmed to be dusty quasars. Previous statistical studies have found significant overdensities of sub-millimeter and mid-IR selected galaxies around Hot DOGs, indicating they may reside in dense regions. Here we present the near-infrared ( and bands) observations over a field centered on a Hot DOG W18354355 at using the wide-field infrared camera on the Palomar 200-inch telescope. We use the color criterion for objects with , to select Distant Red Galaxies (DRGs). We find a significant excess of number density of DRGs in W18354355 field compared to three control fields, by a factor of about 2. The overdensity of red galaxies around W18354355 are consistent with the multi-wavelength environment of Hot DOGs, suggesting that Hot DOGs may be a good tracer for dense regions at high redshift. We find that W18354355 do not reside in the densest region of the dense environment traced by itself. A possible scenario is that W18354355 is undergoing merging process, which lowers the local number density of galaxies in its surrounding region.
1 Introduction
Protoclusters are progenitors of present-day massive clusters. The study of protoclusters can place constraints on cosmological simulation (Chiang et al., 2013; Muldrew et al., 2015). Moreover, protoclusters are excellent laboratories to study the influence of the environment on the formation and evolution of galaxies at high redshift (Chiang et al., 2017). However, it is very difficult and inefficient to directly search for protoclusters at high redshift. It is necessary to find specific sources which can trace dense regions. Luminous high-redshift radio galaxies are believed to be the ancestors of local brightest cluster galaxies (Miley & De Breuck, 2008; Collet et al., 2015). They have been successfully used as probes of high-redshift protoclusters (Venemans et al., 2002, 2005, 2007; Hatch et al., 2011; Mawatari et al., 2012; Hayashi et al., 2012; Wylezalek et al., 2013; Cooke et al., 2014).
Intensive studies focused on unobscured quasars at high redshift in order to investigate whether they can also trace dense regions. However, those studies did not reach a consistent conclusion. Some studies found that quasars are in dense environments (Kashikawa et al., 2007; Stevens et al., 2010; Falder et al., 2011; Trainor & Steidel, 2012; Husband et al., 2013; Morselli et al., 2014; Hennawi et al., 2015; García-Vergara et al., 2019), while others found that the environments of quasars are not overdense (Mazzucchelli et al., 2017; Kikuta et al., 2017; Uchiyama et al., 2019; Yoon et al., 2019; Uchiyama et al., 2020).
Contrary to the inconsistent conclusions of the environmental studies of unobscured quasars at high redshift, luminous dusty galaxies have been found to be strong clustering and have been suggested to reside in dense environments (Scott et al., 2006; Brodwin et al., 2008; Chapman et al., 2009; Cooray et al., 2010; Hickox et al., 2012). According to supermassive black holes (SMBHs) and their host galaxies co-evolution scenario (Hopkins et al., 2008; Alexander & Hickox, 2012), these dusty galaxies represent a starburst-dominated or starburst-obscured AGN composite phase.
Based on “W1W2-dropout” method, a new population of hyperluminous, hot dust-obscured galaxies were discovered using the Wide-field Infrared Survey Explorer (WISE) and were called as Hot DOGs (Eisenhardt et al., 2012; Wu et al., 2012). These galaxies are well detected in the 12 (W3) and/or 22 (W4) bands, but are very faint or even undetected in the 3.4 (W1) and 4.6 (W2) bands. Follow-up multiwavelength studies have revealed that Hot DOGs are extremely luminous, merger-driven, heavily dust-obscured quasars at high redshift (Piconcelli et al., 2015; Tsai et al., 2015; Assef et al., 2016; Fan et al., 2016a, b, 2017, 2018b, 2020; Ricci et al., 2017; Zappacosta et al., 2018). Previous statistical studies have found significant overdensities of mid-IR-selected and submm-selected galaxies around Hot DOGs, indicating Hot DOGs may reside in dense regions (Jones et al., 2014; Fan et al., 2017; Assef et al., 2015).
In this work, we use Wide-field infrared camera (WIRC) equipped on Palomar 200-inch telescope (P200) to study the environment of a Hot DOG, W18354355 (hereafter, W1835) at . Fan et al. (2016b) performed the SED decomposition of this source, and found that about 4/5 of its total luminosity attribute to the obscured quasar activity and the rest is from starburst. Moreover, based on XMM-Newton X-ray observations, Piconcelli et al. (2015) found that W1835 has a reflection-dominated spectrum due to Compton-thick absorption. Since overdensities of NIR-selected red galaxies have been shown to be good tracers of potential massive structures at (Kajisawa et al., 2006; Kodama et al., 2007; Uchimoto et al., 2012), we perform a study on environment of W1835 by quantifying the density of its surrounding red galaxies.
The paper is structured as follows. In Section 2, we present the observation and data reduction. In Section 3, we describe the color criterion. Results and discussions are presented in Section 4 and Section 5, respectively. We give a brief summary in Section 6. Throughout this work, we use the Vega magnitude system and assume a flat CDM cosmology (Komatsu et al., 2011), with , and .
2 Observation and Data Reduction
The and -band imaging of W1835 field was observed with P200 WIRC. This camera is mounted at the prime focus of P200, providing a field-of-view (FOV) of 8.78.7 arcmin2. The WIRC was equipped with a 20482048 Hawaii-II HgCdTe detector with a pixel scale of about 0″.25. The observations took place on 2017 June 2. The total exposure times for and -bands are about 5.0 and 1.5 hours, respectively.
| Name | Redshift | FOV | Exp.time(hr) | PSF FWHM() |
|---|---|---|---|---|
| (arcmin2) | ||||
| W1835 + 4355 | 2.298 | 56.25 | 5.0 1.5 | 1.25 1.02 |
The raw data were preprocessed with overscan subtracted. The estimated dark current is about 0.26 e-/s and corrected for each science exposure. The “super” sky flats are constructed by combining all-night science frames and are then used for flat-fielding. The images after the flat-field correction are calibrated with the reference catalog of the Two Micron All-Sky Survey (2MASS). The astrometric accuracy relative to the 2MASS catalog is about 013 for band and 019 for band. The flux is calibrated in the Vega magnitude system. The calibrated frames are stacked to generate a deeper image for each band by using SWarp (Bertin et al., 2002). Before stacking, those frames with large seeing and bright sky background are removed. Final stacked images have the size of pixels2 and a linear pixel scale of 025, which provides an angular size of about 7.5 arcmin. Table 1 gives a summary of the observations.
The photometric catalog was generated from the stacked images. The FWHMs of the point spread function (PSF) are 125 and 102 in the and band, respectively. In order to measure the colors within the same aperture across two bands, the band image was convolved with a kernel to match the PSF of band image taken under the worst seeing. The PSF match was performed using photutils package in Python (Bradley et al., 2020). Photometry was performed by running SExtractor (Bertin & Arnouts, 1996) in dual-image mode. The band image was used for the source detection, while the band image and the convolved band image were used for photometry. For the color measurements in , we used aperture magnitude MAG_APER with aperture diameter. We adopted MAG_AUTO as the total band magnitude of detected objects. The limiting magnitudes of the and bands are 21.8 and 20.0 mag, respectively. Our source detection completeness in the band is 90% at mag and 50% at mag. Galactic extinction is estimated at the position of W1835, based on Schlafly & Finkbeiner (2011)111https://irsa.ipac.caltech.edu/applications/DUST/. All the magnitudes in the field are corrected for Galactic extinction. Figure 1 shows the composited color image of the W1835 field, where the blue, red, and green channels are , and and the average of these two images, respectively.

3 COLOR SELECTION CRITERION
Considering the rest-frame optical spectral features of red galaxies dominated by evolved stars, we can use the Balmer/4000Å break to select those galaxies. The Balmer break at 3646Å is due to electrons bound-free absorption, which is strongest in A class stars. The 4000Å break is due to absorption from ionized metals, which occurs in older stars (Hammer et al., 2017). Since these breaks enter between and bands at , a red color can be an effective criterion to select high-redshift galaxies. Following the criterion from Franx et al. (2003), we select objects with as distant red galaxies (DRGs). These galaxies may represent the progenitors of massive galaxies at the present day. Many DRGs have had follow-up spectroscopic observations and have been confirmed to be at (van Dokkum et al., 2003; Förster Schreiber et al., 2004; Reddy et al., 2005).
4 RESULTS
4.1 Color-Magnitude Diagram
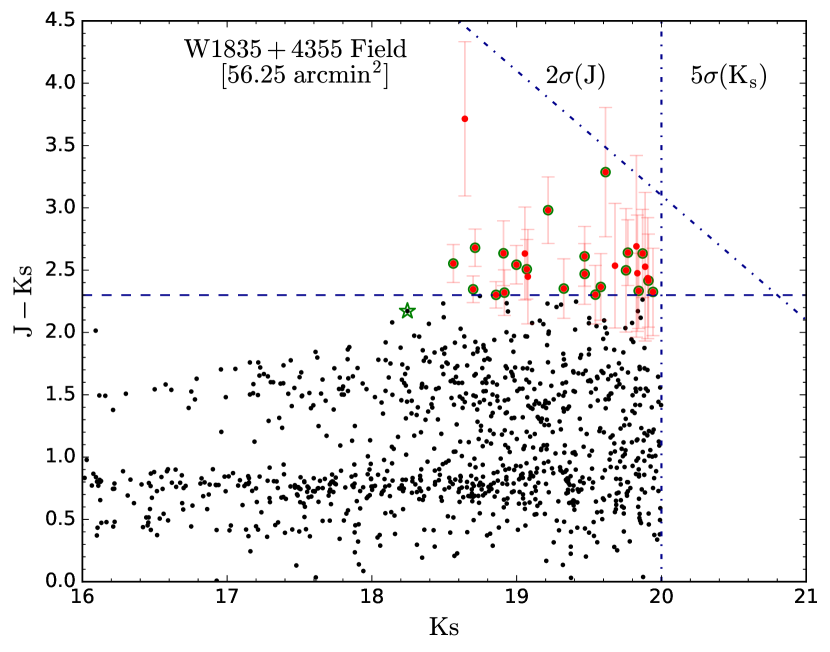
We use the limiting magnitude of the -band () to select DRGs down to the limiting magnitude of -band (), which is commonly used in previous studies of DRG selection (Kajisawa et al., 2006; Kodama et al., 2007). Figure 2 shows a vs color-magnitude diagram of sources in the W1835 field. DRGs are plotted as red filled circles. 29 sources are selected by using the color selection criterion. We perform a visual inspection of these sources to rule out possible spurious sources. We visually confirmed 21 sources, represented by green circles in Figure 2. Only the visually confirmed sources are used for the following analyses. We notice that although our selected DRGs are not a pure sample as many of them have color close to the selection limit (), this effect has been taken into account in the forthcoming results. The details can be found in Section 4.3.
4.2 Control Fields
| Field | Survey | Area | Limiting magnitudes |
|---|---|---|---|
| COSMOS | UltraVISTA | 1.62 deg2 | 23.4 22.0 |
| GOODS-N | MODS | 103 arcmin2 | 23.9 22.8 |
| GOODS-S | ESO/GOODS | 173 arcmin2 | 24.0 22.5 |
We use the deep NIR data from three surveys: UltraVISTA in the Cosmic Evolution Survey (COSMOS) field (McCracken et al., 2012; Muzzin et al., 2013), MOIRCS Deep Survey (MODS) in the Great Observatories Origins Survey Northern (GOODS-N) (Kajisawa et al., 2011) and ESO/GOODS in Southern (GOODS-S) field (Retzlaff et al., 2010). All these fields have -selected NIR color catalogs. The depths of the -band of three control fields are much deeper than that of the W1835 field. The completeness of three control fields at is 100%. The details of each field are listed in Table 2.
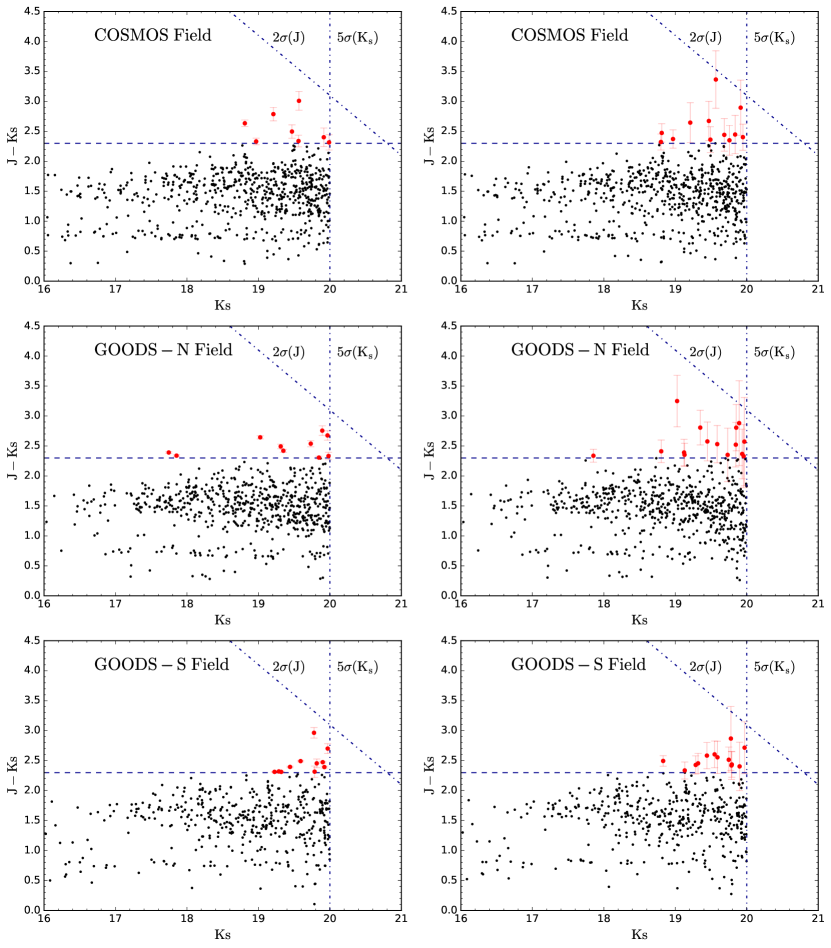
We directly use the catalogs of the three control fields and select DRGs using the same color criteria and limiting magnitudes obtained in the W1835 field. We plot color-magnitude diagrams of the three control fields, respectively. The areas of the three control fields are larger than that of the W1835 field. In order to have a direct comparison with the W1835 field, we randomly selected an area of 56.25 arcmin2 in each control field and select DRGs in these areas. For each control field, this step is performed several times, resulting in a distribution of the number of DRGs which is found to approximately follow the Poisson distribution. The median numbers of DRGs are 8, 10, 11 for COSMOS, GOODS-N and GOODS-S, respectively, which are significantly less than that in the W1835 field. In the left panel of Figure 3, we plot the raw color-magnitude diagrams of three control fields from their catalogs.
We notice that three control fields all show smaller magnitude errors compared to the W1835 field data at any given magnitude. The photometric error has effect on the color selection. The sources may scatter into or out of the selection region, causing contamination or missing sources in DRG selection. This effect could be different when the magnitude error is different. To make the W1835 field and control fields data share the same effect, we match the noise of the control fields to the W1835 field data. We fit the magnitude-magnitude error distribution of the W1835 field data and match the magnitude of the control fields to the corresponding magnitude error based on the fitting curve. We plot the matched color-magnitude diagrams of three control fields in the right panel of Figure 3. To directly show the effect of photometric error on color selection, the magnitudes of the sources in the right panel are scattered based on the matched magnitude errors. The detail of analyzing the effect of photometric error on color selection results is described in Section 4.3. We show the result of a single Monte Carlo simulation in this panel as an example.
4.3 Cumulative Number Density of DRGs
In order to quantitatively describe whether there is overdensity in the red galaxies around W1835, we show the cumulative number densities of DRGs as a function of magnitude in the W1835 field and three control fields. The number density is obtained by dividing the number by the area . represents the uncertainty of the number density based on Poisson statistics.
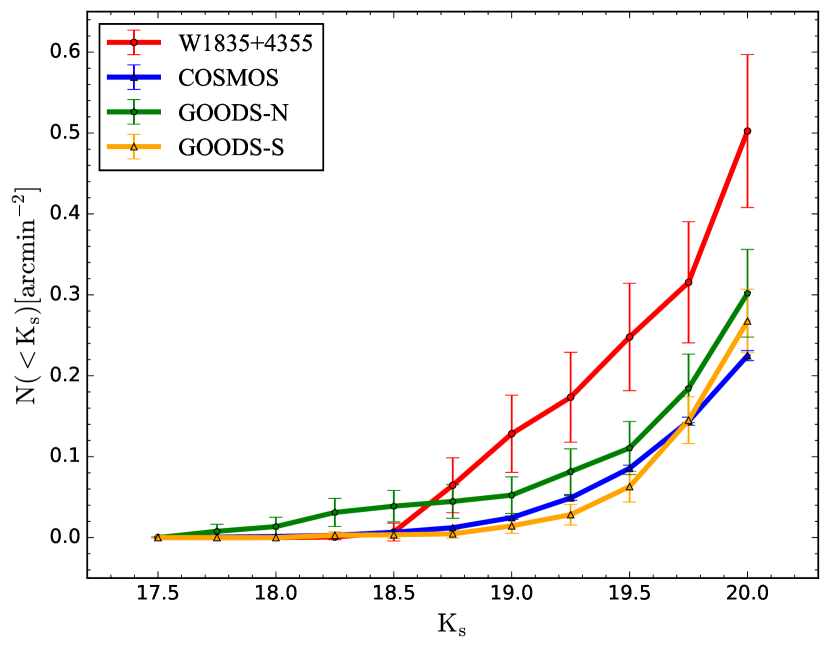
We use the W1835 field data and the noise-matched data of randomly selecting a 56.25 arcmin2 area in each control field, which described in Section 4.2, to analyze the effect of photometric error on color selection results. We utilize Monte Carlo simulation to analyze the effect of photometric error on the results. For each source, we randomly assign mock and magnitude based on its measured magnitude and associated photometric error. The mock magnitude is randomly selected from a Gaussian distribution with the measured magnitude as mean value and its associated error as standard deviation. We repeat this process for 1000 times, and calculate the probability of each source of being selected as a DRG. We add the probabilities of all sources within the limiting magnitude and divide it by the area to derive the number density. With Monte Carlo simulation, the total overdensity factors of W1835 field compared to COSMOS, GOODS-N and GOODS-S fields without completeness correction are , , and , respectively. After completeness correction, the factors mentioned above are corrected to , , and , respectively. We also do the Monte Carlo simulation for the full areas of three control fields, as listed in Table 2. We show the cumulative number densities of DRGs in the Figure 4. The total overdensity factors of W1835 field compared to COSMOS, GOODS-N and GOODS-S fields after completeness correction are , , and , respectively. The results for the full areas of three control fields are consistent with the results from randomly selecting a 56.25 arcmin2 area in each control field. The average total overdensity factor of W1835 field is about 2. Due to the limitation of observation depth, only the bright DRGs can be detected in this work. Previous studies in protoclusters have found overdensity factor of DRGs similar to our results (Kajisawa et al., 2006; Kodama et al., 2007), but their DRGs reach down to a much fainter magnitude limit. Therefore, we suggest that the W1835 field has a significant overdensity of the bright red galaxies compared to the three control fields. We expect this overdensity to remain true for the fainter red galaxies, but this will require future observations at deeper depths to determine.
5 DISCUSSION
5.1 Environments of Hot DOGs
Previous studies on environments of Hot DOGs have suggested that they may live in dense regions (Jones et al., 2014; Assef et al., 2015; Fan et al., 2017). For instance, overdensities of sub-millimeter galaxies (SMGs) in the vicinity of Hot DOGs have been found in two small samples of Hot DOGs using JCMT SCUBA2 850 observations (Jones et al., 2014; Fan et al., 2017). Jones et al. (2014) detected one SMG within 1.5 arcmin radius of W1835, which revealed a moderate overdensity of SMGs compared with blank field survey (Weiß et al., 2009). Assef et al. (2015) found an overdensity of mid-IR Spitzer-selected galaxies around Hot DOGs within 1 arcmin compared with random pointing. In this work, we find an overdensity of red galaxies around W1835 compared to three control fields. Our results are consistent with overdensities of sub-millimeter and mid-IR Spitzer-selected galaxies around Hot DOGs (Jones et al., 2014; Fan et al., 2017; Assef et al., 2015), suggesting that Hot DOGs may be a good tracer for dense regions such as protoclusters. In addition, Bridge et al. (2013) found that Hot DOGs show a substantial overlap with the WISE-selected Ly blobs (LABs) at , and W1835 is one of them. High-redshift LABs are often found in the dense environment of star-forming galaxies (SFGs) (Steidel et al., 2000; Matsuda et al., 2011; Saito et al., 2015). W1835, as one of high-redshift LABs, is very likely lying in the dense region traced by SFGs.
Furthermore, Assef et al. (2015) had found that the density of mid-IR Spitzer-selected galaxies in the Hot DOG fields showed good agreement with that in the radio-loud AGN fields from CARLA survey. In addition, the overdensity of SMGs (De Breuck et al., 2004; Dannerbauer et al., 2014; Rigby et al., 2014) and DRGs (Kajisawa et al., 2006; Kodama et al., 2007) have also been found in the radio-loud AGN fields. These results suggest that the environments of Hot DOGs and radio-loud AGN may be similar.
5.2 Local overdensity of DRGs
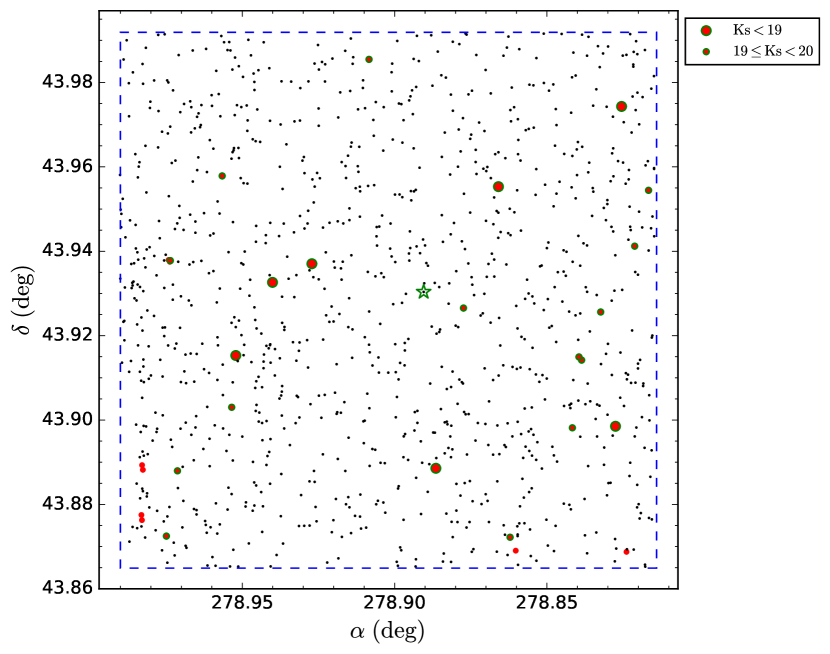
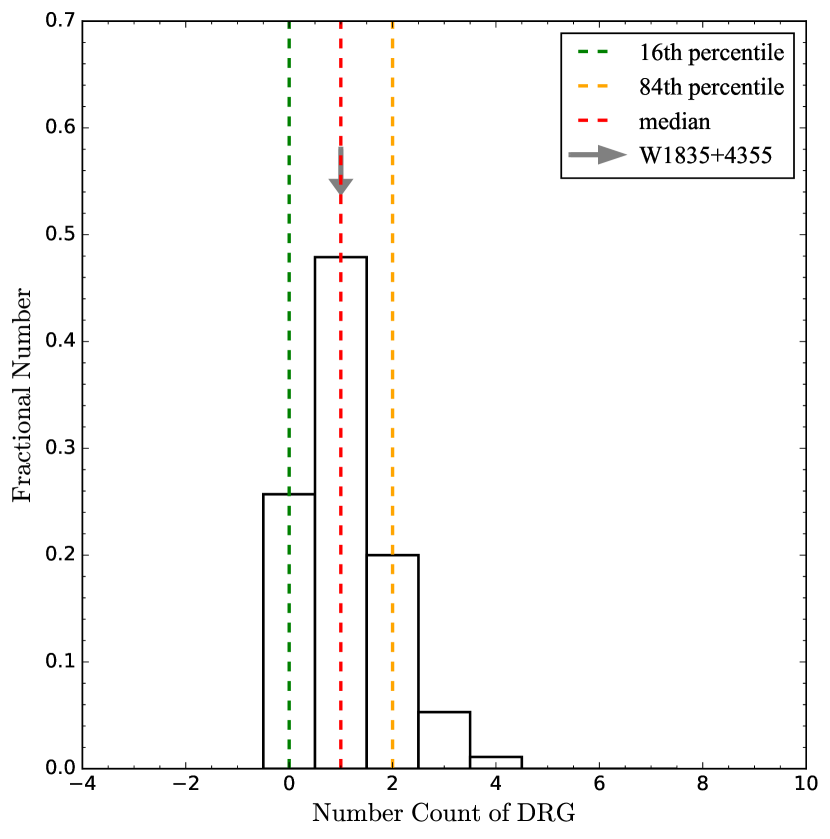
We show the spatial distribution of DRGs in the W1835 field in Figure 5. We find that W1835 does not seem to be in the most locally overdense regions. We count the number of DRGs within a fixed radius at random pointings in the W1835 field to study the local environment. Previous studies have found that there is no hint of angular clustering of SMGs and mid-IR Spitzer-selected galaxies around Hot DOGs within and , respectively (Jones et al., 2014, 2017; Assef et al., 2015). We choose as the radius, which corresponds 1.6 Mpc comoving distance at . This scale is similar to those works mentioned above. We randomly generate 1000 pointings inside the borders of the central region and then count the number of DRGs within for each pointing. We show the distribution of the number count of DRGs in Figure 6. The value calculated with W1835 as the center, which is 1, is marked by gray arrow. We find that this value is exactly the median value of the distribution. It indicates that the local environment of W1835 does not appear to be much denser in the field. In other words, W1835 does not reside in the densest region of the overdense environment traced by itself. This result is consistent with the idea that Hot DOGs may not be the central galaxies of the overdensities traced by themselves (Assef et al., 2015). It is worth noting that Shen et al. (2021) also found similar results in the proto-structure at traced by radio-detected AGN. They proposed a scenario where merging might already have happened in this case and lowered the local density of their surrounding region. Previous studies have found X-ray-selected or IR-selected obscured AGNs have a high merger fraction compared to unobscured AGNs (Lackner et al., 2014; Kocevski et al., 2015; Donley et al., 2018). Fan et al. (2016a) analyzed the host morphology of 18 Hot DOGs using Hubble Space Telescope (HST) WFC3 imaging and found that Hot DOGs have a high merger fraction. As for W1835, high-resolution HST/WFC3 imaging shows a clear merging feature (Fan et al., 2016a). It is consistent with the scenario proposed by Shen et al. (2021), which suggests that the merger scenario may also be an explanation for the low local number density of galaxies around W1835.
6 Summary and conclusion
In this work, we use P200 WIRC NIR images to study the environments of a Hot DOG W1835. We use DRGs as a prior for high-redshift red galaxies based on NIR color criterion and obtain the number density of DRGs around W1835. By comparing with three control fields (COSMOS, GOODS-N, GOODS-S), we find that the number densities of DRGs in W1835 field are higher than those of three control fields. There is an overdensity of red galaxies around W1835. Our result is consistent with overdensities of SMGs and mid-IR selected galaxies around Hot DOGs found by previous statistical studies. It indicates that the environments of Hot DOGs are overdense, and Hot DOGs may be a good tracer for dense regions such as protoclusters. Furthermore, multiwavelength studies on the environments of Hot DOGs also indicate that their environments are similar to high-redshift radio-loud AGN.
We also find that W1835 are not in the locally densest part of the field. This is mainly because W1835 is in the process of merging, which lowers the galaxy density of the surrounding region. Previous SMGs and mid-IR observations of Hot DOGs’ environments also find that there is no hint of angular clustering of SMGs and mid-IR Spitzer-selected galaxies in the local environment around the Hot DOGs. Considering that a high merger fraction has been found in a small sample of Hot DOGs based on HST/WFC3 imaging, we suggest that merger scenario could still demonstrate those results.
References
- Alexander & Hickox (2012) Alexander, D. M. & Hickox, R. C. 2012, New A Rev., 56, 93. doi:10.1016/j.newar.2011.11.003
- Assef et al. (2015) Assef, R. J., Eisenhardt, P. R. M., Stern, D., et al. 2015, ApJ, 804, 27. doi:10.1088/0004-637X/804/1/27
- Assef et al. (2016) Assef, R. J., Walton, D. J., Brightman, M., et al. 2016, ApJ, 819, 111. doi:10.3847/0004-637X/819/2/111
- Bertin & Arnouts (1996) Bertin, E. & Arnouts, S. 1996, A&AS, 117, 393. doi:10.1051/aas:1996164
- Bertin et al. (2002) Bertin, E., Mellier, Y., Radovich, M., et al. 2002, Astronomical Data Analysis Software and Systems XI, 281, 228
- Bradley et al. (2020) Bradley, L., Sipőcz, B., Robitaille, T., et al. 2020, Zenodo
- Bridge et al. (2013) Bridge, C. R., Blain, A., Borys, C. J. K., et al. 2013, ApJ, 769, 91. doi:10.1088/0004-637X/769/2/91
- Brodwin et al. (2008) Brodwin, M., Dey, A., Brown, M. J. I., et al. 2008, ApJ, 687, L65. doi:10.1086/593327
- Chapman et al. (2009) Chapman, S. C., Blain, A., Ibata, R., et al. 2009, ApJ, 691, 560. doi:10.1088/0004-637X/691/1/560
- Chiang et al. (2013) Chiang, Y.-K., Overzier, R., & Gebhardt, K. 2013, ApJ, 779, 127. doi:10.1088/0004-637X/779/2/127
- Chiang et al. (2017) Chiang, Y.-K., Overzier, R. A., Gebhardt, K., et al. 2017, ApJ, 844, L23. doi:10.3847/2041-8213/aa7e7b
- Collet et al. (2015) Collet, C., Nesvadba, N. P. H., De Breuck, C., et al. 2015, A&A, 579, A89. doi:10.1051/0004-6361/201424544
- Cooke et al. (2014) Cooke, E. A., Hatch, N. A., Muldrew, S. I., et al. 2014, MNRAS, 440, 3262. doi:10.1093/mnras/stu522
- Cooray et al. (2010) Cooray, A., Amblard, A., Wang, L., et al. 2010, A&A, 518, L22. doi:10.1051/0004-6361/201014597
- Dannerbauer et al. (2014) Dannerbauer, H., Kurk, J. D., De Breuck, C., et al. 2014, A&A, 570, A55. doi:10.1051/0004-6361/201423771
- De Breuck et al. (2004) De Breuck, C., Bertoldi, F., Carilli, C., et al. 2004, A&A, 424, 1. doi:10.1051/0004-6361:20035885
- Donley et al. (2018) Donley, J. L., Kartaltepe, J., Kocevski, D., et al. 2018, ApJ, 853, 63. doi:10.3847/1538-4357/aa9ffa
- Eisenhardt et al. (2012) Eisenhardt, P. R. M., Wu, J., Tsai, C.-W., et al. 2012, ApJ, 755, 173. doi:10.1088/0004-637X/755/2/173
- Falder et al. (2011) Falder, J. T., Stevens, J. A., Jarvis, M. J., et al. 2011, ApJ, 735, 123. doi:10.1088/0004-637X/735/2/123
- Fan et al. (2016a) Fan, L., Han, Y., Fang, G., et al. 2016, ApJ, 822, L32. doi:10.3847/2041-8205/822/2/L32
- Fan et al. (2016b) Fan, L., Han, Y., Nikutta, R., et al. 2016, ApJ, 823, 107. doi:10.3847/0004-637X/823/2/107
- Fan et al. (2017) Fan, L., Jones, S. F., Han, Y., et al. 2017, PASP, 129, 124101. doi:10.1088/1538-3873/aa8e91
- Fan et al. (2018b) Fan, L., Knudsen, K. K., Fogasy, J., et al. 2018, ApJ, 856, L5. doi:10.3847/2041-8213/aab496
- Fan et al. (2020) Fan, L., Chen, W., An, T., et al. 2020, ApJ, 905, L32. doi:10.3847/2041-8213/abcebf
- Franx et al. (2003) Franx, M., Labbé, I., Rudnick, G., et al. 2003, ApJ, 587, L79. doi:10.1086/375155
- Frey et al. (2016) Frey, S., Paragi, Z., Gabányi, K. É., et al. 2016, MNRAS, 455, 2058. doi:10.1093/mnras/stv2399
- García-Vergara et al. (2019) García-Vergara, C., Hennawi, J. F., Barrientos, L. F., et al. 2019, ApJ, 886, 79. doi:10.3847/1538-4357/ab4d52
- Hammer et al. (2017) Hammer, F. P., Flores, H., & Rodrigues, M. 2017, Studying Distant Galaxies: A Handbook of Methods and Analyses. Edited by HAMMER F ET AL. Published by World Scientific Publishing Co. Pte. Ltd., . ISBN #9781786340559. doi:10.1142/q0016
- Hatch et al. (2011) Hatch, N. A., Kurk, J. D., Pentericci, L., et al. 2011, MNRAS, 415, 2993. doi:10.1111/j.1365-2966.2011.18735.x
- Hatch et al. (2014) Hatch, N. A., Wylezalek, D., Kurk, J. D., et al. 2014, MNRAS, 445, 280. doi:10.1093/mnras/stu1725
- Hayashi et al. (2012) Hayashi, M., Kodama, T., Tadaki, K.-. ichi ., et al. 2012, ApJ, 757, 15. doi:10.1088/0004-637X/757/1/15
- Hennawi et al. (2015) Hennawi, J. F., Prochaska, J. X., Cantalupo, S., et al. 2015, Science, 348, 779. doi:10.1126/science.aaa5397
- Hickox et al. (2012) Hickox, R. C., Wardlow, J. L., Smail, I., et al. 2012, MNRAS, 421, 284. doi:10.1111/j.1365-2966.2011.20303.x
- Hopkins et al. (2008) Hopkins, P. F., Hernquist, L., Cox, T. J., et al. 2008, ApJS, 175, 356. doi:10.1086/524362
- Husband et al. (2013) Husband, K., Bremer, M. N., Stanway, E. R., et al. 2013, MNRAS, 432, 2869. doi:10.1093/mnras/stt642
- Jones et al. (2014) Jones, S. F., Blain, A. W., Stern, D., et al. 2014, MNRAS, 443, 146. doi:10.1093/mnras/stu1157
- Jones et al. (2017) Jones, S. F., Blain, A. W., Assef, R. J., et al. 2017, MNRAS, 469, 4565. doi:10.1093/mnras/stx1141
- Kajisawa et al. (2006) Kajisawa, M., Kodama, T., Tanaka, I., et al. 2006, MNRAS, 371, 577. doi:10.1111/j.1365-2966.2006.10704.x
- Kajisawa et al. (2011) Kajisawa, M., Ichikawa, T., Tanaka, I., et al. 2011, PASJ, 63, 379. doi:10.1093/pasj/63.sp2.S379
- Kashikawa et al. (2007) Kashikawa, N., Kitayama, T., Doi, M., et al. 2007, ApJ, 663, 765. doi:10.1086/518410
- Kikuta et al. (2017) Kikuta, S., Imanishi, M., Matsuoka, Y., et al. 2017, ApJ, 841, 128. doi:10.3847/1538-4357/aa72f0
- Kocevski et al. (2015) Kocevski, D. D., Brightman, M., Nandra, K., et al. 2015, ApJ, 814, 104. doi:10.1088/0004-637X/814/2/104
- Kodama et al. (2007) Kodama, T., Tanaka, I., Kajisawa, M., et al. 2007, MNRAS, 377, 1717. doi:10.1111/j.1365-2966.2007.11739.x
- Komatsu et al. (2011) Komatsu, E., Smith, K. M., Dunkley, J., et al. 2011, ApJS, 192, 18. doi:10.1088/0067-0049/192/2/18
- Lackner et al. (2014) Lackner, C. N., Silverman, J. D., Salvato, M., et al. 2014, AJ, 148, 137. doi:10.1088/0004-6256/148/6/137
- Matsuda et al. (2011) Matsuda, Y., Yamada, T., Hayashino, T., et al. 2011, MNRAS, 410, L13. doi:10.1111/j.1745-3933.2010.00969.x
- Mawatari et al. (2012) Mawatari, K., Yamada, T., Nakamura, Y., et al. 2012, ApJ, 759, 133. doi:10.1088/0004-637X/759/2/133
- Mazzucchelli et al. (2017) Mazzucchelli, C., Bañados, E., Decarli, R., et al. 2017, ApJ, 834, 83. doi:10.3847/1538-4357/834/1/83
- McCracken et al. (2012) McCracken, H. J., Milvang-Jensen, B., Dunlop, J., et al. 2012, A&A, 544, A156. doi:10.1051/0004-6361/201219507
- Miley & De Breuck (2008) Miley, G. & De Breuck, C. 2008, A&A Rev., 15, 67. doi:10.1007/s00159-007-0008-z
- Morselli et al. (2014) Morselli, L., Mignoli, M., Gilli, R., et al. 2014, A&A, 568, A1. doi:10.1051/0004-6361/201423853
- Muldrew et al. (2015) Muldrew, S. I., Hatch, N. A., & Cooke, E. A. 2015, MNRAS, 452, 2528. doi:10.1093/mnras/stv1449
- Muzzin et al. (2013) Muzzin, A., Marchesini, D., Stefanon, M., et al. 2013, ApJS, 206, 8. doi:10.1088/0067-0049/206/1/8
- Piconcelli et al. (2015) Piconcelli, E., Vignali, C., Bianchi, S., et al. 2015, A&A, 574, L9. doi:10.1051/0004-6361/201425324
- Reddy et al. (2005) Reddy, N. A., Erb, D. K., Steidel, C. C., et al. 2005, ApJ, 633, 748. doi:10.1086/444588
- Retzlaff et al. (2010) Retzlaff, J., Rosati, P., Dickinson, M., et al. 2010, A&A, 511, A50. doi:10.1051/0004-6361/200912940
- Ricci et al. (2017) Ricci, C., Assef, R. J., Stern, D., et al. 2017, ApJ, 835, 105. doi:10.3847/1538-4357/835/1/105
- Rigby et al. (2014) Rigby, E. E., Hatch, N. A., Röttgering, H. J. A., et al. 2014, MNRAS, 437, 1882. doi:10.1093/mnras/stt2019
- Saito et al. (2015) Saito, T., Matsuda, Y., Lacey, C. G., et al. 2015, MNRAS, 447, 3069. doi:10.1093/mnras/stu2538
- Schlafly & Finkbeiner (2011) Schlafly, E. F. & Finkbeiner, D. P. 2011, ApJ, 737, 103. doi:10.1088/0004-637X/737/2/103
- Förster Schreiber et al. (2004) Förster Schreiber, N. M., van Dokkum, P. G., Franx, M., et al. 2004, ApJ, 616, 40. doi:10.1086/424838
- Scott et al. (2006) Scott, S. E., Dunlop, J. S., & Serjeant, S. 2006, MNRAS, 370, 1057. doi:10.1111/j.1365-2966.2006.10478.x
- Shen et al. (2021) Shen, L., Lemaux, B. C., Lubin, L. M., et al. 2021, ApJ, 912, 60. doi:10.3847/1538-4357/abee75
- Steidel et al. (2000) Steidel, C. C., Adelberger, K. L., Shapley, A. E., et al. 2000, ApJ, 532, 170. doi:10.1086/308568
- Stevens et al. (2010) Stevens, J. A., Jarvis, M. J., Coppin, K. E. K., et al. 2010, MNRAS, 405, 2623. doi:10.1111/j.1365-2966.2010.16641.x
- Trainor & Steidel (2012) Trainor, R. F. & Steidel, C. C. 2012, ApJ, 752, 39. doi:10.1088/0004-637X/752/1/39
- Tsai et al. (2015) Tsai, C.-W., Eisenhardt, P. R. M., Wu, J., et al. 2015, ApJ, 805, 90. doi:10.1088/0004-637X/805/2/90
- Uchimoto et al. (2012) Uchimoto, Y. K., Yamada, T., Kajisawa, M., et al. 2012, ApJ, 750, 116. doi:10.1088/0004-637X/750/2/116
- Uchiyama et al. (2019) Uchiyama, H., Kashikawa, N., Overzier, R., et al. 2019, ApJ, 870, 45. doi:10.3847/1538-4357/aaef7b
- Uchiyama et al. (2020) Uchiyama, H., Akiyama, M., Toshikawa, J., et al. 2020, ApJ, 905, 125. doi:10.3847/1538-4357/abc47b
- van Dokkum et al. (2003) van Dokkum, P. G., Förster Schreiber, N. M., Franx, M., et al. 2003, ApJ, 587, L83. doi:10.1086/375156
- Venemans et al. (2002) Venemans, B. P., Kurk, J. D., Miley, G. K., et al. 2002, ApJ, 569, L11. doi:10.1086/340563
- Venemans et al. (2005) Venemans, B. P., Röttgering, H. J. A., Miley, G. K., et al. 2005, A&A, 431, 793. doi:10.1051/0004-6361:20042038
- Venemans et al. (2007) Venemans, B. P., Röttgering, H. J. A., Miley, G. K., et al. 2007, A&A, 461, 823. doi:10.1051/0004-6361:20053941
- Weiß et al. (2009) Weiß, A., Kovács, A., Coppin, K., et al. 2009, ApJ, 707, 1201. doi:10.1088/0004-637X/707/2/1201
- Wu et al. (2012) Wu, J., Tsai, C.-W., Sayers, J., et al. 2012, ApJ, 756, 96. doi:10.1088/0004-637X/756/1/96
- Wylezalek et al. (2013) Wylezalek, D., Galametz, A., Stern, D., et al. 2013, ApJ, 769, 79. doi:10.1088/0004-637X/769/1/79
- Wylezalek et al. (2014) Wylezalek, D., Vernet, J., De Breuck, C., et al. 2014, ApJ, 786, 17. doi:10.1088/0004-637X/786/1/17
- Yoon et al. (2019) Yoon, Y., Im, M., Hyun, M., et al. 2019, ApJ, 871, 57. doi:10.3847/1538-4357/aaf6e3
- Zappacosta et al. (2018) Zappacosta, L., Piconcelli, E., Duras, F., et al. 2018, A&A, 618, A28. doi:10.1051/0004-6361/201732557