(The following article has been accepted by Applied Physics Letters. After it is published, it will be found at https://doi.org/10.1063/5.0102370)
Rapid determination of single substitutional nitrogen N concentration in diamond from UV-Vis spectroscopy
Abstract
Single substitutional nitrogen atoms N are the prerequisite to create nitrogen-vacancy (NV) centers in diamonds. They serve as the electron donors to create the desired NV- center, provide charge stability against photo-ionisation, but also are the main source of decoherence. Therefore, precise and quick determination of N concentration is a key advantage to a multitude of NV-related research in terms of material improvement as well as applications. Here we present a method to determine the N concentration based on absorption spectroscopy in the UV-Visible range and fitting the 270 nm absorption band. UV-Visible spectroscopy has experimental simplicity and widespread availability that bear advantages over established methods. It allows a rapid determination of N densities, even for large numbers of samples. Our method shows further advantages in determining low concentrations as well as the ability to measure locally, which is highly relevant for diamonds with largely varying N concentrations in a single crystal. A cross-check with electron paramagnetic resonance (EPR) shows high reliability of our method and yields the absorption cross section of the 270 nm absorption band, cmppm-1 (in common logarithm) or cmppm-1 (in natural logarithm), which serves as a reference to determine N concentrations, and makes our method applicable for others without the need for a known N-reference sample and calibration. We provide a rapid, practical and replicable pathway that is independent of the machine used and can be widely implemented as a standard characterization method for the determination of N concentrations.
Nitrogen is one of the main impurities in both natural and synthetic diamonds Ashfold et al. (2020). Related defects, particularly the nitrogen-vacancy (NV) center, attract a broad interest for its special optical and spin properties Aharonovich, Greentree, and Prawer (2011); Doherty et al. (2013). It has been extensively investigated for magnetometry Degen (2008); Acosta et al. (2009); Rondin et al. (2014); Jeske, Cole, and Greentree (2016); Hahl et al. (2021), bio-sensing Schirhagl et al. (2014); Wu et al. (2016), nuclear magnetic resonance (NMR) Glenn et al. (2018); Bucher et al. (2019) and scanning probe microscopy Schell et al. (2011); Zhou, Stöhr, and Yacoby (2017). To create NV centers, single substitutional nitrogen atoms, denoted as N, P1 or C-centers, are the prerequisite. They are doped during the diamond growth or implanted on the diamond surface, followed by irradiation and annealing steps to create vacancies and allow NV centers to form. They play a role as the typical electron donor to charge the desired NV- state Collins (2002); Fu et al. (2010); Haque and Sumaiya (2017); Hauf et al. (2011), and they are often present 10-100 times more than NV centers even in highly doped material. They determine the NV charge stability, and optimising the N to NV- conversion ratio is crucial for improving the NV center’s performance and sensitivity Luo et al. (2022). Moreover, at parts-per-million (ppm) levels they can act as the main decoherence source of the NV center Bauch et al. (2020). Therefore, knowledge of the N density gives significant advantages in the choice of material and performance in applications.
To measure the N density in diamond, the established standard is electron paramagnetic resonance (EPR) spectroscopy Smith et al. (1959); Van Wyk et al. (1997); Eaton et al. (2010). Field modulation is applied to record continuous wave EPR spectra, resulting in a spectrum that approximates the first derivative of the EPR line shape. Double integration of the acquired spectrum is taken to determine the EPR peak intensity and hence the N concentration Tallaire et al. (2006). Although this method has been well established, it is often hard to access and labour-intensive, and its high requirement for the surface quality of diamond brings technical difficulties for the measurement. Moreover, the EPR method measures the spin number in the entire sample volume and averages different areas in the sample. For diamonds with less homogeneity, e.g. high-pressure, high-temperature (HPHT) diamonds that usually show sectors containing very different N concentrations in a single crystal Capelli et al. (2019), the spatially resolved determination of the N density can be of interest rather than the averaged value. In this regard, optical methods with experimental simplicity and widespread availability have significant advantages for many groups and companies working with NV centers, which makes the Fourier-transform infrared (FTIR) and UV-Visible (UV-Vis) spectroscopy favourable in some cases. Depending on the configuration of the spectrometer, both volume and spatially resolved measurements are possible by these optical methods.
The FTIR spectroscopy has been used to determine both N (at 1130 cm-1 and 1344 cm-1) Dobrinets, Vins, and Zaitsev (2016) and N (at 1332 cm-1) Lawson et al. (1998) centers. For this method, a good spectral resolution is required, and different resolutions of the spectrometer have a significant effect on the concentration estimation Liggins (2010). Moreover, for diamonds with low nitrogen densities less than a few tenths of ppm, the conventional FTIR spectroscopy often shows insufficient sensitivity in detecting these nitrogen-related centers Dobrinets, Vins, and Zaitsev (2016). In comparison, the UV-Vis spectroscopy enables the detection of single nitrogen as low as 0.01 ppm De Weerdt and Collins (2008), which is much below the detection limit of the conventional FTIR method. Furthermore, the UV-Vis spectroscopy with its experimental simplicity can be applied as a rapid method to characterize diamonds, especially for low nitrogen concentrations.
In the UV-Vis spectrum, the absorption band centered at 270 nm has been suggested to determine the N concentration Dyer et al. (1965); Chrenko, Strong, and Tuft (1971); Walker (1979). Extracting the 270 nm band from the spectrum is thus a key step for this method. Different fitting methods have been introduced, but complex spectra and the simplistic nature of the literature methods leads to difficulties to determine the band reliably. Early on, Sumiya et al. Sumiya and Satoh (1996) has suggested to subtract the spectrum at 270 nm with the ‘tail-line’, then calibrate this height with the EPR result. The ‘tail-line’ is a straight line fitted with the acquired spectrum at around 600-800 nm. This method provides a convenient approach which does not require complicated fitting. For diamonds without additional spectral components at the ‘tail’ region, it enables a quick and rough estimation of the N concentration. When the diamond spectrum shows absorption bands that across the range (for example NV-, NVN- centers, or the nickel-related broad band centered at 710 nm, etc.), the method will be less accurate and even invalidated. Especially for chemical vapor deposition (CVD) diamonds, a perfect ‘tail’ without influence by other defects is unusual and difficult to achieve in nitrogen-doped growth.
A more advanced protocol has been introduced by Khan et al. Khan et al. (2009, 2013), which avoids being dependent on the ‘tail’ region. This method relied on more complex fitting components: a ‘ramp’ in the form of well fitting the overall decreasing trend of the absorption spectrum (which can be related to single vacancies Luo et al. (2022), or vacancy clusters Mäki et al. (2007); Jones (2009)); a combination of bands at 360 nm and 520 nm originate from vacancy clusters and NVH0 centers respectively; and a ‘reference spectrum’ including the 270 nm band and its absorption continuum taken from a high-pressure, high-temperature (HPHT) type Ib diamond. The weight of the ‘reference spectrum’ then gives the strength of the 270 nm band and thus the N concentration. This protocol improved the fitting accuracy significantly, it broadened applicable spectrum types as it was independent of absorption bands at 600-800 nm. Nevertheless, it is still limited by the HPHT reference spectrum that requires a detectable and clear 270 nm band. Besides, HPHT spectra have their own ‘ramp’ component and potentially other spectral features, using these as reference will not only isolate the 270nm peak but also fit the other components of the reference to the acquired spectrum. This creates a dependency on the utilised HPHT reference spectrum. Considering the fundamental difference in material properties between different synthesized diamonds, to avoid using a specific type of reference spectrum that contains the band of interest (270 nm) helps to reduce the fitting uncertainties and further improve the accuracy.
In this work, we present a fitting protocol to estimate N concentrations reliably and precisely from the 270 nm band in the UV-Vis absorption spectrum. This protocol can be more generally adapted for complex spectra, especially for CVD diamonds. It also avoids the requirement for a reference spectrum with the band of interest and increases the fitting robustness. We furthermore calibrate this method with EPR measurements for a series of CVD diamonds with varing N concentrations. From the calibration we find the linearity of the two methods and precision of our measurement. We deduce the absorption cross-section of the 270 nm band for N, enabling the estimation of its concentrations without the requirement of a further reference sample with a known concentration.
We grew six (100) oriented CVD diamonds with varying nitrogen-doping levels for the method calibration. We pre-characterized their N concentrations with an EPR spectrometer (Bruker ELEXSYS E580) at room temperature. The spectrometer was fitted with a Bruker super-high-Q probehead (ER4122 SHQE), and the microwave frequency was set to 9.84 GHz. N concentrations were determined using the built-in spin-counting feature, from the acquisition software (xEPR). This measurement for N concentration carries an error of 6 (including the statistic error, the fitting error, and the accuracy of the EPR spectrometer). For details of the N concentration see Table 1.
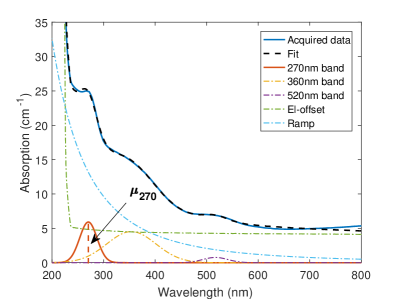
To obtain the UV-Vis absorption spectra for the diamond, we measured the diamond transmission in the range of 200-800 nm using an UV-Vis spectrometer (PerkinElmer Lambda 950) at room temperature, then we deduced the absorption coefficient following the Lambert-Beer law: , where is the sample thickness. Figure 1 shows a typical UV-Vis absorption spectrum of CVD diamonds, containing three absorption bands centered at respectively 270 nm, 360 nm and 520 nm. We fitted the spectrum with five components (Figure 1):
- Three Gaussian functions for the three typical bands in CVD diamonds , where , and are the fitting parameters for each band =270, 360, 520 (nm). Here 270 nm is the band of interest to extract the N concentration, 360 nm corresponds to vacancy clusters and 520 nm to NVH0 centers Khan et al. (2013).
- A ‘ramp’ function (same as in Khan et al. (2009)), where the factor is the fitting parameter for this function.
- A spectrum ‘El-offset’, , which is given by an electronic grade diamond (theoretically a ‘pure’ diamond without defect bands in the UV-Vis range). This reference spectrum is applied as an offset and baseline to the acquired spectrum, and it is also fitted with a coefficient .
We fitted a sum of the five components to the original spectrum by a non-linear least squares fit:
Different from previous works, here the key component, the 270 nm feature, is extracted as a Gaussian band. For this band (i.e. function), a lower- and upper-boundary of the fitting parameter have been introduced for the band-center (268-272 nm) and the Gaussian RMS width (13-27 nm), in order guide the algorithm to optimize the parameters in a small range. The boundaries were selected based on free fitting results of a large amount of samples, they also help to examine whether the fitting outcome exhibits reasonable values: if a final parameter is one of the boundary values, this indicates a unreliable fitting performance, i.e. the boundary has ‘forced’ the algorithm to stop while no optimization has been found in the expected range. On the contrary, if the final parameter exhibits a free value in the given range, the fitting was optimized correctly. For all our fits this condition was met.
With extracting the 270nm band, we then compare its height, (in cm-1), with the EPR measurements to investigate if the fitting result scales linearly to the EPR and thus can be validated. In this method, no reference sample with an ideal 270 nm band is required, the only reference spectrum in this method is the ‘El-offset’ component measured from the electronic grade diamond, which is an undoped diamond and thus avoids the variation which occurs in doped reference spectra. One can easily obtain this spectrum repeatably from any ‘pure’ diamond, or simply use a literature spectrum as the offset for well-calibrated spectrometers. 111We can provide the spectrum data for the ‘El-offset’ and other technical assistance upon request. This reduces the difficulty for implementing the fitting, and greatly avoids introducing undesired spectral components that vary from diamond to diamond. The ‘El-offset’ keeps the diamond intrinsic spectral feature (with an absorption edge at around 225-235 nm, then being ‘flat’ in the visible range up to 800 nm), instead of using a straight line as the offset. Importantly, considering that the 270 nm band is located very close to the absorption edge (225-235 nm), an additional parameter describing the sharp drop in this regime is necessary to supplement the ‘ramp’ function. In this sense, introducing the ‘El-offset’ can considerably improve the fitting performance.
For a spectrum with a weak or undetectable 520 nm band, i.e. for samples without NVH0 centers potentially, the fitting method can be also adapted to four components. This can help to improve the fitting accuracy for some samples, as the fitting parameters for should be nearly zero in this sense, subtracting this band in the fitting function reduces unnecessary fitting parameters.
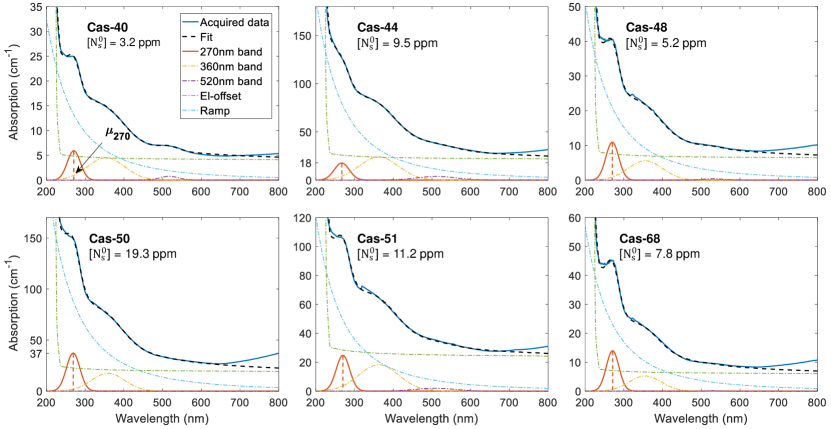
Figure 2 shows the fitting result for the six samples, they all show a good match between the fitting result and original spectrum. Mismatches appear at high wavelength (650 nm), which is due to higher spectral features that are not included in the fitting. A possible candidate for these CVD diamonds can be H2 centers (NVN-) with a zero-phonon line at 986 nm and a broad phonon side band centered at around 800 nm. For samples with strong features in this higher-wavelength regime (i.e. Cas-48, Cas-50 and Cas-68), a cut-off at 650 nm for the acquired data (i.e. fit for 200-650 nm) can improve the fitting performance. The good fitting result at lower wavelength shows that our method is independent of higher spectral features. The spectral variation around 650-800 nm illustrates the problem with defining a ‘tail’ as a baseline reference for the 270 nm peak Sumiya and Satoh (1996).
As the next step, we compare the height of the extracted 270 nm Gaussian peak, , to the EPR result (Fig. 3). The good agreement of the two methods shown by the close-to-linear arrangement of the data points, proves the reliability of our fitting method. The 270nm band has been assigned only to N and has been used in several papers to determine only the N concentration Sumiya and Satoh (1996); Khan et al. (2009, 2013); Edmonds et al. (2021). We note however that an earlier research has suggested that the 270 nm band can be influenced by both N and N, especially for diamonds with low nitrogen concentrations Jones, Goss, and Briddon (2009), which has never been fully ruled out. Although our results can also not fully eliminate the possibility of a contribution of N, the good linear fit of the EPR and UV-Vis results indicates that N has minor influence if any. The discrepancies between the two methods in some previous works might have arisen from an inadequate fitting method for the spectrum. For more details of the band height and the EPR result see Table 1.
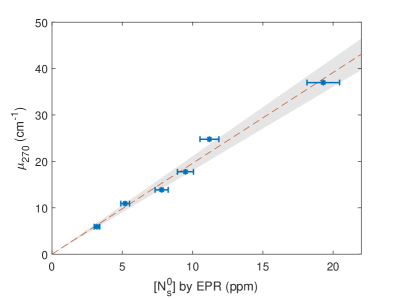
From the slope in Figure 3, one can deduce the absorption cross-section of N at 270 nm , with the relation:
| (1) |
where is the N concentration in ppm, is the absorption coefficient of the extracted 270 nm band height (as described above). The theoretical derivation of the absorption cross-section is discussed in supplementary material. For common logarithm (i.e. decadic absorption coefficients), the absorption cross-section cmppm-1, the error is given by 95% confidence interval of the fitting parameter for the linear fit to the two methods. can be also given in cm2, i.e. cm2, which is converted by multiplying a factor 10, where 10-23 g is the atomic mass for 12C and g/cm3 is the diamond density.
For the absorption coefficient calculated by natural logarithm, an absorption cross-section cmppm-1 should be applied instead. In previous research, we have found a single reference of the absorption cross-section at 270 nm Dobrinets, Vins, and Zaitsev (2016), which has been stated as ppm/cm-1 (i.e. cmppm-1). However, the method of its determination, specifically how the spectrum has been separated was not stated. We thus assume our measurement is more precise, the values of these two completely independent measurements are remarkably close.
From our protocol, one can estimate directly from their UV-Vis spectra, without calibrating by other methods. This can be achieved for any samples with both sides polished in the following way: Firstly measure the UV-Vis transmission in percentage then convert it into the absorption spectrum in cm-1; secondly separate the spectrum to extract the 270 nm band and obtain according to the method described above; finally calculate the N concentration using Equation (1) with the absorption cross-section or (depending on the logarithm type when deducing the absorption from transmission). The method is setup-independent and applicable for UV-Vis spectra taken by any machine, whether by volume measurements or spatially resolved measurements. No further EPR/FTIR measurements are required, as Equation (1) gives the absolute value of the N concentration and our value for sigma can be used.
| Sample | [N] (ppm) | (cm-1) |
|---|---|---|
| Cas-40 | 3.2 | 5.9 |
| Cas-44 | 9.5 | 17.7 |
| Cas-48 | 5.2 | 10.9 |
| Cas-50 | 19.3 | 37.2 |
| Cas-51 | 11.2 | 24.7 |
| Cas-68 | 7.8 | 13.9 |
We developed a fitting method for determining N concentration via UV-Vis absorption spectrum, which is more widely accessible and easily implementable than EPR measurements. We showed that the fitting of the identified bands is a reliable way to extract the 270 nm band from the background, as seen by the good match between measurement and fit, and confirmed by the linear relationship between EPR result and our method. The good agreement with EPR furthermore confirms the assumption that the 270 nm band indeed is mainly caused by N. Our fitting method performs well for diamond spectra without complex components overlapping with the the fitting components. In other words, it can be widely applied to different diamond types apart from as-grown CVD diamonds.
Furthermore, we deduced the absorption cross-section cmppm-1 (for common logarithm) and cmppm-1 (for natural logarithm), which can serve to rapidly determine N densities from UV-Vis measurements without the need to calibrate a setup via EPR. This also enables the determination of N concentrations in a lower end that is hardly detectable by EPR or FTIR methods. The detectable range of N concentration is limited by the sensitivity of the UV-Vis spectrometer. Based on our spectrometer, we estimated a detectable range for typical 300 m diamond plates from 0.01 ppm to 30-50 ppm (details are discussed in supplementary material). For thinner/thicker samples, the determination of higher/lower N concentrations are also possible. The range can be expanded by orders of magnitude with more sensitive spectrometers. The fitting protocol combined with the calibrated absorption cross-section provide a rapid, easy and replicable pathway for the standardized determination of N concentrations for future research.
Supplementary Material
See supplementary material for the discussion of the detectable range of N concentration and the theoretical derivation of the absorption cross-section.
We thank Brant Gibson, Andrew Greentree, Peter Knittel, Christian Giese, Christoph Schreyvogel and Oliver Ambacher for valuable discussions. We thank Fedor Jelezko for valuable discussions and supports of the EPR theory. We thank Michael Ardner, Christine Lell and Michaela Fritz for preparing diamond plates, Dorothee Luick for the technical support of UV-Vis measurements. T.L and J.J acknowledge the funding by the German federal ministry for education and research Bundesministerium für Bildung und Forschung (BMBF) under Grant No. 13XP5063. M.C. acknowledges funding from the Asian Office of Aerospace Research and Development (AOARD, funding FA2386-18-1-4056).
The data that support the findings of this study are available from the corresponding author upon reasonable request.
References
- Ashfold et al. (2020) M. N. Ashfold, J. P. Goss, B. L. Green, P. W. May, M. E. Newton, and C. V. Peaker, “Nitrogen in diamond,” Chemical reviews 120, 5745–5794 (2020).
- Aharonovich, Greentree, and Prawer (2011) I. Aharonovich, A. D. Greentree, and S. Prawer, “Diamond photonics,” Nature Photonics 5, 397–405 (2011).
- Doherty et al. (2013) M. W. Doherty, N. B. Manson, P. Delaney, F. Jelezko, J. Wrachtrup, and L. C. Hollenberg, “The nitrogen-vacancy colour centre in diamond,” Physics Reports 528, 1–45 (2013).
- Degen (2008) C. Degen, “Scanning magnetic field microscope with a diamond single-spin sensor,” Applied Physics Letters 92, 243111 (2008).
- Acosta et al. (2009) V. M. Acosta, E. Bauch, M. P. Ledbetter, C. Santori, K.-M. Fu, P. E. Barclay, R. G. Beausoleil, H. Linget, J. F. Roch, F. Treussart, et al., “Diamonds with a high density of nitrogen-vacancy centers for magnetometry applications,” Physical Review B 80, 115202 (2009).
- Rondin et al. (2014) L. Rondin, J.-P. Tetienne, T. Hingant, J.-F. Roch, P. Maletinsky, and V. Jacques, “Magnetometry with nitrogen-vacancy defects in diamond,” Reports on progress in physics 77, 056503 (2014).
- Jeske, Cole, and Greentree (2016) J. Jeske, J. H. Cole, and A. D. Greentree, “Laser threshold magnetometry,” New Journal of Physics 18, 013015 (2016).
- Hahl et al. (2021) F. A. Hahl, L. Lindner, X. Vidal, T. Luo, T. Ohshima, S. Onoda, S. Ishii, A. M. Zaitsev, M. Capelli, B. C. Gibson, et al., “Magnetic-field-dependent stimulated emission from nitrogen-vacancy centers in diamond,” Science Advances 8, eabn7192 (2021).
- Schirhagl et al. (2014) R. Schirhagl, K. Chang, M. Loretz, and C. L. Degen, “Nitrogen-vacancy centers in diamond: nanoscale sensors for physics and biology,” Annual review of physical chemistry 65, 83–105 (2014).
- Wu et al. (2016) Y. Wu, F. Jelezko, M. B. Plenio, and T. Weil, “Diamond quantum devices in biology,” Angewandte Chemie International Edition 55, 6586–6598 (2016).
- Glenn et al. (2018) D. R. Glenn, D. B. Bucher, J. Lee, M. D. Lukin, H. Park, and R. L. Walsworth, “High-resolution magnetic resonance spectroscopy using a solid-state spin sensor,” Nature 555, 351–354 (2018).
- Bucher et al. (2019) D. B. Bucher, D. P. Aude Craik, M. P. Backlund, M. J. Turner, O. Ben Dor, D. R. Glenn, and R. L. Walsworth, “Quantum diamond spectrometer for nanoscale nmr and esr spectroscopy,” Nature Protocols 14, 2707–2747 (2019).
- Schell et al. (2011) A. W. Schell, G. Kewes, T. Schröder, J. Wolters, T. Aichele, and O. Benson, “A scanning probe-based pick-and-place procedure for assembly of integrated quantum optical hybrid devices,” Review of Scientific Instruments 82, 073709 (2011).
- Zhou, Stöhr, and Yacoby (2017) T. X. Zhou, R. J. Stöhr, and A. Yacoby, “Scanning diamond nv center probes compatible with conventional afm technology,” Applied Physics Letters 111, 163106 (2017).
- Collins (2002) A. T. Collins, “The fermi level in diamond,” Journal of Physics: Condensed Matter 14, 3743 (2002).
- Fu et al. (2010) K.-M. Fu, C. Santori, P. Barclay, and R. Beausoleil, “Conversion of neutral nitrogen-vacancy centers to negatively charged nitrogen-vacancy centers through selective oxidation,” Applied Physics Letters 96, 121907 (2010).
- Haque and Sumaiya (2017) A. Haque and S. Sumaiya, “An overview on the formation and processing of nitrogen-vacancy photonic centers in diamond by ion implantation,” Journal of Manufacturing and Materials Processing 1, 6 (2017).
- Hauf et al. (2011) M. Hauf, B. Grotz, B. Naydenov, M. Dankerl, S. Pezzagna, J. Meijer, et al., “Chemical control of the charge state of nitrogen-vacancy centers in diamond,” Physical Review B 83, 081304 (2011).
- Luo et al. (2022) T. Luo, L. Lindner, J. Langer, V. Cimalla, X. Vidal, F. Hahl, C. Schreyvogel, S. Onoda, S. Ishii, T. Ohshima, et al., “Creation of nitrogen-vacancy centers in chemical vapor deposition diamond for sensing applications,” New Journal of Physics 24, 033030 (2022).
- Bauch et al. (2020) E. Bauch, S. Singh, J. Lee, C. A. Hart, J. M. Schloss, M. J. Turner, et al., “Decoherence of ensembles of nitrogen-vacancy centers in diamond,” Physical Review B 102, 134210 (2020).
- Smith et al. (1959) W. Smith, P. Sorokin, I. Gelles, and G. Lasher, “Electron-spin resonance of nitrogen donors in diamond,” Physical Review 115, 1546 (1959).
- Van Wyk et al. (1997) J. Van Wyk, E. Reynhardt, G. High, and I. Kiflawi, “The dependences of esr line widths and spin-spin relaxation times of single nitrogen defects on the concentration of nitrogen defects in diamond,” Journal of Physics D: Applied Physics 30, 1790 (1997).
- Eaton et al. (2010) G. R. Eaton, S. S. Eaton, D. P. Barr, and R. T. Weber, Quantitative Epr (Springer Science & Business Media, 2010).
- Tallaire et al. (2006) A. Tallaire, A. Collins, D. Charles, J. Achard, R. Sussmann, A. Gicquel, M. Newton, A. Edmonds, and R. Cruddace, “Characterisation of high-quality thick single-crystal diamond grown by cvd with a low nitrogen addition,” Diamond and related materials 15, 1700–1707 (2006).
- Capelli et al. (2019) M. Capelli, A. Heffernan, T. Ohshima, H. Abe, J. Jeske, A. Hope, et al., “Increased nitrogen-vacancy centre creation yield in diamond through electron beam irradiation at high temperature,” Carbon 143, 714–719 (2019).
- Dobrinets, Vins, and Zaitsev (2016) I. A. Dobrinets, V. G. Vins, and A. M. Zaitsev, HPHT-treated diamonds (Springer, 2016).
- Lawson et al. (1998) S. C. Lawson, D. Fisher, D. C. Hunt, and M. E. Newton, “On the existence of positively charged single-substitutional nitrogen in diamond,” Journal of Physics: Condensed Matter 10, 6171 (1998).
- Liggins (2010) S. Liggins, Identification of point defects in treated single crystal diamond, Ph.D. thesis, University of Warwick (2010).
- De Weerdt and Collins (2008) F. De Weerdt and A. Collins, “Determination of the c defect concentration in hpht annealed type iaa diamonds from uv–vis absorption spectra,” Diamond and related materials 17, 171–173 (2008).
- Dyer et al. (1965) H. Dyer, F. Raal, L. Du Preez, and J. Loubser, “Optical absorption features associated with paramagnetic nitrogen in diamond,” Philosophical Magazine 11, 763–774 (1965).
- Chrenko, Strong, and Tuft (1971) R. Chrenko, H. Strong, and R. Tuft, “Dispersed paramagnetic nitrogen content of large laboratory diamonds,” Philosophical Magazine 23, 313–318 (1971).
- Walker (1979) J. Walker, “Optical absorption and luminescence in diamond,” Reports on progress in physics 42, 1605 (1979).
- Sumiya and Satoh (1996) H. Sumiya and S. Satoh, “High-pressure synthesis of high-purity diamond crystal,” Diamond and Related Materials 5, 1359–1365 (1996).
- Khan et al. (2009) R. U. A. Khan, P. M. Martineau, B. Cann, M. Newton, and D. Twitchen, “Charge transfer effects, thermo and photochromism in single crystal cvd synthetic diamond,” Journal of Physics: Condensed Matter 21, 364214 (2009).
- Khan et al. (2013) R. Khan, B. Cann, P. Martineau, J. Samartseva, J. Freeth, S. Sibley, C. Hartland, M. Newton, H. Dhillon, and D. Twitchen, “Colour-causing defects and their related optoelectronic transitions in single crystal cvd diamond,” Journal of Physics: Condensed Matter 25, 275801 (2013).
- Mäki et al. (2007) J.-M. Mäki, F. Tuomisto, C. Kelly, D. Fisher, and P. Martineau, “Effects of thermal treatment on optically active vacancy defects in cvd diamonds,” Physica B: Condensed Matter 401, 613–616 (2007).
- Jones (2009) R. Jones, “Dislocations, vacancies and the brown colour of cvd and natural diamond,” Diamond and related materials 18, 820–826 (2009).
- Note (1) We can provide the spectrum data for the ‘El-offset’ and other technical assistance upon request.
- Edmonds et al. (2021) A. M. Edmonds, C. A. Hart, M. J. Turner, P.-O. Colard, J. M. Schloss, K. S. Olsson, R. Trubko, M. L. Markham, A. Rathmill, B. Horne-Smith, et al., “Characterisation of cvd diamond with high concentrations of nitrogen for magnetic-field sensing applications,” Materials for Quantum Technology 1, 025001 (2021).
- Jones, Goss, and Briddon (2009) R. Jones, J. Goss, and P. Briddon, “Acceptor level of nitrogen in diamond and the 270-nm absorption band,” Physical Review B 80, 033205 (2009).