Seeing sharper and deeper: JWST’s first glimpse of the photometric and spectroscopic properties of galaxies in the epoch of reionisation
Abstract
We analyse the photometric and spectroscopic properties of four galaxies in the epoch of reionisation (EoR) within the SMACS J0723.3-7327 JWST Early Release Observations field. Given the known spectroscopic redshifts of these sources, we investigated the accuracy with which photometric redshifts can be derived using NIRCam photometry alone, finding that F115W imaging is essential to distinguish between galaxies with high equivalent width (EW) [O iii] emission and Balmer break galaxies. We find that all four sources exhibit strong ( 0.6 mag) F356WF444W colours, which sit at the extreme end of theoretical predictions from numerical simulations. We find that these galaxies deviate (by 0.5 dex) from the local correlation between [O iii] /H and [Ne iii] /[O ii], which is consistent with the predictions from simulations of high-redshift galaxies having elevated line excitation ratios. We measure the [O iii] rest-frame equivalent widths both directly from the spectroscopy, and indirectly as inferred from the strong F356WF444W colours, finding large [O iii] EWs of 225–1740 Å. The [O iii] and H EWs are consistent with those seen in extreme, intensely star-forming dwarf galaxies in the local Universe. Our structural analysis indicates that these galaxies are resolved, exhibiting irregular shapes with bright clumps. In line with the predictions from the FLARES hydrodynamic simulations, such intense star formation and extreme nebular conditions are likely the norm, rather than the exception, in the EoR.
keywords:
galaxies: formation – galaxies: evolution – galaxies: high-redshift1 Introduction
A new eye on our Universe has opened. And it is a golden eye, for the James Webb Space Telescope (JWST) has commenced its mission, to survey the depths of the night sky on our behalf. In doing so, it will greatly build on the legacy of its predecessor telescopes, capturing the complexity and grandeur of the Universe with a sharpness of vision and depth that is unlike anything we have seen before. Indeed, JWST will build on the legacy of the Hubble Space Telescope, which, over the years, after generation after generation of new instrumentation, from NICMOS to ACS to WFC3, has steadily pushed the frontiers of the study of the formation and evolution of galaxies to increasingly higher redshifts (see e.g. Ferguson et al., 2000; Bromm & Yoshida, 2011; Dunlop, 2013; Duncan et al., 2014; Finkelstein, 2016). But JWST will see even sharper and deeper still, bringing us ever closer to witnessing the assembly of the very first galaxies at the dawn of time. However, it is also the legacy of the Spitzer Space Telescope that JWST will be building upon. Indeed, with its infrared vision, Spitzer has enabled us to see galaxies within the epoch of reionisation in the rest-frame optical, the very light that formed the foundation of astronomy over the ages, but at a lower resolution.
It is precisely this rest-frame optical light that yields such valuable insights into galaxy formation and evolution. Unlike the rest-frame UV light that Hubble probes in the epoch of reionisation (e.g., Bouwens et al., 2015; Finkelstein et al., 2015; Bhatawdekar et al., 2019) which is primarily an indicator for young stellar populations, the rest-frame optical probed by Spitzer is also sensitive to older, more evolved stellar populations (Maraston & Strömbäck, 2011; Conroy, 2013). Indeed, as seen from spectroscopy, the rest-frame optical contains a wealth of information on the conditions within galaxies. For example, measurements of nebular emission lines can give insights on the star formation rates within galaxies (Kennicutt, 1998; Kennicutt & Evans, 2012), the primary excitation mechanisms responsible for energising the ISM (Baldwin et al., 1981; Kewley et al., 2001; Steidel et al., 2014; Shapley et al., 2015; Belfiore et al., 2016; Curti et al., 2022), the gas density (Mingozzi et al., 2019; Fluetsch et al., 2021) and amount of dust (Calzetti et al., 2000; Charlot & Fall, 2000), as well as the chemistry (Tremonti et al., 2004; Mannucci et al., 2010; Curti et al., 2017; Maiolino & Mannucci, 2019) and ionisation state of the gas (Kumari et al., 2019; Mingozzi et al., 2020). Furthermore, through a measurement of the stellar continuum, it is possible to put constraints on the stellar populations within galaxies, such as the chemistry of the stars (Peng et al., 2015; Kriek et al., 2016; Trussler et al., 2020, 2021; Carnall et al., 2022) and the star formation histories and stellar ages of galaxies (Gallazzi et al., 2005; Chauke et al., 2018; Carnall et al., 2019).
Photometry from Spitzer/IRAC imaging delivered valuable insights into the nebular conditions within galaxies. Indeed, galaxies in the EoR were found to have prominent flux excesses in one of the two IRAC 3.6 or 4.5 µm bands, thought to be driven by high equivalent width [O iii] and H emission, boosting up the fluxes well beyond the continuum level (Schaerer & De Barros, 2009; Laporte et al., 2014; Smit et al., 2014, 2015; Endsley et al., 2021). The intense star formation inferred for these EoR galaxies was therefore akin to that seen in the extreme, vigorously star-forming dwarf galaxies in the local Universe (e.g., Searle & Sargent, 1972; Izotov et al., 2011; James et al., 2016). Such intense star formation in EoR galaxies does pose a problem, for it becomes challenging to accurately recover their properties, such as stellar masses from the photometry (Smit et al., 2014). Indeed, one innovative method to separate the nebular emission and the starlight is to intentionally study galaxies at sufficiently high redshifts such that the bright nebular lines become redshifted out of the Spitzer bands (Laporte et al., 2021). In doing so, tighter constraints on the star formation histories and ages of EoR galaxies are possible, with Laporte et al. (2021) finding that the IRAC excess seen in some galaxies may be attributable to a Balmer break, i.e. a recent lack of star formation. Hence in order to better understand the star formation (and potential quenching) in EoR galaxies, a clean separation between starlight and nebular emission is essential.
JWST/NIRSpec, with its unique spectroscopic capabilities in the near-infrared, now enables us to probe the rest-frame optical of EoR galaxies through spectroscopy for the first time (see e.g. Brinchmann, 2022; Carnall et al., 2023; Curti et al., 2023; Schaerer et al., 2022; Tacchella et al., 2022; Trump et al., 2022). It is thus the ideal facility with which to characterise the physical properties of these galaxies, and to separate the nebular emission from the starlight (Gardner et al., 2006; Bromm & Yoshida, 2011; Finkelstein, 2016). Through it, we will be able to directly and immediately establish whether the prominent IRAC excess is driven by star formation (or a lack thereof, Smit et al., 2014, 2015; Laporte et al., 2021). Furthermore, in knowing both the photometry and the spectroscopic redshifts of EoR galaxies, we will be able to determine how effectively galaxies in the epoch of reionisation actually can be identified from photometric redshifts derived from fits to their SEDs and through colour–colour selections.
In this paper we aim to draw on the synergy between photometry and spectroscopy, by jointly analysing both NIRCam imaging and NIRSpec spectroscopic data for the four EoR galaxies that were observed in the JWST Early Release Observations (ERO) of the SMACS J0723.3-732 (SMACS 0723 hereafter) cluster field. Our analysis will thus focus on both the photometric and spectroscopic properties of these galaxies. Leveraging on the unique spectroscopic capabilities of NIRSpec, which enables us to directly probe the rest-frame optical properties of galaxies deep within the epoch of reionisation, we apply emission line diagnostics to constrain the ISM conditions and star formation activity within these systems. We compare the characteristics of the EoR sources to extreme, intensely star-forming dwarf galaxies in the local Universe to determine to what extent the galaxy population has evolved from the epoch of reionisation to the present day. In particular, we establish to what degree the IRAC excess (now indicated by red NIRCam F356WF444W colours) is attributable to high equivalent width [O iii] emission, and how consistent the equivalent widths traditionally inferred from photometry are with the now newly available direct measurements from spectroscopy. Furthermore, with the spectroscopic redshifts of these sources being known, we can now undertake a preliminary investigation of the actual prospects of truly identifying such sources from SED fitting and colour–colour selection applied solely to NIRCam photometry. Additionally, we intend to demonstrate the complementary power of NIRCam imaging and NIRSpec spectroscopy, which together will help to distinguish between nebular emission driven by star formation and that which arises from AGN activity.
This paper is structured as follows. In Section 2, we discuss the NIRCam imaging and NIRSpec spectroscopy that we will use in our analysis. In Section 3, we analyse the photometric properties of the four EoR galaxies, focussing on their morphologies, and the prospects for reliably identifying such galaxies from SED fitting and colour selection applied to NIRCam photometry. In Section 4, we investigate the spectroscopic properties of these galaxies, focussing on their emission line ratios and equivalent widths, to place constraints on the nebular conditions within these galaxies, as well as their star formation activity. Finally, in Section 5 we summarise our findings and conclude.
2 Data
| ID | A( | ||||||||
|---|---|---|---|---|---|---|---|---|---|
| 04590 | 8.497 | ||||||||
| 05144 | 6.381 | ||||||||
| 06355 | 7.664 | ||||||||
| 10612 | 7.659 |
We make use of both the NIRCam (Rieke et al., 2005) imaging and NIRSpec (Ferruit et al., 2022; Jakobsen et al., 2022) spectroscopic data taken during the JWST Early Release Observations (PI: Pontopiddan, Program ID: 2736, Pontoppidan et al., 2022) of the the RELICS cluster J0723.3-732 (SMACS 0723, Coe et al., 2019; Golubchik et al., 2022; Pascale et al., 2022). Our data reduction procedure is as follows.
In terms of the NIRCam data, the imaging in the F090W, F150W and F200W short wavelength bands, together with the F277W, F356W and F444W long wavelength bands, were obtained on June 7, 2022. The total integration time for this field was 12.5 hr. The NIRCam data was processed following the reduction steps outlined in more detail in Ferreira et al. (2022), Adams et al. (2023) and Austin et al. (2023). Briefly, the uncalibrated lower-level JWST data products for this field were reprocessed following a modified version of the JWST official pipeline (pipeline version 1.8.2 and Calibration Reference Data System (CRDS) context jwst_0995.pmap), as the initial release of the higher-level products were found to contain WCS alignment issues as well as sub-optimal background subtraction. Sources were identified and extracted using SExtractor (Bertin & Arnouts, 1996), with our catalog being generated by applying forced photometry on the images, using the F444W band as the selection band. In our SED fitting and colour analysis in this paper, we make use of forced aperture photometry that was calculated within diameter circular apertures. These aperture magnitudes are corrected using an aperture correction derived from simulated WebbPSF point spread functions for each band used (Adams et al., 2023). For our determination of total stellar masses and star formation rates (computed using BAGPIPES, tabulated in Table LABEL:tab:structural_properties and discussed throughout this work), we instead use Kron elliptical apertures (i.e. the FLUX_AUTO fluxes in SExtractor), which are based off of the F444W detection band. These extraction apertures, together with the cutouts of our sources in the six available NIRCam bands, are shown in Appendix B.
The NIRSpec data we use were taken on June 30, 2022, and were split between two observations (007 and 008). In each observation, 2.5 h integrations in both the G235M and G395M NIRSpec gratings were obtained. We make use of the default reductions of the NIRSpec spectra that are publicly available on MAST (pipeline version 1.8.2 and CRDS context jwst_1041.pmap). Given the presence of “snowballs” in the NIRSpec detector images, which are likely caused by cosmic ray events, and are currently not well-removed by the default configuration of the JWST/NIRSpec reduction pipeline, there are notable spikes and troughs in the default reductions of the NIRSpec spectra used in this analysis. The spectral regions affected by cosmic rays (inferred by eye) have therefore been masked and are excluded from our analysis.
We focus our analysis on the spectra obtained using the NIRSpec/G395M grating, which covers the spectral range (µm) at a spectral resolution . We do not incorporate the spectra taken by the NIRSpec/G235M grating, which covers the spectral range (µm) at . We adopt this approach for two reasons. Firstly, because the G395M grating is more sensitive than the G235M grating. Secondly, because the bright rest-frame optical lines, which are sensitive tracers to the conditions within the ISM, fall into the spectral range of the G395M grating at these redshifts.
3 Photometric properties of the EoR galaxies
3.1 The structures of EoR galaxies, as seen through JWST
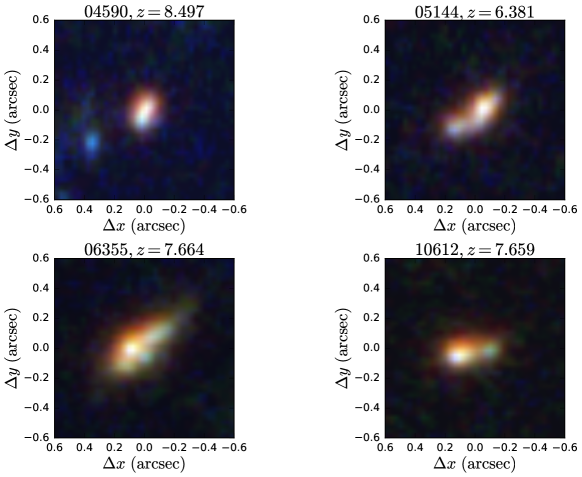
We show the RGB cutouts (B: F090W, F150W; G: F200W, F277W; R: F356W, F444W, generated using Trilogy, Coe et al., 2012) for the four EoR galaxies that were targeted for follow-up NIRSpec spectroscopy in Fig. 1. We note that, as these four galaxies reside in the SMACS 0723 cluster field, they are subject to magnification (with magnification factors shown in Table LABEL:tab:structural_properties), with their spatial profiles likely having been distorted to some degree by gravitational lensing (Pascale et al., 2022). We do not correct the morphologies for gravitational lensing in this work. Thus the morphological parameters we derive only represent the perceived properties of these galaxies, rather than their true, inherent physical sizes and shapes.
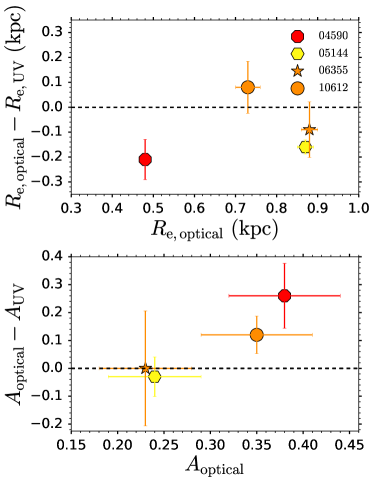
We used the MORFOMETRYKA code (Ferrari et al., 2015; Ferreira et al., 2022) to perform a structural analysis of these sources by fitting a single component Sérsic profile to their 2D light distributions and measuring quantitative morphology parameters such as the asymmetry (). A detailed description of the algorithm and measurements can be found in Ferrari et al. (2015). The morphological parameters that were derived are provided in Table LABEL:tab:structural_properties. As can be seen from the cutouts, the four EoR galaxies are clearly resolved and have distinct, irregular shapes with bright clumps. These clumpy structures are revealed clearly in Sérsic residuals after model subtraction, characterized by concentrated nodes not following a regular smooth light profile. We show the difference between the rest-frame UV (probed by F200W for the three galaxies, F150W for the galaxy 05144) and the rest-frame optical sizes (probed by F444W) and asymmetries in Fig. 2, where the images have all been PSF-matched to the F444W filter. Three out of the four sources (ID 04590, 05144, 10612) display larger UV sizes, with the exception of ID 10612, which has a UV size consistent with the optical measurement within the error bars. The asymmetries between UV and optical are consistent for two sources (ID 05144, 06355), while ID 04590 and ID 10612 show more asymmetric optical light, with and respectively.
As we will comment further in Section 4, these galaxies have neither point-source nor uniform morphologies (in agreement with the clumpy structures seen with HST imaging, e.g. Jiang et al., 2013; Bowler et al., 2017) implying that the standard flux calibration procedures for reducing NIRSpec spectra will not be optimal, even for these high- objects.
We note, as has already been pointed out in Carnall et al. (2023), that the two sources (IDs 06355, 10612) are closely separated both on the sky () and in redshift (). Assuming a Planck Collaboration (2020) cosmology, this corresponds to a projected physical separation and line-of-sight separation of 56 kpc and 179 kpc respectively. Alternatively, the redshift differential translates into a velocity offset of 173 km s-1. We have inspected the lensing model maps and verified that these are two distinct (i.e. not multiply imaged) sources. An investigation into the possible imprint of such a close interaction on the morphologies of these galaxies would require a correction for gravitational lensing, which is beyond the scope of this analysis.
3.2 Photometric properties
We now turn to the photometry of these four sources. We fit the photometry using the SED fitting code BAGPIPES Carnall et al. (2018), imposing a minimum error of 5% on the photometry to account for uncertainties on the absolute flux calibration. We assume an exponential star formation history, adopting the default BAGPIPES fitting configuration, with uniform priors on the galaxy age (0.001–15 Gyr), -folding time (0.1–10 Gyr), stellar mass formed (1–15), metallicity (0–2.5), dust extinction –, ionisation parameter (–). We assume the Calzetti et al. (2000) dust attenuation curve and use the default spectral templates in BAGPIPES.
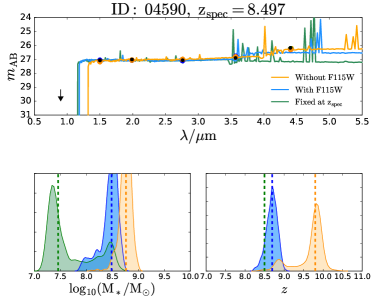
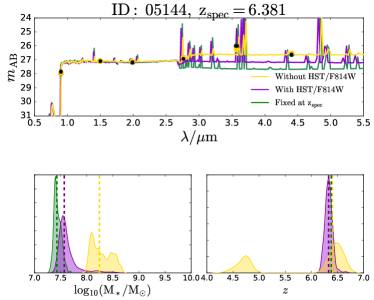
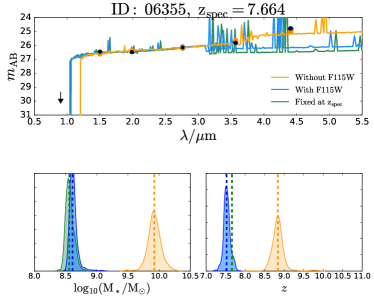
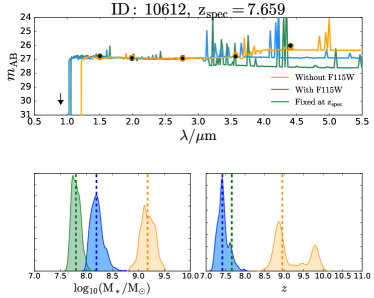
The measured magnitudes in diameter extraction apertures (having been corrected using an aperture correction), together with the median BAGPIPES fit, as well as the probability distributions for the derived stellar masses (corrected for magnification) and photometric redshifts, are shown in Fig. 3. We did not assume the known spectroscopic redshifts for these sources in the fitting process, as we wish to emphasise both the relatively broad range in photometric redshifts that are derived (from the available NIRCam photometry alone, in orange) for these objects, as well as the fact that the galaxies are misidentified, with a median assigned photometric . Thus, the range of possible photometric redshifts derived can deviate quite substantially from the true spectroscopic redshifts (shown by the vertical green dashed line in the redshift subpanel) that are now known for these sources.
We note that in the NIRSpec MSA target catalog for this ERO program (ID: 2736), the galaxies were in fact also assigned photometric redshifts . Thus, perhaps the very basis for their spectroscopic follow-up, was that these sources were perceived to be at higher redshifts than their true redshift, i.e. . Whilst this is certainly the first case in which a misidentified object was selected for spectroscopic follow-up with NIRSpec (being an ERO program), it almost definitely will not be the last.
Indeed, the key spectral features that are largely driving these high-redshift solutions for these sources, are the prominent Lyman-break in the F090W filter, together with the “magnitude excess” in the F444W filter (akin to the well-known IRAC excess, see e.g. Laporte et al., 2014; Smit et al., 2014, 2015). However, without the F115W filter (with the corresponding and probability distributions shown in orange in Fig. 3), models are likely to be unable to effectively distinguish between the lower redshift galaxies and higher redshift galaxies, that can both effectively drive these SED profiles. For the galaxies, the excessively bright F444W emission (relative to F356W) is attributable to the high EW [O iii] + H emission for these galaxies (which we shall discuss in more detail in Section 4). For the galaxies, the red (F356WF444W) colours are instead likely driven by a prominent Balmer break (see also Wilkins et al., 2022b). With the addition of the F115W filter, one should be able to more effectively distinguish between the two redshift regimes, through the presence or absence of a Lyman break in the F115W filter. Indeed, as shown by the blue probability distributions in Fig. 3, by including mock F115W fluxes (as given by the median BAGPIPES fit, with the redshift fixed at the known spectroscopic redshift), the higher redshift solution is ruled out, and the photometric redshifts derived are much closer to the true spectroscopic redshift.
e note that, in the absence of a F115W measurement, the posterior redshift probability distributions for galaxies 06355 and 10612 are zero at the known spectroscopic redshifts, despite the fact that both line emission and Balmer breaks should be compatible with the data. The zero probability at the known spectroscopic redshift either indicates that the templates/configuration used in our BAGPIPES analysis are unable to produce emission lines of sufficient strength (i.e. high enough equivalent width) to match the observed data (thus yielding zero probability), or that the solutions are ”missed” in the fitting process. We can clearly see from Fig. 3 that, upon fixing the redshift in the fitting process to the known spectroscopic redshift, that BAGPIPES can well-reproduce (shown in green) the strong F444W flux seen through emission lines alone, achieving excellent agreement with the NIRCam data. Thus the lack of probability at when fitting without F115W likely stems from the fact that BAGPIPES does not exhaustively fit with every possible redshift and star formation history combination (i.e. a brute-force approach).
From our investigations, this lack of posterior probability at the known spectroscopic redshift occurs rather frequently for strong line emitters in the EoR, even when adopting a variety of SED-fitting codes (such as Le Phare and EAZY). As discussed more extensively in Adams et al. (2023), but also in Appendix B, this is likely due to the spectral templates (that are widely adopted in the use of these codes) not having sufficiently strong emission lines to match the high equivalent width line emission seen in EoR galaxies. Thus, in order to ensure accurate photometric redshifts, it is imperative that templates with strong line emission ([O iii] EWrest 1000 Å) are adopted when SED-fitting in the JWST era.
In order to determine the robustness of our SED-fitting results, we undertake a similar photometric redshift analysis with the SED-fitting codes Le Phare and EAZY in Appendix B. Briefly, we obtain the same results as with BAGPIPES, namely that the flux excess in the F444W band is attributed to a Balmer break, rather than [O iii] + H line emission. With the inclusion of mock F115W photometry, both the Le Phare and EAZY photometric redshifts begin to agree better with the known spectroscopic redshifts.
3.3 Colour selection
Having discussed the prospects for deriving accurate photometric redshifts from JWST photometry, we now focus on the complementary approach of using colour–colour selections to identify high- candidates. We wish to establish where our known high-redshift objects actually lie in colour–colour space, and whether this is consistent with predictions from theoretical models.
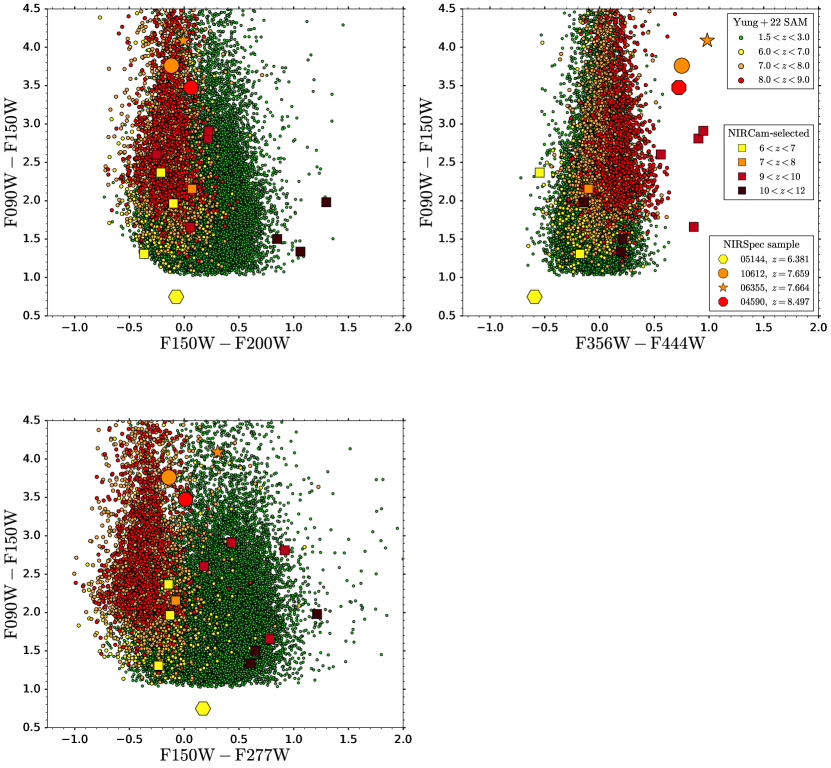
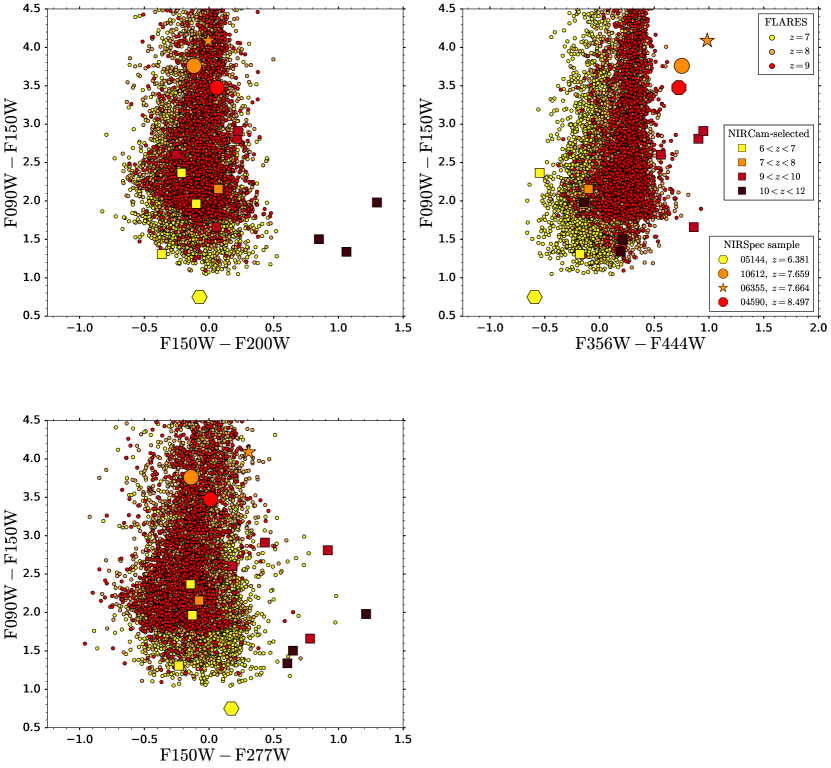
In the top-left panel of Fig. 4, we show the (F090WF150W) vs. (F150WF200W) colour plane, which in principle can be used to select galaxies. The basis behind this colour selection is as follows. At these redshifts, the F090W and F150W filters are probing blueward and redward of the Ly line, respectively. Thus the F090WF150W measures the strength of the Ly break. Note that this is only the perceived strength of the break, as it is sensitive to the depth of the observations. On the other hand, the F150WF200W colour is sensitive to the spectral slope of the continuum redward of Ly.
We show the NIRCam colours predicted by an updated version of the Yung et al. (2022) semi-analytic model (which now also includes nebular line emission), with the various coloured data points corresponding to galaxies at different redshifts. We show the positions of EoR galaxies in the colour–colour plane, together with lower redshift interlopers () which can potentially exhibit comparable colours (in this colour plane) to the higher-redshift sources. In order to allow for a comparison with the observational data, we introduced noise into the simulated colours, matching the depths measured by placing diameter apertures in empty patches of the SMACS 0723 field. Furthermore, we adopt the same selection criteria that would be used for identifying potential high- candidates, namely detections in the F150W, F200W, F277W, F356W and F444W bands, together with a non-detection in F090W (i.e. with the measured F090W flux being ). The colours of the four EoR galaxies studied in this work are also shown, with the large octagon, hexagon, star and circle corresponding to the source IDs 04590, 05144, 06355 and 10612, respectively, following the same colour coding as was adopted for the simulated galaxies. Furthermore, we also show (as squares), the colours for our NIRCam-selected high-redshift galaxies in the SMACS 0723 field (Adams et al., 2023). We note that we find no other candidates, with the red F150WF200W colours for the candidates being attributable to the fact that these dropout (due to IGM attenuation) in the F150W band.
It is clear from Fig. 4 that both EoR galaxies and galaxies can exhibit similarly red (F090WF150W) colours, due to their Lyman breaks and Balmer breaks, respectively. In principle, these red galaxies have, on average, redder (F150WF200W) colours than EoR sources. However, in practice, owing to finite depth and the fact that the population has a much greater density on the sky than the EoR galaxies, contamination can be a considerable concern for selecting targets for follow up.
Importantly, we note that the four EoR galaxies are roughly consistent with the predictions from the Yung et al. (2022) semi-analytic model, with the exact (F090WF150W) colour measured depending on the depth of the observations. It is evident that an application of this colour selection would not have provided a strong basis to select these sources for follow-up spectroscopy with NIRSpec.
In the bottom-left panel of Fig. 4, we show the (F090WF150W), (F150WF277W) colour–colour plane. The basis behind this colour selection is similar to that of the top-left panel of Fig. 4. However, as the (F150WF277W) colour operates over a longer wavelength baseline than (F150WF200W), it in principle results in even redder colours for Balmer break galaxies (due to their red SEDs), and bluer/still flat colours for EoR galaxies. This therefore widens the separation between EoR galaxies and contaminants in the colour–colour plane, thus enabling a more effective colour selection. We note that this colour selection was also advocated for in Harikane et al. (2023). As the Yung et al. (2022) mock catalog is based off a lightcone, the relative number of EoR galaxies and galaxies predicted by the semi-analytic model is indicative of what should be seen in observations. Owing to its blue (F150WF277W) colour, there would have been a good basis to identify galaxy 10612 as an EoR candidate. In contrast, the other two galaxies (04590 and 06355) would not have clearly been identified as EoR candidates from this colour selection alone.
In the right panel of Fig. 4, we show an alternative colour selection that is based on the (F090WF150W) vs. (F356WF444W) colour plane. The basis behind the (F356WF444W) colour selection, traditionally referred to as the IRAC excess, is the high EW [O iii] and H emission that falls in the F444W filter at , thus providing a considerable flux boost compared to the neighbouring F356W filter.
We see that the three galaxies exhibit relatively very red (– mag) (F356WF444W) colours, with the excessively blue (F356WF444W) colour for the galaxy being due to the fact that [O iii] and H instead fall in the F356W filter. What is very evident, is that these four EoR galaxies all have F356WF444W colours that sit on the extreme ends of the Yung et al. (2022) predictions. Now, these high- galaxies were all observed in a single NIRCam module ( arcmin2), while the Yung et al. (2022) catalog covers a field of 782 arcmin2. Thus, barring any observational biases (as it is precisely these “extreme” objects that were identified as likely high- candidates and thus followed up with spectroscopy), this would suggest that the average EoR galaxy likely has stronger line emission (and thus redder F356WF444W colours) than is predicted in the Yung et al. (2022) catalog. Thus, selecting high- candidates based off of their highly red (F356WF444W) colours (e.g. ), may not lead to as biased of a galaxy sample as would have otherwise been expected.
We note that while our 4 EoR galaxies exhibit F090WF150W, F150WF200W and F150WF277W colours that are somewhat consistent with low- interlopers, we find no low-redshift solutions in our SED-fitting analysis with BAGPIPES in Section 3. Indeed, it is the distinctly red F356WF444W colours of these sources (driven by strong line emission) that helps to break the degeneracy between and EoR galaxies.
In Fig. 8, we show the same colour–colour selections, but now applied to the colour predictions from the FLARES simulations (Lovell et al., 2021; Vijayan et al., 2021; Vijayan et al., 2022; Roper et al., 2022; Wilkins et al., 2022a, b). These simulations are a suite of hydrodynamic simulations of galaxy formation and evolution using the physics of EAGLE (Crain et al., 2015; Schaye et al., 2015). The suite consists of a series of 40 zoom resimulations, encompassing a range of overdensities in order to study the environmental effect on high-redshift galaxy evolution. FLARES self-consistently models nebular line and continuum emission from young star-forming regions, as well as the effect of the complex 3D geometry of stars and dust on the overall attenuation. Briefly, while the FLARES predictions do extend to redder (F356WF444W) colours, we still find that our four EoR galaxies all sit on the extreme ends of the model predictions.
4 Spectroscopic properties of the EoR galaxies
4.1 Spectral fitting process
In order to outline our spectral fitting process, we show the spectrum of the galaxy (ID: 06355) in Fig. 5. This spectrum is a striking example of the quality of spectra that NIRSpec will obtain, clearly showing a multitude of emission lines in the rest-frame optical, but now, for the first time, having been obtained for a galaxy deep within the epoch of reionisation. Indeed, as demonstrated in Fig. 5, we see [O iii] emission, the Balmer lines H, H, H, H, as well as [Ne iii] , [O ii] and even the characteristically faint emission from the [O iii] auroral line. Thus, given the incredibly bright emission lines relative to the continuum level (which has not been subtracted) it is evident that the red (F356WF444W) colours, driven by the strong magnitude excess in the F444W filter, are attributable to the high EW emission of [O iii] , rather than a prominent Balmer break in the galaxy spectrum.
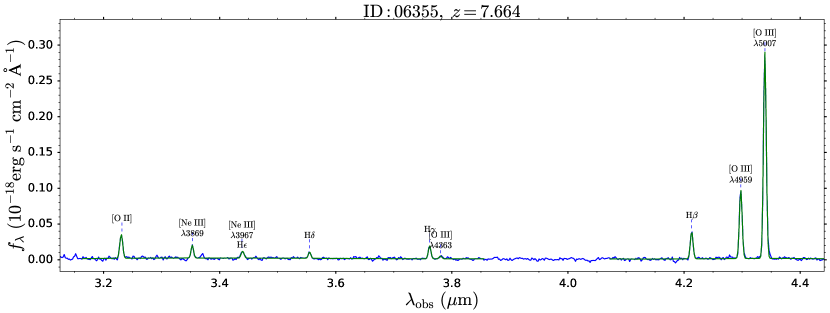
Our spectral fitting process is as follows. We begin by co-adding the spectra taken during two separate observations (Observations 007 and 008). We then fit the rest-frame optical emission lines listed above using LMFIT (Newville et al., 2014), assuming a Gaussian profile for each line. These Gaussians have been initially broadened according to the spectral resolution at the observed wavelength of the corresponding emission line. As the spectrum is dominated by emission lines, we begin with a preliminary fit that simultaneously fits all the emission lines as well as the continuum. The derived emission line velocities and widths are then used to define the wavelength ranges spanned by each line ( about the line centre). The collective wavelength range spanned by all the emission lines in the spectrum is then masked, and a piecewise fit to the underlying continuum is done. As can be seen from Fig. 5, we fit the continuum region around the [O iii] doublet and H, as well as the continuum spanning the spectral range between the [O ii] doublet and the [O iii] auroral line. These fits to the continuum are then subtracted from the observed spectrum, and we repeat the initial spectral fitting process, simultaneously fitting all the emission lines in the continuum-subtracted spectrum. We adopted a piecewise continuum fit, as we find that this yields a better characterisation of the variation in the continuum, especially in the vicinity of the emission lines of interest, than can be achieved from parametrically fitting the entire continuum across the full spectral range.
In order to calculate rest-frame equivalent widths for [O iii] and H, we determined the median flux density in the rest-frame spectral range µm, after having masked the spectral regions around the H, [O iii] and [O iii] emission lines, using the line widths established in the spectral fitting process detailed above. We note that the continuum is well-detected for galaxy 06355, so the equivalent width derived should be reliable. For galaxies 04590, 05144 and 10612, the continuum is instead noisier, with the median flux density estimate being rather sensitive to both the exact wavelength range that is used in the continuum estimate, and the quality of the background subtraction that has been performed in this range. Thus we note that the equivalent widths derived for these sources are less robust.
Finally, in order to generate errors on emission line fluxes and the continuum level, we generated 100 realisations of the observed spectrum, each perturbed according to the noise level in the observations, and subsequently fit using the procedure outlined above.
4.2 Emission line diagnostics
Having fit the spectrum and derived emission line fluxes, we now compute standard emission line diagnostics used at lower redshifts, which give insights into the ISM conditions within these high-redshift galaxies.
4.2.1 Measurement method
As had been shown in Fig. 1, it is evident that the four EoR galaxies studied in this work exhibit an extended and complex structure. They are therefore not well-described as point sources, nor as uniform objects. Hence the two default source morphologies that can be assumed when correcting for slit losses in the JWST/NIRSpec reduction pipeline, will likely not yield an accurate flux calibration for these galaxies. Since this flux calibration is wavelength-dependent, owing to the increase in diffraction (and thus slit loss) with increasing wavelength, this renders a direct comparison between the fluxes between lines at widely separated wavelengths challenging, as the line ratios measured will depend on both the intrinsic line ratio and the differential flux calibration between the two lines. An accurate flux calibration as a function of wavelength will therefore require an accurate assessment of the actual light profile of the galaxy (as indicated by photometry) and the exact position of the galaxy within the NIRSpec slit. Given the detailed, but likely necessary analysis that would have to be undertaken to achieve this, we instead adopt a different approach within this work.
We have chosen to be conservative, by only considering emission line ratios between lines of comparable wavelength, as for these the relative flux calibration should be approximately the same. Hence we focus our analysis on both the [O iii] /H line ratio, as well as the [Ne iii] /[O ii] line ratios. Furthermore, we also determine the [O iii] and H rest-frame equivalent widths, as these should also be reliable, provided that the background subtraction is accurate and the spectra are of sufficient depth to effectively measure the continuum level.
The aforementioned diagnostics can place constraints on the ISM, with the [O iii] /H and [Ne iii] /[O ii] line ratios being effective tracers of the ionisation parameter (see e.g. Witstok et al., 2021), while the [O iii] and H EWs are tracers of young, vigorously star-forming (in terms of sSFR) systems (see e.g. Belfiore et al., 2018).
We show these spectral diagnostics in Fig. 6. The locus of points occupied by , SDSS DR7 galaxies (Kauffmann et al., 2003; Brinchmann et al., 2004; Abazajian et al., 2009) is shown in blue, the green data points correspond to the galaxies from the MOSDEF survey (a sample of 1500 galaxies and AGN at observed with Keck/MOSFIRE, see Kriek et al., 2015; Reddy et al., 2015), and the red distribution corresponds to the predictions from the FLARES simulations at –. Overlaid are shown the measured line ratios and equivalent widths for the four EoR galaxies. For the SDSS galaxies, we applied a S/N cut of 5 to both the measured line fluxes and the continuum flux densities, to ensure that the line fluxes and equivalent widths we show are reliable. For the MOSDEF galaxies, we relaxed these requirements somewhat, requiring a S/N > 5 for [O iii] and a S/N > 3 for the remaining emission lines. We note that applying such S/N cuts likely introduces biases into our comparison sample, as sources with weak emission lines are preferentially removed. We restrict our analysis to FLARES galaxies with , as below this mass regime, one starts to approach the gas mass resolution of the simulation .
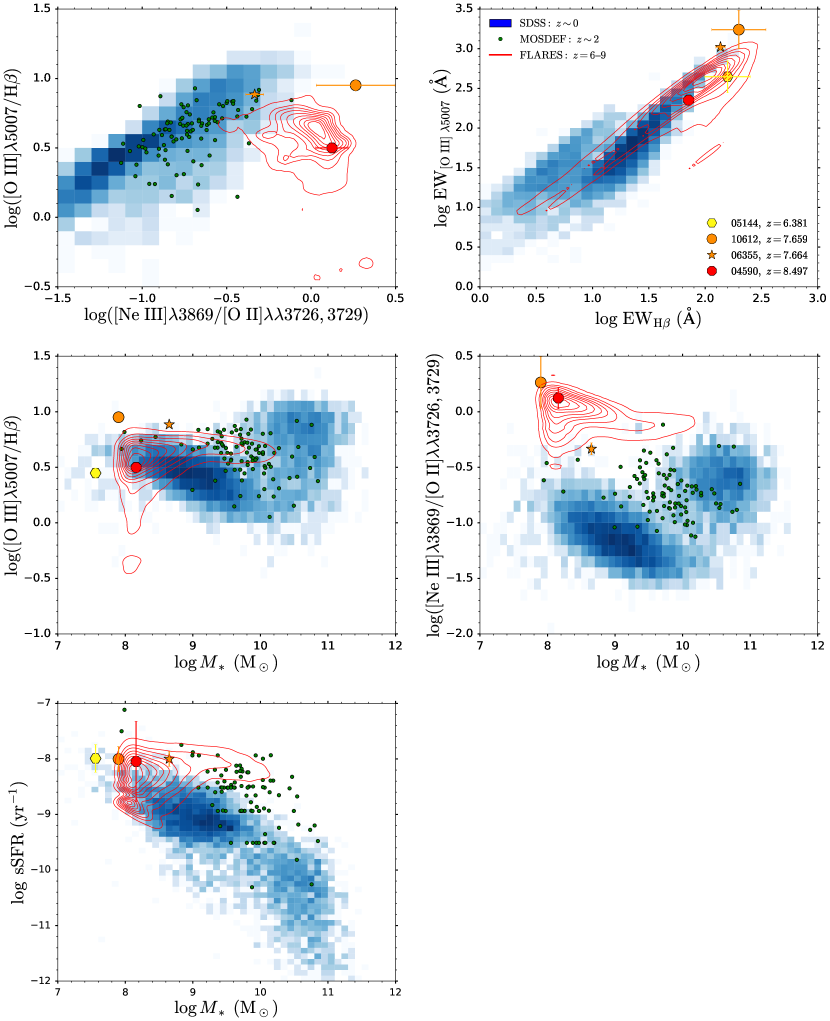
4.2.2 Revealed emission line properties
In the top-left panel of Fig. 6, we show the [O iii] /H and [Ne iii] /[O ii] line ratio diagram. We see that these two line ratios are clearly correlated for local SDSS galaxies, with these galaxies exhibiting a rather tight sequence within this plane, with [O iii] /H tending to increase with increasing [Ne iii] /[O ii]. Furthermore, the MOSDEF galaxies also tend to follow this local correlation. However, it is clear, even with our limited sample size of three EoR galaxies (for which [Ne iii] and [O ii] have been detected), that galaxies in the epoch of reionisation likely deviate (by 0.5 dex) from the local trend. Indeed, this qualitative departure from the local correlation is in line with the FLARES simulations, who find that [Ne iii] /[O ii] tends to be higher for a given [O iii] /H for galaxies at – than at . However, we note that only one of the galaxies (04590) has line ratios that are quantitatively consistent within the FLARES predictions. These enhanced [Ne iii] /[O ii] ratios in the SMACS 0723 EoR galaxies were also seen in the study of Trump et al. (2022), which attributed this to these galaxies likely having higher ionisation (, i.e. ), lower metallicity () and higher pressure (–) than the galaxies. As the FLARES simulations assume an ionisation parameter of , their enhanced [Ne iii] /[O ii] ratios are likely driven by the lower metallicity in galaxies at –.
Beyond looking at line ratio correlations, it is worthwhile to consider how line ratios depend on stellar mass (through so-called mass–excitation diagrams, Juneau et al., 2011) as this can give insights into the mass regime within which different nebular excitation processes (such as photoionisation from star formation vs. AGN) begin to dominate (see e.g. Baldwin et al., 1981; Kewley et al., 2001) Indeed, as shown in the bottom-left panel, SDSS galaxies clearly exhibit a bimodality in the [O iii] /H– plane. On the one hand, we have the star-forming main sequence, for which the [O iii] /H ratio tends to decrease with increasing stellar mass. On the other hand, in the high mass regime (), we begin to see elevated [O iii] /H line ratios, as AGN activity starts to dominate (see e.g. Juneau et al., 2011; Stanway et al., 2014; Dickey et al., 2016). Just as the MOSDEF galaxies tend to have elevated [O iii] /H line ratios at a given stellar mass (with masses from Duncan et al., 2014, 2019) compared to the local population (which is attributed to galaxies having higher sSFR at a given stellar mass than galaxies at , Dickey et al. 2016, and/or lower nebular metallicity and higher ionisation parameter, Sanders et al. 2018), we find that two of our sources (06355 and 10612) exhibit line ratios that are on the extreme end of the local trends. The other two objects (04590 and 05144) have comparable [O iii] /H line ratios to dwarf galaxies. These results are entirely consistent with the (extreme ends) of the FLARES predictions, which do not include the AGN contribution to these lines. Hence the [O iii] /H emission in these four galaxies is consistent with what is seen in what is considered extreme, vigorously star-forming dwarf galaxies in the local Universe (see e.g. Izotov et al., 2021).
Similarly, in the bottom-right panel of Fig. 6, we show that SDSS galaxies also exhibit a bimodality in the [Ne iii] /[O II]– plane, which is once again attributable to the relative roles of star formation and AGN activity in the low- and high-mass regimes. As discussed extensively in Jeong et al. (2020), who analysed stacked measurements of a representative sample of MOSDEF star-forming galaxies, as opposed to a biased subset (which we show here) with individual [Ne iii] detections, MOSDEF galaxies have enhanced [Ne iii] /[O II] relative to the SDSS population. They find that the [Ne iii] /[O II], [O iii] /H, [O iii]/[O ii] and [Ne iii]/[O ii] ratios for stellar-mass-stacked galaxies have a small but significant offset relative to the median sequence of local SDSS star-forming galaxies. This offset is interpreted as being attributable to an enhanced /Fe ratio (i.e. a harder ionising spectrum) at fixed gas-phase oxygen abundance in star-forming galaxies at higher redshift. Whilst the MOSDEF galaxies exhibit slightly enhanced [Ne iii] /[O II] line ratios compared to the local population, it is evident that there is a dramatic evolution in this line ratio as we enter the epoch of reionisation. Indeed, these line ratios begin to exceed what is even seen in local AGN, and is consistent with the FLARES predictions for these galaxies. Thus the offset from the local [O iii] /H – [Ne iii] /[O ii] correlation is attributable to the greatly enhanced [Ne iii] /[O ii] line ratios seen in these systems, rather than any significant evolution in [O iii] /H.
In order to investigate to what degree the aforementioned trends in the /H and [Ne iii] /[O ii] line ratios are tied to the redshift-evolution of galaxy sSFRs, we show the sSFR– plane in the bottom-left panel of Fig. 6. We note that the SFRs for SDSS galaxies are H-based (Brinchmann et al., 2004), the SFRs for MOSDEF galaxies (Duncan et al., 2014, 2019) and the SMACS 0723 galaxies are SED-based and the FLARES SFRs are averaged over the past 10 Myr. We find that the sSFRs of our EoR galaxies lie at the extreme upper ends of the sample of SDSS galaxies and are consistent with the predictions from the FLARES simulations. The enhanced sSFRs of these EoR galaxies are therefore qualitatively consistent with the higher sSFRs (at a fixed stellar mass) seen in the MOSDEF galaxies. Despite these elevated sSFRs however, our sample of EoR galaxies exhibit /H line ratios that are, on average, consistent with the SDSS galaxies. Additionally, owing to the fact that the measured [Ne iii] /[O ii] ratios for our EoR galaxies extend well beyond ( 0.5 dex) the SDSS and MOSDEF trends (for a given stellar mass), while their sSFRs are (roughly) comparable, this suggests that these enhanced [Ne iii] /[O ii] ratios cannot be due to elevated sSFRs alone.
Finally, in the top-right panel, we show the correlation between the rest-frame [O iii] and H equivalent widths. It is immediately evident, from comparing the trends for SDSS and FLARES galaxies, that very high EW [O iii] and H emission, which is reserved to extreme, vigorously star-forming dwarf galaxies in the local Universe (see e.g. Izotov et al., 2021), is much more common in the epoch of reionisation. Indeed, our four EoR galaxies roughly fall on the extreme boundaries of the SDSS population, and close to the FLARES predictions. Still, as can be seen from Fig. 6, and is consistent with our earlier discussion of the extremely red (F356WF444W) ( mag) colours for the EoR galaxies (caused by intense [O III] emission), the [O iii] equivalent widths for two of our objects (06355, 10612) sit on the extreme ends of the FLARES predictions, despite the fact that these objects were only selected from 5 arcmin2 of NIRCam imaging, indicating that this is the norm (or at least, more common) at rather than being the exception.
Indeed, the measured F356WF444W colours from the photometry can be compared against the [O iii] EW measurements made using spectroscopy. Assuming an otherwise flat spectrum (i.e. assuming ), the magnitude excess in the F444W filter (with respect to F356W) is roughly given by , where is the total observed-frame equivalent width of all the emission lines (essentially [O iii] and H at these redshifts) in the F444W filter, and is the bandpass width of the F444W filter ( µm = 10000 Å). Now, the rest-frame equivalent width . Thus, given the fixed line ratio between [O iii] and [O iii] , and assuming the measured [O iii] /H ratio from the observations, one can approximately estimate the [O iii] rest-frame equivalent width implied by the measured F356WF444W colours. We find colour-based rest-frame equivalent widths of 613 Å, 474 Å, 1181 Å and 812 Å, for galaxies 04590, 05144, 06355 and 10612, respectively. These are indeed roughly comparable (to within 0.45 dex, though see the following discussion) to our estimates from spectroscopy, namely 225 Å, 444 Å, 1050 Å and 1740 Å. Furthermore, our directly measured and inferred [O iii] equivalent widths are consistent with those inferred from the IRAC excess seen in EoR galaxies (see e.g. Smit et al., 2014; Endsley et al., 2021).
Any potential discrepancy between the colour-based and spectroscopic [O iii] EW estimates are primarily due to three factors. Firstly, from the assumption of a flat continuum when inferring the [O iii] contribution to the magnitude excess in the F444W filter. Indeed, galaxy 06355 clearly has a red continuum (see Fig. 3, causing our colour-based EW measurement (613 Å) to overestimate the spectroscopic value (225 Å). Secondly, due to the difficulty in estimating the continuum level from spectroscopy. As mentioned earlier, while the continuum is clearly detected for 06355, the derived measurements are more sensitive to the exact wavelength range adopted for continuum estimation for galaxies 04590, 05144 and 10612. Indeed, with deeper data, and an improved background subtraction (building on the current default reduction pipeline, which is currently affected by snowballs from cosmic rays), more reliable spectroscopy-based [O iii] EW estimates for galaxies in the epoch of reionisation will be possible. Owing to the noisy continuum for galaxy 10612, its spectroscopy-based EW measurement ( Å) is still consistent with the smaller colour-based value (812 Å). Thirdly, the photometry and spectroscopy probe different regions within the galaxies, and thus likely different average nebular conditions.
4.3 Distinguishing between star formation and AGN
Given the elevated [Ne iii] /[O ii] ratios in EoR galaxies, which are somewhat comparable to those seen in local AGN, we now discuss the prospects of distinguishing between nebular emission primarily driven by star formation and AGN activity in the epoch of reionisation.
Traditionally, rest-frame optical spectroscopy can be used to separate star-forming galaxies and AGN through the application of BPT diagrams (see e.g. Baldwin et al., 1981; Kewley et al., 2001; Steidel et al., 2014; Shapley et al., 2015; Belfiore et al., 2016; Curti et al., 2022) Indeed, through comparing the line ratios for doubly-ionised species, such as [O iii] /H against the line ratios for singly-ionised or neutral species, such as [N ii]/H, [S ii]/H or [O i]/H, one can typically identify the primary nebular excitation source in galaxies. However, as pointed out in Nakajima & Maiolino (2022), at , the H, [N ii], [S ii] and [O i] lines get redshifted out of the spectral range of NIRSpec and into the spectral range of JWST/MIRI. Given MIRI’s lower sensitivity (roughly less than NIRSpec/G395M) and lack of multiplexing, acquiring large statistical spectroscopic samples of galaxies will be a challenging endeavour, which will likely be gradually built up over JWST’s lifetime. Thus, alternative emission line ratios, which are accessible to NIRSpec at these redshifts, are necessary.
Larameille (2010) showed that the [O iii] /H–[O ii]/H diagram is a possible alternative, which can be applied to help separate star-forming galaxies from AGN. Indeed, Nakajima & Maiolino (2022) have recently further investigated the applicability of this diagnostic, using their new spectral models for metal-poor Pop II galaxies (, metal-enriched Pop I galaxies ( and AGN (as well as Pop III galaxies and direct collapse black holes, which we do not explore here).
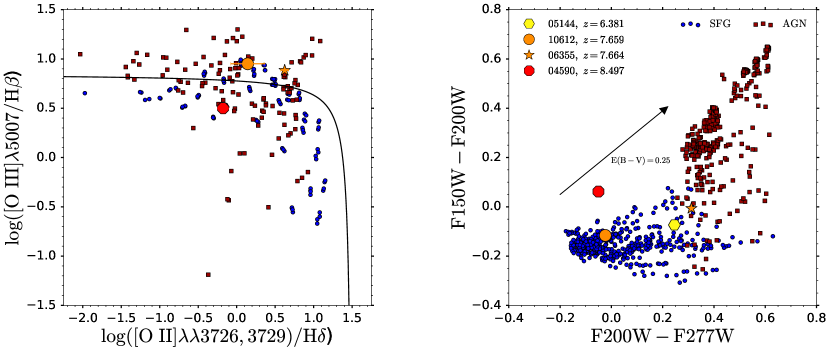
The Larameille (2010) boundary, which separates SDSS star-forming galaxies and AGN, is shown as the solid line in the left panel of Fig. 7. The Nakajima & Maiolino (2022) models for star-forming galaxies (Pop I and Pop II) are shown in blue, while their models for AGN are shown in dark red. The line ratios for the three EoR galaxies (which have the relevant line detections) are also shown. Note that we show here the [O ii]/H ratio, rather than the traditional [O ii]/H ratio. For the reasons mentioned earlier, we have decided to adopt a conservative approach, where uncertainties in the flux calibration as a function of wavelength have been (attempted to be) mitigated, by computing ratios between two lines of comparable wavelength. The Larameille (2010) boundary was thus adapted by assuming an intrinsic H/H line ratio of 0.259 (i.e. ignoring reddening by dust).
As can be seen from Fig. 7, the Nakajima & Maiolino (2022) line ratios for AGN overlap to some degree with the models for star-forming galaxies. As pointed out in their paper, however, AGN can be isolated provided that their metallicity is relatively high () and the spectrum is hard (with the power law slope ). These are precisely the AGN data points that exist in the upper regions of the [O iii] /H–[O ii]/H diagram. As can be seen from Fig. 7, it would in principle not be possible to make a definitive assessment of the relative roles of star-formation and AGN in driving the nebular emission in these three EoR galaxies.
We thus highlight the prospects for using photometry to distinguish between star-forming galaxies (SFG) and AGN in the epoch of reionisation. Indeed, it is the synergy between photometry and spectroscopy that could potentially aid in such identifications. Assuming the continuum emission in AGN follows a power law, with , the colours for AGN will be very red, especially in the rest-frame UV where the power law is steepest in the Nakajima & Maiolino (2022) models. Hence in the epoch of reionisation, where the UV continuum redward of Ly sits in the F150W, F200W and F277W NIRCam bands, one would expect to find characteristically red colours in the (F150WF200W) and (F200WF277W) filter pairs.
Indeed, as shown in the right panel of Fig. 7, the Nakajima & Maiolino (2022) models for AGN spectra (which follow a power law continuum) in the redshift range exhibit distinctly red colours, which clearly separates them from star-forming galaxies at the same redshifts. Whilst such red colours could potentially be attributed to lower-redshift interlopers, through the addition of spectroscopy and a measurement of the spectroscopic redshift, such interlopers can be definitively ruled out. We do note that the rest-frame UV light can be strongly affected by dust reddening, which is not included in our implementation of the Nakajima & Maiolino (2022) models shown in Fig. 7. Indeed, as shown by the reddening vector in the right panel, such dust reddening can readily cause star-forming galaxies to overlap with AGN in the F150WF200W, F200WF277W colour–colour plane, making an AGN/SFG identification more difficult from just a colour selection alone. This thus highlights an additional benefit of spectroscopy, as through a measurement of the Balmer decrement, through e.g. H/H (which are both accessible by NIRSpec at these redshifts), one can constrain the amount of dust and thus determine the dust-corrected colours. This should therefore allow for a more effective identification of star-forming galaxies and AGN in the F150WF200W, F200WF277W colour–colour plane. Hence through the combination of photometry and spectroscopy it should in principle be possible to separate star-forming galaxies and AGN in the EoR.
From looking at the positions of our four EoR galaxies in the F150WF200W, F200WF277W plane, we see their colours are largely consistent with what one would expect for star-forming galaxies. A more thorough investigation, utilising a more diverse set of star-forming and AGN models to analyse both the source colours and their full photometry through SED fitting, would place more stringent constraints on the relative roles of star-formation and AGN activity in galaxies (such as those studied here) in the epoch of reionisation.
Finally, we note that rest-frame UV spectroscopy will also aid in distinguishing between star-forming galaxies and AGN in the EoR. As discussed and investigated extensively in Brinchmann (2022), rest-frame UV emission lines such as C iii] and [Ne iv] can serve as valuable indicators of potential AGN activity, with these rest-UV lines all being accessible by NIRSpec at these redshifts.
5 Summary and conclusions
In this work, we utilised the combined strength of NIRCam imaging and follow-up NIRSpec spectroscopy to analyse the properties of four EoR galaxies observed in the JWST Early Release Observations of the SMACS 0723 field. Our analysis focussed on both the photometric and spectroscopic properties of these sources, aiming to draw on the synergy between imaging and spectroscopy. As the spectroscopic redshifts of these systems were known, we were able to undertake a preliminary investigation into the actual prospects of identifying such sources from SED fitting and colour–colour selections applied to NIRCam photometry. Through the spectroscopic analysis of the observed emission lines, we were able to draw comparisons against the [O iii] equivalent widths inferred from the measured F356WF444W colours. Furthermore, we showed how a combination of photometry and spectroscopy could help distinguish between nebular emission driven by star formation and AGN activity. Our main results are as follows.
Through our analysis of the morphological properties of these galaxies, we find that these systems are clearly resolved with NIRCam. Barring any distortions from gravitational lensing, these galaxies have distinct, irregular shapes with bright clumps. Thus galaxies in the epoch of reionisation as seen through NIRCam have neither point-source, nor uniform morphologies, implying that the standard flux calibration procedures for reducing NIRSpec spectra will not be optimal for even the most distant galaxies.
Given that the spectroscopic redshifts of these galaxies are now known, we aim to establish the accuracy with which the photometric redshifts for these objects could be derived, using only the photometry in the six NIRCam bands available. We find that the galaxies at are ‘misidentified’ at , with the SED fitting code BAGPIPES incorrectly attributing the very red F356WF444W colour ( mag) to a strong Balmer break spanning these two filters, rather than being due to high EW [O iii] emission in the F444W filter at –.
Indeed, we showed that with the addition of imaging with F115W, one should be able to more effectively distinguish between these two redshift regimes, through the presence or absence of a Lyman break in the F115W filter.
Furthermore, we also investigate how effective colour–colour selections are at identifying these spectroscopically-confirmed high-redshift sources. We find that these galaxies do not exhibit distinct colours in the (F090WF150W) vs. (F150WF200W) colour plane, which is based on a Ly break and continuum slope selection, in the former and latter filter pairs, respectively. In contrast, these sources all displayed extreme (F356WF444W) colours, indicative of high EW [O iii] and H emission in either the F444W filter (for the three sources) or the F356W filter (for the single source). Indeed, despite being selected for spectroscopic follow-up from only 5 arcmin2 of NIRCam imaging, these sources all exhibit (F356WF444W) colours located at the extreme end of theoretical predictions, both from the Yung et al. (2022) semi-analytic model (which spans 750 arcmin2) as well as the FLARES (Lovell et al., 2021; Vijayan et al., 2021; Roper et al., 2022; Vijayan et al., 2022; Wilkins et al., 2022a, b) simulations (40 zoom-in simulations drawn from a parent volume of 3.23 cGpc3). Hence it is likely that galaxies in the epoch of reionisation have, on average, even stronger emission lines than these models predict, even when modelling the most extreme environments.
On the spectroscopic side we analysed the spectra taken by the NIRSpec/G395M grating, which spans the spectral range µm. At the redshifts of the galaxies studied in this work, this observed wavelength range corresponds to the rest-frame optical. Thus we are able to apply standard spectroscopic emission line diagnostics, but now applied to galaxies deep within the epoch of reionisation. Given current uncertainties regarding the accuracy of the NIRSpec flux calibration as a function of wavelength, we focused on studying line ratios of lines at comparable wavelength.
We find that these EoR galaxies deviated (by 0.5 dex) from the local correlation between the [O iii] /H and [Ne iii] /[O ii] line ratios. We attributed this deviation to an excess in the [Ne iii] /[O II] line ratio, which is consistent with the predictions from the FLARES simulations, where this offset is likely driven by the lower metallicity in galaxies at 6–9. Furthermore, from a measurement of the line flux and continuum level, we find that these galaxies exhibit large (400–1000 Å) [O iii] rest-frame equivalent widths, which are consistent with the large equivalent widths inferred from the (very red) measured (F356WF444W) colours. We find that the measured [O iii] and H EWs are consistent with those seen in extreme, intensely star-forming dwarf galaxies in the local Universe. However, in line with the FLARES predictions, such intense star formation and extreme nebular conditions are likely the norm, rather than the exception, in the epoch of reionisation.
Finally we discuss the prospects for distinguishing between star-forming galaxies and AGN in the epoch of reionisation using spectroscopy. Applying the [O iii] /H, [O ii]/H BPT diagram, the emission lines for which are all still accessible by NIRSpec at , we are unable to distinguish between nebular emission driven by star formation and AGN in our four EoR galaxies. However, upon using the colours from NIRCam photometry, and assuming the Nakajima & Maiolino (2022) models for star-forming galaxies and AGN, we find that star-forming galaxies and AGN exhibit distinct colours in the (F150WF200W) vs. (F200WF277W) plane. This separation in colour is attributable to the (assumed) power law continuum for AGN, which results in red colours in the aforementioned filter pairs at .
Thus it is through the combination of photometry and spectroscopy, by drawing on their synergy, that we will be able to obtain the most clear and comprehensive account of the properties of galaxies in the epoch of reionisation during the JWST era.
Acknowledgements
We thank the referee for their useful comments which helped to improve this article. JT thanks Andrew Bunker and Roberto Maiolino for useful discussions that helped guide the direction of this article. JT also thanks Tom Broadhurst for confirming that galaxies 06355 and 10612 are two distinct (i.e. not multiply-imaged) sources.
We are grateful to acknowledge Anthony Holloway, Sotirios Sanidas and Phil Perry for critical and timely help with computer infrastructure that made this work possible. We acknowledge support from the ERC Advanced Investigator Grant EPOCHS (788113), as well as a studentship from STFC. This work is based on observations made with the NASA/ESA Hubble Space Telescope (HST) and NASA/ESA/CSA James Webb Space Telescope (JWST) obtained from the Mikulski Archive for Space Telescopes (MAST) at the Space Telescope Science Institute (STScI), which is operated by the Association of Universities for Research in Astronomy, Inc., under NASA contract NAS 5-03127 for JWST, and NAS 5–26555 for HST. These observations are associated with program 14096 for HST, and 2736 for JWST. LF acknowledges financial support from Coordenação de Aperfeiçoamento de Pessoal de Nível Superior - Brazil (CAPES) in the form of a PhD studentship. CCL acknowledges support from the Royal Society under grant RGF/EA/181016. The Cosmic Dawn Center (DAWN) is funded by the Danish National Research Foundation under grant No. 140.
Data Availability
The NIRCam and NIRSpec data used in this analysis is publicly available from the Mikulski Archive for Space Telescopes (MAST) website: https://mast.stsci.edu/portal/Mashup/Clients/Mast/Portal.html. Any remaining data underlying the analysis in this article will be shared on reasonable request to the first author.
References
- Abazajian et al. (2009) Abazajian K. N., et al., 2009, Astrophys. J. Suppl. Ser., 182, 543
- Adams et al. (2023) Adams N. J., et al., 2023, MNRAS, 518, 4755
- Astropy Collaboration (2013) Astropy Collaboration 2013, Astron. Astrophys., 558, 33
- Austin et al. (2023) Austin D., et al., 2023, arXiv e-prints, p. arXiv:2302.04270
- Baldwin et al. (1981) Baldwin J. A., Phillips M. M., Terlevich R., 1981, Publ. Astron. Soc. Pacific, 93, 5
- Belfiore et al. (2016) Belfiore F., et al., 2016, Mon. Not. R. Astron. Soc., 461, 3111
- Belfiore et al. (2018) Belfiore F., et al., 2018, Mon. Not. R. Astron. Soc., 477, 3014
- Bertin & Arnouts (1996) Bertin E., Arnouts S., 1996, Astron. Astrophys. Suppl., 117, 393
- Bhatawdekar et al. (2019) Bhatawdekar R., Conselice C. J., Margalef-Bentabol B., Duncan K., 2019, Mon. Not. R. Astron. Soc., 486, 3805
- Bouwens et al. (2015) Bouwens R. J., et al., 2015, Astrophys. J., 803, 1
- Bowler et al. (2017) Bowler R. A., Dunlop J. S., McLure R. J., McLeod D. J., 2017, Mon. Not. R. Astron. Soc., 466, 3612
- Brinchmann (2022) Brinchmann J., 2022, arXiv e-prints, p. arXiv:2208.07467
- Brinchmann et al. (2004) Brinchmann J., Charlot S., White S. D. M., Tremonti C., Kauffmann G., Heckman T., Brinkmann J., 2004, Mon. Not. R. Astron. Soc., 351, 1151
- Bromm & Yoshida (2011) Bromm V., Yoshida N., 2011, Annu. Rev. Astron. Astrophys., 49, 373
- Calzetti et al. (2000) Calzetti D., Armus L., Bohlin R., Kinney A., Koornneef J., Storchi-Bergmann T., 2000, Astrophys. J., 533, 682
- Carnall et al. (2018) Carnall A. C., McLure R. J., Dunlop J. S., Davé R., 2018, Mon. Not. R. Astron. Soc., 480, 4379
- Carnall et al. (2019) Carnall A. C., et al., 2019, Mon. Not. R. Astron. Soc., 490, 417
- Carnall et al. (2022) Carnall A. C., et al., 2022, ApJ, 929, 131
- Carnall et al. (2023) Carnall A. C., et al., 2023, MNRAS, 518, L45
- Charlot & Fall (2000) Charlot S., Fall S., 2000, Astrophys. J., 539, 718
- Chauke et al. (2018) Chauke P., et al., 2018, Astrophys. J., 861, 13
- Coe et al. (2012) Coe D., et al., 2012, Astrophys. J., 757
- Coe et al. (2019) Coe D., et al., 2019, Astrophys. J., 884, 85
- Conroy (2013) Conroy C., 2013, Annu. Rev. Astron. Astrophys., 51, 393
- Crain et al. (2015) Crain R. A., et al., 2015, Mon. Not. R. Astron. Soc., 450, 1937
- Curti et al. (2017) Curti M., Cresci G., Mannucci F., Marconi A., Maiolino R., Esposito S., 2017, Mon. Not. R. Astron. Soc., 465, 1384
- Curti et al. (2022) Curti M., et al., 2022, Mon. Not. R. Astron. Soc., 512, 4136
- Curti et al. (2023) Curti M., et al., 2023, MNRAS, 518, 425
- Dickey et al. (2016) Dickey C. M., et al., 2016, Astrophys. J., 828, L11
- Duncan et al. (2014) Duncan K., et al., 2014, Mon. Not. R. Astron. Soc., 444, 2960
- Duncan et al. (2019) Duncan K., et al., 2019, ApJ, 876, 110
- Dunlop (2013) Dunlop J. S., 2013, Observing the First Galaxies, 1 edn. Springer Berlin, Heidelberg (arXiv:1205.1543), doi:10.1007/978-3-642-32362-1_5
- Endsley et al. (2021) Endsley R., Stark D. P., Chevallard J., Charlot S., 2021, Mon. Not. R. Astron. Soc., 500, 5229
- Ferguson et al. (2000) Ferguson H. C., Dickinson M., Williams R., 2000, Annu. Rev. Astron. Astrophys., 38, 667
- Ferrari et al. (2015) Ferrari F., De Carvalho R. R., Trevisan M., 2015, Astrophys. J., 814, 55
- Ferreira et al. (2022) Ferreira L., et al., 2022, ApJ, 938, L2
- Ferruit et al. (2022) Ferruit P., Jakobsen P., Giardino G., Rawle T., Alves de Oliveira C., Arribas S., Beck T., 2022, Astron. Astrophys., 661
- Finkelstein (2016) Finkelstein S. L., 2016, Publ. Astron. Soc. Aust., 33, e037
- Finkelstein et al. (2015) Finkelstein S. L., et al., 2015, Astrophys. J., 810, 71
- Fluetsch et al. (2021) Fluetsch A., et al., 2021, Mon. Not. R. Astron. Soc., 505, 5753
- Gallazzi et al. (2005) Gallazzi A., Charlot S., Brinchmann J., White S. D. M., Tremonti C. A., 2005, Mon. Not. R. Astron. Soc., 362, 41
- Gardner et al. (2006) Gardner J. P., et al., 2006, Space Sci. Rev., 123, 485
- Golubchik et al. (2022) Golubchik M., Furtak L. J., Meena A. K., Zitrin A., 2022, Arxiv
- Harikane et al. (2023) Harikane Y., et al., 2023, ApJS, 265, 5
- Izotov et al. (2011) Izotov Y. I., Guseva N. G., Thuan T. X., 2011, Astrophys. J., 728
- Izotov et al. (2021) Izotov Y. I., Thuan T. X., Guseva N. G., 2021, Mon. Not. R. Astron. Soc., 504, 3996
- Jakobsen et al. (2022) Jakobsen P., et al., 2022, Astron. Astrophys., 661
- James et al. (2016) James B. L., Auger M., Aloisi A., Calzetti D., Kewley L., 2016, Astrophys. J., 816, 40
- Jeong et al. (2020) Jeong M.-S., et al., 2020, ApJ, 902, L16
- Jiang et al. (2013) Jiang L., et al., 2013, Astrophys. J., 773
- Juneau et al. (2011) Juneau S., Dickinson M., Alexander D. M., Salim S., 2011, Astrophys. J., 736
- Kauffmann et al. (2003) Kauffmann G., et al., 2003, Mon. Not. R. Astron. Soc., 341, 33
- Kennicutt (1998) Kennicutt R. C., 1998, Annu. Rev. Astron. Astrophys., 36, 189
- Kennicutt & Evans (2012) Kennicutt R., Evans N. J., 2012, Annu. Rev. Astron. Astrophys., 50, 531
- Kewley et al. (2001) Kewley L. J., Dopita M. A., Sutherland R. S., Heisler C. A., Trevena J., 2001, Astrophys. J., 556, 121
- Kriek et al. (2015) Kriek M., et al., 2015, Astrophys. Journal, Suppl. Ser., 218
- Kriek et al. (2016) Kriek M., et al., 2016, Nature, 540, 248
- Kumari et al. (2019) Kumari N., Maiolino R., Belfiore F., Curti M., 2019, Mon. Not. R. Astron. Soc., 485, 367
- Laporte et al. (2014) Laporte N., et al., 2014, Astron. Astrophys., 562, 1
- Laporte et al. (2021) Laporte N., Meyer R. A., Ellis R. S., Robertson B. E., Chisholm J., Roberts-Borsani G. W., 2021, Mon. Not. R. Astron. Soc., 505, 3336
- Larameille (2010) Larameille F., 2010, Astron. Astrophys., 509
- Lovell et al. (2021) Lovell C. C., Vijayan A. P., Thomas P. A., Wilkins S. M., Barnes D. J., Irodotou D., Roper W., 2021, Mon. Not. R. Astron. Soc., 500, 2127
- Maiolino & Mannucci (2019) Maiolino R., Mannucci F., 2019, De re metallica: the cosmic chemical evolution of galaxies. Vol. 27, Springer Berlin Heidelberg, doi:10.1007/s00159-018-0112-2, %****␣main.bbl␣Line␣325␣****https://doi.org/10.1007/s00159-018-0112-2
- Mannucci et al. (2010) Mannucci F., Cresci G., Maiolino R., Marconi A., Gnerucci A., 2010, Mon. Not. R. Astron. Soc., 408, 2115
- Maraston & Strömbäck (2011) Maraston C., Strömbäck G., 2011, Mon. Not. R. Astron. Soc., 418, 2785
- Mingozzi et al. (2019) Mingozzi M., et al., 2019, Astron. Astrophys., 622, 1
- Mingozzi et al. (2020) Mingozzi M., et al., 2020, Astron. Astrophys., 636
- Nakajima & Maiolino (2022) Nakajima K., Maiolino R., 2022, Mon. Not. R. Astron. Soc., 513, 5134
- Newville et al. (2014) Newville M., Stensitzki T., Allen D. B., Ingargiola A., 2014, LMFIT: Non-Linear Least-Square Minimization and Curve-Fitting for Python, doi:10.5281/zenodo.11813, https://doi.org/10.5281/zenodo.11813
- Pascale et al. (2022) Pascale M., et al., 2022, ApJ, 938, L6
- Peng et al. (2015) Peng Y., Maiolino R., Cochrane R., 2015, Nature, 521, 192
- Planck Collaboration (2020) Planck Collaboration 2020, Astron. Astrophys., 641
- Pontoppidan et al. (2022) Pontoppidan K. M., et al., 2022, ApJ, 936, L14
- Price-Whelan et al. (2018) Price-Whelan A. M., et al., 2018, Astron. J., 156, 123
- Reddy et al. (2015) Reddy N. A., et al., 2015, Astrophys. J., 806, 259
- Rieke et al. (2005) Rieke M. J., Kelly D., Horner S., 2005, Cryog. Opt. Syst. Instruments XI, 5904, 590401
- Roper et al. (2022) Roper W. J., Lovell C. C., Vijayan A. P., Marshall M. A., Irodotou D., Kuusisto J. K., Thomas P. A., Wilkins S. M., 2022, Mon. Not. R. Astron. Soc., 514, 1921
- Sanders et al. (2018) Sanders R. L., et al., 2018, ApJ, 858, 99
- Schaerer & De Barros (2009) Schaerer D., De Barros S., 2009, Astron. Astrophys., 502, 423
- Schaerer et al. (2022) Schaerer D., Marques-Chaves R., Barrufet L., Oesch P., Izotov Y. I., Naidu R., Guseva N. G., Brammer G., 2022, A&A, 665, L4
- Schaye et al. (2015) Schaye J., et al., 2015, Mon. Not. R. Astron. Soc., 446, 521
- Searle & Sargent (1972) Searle L., Sargent W., 1972, Astrophys. J., 173, 25
- Shapley et al. (2015) Shapley A. E., et al., 2015, Astrophys. J., 801, 88
- Smit et al. (2014) Smit R., et al., 2014, Astrophys. J., 784, 1
- Smit et al. (2015) Smit R., et al., 2015, Astrophys. J., 801, 122
- Stanway et al. (2014) Stanway E. R., Eldridge J. J., Greis S. M., Davies L. J., Wilkins S. M., Bremer M. N., 2014, Mon. Not. R. Astron. Soc., 444, 3466
- Steidel et al. (2014) Steidel C. C., et al., 2014, Astrophys. J., 795
- Tacchella et al. (2022) Tacchella S., et al., 2022, arXiv e-prints, p. arXiv:2208.03281
- Tremonti et al. (2004) Tremonti C. A., et al., 2004, Astrophys. J., 613, 898
- Trump et al. (2022) Trump J. R., et al., 2022, arXiv e-prints, p. arXiv:2207.12388
- Trussler et al. (2020) Trussler J., Maiolino R., Maraston C., Peng Y., Thomas D., Goddard D., Lian J., 2020, Mon. Not. R. Astron. Soc., 491, 5376
- Trussler et al. (2021) Trussler J., Maiolino R., Maraston C., Peng Y., Thomas D., Goddard D., Lian J., 2021, Mon. Not. R. Astron. Soc., 500, 4469
- Vijayan et al. (2021) Vijayan A. P., Lovell C. C., Wilkins S. M., Thomas P. A., Barnes D. J., Irodotou D., Kuusisto J., Roper W. J., 2021, Mon. Not. R. Astron. Soc., 501, 3289
- Vijayan et al. (2022) Vijayan A. P., et al., 2022, Mon. Not. R. Astron. Soc., 511, 4999
- Wilkins et al. (2022a) Wilkins S. M., et al., 2022a, arXiv e-prints, p. arXiv:2204.09431
- Wilkins et al. (2022b) Wilkins S. M., et al., 2022b, arXiv e-prints, p. arXiv:2207.10920
- Witstok et al. (2021) Witstok J., Smit R., Maiolino R., Curti M., Laporte N., Massey R., Richard J., Swinbank M., 2021, Mon. Not. R. Astron. Soc., 508, 1686
- Yung et al. (2022) Yung L. Y. A., et al., 2022, MNRAS, 515, 5416
Appendix A Colour selection
In the main body of the paper we showed the colours predicted by the Yung et al. (2022) semi-analytic model, in comparison to the colours of the four EoR galaxies with spectroscopic redshifts. In Fig. 8 we instead show the predictions from individual snapshots of the FLARES simulations (Lovell et al., 2021; Vijayan et al., 2021; Vijayan et al., 2022; Roper et al., 2022; Wilkins et al., 2022a, b). We do note that interpolating between snapshots can lead to more extreme colour evolution, as emission lines pass in and out of photometric bands (see Wilkins et al., 2022b), which is an effect accounted for in the Yung et al. (2022) lightcones. We find once again that the F356WF444W colours (sensitive to the EW of [O iii] and H) of our four EoR galaxies (selected from only 5 arcmin2 of NIRCam imaging), lie within the extreme ends of the FLARES simulation predictions (where the 40 zoom-in simulations have been selected from a parent volume of 3.2 cGpc3, thus capturing rare overdense regions and extreme objects in colour space). Thus our results indicate that galaxies in the epoch of reionisation may, on average, have stronger emission lines than the FLARES simulations predict.
Appendix B Photometric properties
In Section 3 we used the SED-fitting code BAGPIPES to investigate the accuracy with which photometric redshfits can be derived using NIRCam photometry alone. In this Appendix, we repeat this analysis using Le Phare and EAZY. We follow the fitting methodology outlined in Adams et al. (2023) and Austin et al. (2023).
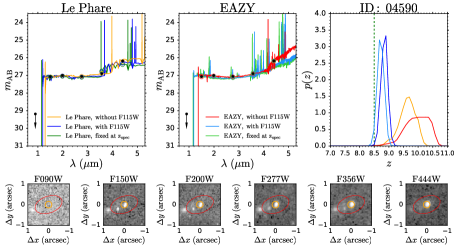
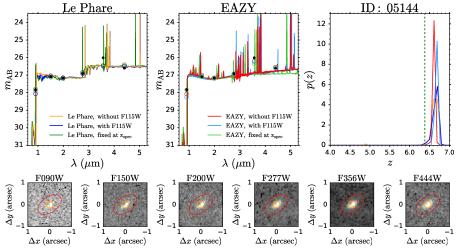
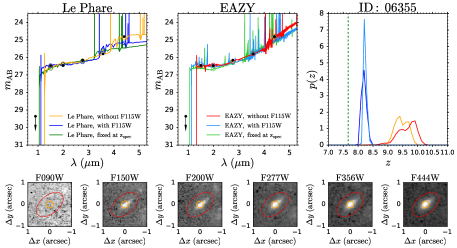
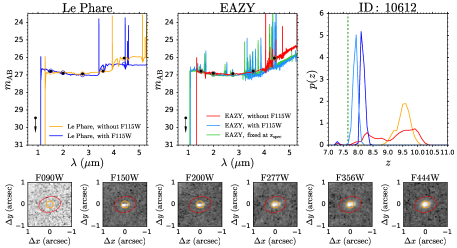
The observed 0.32 arcsec aperture-corrected photometry, together with the best-fit Le Phare (left panels) and EAZY (middle) SEDs, as well as the resulting posterior redshift probability distributions (right) are shown in Fig. 9. We also show cutouts for the six NIRCam bands, together with our 0.32 arcsec diameter (orange) and Kron elliptical extraction apertures (red).
We note that the flux extracted from the Kron elliptical aperture for galaxy 04590 is somewhat contaminated by the light from two neighbouring sources on the sky. The stellar mass and SFR determined for this galaxy using the 0.32 arcsec aperture-corrected fluxes are instead ) = 7.44 and SFR = 0.28 .
As with our BAGPIPES analysis, without a F115W measurement (orange and red curves), we find that the flux excess in the F444W band is incorrectly attributed to a Balmer break, rather than [O iii] + H line emission. By including mock F115W photometry, both the Le Phare and EAZY photometric redshifts (dark and light blue) better agree with the known spectroscopic redshifts. However, there are usually still some discrepancies, with e.g. the posterior redshift distributions having zero probability at the known spectroscopic redshift (ID 06355), the Le Phare fits fixed at the known spectroscopic redshift (shown in green) not having sufficient emission line strength to match the data (IDs 05144, 06355), or the Le Phare fit fixed at the spectroscopic redshift failing entirely (10612). Thus F115W imaging, together with templates which incorporate high equivalent width emission lines, are likely both essential in order to derive accurate photometric redshifts for EoR galaxies with NIRCam data (see also Adams et al., 2023).