Corresponding author: Tanay Bhandarkar
E-mail: tanayb@sas.upenn.edu
The Simons Observatory: Development and Validation of the Large Aperture Telescope Receiver
Abstract
The Simons Observatory (SO) is a ground-based cosmic microwave background (CMB) survey experiment that consists of three 0.5 m small-aperture telescopes (SATs) and one 6 m large-aperture telescope (LAT), sited at an elevation of 5200 m in the Atacama Desert in Chile. In order to meet the sensitivity requirements set for next-generation CMB telescopes, the LAT will deploy 30,000 transition edge sensor (TES) detectors at 100 mK across 7 optics tubes (OT), all within the Large Aperture Telescope Receiver (LATR). Additionally, the LATR has the capability to expand to 62,000 TES across 13 OTs. The LAT will be capable of making arcminute-resolution observations of the CMB, with detector bands centered at 30, 40, 90, 150, 230, and 280 GHz. We have rigorously tested the LATR systems prior to deployment in order to fully characterize the instrument and show that it can achieve the desired sensitivity levels. We show that the LATR meets cryogenic and mechanical requirements, and maintains acceptably low baseline readout noise.
keywords:
Astronomical Instrumentation, Cosmic Microwave Background, Cryogenic Receiver, Multiplexing readout, Observational Cosmology1 Introduction
Observations of the cosmic microwave background (CMB) over the last several decades have been instrumental to the development of modern cosmological models, such as -CDM. Our understanding of the CMB has evolved through full-sky surveys conducted by space-based satellite experiments such as COBE, WMAP[1] and Planck[2]. Large aperture ground based experiments, such as the Atacama Cosmology Telescope (ACT)[3] and the South Pole Telescope (SPT)[4], have improved our ability to make small angular measurements of the CMB. These small angular measurements have offered insights into the development of large scale structure, the upper bound on the sum of neutrino masses, the Sunyaev-Zeldovich effects (SZ) and primordial power spectra. Other ground based telescopes, such as CLASS[5] and BICEP/Keck, utilize small apertures to primarily measure the B-mode polarization signal.
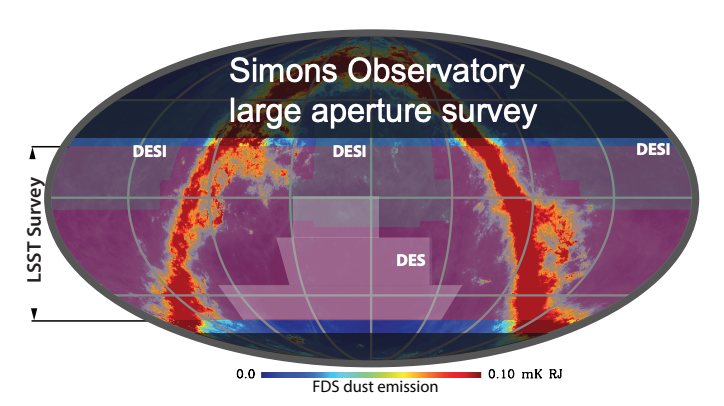
The Simons Observatory (SO) is a next-generation, ground-based CMB experiment, consisting of three 0.5 m small-aperture telescopes (SATs) and one 6 m large-aperture telescope (LAT). These telescopes will be deployed at an elevation of 5200 m in the Atacama Desert of Chile. The LAT will utilize a crossed-Dragone optical design, enabling a large focal plane for the telescope. The Large Aperture Telescope Receiver (LATR) will occupy the LAT’s focal plane with 30,000 transition edge sensor (TES) bolometers across 7 optics tubes (OT), and has the capability to upgrade to 62,000 TES across 13 OTs. Each OT is specifically designed for a separate frequency band (with targeted band centers); low-frequency (30 and 40 GHz), medium-frequency (90 and 150 GHz) and ultra-high frequency (230 and 280 GHz). Over the course of it’s observing campaign, the LAT will scan 40% of the sky at arcminute resolution, with significant overlap with other surveys at complementary wavelengths, such as the Dark Energy Survey (DES)[6], the Dark Energy Spectroscopic Instrument (DESI)[7] and the Legacy Survey of Space and Time (LSST) with the Vera Rubin Observatory[8] (Figure 1). The field of view of the LATR will be approximately in diameter. The LAT will focus on small-angular sciences, including measurements of the temperature, polarization and lensing power spectra, the detection of galaxy clusters through the thermal SZ effect, the detection of extra-galactic point sources and transient event monitoring [9].
2 LATR Design
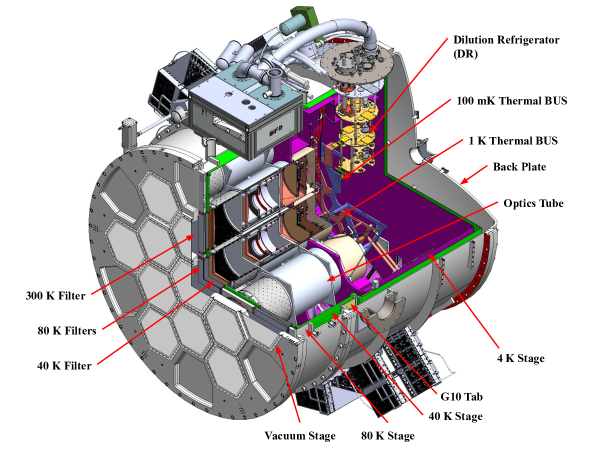
The LATR consists of 5 separate nominal temperature stages; 300 K, 80 K, 40 K, 4 K, 1 K and 100 mK. We will describe the design of the cryostat in this section, and further details can be found in other publications.[10, 11]. Figure 3 shows the cross-sectional view of a full LATR.
2.1 Cryo-mechanical and Optical Design
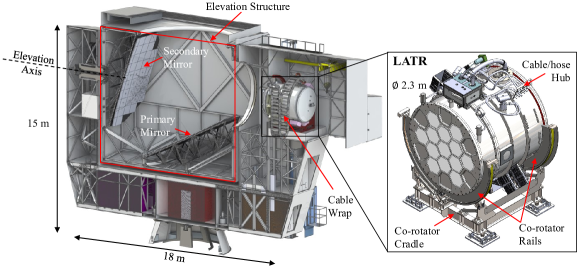
The 300 K vacuum shell is 2.4 m in diameter, and 2.6 m in length, made of aluminum-6061. The front plate is 6 cm thick with a honeycomb pattern for 13 anti-reflective (AR) coated ultra-high-molecular-weight polyethylene (UHMWPE) 1/8” thick windows. The thicknesses of the vacuum shell, front and back plates, and windows were determined following a finite element analysis (FEA) study into the structural requirements at atmospheric pressures [12]. Behind each UHMWPE window sits a double-sided IR blocker (DSIR), which reflects thermal radiation away from the the colder stages [13]. The 300 K stage will mate the LATR to the LAT through a pair of co-rotating rails, that turn the receiver as the elevation structure of the telescope rotates (see Figure 2).
The 80 K stage consists of the 80 K filter plate and the 80 K shell. This filter plate holds a DSIR and an anti-reflection (AR) coated alumina filter[14] per OT. This set of filters absorb a significant fraction of radiative power that comes in through the 300 K windows. The 40 K stage holds a single 40 K DSIR per OT. The 4 K stage consists of a back lid, and filter plate and a radiation shield. Because the OTs mount on this stage, the 4 K filter plate is significantly thicker than the other cold filter plates to better support the weight of the OTs and improve the thermal path from the pulse tubes to the OTs. Additionally, the 80 K, 40 K and 4 K stages are all wrapped in 30 layers of multi-layer insulation (MLI), preventing thermal radiation from reaching the colder stages.
The 80 K stage is cooled by two PT-90 pulse tube coolers, while the 40 K and 4 K stages are cooled by a pair of two-stage PT-420 pulse tube coolers111https://www.cryomech.com/. All pulse tube heads are coupled to their respective cold stage by a set of copper straps. Each copper strap is a pair of oxygen-free, high conductivity (OFHC) copper plates, bridged by copper braids.
The requirements for the LATR design demands the ability to balance mechanical integrity with thermal isolation between the different temperature stages. To accomplish this, the LATR utilizes three separate rings of G-10 tabs. These tabs mechanically connect the 300 K stage to the 80 K stage, the 300 K stage to the 40 K stage, and the 40 K stage to the 4 K stage. Each G-10 tab consists of two aluminum ”feet” epoxyed to a sheet of G-10. The feet are then bolted to their respective cold stage cold stages.
The TES detectors are cooled to 100 mK in order to reduce thermal noise and improve sensitivity. To avoid larger thermal gradients across OT 100 mK stages, the LATR implements a wheel-like structure for its 1 K and 100 mK thermal back-up structure (BUS) cold stage (see Figure 4). The thermal BUS stages are both made of OFHC copper. Thermal FEA predicts a gradient of 5 mK across the entire 100 mK BUS. These cold stages are cooled with a Bluefors222https://bluefors.com/ model LD 400 dilution refrigerator (DR). The thermal BUS stages are coupled to their respective stages of the DR through gold-plated, braided copper straps. In order to cool the 1 K stage and focal plane baseplates (FPB) that supports the detector arrays in each OT, the LATR utilizes a pair copper rod cold fingers (one on the FPB(100 mK) or radiation lid (1 K), one on each stage of the thermal BUS), bridged by a separate gold-plated, braided copper strap. The 1 K BUS is mounted to the 4 K plate by six twill-ply carbon fiber tube tripods. The 100 mK BUS is supported by a truss of carbon fiber connecting to the 1 K BUS.
2.2 Readout and Detector Design
In order to achieve the sensitivity goals of SO, the LATR will field 62,000 TES detectors in its final configuration. To efficiently read out this large volume of sensors, the LATR implements a microwave squid multiplexing readout system, carrying tones along coaxial lines from the 300 K stage down to the the 100 mK universal focalplane modules (UFMs), and back out. The expectation is to be able to read out detectors per coaxial line.[15] UFM design has been detailed in prior publications.[16]
2.2.1 Cold Readout design
The cold readout chain carries RF (4-6 GHz) tones and DC (1 MHz) biases output by warm readout electronics, into the cryogenic receiver, to the cryogenic detectors and back out to the SMuRF. From 300 K to 4 K, the LATR readout system is contained within the Universal Readout Harness (URH), an assembly that is used throughout SO receivers[17]. In a single URH, there are up to 12 bias channels and 24 coaxial channel. A bias channel is a 50 pin input that carries 2 flux ramp line pairs, 12 detector bias pair lines, and 4 cryogenic amplifier bias lines. Each coaxial channel consists of an input connection and output connection, and the respective cold readout components. Ultimately, each UFM is read out through two coaxial chains, and each bias channel in the URH is coupled to two separate coaxial chains. In sum, a single, fully populated LATR URH can read out up to 12 UFMs.
At the 4 K stage, a series of coaxial connections (referred to as coax highways from here out) and DC bias lines connect the URHs to individual OTs. The input lines in the OTs consist of a series of attenuators to optimize tone power that reaches the resonators, and DC blocks that provide thermal isolation in coaxial connections between cold stages. On the output line from the UFMS, there are low-noise amplifiers (LNA) to amplify the output signal, and isolators to prevent standing waves between the UFM and the LNAs. In parallel to the coaxial connections, each readout chain contains DC bias lines that travel all the way down to the UFM. These bias lines provide voltage biases for the LNAs, detector biases and a ramp signal for the flux ramp signal used by warm electronics to linearize the resonator frequency shifts produced by the detectors.[18]
2.2.2 Warm Readout design
Each TES on an UFM is coupled to a resonator at a unique resonant frequency, between 4-6 GHz. SO will uses the SLAC Microresonator Radio Frequency (SMuRF) electronics to generate these 4-6 GHz frequency tones, transmitted through the cryogenic RF components via coaxial lines. Up to 147 TES detectors share the same voltage bias line and 882 detector channels share the same resonator flux ramping lines, both of which are generated by the SMuRF electronics. [19]
4-6 GHz RF tones are generated in two Advanced Mezzanine Cards (AMC) seated in a carrier card. Every AMC is connected to a single URH coaxial channel, along with a warm amplifier mounted on the URH. Each carrier card is coupled to a Rear Transition Module (RTM), which is responsible for generating all the low frequency signals (detector biases, flux ramps, amplifier biases). The RTMs are connected to a single cryostat card (cryocard), which is also mounted above the URH. The cryocards convert the TES bias and flux ramp signals from the RTM’s low impedance voltage sources to high impedance current sources. It also provides regulated power supplies, bias line filtering and gate bias voltages to LNAs.
In order to reduce the effects of ambient RF noise and minimize cable loss, the SMuRF crates are mounted directly on the LATR shell. There are extensive ongoing studies into effects of thermal and vibrational environments on the warm readout system.
3 Validation
3.1 Cryogenic Validation
In order to meet detector sensitivity and noise requirements, it is crucial for the LATR to cool every OT FPB to a stable 100 mK level. Our 100 mK loading estimates for various configurations are derived from baseline load curves. In other words, we first characterized our DR by applying a range of thermal loads to its mixing chamber and still line stages. We then methodically built up the LATR by adding different cryogenic components; the thermal BUS, dark OTs, and finally optically coupled OTs. Past studies of the LATR have calculated the thermal load of the 100 mK thermal BUS to be 20W, and the thermal load of a single dark OT to be5W, and the temperature of the OT’s FPB varied by less than 0.3 mK over 24 hours [10] (In this study, ”dark” indicates no cold optics below 40 K, and an aluminum blank over the OT’s 4 K filter cells). Here we will detail the LATR cryogenic thermal loading values with 7 dark OTs, and then with 1 optical. Details on 80 K, 40 K and 4 K loading can be found in Tables 1,2 and 3.
3.1.1 7 Dark OTs
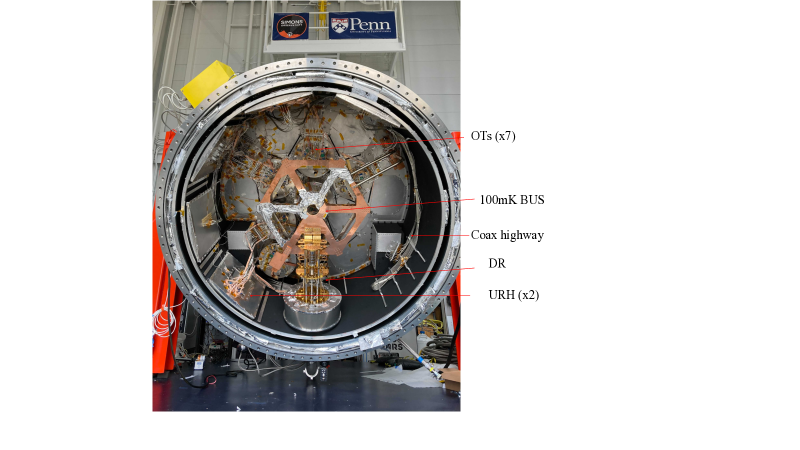
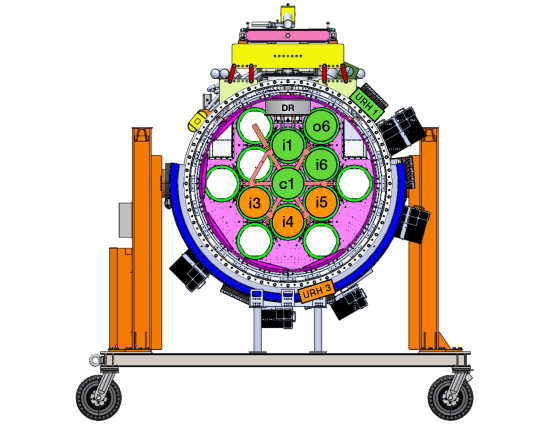
A significant milestone in LATR lab testing was the cryo-mechanical integration of 7 dark OTs, in the deployment configuration positions, as shown in Figure 5. In this configuration, the OTs were covered with an aluminum plate at the 4 K filter stack. At the 100 mK stage, the DR mixing chamber plate stabilized at about 43.9 mK. Based on prior load characterizations, we estimated that each OT on average exerts 7.1W at 100 mK through parasitic loading. The hottest FPB in this configuration was 75 mK. Projecting these numbers out to a 13 OT configuration, we estimate that the hottest FPB would be 105 mK. At this temperature, we run the risk of putting detectors over their expected baseline temperature. In order to rectify this, we plan to install additional thermal straps coupling the DR to the 100 mK thermal BUS, thus improving the transfer of cooling power to the BUS.
At the 40 K and 4 K stage, we estimate W and W respectively. Extrapolating this loading to 13 OTs, we find that the 40 K stage and 4 K stage will cool to K and K respectively. Both of these values fall within specifications. At 80 K, we measure W. For 13 OTs, these loading values suggest at filter plate temperature of 82 K, which we expect will be sufficiently cold.
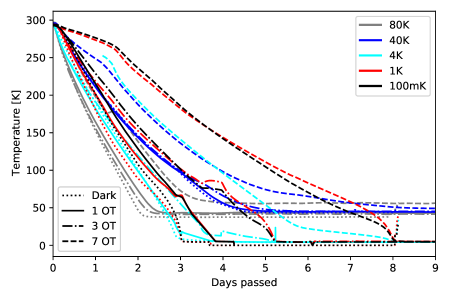
When the LATR is finally in the field, cooldown speed is of great importance; the more time it takes to reach base temperature, the less time is spent observing. With 7 OTs, we found that it takes approximately 8 days for all of the LATR cold stages to reach base temperature (Figure 6 ). The cooldown time is dominated by the drop to 4 K on the coldest stages, while the 80 K and 40 K stages reach their respective base temperatures within 5 days. We utilize a mechanical heat switch assembly, which creates thermal shorts between the 4 K plate and the 1 K and 100 mK BUS. Without this assembly, simulations suggest it would the LATR to take over 35 days to reach base temperature. [20]. We expect that with 13 OTs, the heat switches will cut that time in half.
3.1.2 1 Optical OT
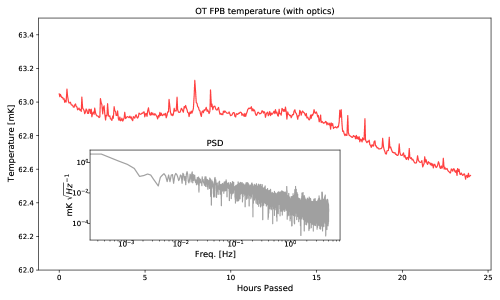
After completing dark cryogenic testing of the OTs, we installed one OT equipped with the full cold filter and lens stack at the OTi6 position (Figure 5). This test configuration included the full complement of readout hardware, but did not include full detector array assemblies. In lieu of detector arrays, we installed three copper mock arrays with Al feedhorns, to mimic the expected mass and collecting area of an UFM at that stage. The base temperature of the OT’s FPB was 55 mK, with very little variation over the course of 24 hours (see Figure 7). Based on thermal load curves taken when the LATR was dark, and only cooling the 100 mK thermal BUS, we determined that the thermal load of a single optical OT 6.0 W. Thermal simulations predict that the full detector arrays will add 1.0 W per OT when they are voltage biased. This loading number is higher than predicted at the 100 mK stage; we expect additional straps mentioned in section 3.1.1 to augment cooling transfer sufficiently.
Based on our cryogenic testing, there appear to be small discrepancies between loading numbers extracted from different cooldowns. There are a couple explanations for this phenomenon. One, comparing thermal loading between cooldowns assumes that cold strapping is assembled identically between tests. In reality, this is difficult to ensure; the strapping surfaces experience wear and bolts may not always be tightened to the same torque. Second, it is difficult to precisely measure the thermal loading to sub-W levels due to variations in hardware and noise in thermometry data.
| Test Configuration | 80 K Plate Temperature | Thermal Loading |
|---|---|---|
| Dark | K | W |
| 2 Filter Stacks | K | W |
| 3 Filter Stacks | K | W |
| 7 Filter Stacks | K | W |
| Test Configuration | 40 K Plate Temperature | 40 K Thermal Loading |
|---|---|---|
| Dark* | K | W |
| 2 Filter Stacks | K | W |
| 3 Filter Stacks | K | W |
| 7 Dark OTs | K | W |
| 1 Optical OT | K | W |
| Test Configuration | 4 K Plate Temperature | 4 K Thermal Loading |
|---|---|---|
| Dark* | K | W |
| 2 Filter Stacks | K | W |
| 3 Filter Stacks | K | W |
| 7 Dark OTs | K | W |
| 1 Optical OT | K | W |
3.2 Readout Validation
Given the complexity of the LATR’s readout design, it is important to show that we are able to maintain acceptably low readout noise when deploying UFMs. Past studies have shown TES white noise levels are close to expected models in a single pixel box, containing 6 TES and 65 resonators[11]. LATR MF UFM in situ testing is planned before deployment. This testing includes establishing baseline receiver noise levels, and studies into the effects of various environmental factors, such as vibrations, cryogenic thermal instability, ambient RF backgrounds and warm readout thermal coupling. Optical testing, including holography, cross-polarization measurements and beam mapping, has been conducted in a testbed cryostat [21].
4 Conclusion
The Simons Observatory (SO) Large Aperture Telescope (LAT) will be a sensitive millimeter-wave telescope with a large focal plane. The Large Aperture Telescope Receiver (LATR) will occupy this focal plane with up to 62,000 transition edge sensor (TES) detectors, across 13 modular optics tubes (OT). Each OT will contain 3 universal focal plane module (UFM) arrays, and the respective readout and cold optics colder than 4 K. Due to the sensitivity requirements, the LATR must balance a complex optical and readout design with a robust cryo-mechanical design. Through several rounds of cryogenic testing, we show that the LATR will be capable of cooling down cold optical elements, readout assemblies and detector arrays for 7 OTs for its initial deployment. For 13 OTs, we will add additional cold strapping to ensure we are comfortably within cryogenic specifications. In order to optimize TES detector noise levels, the LATR must achieve a stable 100 mK base temperature. Cryogenic lab testing of the receiver shows that it is capable of cooling the focal plane baseplate of a single optically coupled optics tube (OT) to a base temperature of 54 mK. Testing of multiple optically coupled OTs with fully functional UFMs is underway.
Additionally, lab testing has demonstrated the viability of the LATR’s readout system, including its ability to track resonators and bias detectors. Further laboratory readout testing is planned, including studies into baseline noise levels and environmental effects. These tests will employ deployment-grade MF UFMs, with full cold optical stacks installed. At the time of this proceeding, the expectation is that the LATR will deployed to the field in early 2023, with first science observations occurring later that year.
5 Acknowledgements
This work was funded by the Simons Foundation (Award #457687, B.K.) and the University of Pennsylvania. Gabriele Coppi is supported by the European Research Council under the Marie Skłodowska Curie actions through the Individual European Fellowship No. 892174 PROTOCALC.
References
- [1] Bennett, C. L., Larson, D., Weiland, J. L., Jarosik, N., Hinshaw, G., Odegard, N., Smith, K. M., Hill, R. S., Gold, B., Halpern, M., Komatsu, E., Nolta, M. R., Page, L., Spergel, D. N., Wollack, E., Dunkley, J., Kogut, A., Limon, M., Meyer, S. S., Tucker, G. S., and Wright, E. L., “NINE-YEAR WILKINSON MICROWAVE ANISOTROPY PROBE ( WMAP ) OBSERVATIONS: FINAL MAPS AND RESULTS,” The Astrophysical Journal Supplement Series 208, 20 (sep 2013).
- [2] Planck Collaboration, “Planck 2018 results - i. overview and the cosmological legacy of planck,” A&A 641, A1 (2020).
- [3] Thornton, R. J. et al., “The atacama cosmology telescope: The polarization-sensitive actpol instrument,” The Astrophysical Journal Supplement Series 227, 21 (Dec 2016).
- [4] Ruhl, J. et al., “The south pole telescope,” Millimeter and Submillimeter Detectors for Astronomy II (Oct 2004).
- [5] Xu, Z., Brewer, M. K., Rojas, P. F., Li, Y., Osumi, K., Pradenas, B., et al., “Two-year Cosmology Large Angular Scale Surveyor (CLASS) Observations: 40 GHz Telescope Pointing, Beam Profile, Window Function, and Polarization Performance,” The Astrophysical Journal 891, 134 (Mar 2020).
- [6] Sevilla-Noarbe, I., Bechtol, K., Kind, M. C., Rosell, A. C., Becker, M. R., Drlica-Wagner, A., Gruendl, R. A., Rykoff, E. S., Sheldon, E., Yanny, B., et al., “Dark energy survey year 3 results: Photometric data set for cosmology,” The Astrophysical Journal Supplement Series 254, 24 (may 2021).
- [7] DESI Collaboration, “The desi experiment part i: Science,targeting, and survey design,” (2016).
- [8] Ivezić, Ž., Kahn, S. M., Tyson, J. A., et al., “LSST: From science drivers to reference design and anticipated data products,” The Astrophysical Journal 873, 111 (mar 2019).
- [9] The Simons Observation Collaboration, “The simons observatory: science goals and forecasts,” Journal of Cosmology and Astroparticle Physics 2019, 056–056 (feb 2019).
- [10] Zhu, N., Bhandarkar, T., Coppi, G., Kofman, A. M., Orlowski-Scherer, J. L., Xu, Z., et al., “The Simons Observatory Large Aperture Telescope Receiver,” The Astrophysical Journal Supplement 256, 23 (Sept. 2021).
- [11] Xu, Z. et al., “The simons observatory: The large aperture telescope (LAT),” Research Notes of the AAS 5, 100 (Apr 2021).
- [12] Orlowski-Scherer, J. L., Zhu, N., Xu, Z., et al., “Simons Observatory large aperture receiver simulation overview,” in [Millimeter, Submillimeter, and Far-Infrared Detectors and Instrumentation for Astronomy IX ], Zmuidzinas, J. and Gao, J.-R., eds., 10708, 644 – 657, International Society for Optics and Photonics, SPIE (2018).
- [13] Ade, P. A. R., Pisano, G., Tucker, C., and Weaver, S., “A review of metal mesh filters,” in [Society of Photo-Optical Instrumentation Engineers (SPIE) Conference Series ], Zmuidzinas, J., Holland, W. S., Withington, S., and Duncan, W. D., eds., Society of Photo-Optical Instrumentation Engineers (SPIE) Conference Series 6275, 62750U (June 2006).
- [14] Golec, J. E., McMahon, J. J., Ali, A., Dicker, S., Galitzki, N., Harrington, K., Westbrook, B., Wollack, E. J., Xu, Z., and Zhu, N., “Design and fabrication of metamaterial anti-reflection coatings for the Simons Observatory,” in [2021SPIE11451 ], Navarro, R. and Geyl, R., eds., 11451, 1182 – 1189, International Society for Optics and Photonics, SPIE (2020).
- [15] Rao, M. S., Silva-Feaver, M., et al., “Simons Observatory Microwave SQUID Multiplexing Readout – Cryogenic RF Amplifier and Coaxial Chain Design,” arXiv e-prints , arXiv:2003.08949 (Mar. 2020).
- [16] McCarrick, H. and others, E. H., “The simons observatory microwave SQUID multiplexing detector module design,” The Astrophysical Journal 922, 38 (nov 2021).
- [17] Moore, J. et al., “Development and performance of Universal Readout Harnesses for the Simons Observatory,” in [Society of Photo-Optical Instrumentation Engineers (SPIE) Conference Series ], (2022). in preparation.
- [18] Mates, J. A. B., Irwin, K. D., Vale, L. R., Hilton, G. C., Gao, J., and Lehnert, K. W., “Flux-ramp modulation for squid multiplexing,” JLTP 167, 707–712 (Jun 2012).
- [19] Henderson, S. W. et al., “Highly-multiplexed microwave SQUID readout using the SLAC Microresonator Radio Frequency (SMuRF) electronics for future CMB and sub-millimeter surveys,” in [Millimeter, Submillimeter, and Far-Infrared Detectors and Instrumentation for Astronomy IX ], Zmuidzinas, J. and Gao, J.-R., eds., 10708, 170 – 185, International Society for Optics and Photonics, SPIE (2018).
- [20] Coppi, G., Xu, Z., et al., “Cooldown strategies and transient thermal simulations for the Simons Observatory,” in [Millimeter, Submillimeter, and Far-Infrared Detectors and Instrumentation for Astronomy IX ], Zmuidzinas, J. and Gao, J.-R., eds., 10708, 246 – 258, International Society for Optics and Photonics, SPIE (2018).
- [21] Harrington, K. et al., “The Integration and Testing Program for the Simons Observatory Large Aperture Telescope Optics Tubes,” in [Society of Photo-Optical Instrumentation Engineers (SPIE) Conference Series ], (Dec. 2020).