The emergence of interstellar molecular complexity explained by interacting networks,
PNAS 119 (30) e2119734119 (2022)
https://www.pnas.org/doi/10.1073/pnas.2119734119
Abstract
Abstract: Recent years have witnessed the detection of an increasing number of
complex organic molecules in interstellar space, some of them being of
prebiotic interest. Disentangling the origin of interstellar prebiotic
chemistry and its connection to biochemistry and ultimately to biology
is an enormously challenging scientific goal where the application of
complexity theory and network science has not been fully exploited.
Encouraged by this idea, we present a theoretical and computational
framework to model the evolution of simple networked structures toward
complexity. In our environment, complex networks represent simplified
chemical compounds, and interact optimizing the dynamical importance of
their nodes. We describe the emergence of a transition from simple
networks toward complexity when the parameter representing the
environment reaches a critical value. Notably, although our system
does not attempt to model the rules of real chemistry, nor is dependent
on external input data, the results describe the emergence of complexity
in the evolution of chemical diversity in the interstellar medium.
Furthermore, they reveal an as yet unknown relationship between the
abundances of molecules in dark clouds and the potential number of chemical
reactions that yield them as products, supporting the ability of the
conceptual framework presented here to shed light on real scenarios. Our
work reinforces the notion that some of the properties that condition
the extremely complex journey from the chemistry in space to prebiotic
chemistry and finally to life could show relatively simple and universal
patterns.
Significance statement: The road to life is punctuated by transitions toward complexity, from astrochemistry to biomolecules and eventually to living organisms. Disentangling the origin of such transitions is a challenge where the application of complexity and network theory has not been fully exploited. We introduce a computational framework in which simple networks simulate the most basic building bricks of life and interact to form complex structures, leading to an explosion of diversity when the parameter representing the environment reaches a critical value. While this model is abstract and unrelated to chemical theory, its predictions reliably mimic the molecular evolution in the interstellar medium during the transition toward chemical complexity, suggesting that the rules leading to the emergence of complexity may be universal.
The origin of life on Earth is far away from being unveiled. Life could have appeared spontaneously in our early planet about 4 billion years ago, or exist previously in the outer space and be brought by dust and meteoroids, as panspermia states. An intermediate hypothesis is the molecular panspermia, which proposes that the original building blocks of life could have been produced in the interstellar medium (ISM) and be introduced in the early Earth by asteroids and meteorites during the Late Heavy Bombardment that took place between 3.8 and 4.1 billion years ago, importantly enriching prebiotic chemistry. Over 200 molecules have been detected in the ISM, with some of them being prebiotically relevant as e.g. glycolaldehyde, urea or ethanolamine Hollis et al. (2004); Belloche, A. et al. (2019); Jiménez-Serra et al. (2020); Rivilla et al. (2021). Prebiotic molecules such as glycine or ribose have indeed been found in meteorites and comets Altwegg et al. (2017); Furukawa et al. (2019), which supports the idea that prebiotic species could initially form in interstellar space, and be transferred later on to planetesimals and to Earth during the formation of the Solar system.
In parallel to the efforts to understand the origin of life from the biochemical optics, the development and advance of computation in the last fifty years propitiated the study of life modeled as a cellular automaton Neumann and Burks (1966); Wolfram (1983). Despite the simplicity of the rules, the different systems under study, in particular Conway’s Game of Life Gardner (1970), presented an unexpected variety of spatio-temporal patterns and cast light on how complexity, emergence, and self-organization arise from a simple system. More complex systems were introduced in the 80’s to model Darwinian evolution with the use of a new type of artificial life where organisms described as computer programs could self-replicate, adapt and mutate by natural selection, mostly competing for the control of the memory of the computer (e.g. CoreWar Rasmussen et al. (1990) and Avida Lenski et al. (1999); Adami et al. (2000)). The introduction of these digital organisms to address fundamental biological questions was supported on two main statements. First, they provide a way to generalize life beyond the organisms detected so-far in our biosphere. Second, they allow to perform, enlarge and repeat experiments on a scale that is unachievable with real entities Lenski et al. (1999).
In order to assess whether artificial life and its connection with complex networks theory can bring light to the study of the origin of life, in this work we present a computational framework, NetWorld, where networks interact following very simple local rules inspired in network science and game theory leading to a chemistry of networks. Our objective is to test using real astrochemical data whether a basic digital framework can reproduce certain general properties of the difficult transition from chemistry to biology, and therefore describe in an abstract level the creation of the basic building blocks of life.
I Results
In NetWorld every chemical compound is represented by a network, and this allows us to apply the strength and tools of complex network theory. From simply isolated nodes that simulate an initial state of total lack of complexity, this new artificial chemistry shows the emergence of a transition beyond which the environment permits the appearance of a rich variety of networks with different spectral, topological and dynamical properties, mimicking in a very simplified manner the first steps of prebiotic chemistry and its natural evolution toward complexity. We will pay special attention to the descriptive and predictive ability of this framework, showing that the results throw light on the chemical evolution toward complexity of molecular clouds in the interstellar medium and reveal a so-far-unknown relationship between the abundances of the molecules present in dark clouds and the number of chemical reactions that have them as products.
I.1 Description and rules of the model
An artificial chemistry model is defined by three components: a set of all possible structures, a set of rules that govern the interaction among structures and an algorithm that describes the reaction domain Dittrich et al. (2001). Furthermore, depending on their level of abstraction, models can be classified in analogous, when they try to be faithful to natural chemistry, and abstract, otherwise. According to these definitions, NetWorld could be understood as an extremely abstract artificial chemistry model, where nodes stand for indistinguishable basic entities –they are unweighted, and have no different properties to represent the chemical valency or size of atoms, for example–, and the bonds between nodes are represented by undirected and unweighted links. In a simple case these entities could be molecules where nodes stand for atoms and links for their interactions. However, as its internal rules are so different to those that govern real chemistry, our approach differs drastically from the large myriad of artificial chemistry models that quantitatively represent real processes through detailed descriptions of the physico-chemical interaction between atoms Dittrich et al. (2001); Benkö et al. (2003); Banzhaf and Yamamoto (2010).
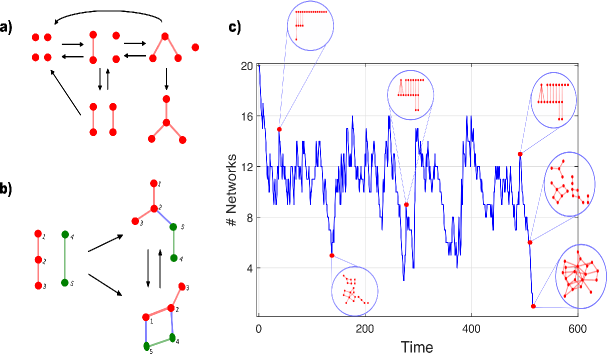
Figure 1 presents a visual description of the evolutionary dynamics described by NetWorld, and Fig. 1(a) shows a toy example of 4 initial nodes. A rigorous explanation of the algorithm is presented in Supporting Information Texts S1 to S3, an analysis of the dependence of the computation time with NetWorld’s parameters is introduced in Supporting Information Text S4 and information on the public availability of the code is found in Supporting Information Text S5. Each process is started with an initial number of isolated nodes. Nodes are neither created nor destroyed during the process. In each time step , the population consists of networks that will be made of the available nodes for the total ensemble. At the beginning of each time step , two networks and of the total population are chosen randomly. They interact following a simple set of rules explained below and in Supporting Information Text S1.A. They either form a new network , simulating the reaction , or fail to join and remain as and . In the latter case, a different pair of networks and is chosen until one pair succeeds in forming a new network. At the end of the time step, every network in the population has a partition probability
| (1) |
of being divided into smaller pieces, simulating the reaction (see Supporting Information Text S1.B for a full description of the partition algorithm). The stability parameter is the second smallest eigenvalue associated with the Laplacian matrix of network . It is also known as the algebraic connectivity or the Fiedler eigenvalue, and represents the resistance of a network to being split into different communities Newman (2010). The environment parameter concentrates the whole physico-chemical properties of the environment, such as the temperature or the radiation. is constant during the whole process and it is the unique relevant global parameter of our model. When a new time step starts, the same process is repeated with the new collection of networks. Note that and for all . The process finishes when (i) the totality of nodes collapse in a unique structure (i.e. ), (ii) but no networks will accept any new connections, or (iii) reaches a limit value of steps. A typical realization of the total process for an environment parameter and initial nodes is plotted in Fig. 1(c).
The interaction between the two networks and chosen randomly at time to give rise to network requires special attention (see Fig. 1(b)). It is inspired by a connecting method already applied to socio-economic networks Iranzo et al. (2016, 2020), and it is grounded in the extensive work devoted to the description of the competition/cooperation between networks developed during the last decade for ordinary interactions Gómez-Gardeñes et al. (2012); Aguirre et al. (2013); Wang et al. (2014, 2015), or more recently for higher-order interactions Alvarez-Rodriguez et al. (2021); Kumar et al. (2021); Bianconi (2021). We randomly choose one node in and one node in (connector nodes from now on) and connect them through an undirected link (connector link from now on). This new link is accepted only if both connector nodes and increase their dynamical importance in the network, measured as . is the largest eigenvalue of the adjacency matrix of the new network formed by , and the connector link just added, and represents its associated eigenvector, L1-normalized such that . is the eigenvector centrality of connector node , and measures the importance of a node based on how well connected it is and how important its neighbors are. Both and are important measurements of the dynamical properties associated with a complex network. If there was a dynamical process of the type evolving on a network of adjacency matrix G, it is known that when , and the population growth rate would be Iranzo et al. (2016). The process of choosing randomly a new pair of nodes in and in –already connected through a connector link from to – and checking whether they accept a link or not is repeated, taking into account that, for simplicity and without loss of generality, only one connector link per node is allowed Iranzo et al. (2020), and therefore any pre-existing connector links associated with nodes and are erased. In general, this algorithm leads to the connection of and through a cascade and rewiring of connector links until the total network reaches a Nash equilibrium or a cycle between several final configurations, and in the latter case one of the final cyclic configurations is chosen randomly as . If no links are accepted between and when all possible connections between both networks have been tried, we suppose that they do not react and and remain unchanged. In this case, the time is not increased and the interaction between two other networks starts.
In summary, our framework is grounded in the simulation of abstract networked entities that evolve following rules inherited from network science and game theory, and there is a total absence of machine learning techniques or any kind of fitting with real data in the different steps of the model.
I.2 Description of the artificial chemosphere created at NetWorld. Transition toward complexity
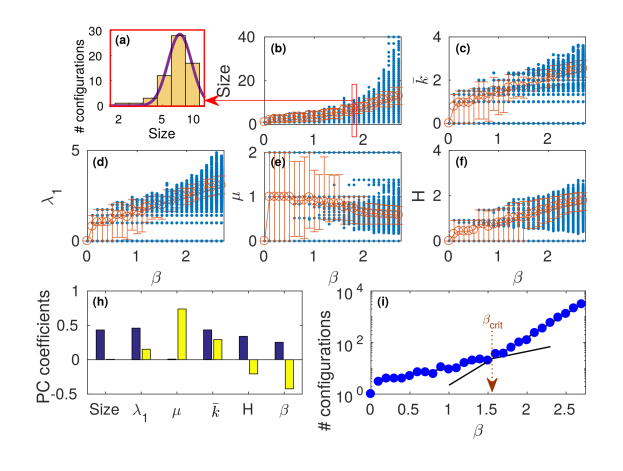
Every simulation of the whole process throughout this work started from initial isolated nodes, lasted a maximum of time steps and was repeated 25 times for each value of the environment parameter in the range . The limit case does not permit any network partition ( in Eq. 1) and is also studied. All structures detected at the end of any time step for all realizations of each , even if they were destroyed later, represent its diversity. The relative abundance of each configuration is given by the probability of finding it in the set of networks accumulated during all times and realizations (see Supporting Information Text S2 for a detailed explanation of how to compute the number of different configurations and the relative abundance in a simulation).
I.2.1 Diversity vs. environment
We start focusing on how the environment shapes the networks emerging in the system. Figure 2 shows the topological and structural description of the diversity created for a wide range of values of the environment parameter. For , every network of 2 nodes, i.e. the first to be created from isolated nodes, immediately breaks up and only isolated nodes are found for all times. When grows, the partition probability of a network decreases (Eq. 1) and diverse structures emerge, but it is not until large values of are reached ( for ) that networks of the maximum possible size are created, as shown in Fig. 2(b).111Note that, in opposition to real chemistry, in our model all nodes are equal, and therefore there are very few potential configurations of small size (e.g. there is only 1 for size 2, while there is a large number of molecules of two atoms in nature). The size, mean degree , largest eigenvalue of the adjacency matrix and the degree entropy of the created structures , plotted in Figs. 2(b-e), positively correlate with , as shown in the first component of the Principal Components Analysis (PCA) calculated for the whole ensemble of existing structures and plotted in Fig. 2(g) Jolliffe and Cadima (2016). On the contrary, the average stability of the networks correlates negatively with (Fig. 2(f) and second component of the PCA in (Fig. 2(g)), as more extensive and heterogeneous structures –i.e. with large entropy – are in general easier to divide, but the low partition probability of networks for large permits their appearance and survival.
Importantly, in Fig. 2(h) the growth of the number of different configurations with suffers a transition around such that beyond that critical point the diversity explodes exponentially faster than before it. While the percentile range plotted in red in Figs. 2(b-f) shows that the population is formed by a large number of networks with similar topological properties, for there is also a rare chemosphere of structures that show very different topologies from the one of the majority, introducing a large amount of variability. Note that the existence of long tails of low-abundance entities is a typical property of real complex systems, notably ecological communities Mcgill et al. (2007); Pedrós-Alió (2012). In summary, for low values of the main bricks of future complexity are formed, but only when a critical state of the environment is reached may these motifs be sufficiently abundant and interact successfully to enrich the system with a large number of new structures. This new population is made of very diverse entities, where (i) regular/robust structures but also (ii) heterogeneous/less stable networks can de detected. The former are made out of very similar blocks that, from the optics of information theory, would not code complex information but show redundancy, a fundamental property to prevent attacks and failures when basic tasks must be developed. The latter consist of complex networks where more information could be coded but are more sensitive to divisions, external perturbations, or losses of nodes.
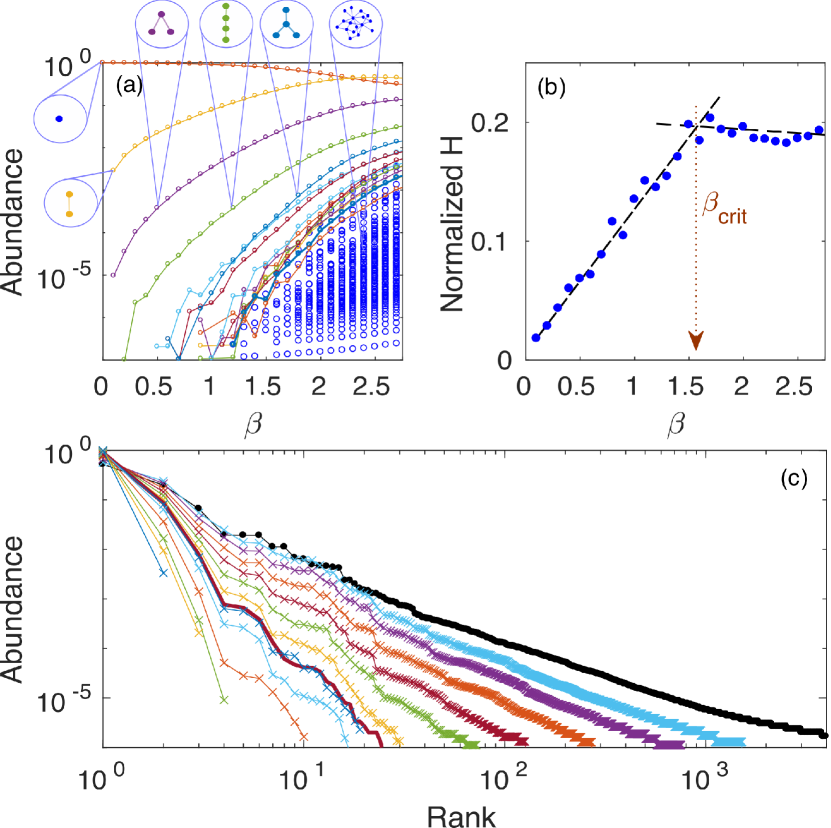
I.2.2 Abundance vs. environment
Figure 3 describes the relative abundance of the networked structures obtained for the different environments, that is, the probability of finding them in the set of networks accumulated during all times and realizations. In Fig. 3(a) we plot the relative abundance of each configuration as a function of , and it is clear that the simplest structures are created at low values of and are especially abundant. A gradual appearance of larger and/or more complex configurations takes place for moderate , and beyond a cascade of new configurations leads to the exponential emergence of diversity already measured in Fig. 2(h). The sharpness of the transition toward complexity is specially visible in Fig. 3(b), where the normalized entropy of the total ensemble of networks Gregori et al. (2016) shows a transition from a linear growth with to a constant value. For , the abundances of the few structures that exist tend to be more uniformly distributed when grows (see Fig. 3(a)), increasing the entropy of the system (which reaches the maximum value when all abundances are equal, see the mathematical expression for in the caption of Fig. 3). However, once the critical environment is surpassed, the growth in complexity due to the tendency toward the relative abundance uniform distribution is balanced by the exponential emergence of diversity. Finally, in Fig. 3(c) we plot the abundance ranks of the population for different values of . For low , the curves are very skewed and show exponential decays, typical behavior of ecological environments with little diversity Fisher and Mehta (2014). When grows and crosses the critical value (brown line), the curves gradually lose skewness and become power-laws, showing long tails consequence of a large diversity of rare configurations, and tend toward the limit case of the process in which and the structures cannot divide.
I.3 Application to a real scenario: Chemical complexity in the interstellar medium
Molecules are an important component of the interstellar medium since they regulate its ionization state and energy dissipation. Molecules are typically found in interstellar clouds where the amount of interstellar dust, and thus of visual extinction Av, is large enough to prevent the photo-dissociation of molecular species by the external interstellar UV radiation field, which enables their formation and survival. The level of chemical complexity in interstellar clouds is however very different depending on their level of extinction, and on the available amount of molecular hydrogen (H2) and carbon monoxide (CO) within them Snow and McCall (2006). In this way, interstellar clouds can be classified as diffuse atomic (with a fraction of H2 with respect to total amount of atomic H of f(H2)), diffuse molecular (f(H2)), translucent (f(H2) and with a fraction of CO with respect to total amount of atomic C of f(CO)), or dense clouds (f(H2) and f(CO)). The chemistry in diffuse atomic clouds is very limited Snow and McCall (2006) while the chemistry in dense clouds presents a very high level of chemical complexity (see e.g. Cernicharo, J. et al. (2021); McGuire et al. (2021)). Therefore, we use here the molecular abundances measured toward diffuse molecular, translucent and dense clouds as test cases for the applicability of the digital environment NetWorld to real scenarios.
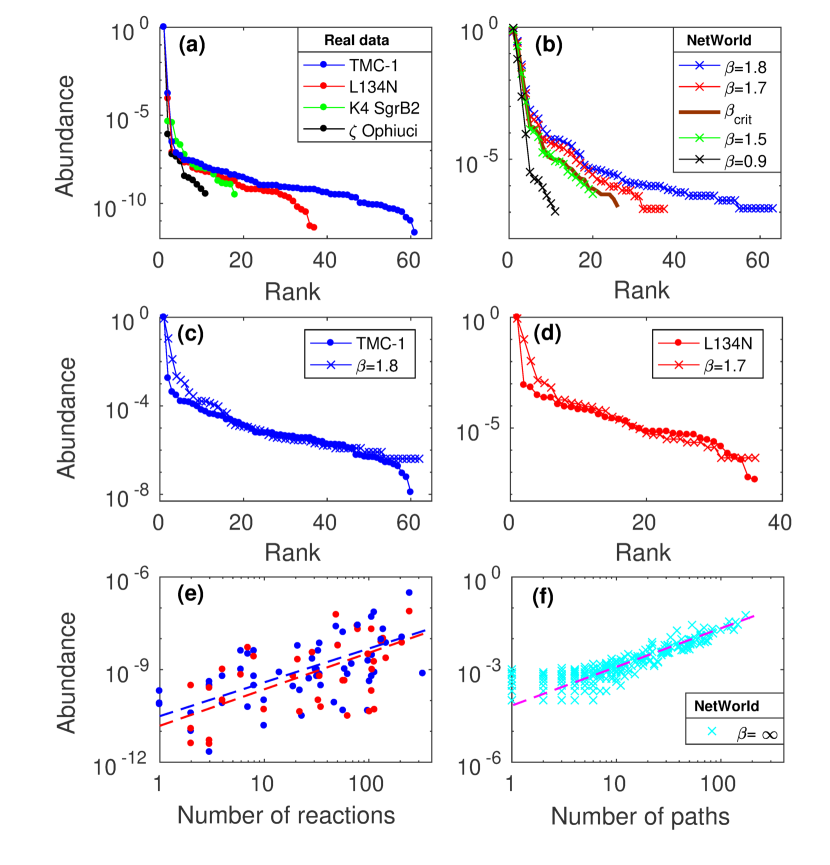
In Fig. 4(a) we show the abundances of the chemical compounds detected toward four interstellar clouds ranked in order of their decreasing magnitude: (i) the interstellar cloud Ophiuci, a diffuse molecular cloud where only a few molecules have been found Snow and McCall (2006); dust extinction is so weak ( mag) that UV radiation destroys most of the molecular material; (ii) the translucent cloud located in the direction of the ultracompact HII region K4 in the SgrB2 massive star-forming region Thiel, V. et al. (2017); Corby, J. F. et al. (2018); this cloud has an extinction of Av=2.0 mag, just enough to enable the formation of new molecular species and to protect the molecular content recently formed within the cloud, playing the role of the critical transition in the model; and (iii) L134N (Serpens) and (iv) TMC-1 (Taurus), two dense clouds with mag where an extensive number of both simple and complex molecules have been synthesized thanks not only to the protection of the high Av, but also to the high fraction of CO present Agúndez and Wakelam (2013). We refer to Supplementary Information Text S6 for the explanation on how we have obtained the molecular abundances toward the different clouds used in our analysis. Fig. 4(b) shows the abundance rank obtained with NetWorld for 4 different environments that are qualitatively compatible with these four sets of real data: a low value of representing a harsh environment where most created compounds are rapidly destroyed, a value close to the critical beyond which complexity expands, and two values of slightly over this transition point. We include the critical environment for comparison. In Figs. 4(c) and (d) we focus on the potential quantitative agreement between real data and the results of the artificial framework. We compare the abundance ranks for TMC-1 and L134N with those of NetWorld’s and 1.7 respectively. The abundances are provided excluding the most frequent elements of each ensemble, H2 in the molecular abundances and the isolated nodes in NetWorld. The real and numerical curves show a quantitative agreement between the number of molecules present in the cloud and the number of configurations in NetWorld, and also in the relative abundance for a large set of molecules and configurations. The framework does not reproduce, however, the truncation shown in the real curves for the 2-3 lowest abundances, but this behavior would disappear if new real data were introduced. Note that the astrochemical datasets of molecular species and their measured abundances remain largely incomplete even for the most observed clouds such as TMC-1, and especially for low abundance species or very large molecules that are more difficult to detect (see e.g. Cernicharo, J. et al. (2021); McGuire (2018)). It is also remarkable that the values of that best fit the astrochemical data of L134N and TMC-1 ( and 1.8) are slightly beyond , and thus belong to a regime in which expansion of their chemical diversity is expected. Indeed, recent observational works toward the TMC-1 dense cloud have revealed the presence of small polycyclic aromatic hydrocarbons (PAHs), demonstrating the ability of these environments to generate complex molecular structures Cernicharo, J. et al. (2021); McGuire (2018); McGuire et al. (2021).
Finally, a relevant pattern obtained in NetWorld is that the relative abundances of the different structures correlate with the number of paths identified to create them, following a very simple functional dependence of the type (Fig. 4(f), for networks of size 10, and , see Supporting Information Text S3 for details on how to compute the number of paths to reach a configuration222We calculated the number of paths of each configuration for (with no loss of generality), as it is the case where there is no network partition and the computation is simpler.). Note that this is a highly non-trivial result, as different paths have in general very different occurrence probabilities, and this expected diversity could in principle spoil the correlation. In order to check whether a similar relationship might also emerge in astrochemical environments, we plotted in Fig. 4(e) the dependence of the molecular abundances measured toward the dense clouds L134N and TMC-1 on the number of chemical reactions that have them as products, as a simple proxy for the chemical paths. The number of chemical reactions is extracted from the astrochemical reaction dataset KIDA Wakelam et al. (2015). Surprisingly, the abundance data correlate with the number of reactions following the same functional dependence as NetWorld’s simulations (, where , , and , , , see Supporting Information Text S7). In addition, the -coefficient of the power-law that relates these two magnitudes is close to 1, indicating that the abundance of a certain molecule would be expected to be approximately proportional to the number of reactions that create it.
We caution, however, that the latter analysis could suffer from important biases. Small molecules that do not have dipole moment, such as N2 or CH4, cannot be observed at radio wavelengths. Furthermore, large molecules not only show low abundances but also their partition function is so large that it spreads the emission across many energy levels, making the molecular line intensities very weak. Recent spectroscopic surveys carried out toward chemically rich sources such as SgrB2 N2 Belloche, A. et al. (2016), IRAS16293-2422 Jørgensen et al. (2016), TMC-1 Cernicharo, J. et al. (2021); McGuire (2018) or G+0.693 (see e.g. Jiménez-Serra et al. (2020); Rivilla et al. (2021)) with ALMA, the GBT or the Yebes 40m telescopes, have boosted the detection rate of new molecular species in the ISM in the past decade (see the review McGuire (2022)), which is starting to alleviate this potential issue. Second, the astrochemical reaction databases are strongly biased to small molecules. All these chemical networks are based on the pioneering work of Prasad and Huntress (1980), whose goal was to investigate the interstellar chemistry of small molecular species. In addition, experimental and theoretical works of gas-phase reactions are extremely challenging especially at the low temperatures typical of interstellar conditions, in particular of radical-radical reactions Shannon et al. (2013); de la Concepción et al. (2021), and not all reactions yielding the same product are equally efficient due to the existence of, for example, high energy barriers. Because of all these reasons, the number of detected molecules and the datasets of reactions that can have them as products are inaccurate.
To address these limitations, we have statistically verified that the correlations between the molecular abundances and the number of reactions shown in Fig. 4(e) for the interstellar clouds TMC-1 and L134N still hold when removing the effect of a controlling variable such as the molecular size, understood as the number of atoms contained within a molecule (partial correlation coefficient and for TMC-1 and and for L134N, see Supporting Information Text S7 for more details). This result points to the correlation detected being independent of potential biases due to the molecular size. A thorough statistical analysis, considering other astrochemical magnitudes related to the molecules found in different astrophysical environments, will be carried out in the future.
II Discussion
In this work we have introduced a conceptual and computational framework called NetWorld describing the evolution of networked structures, where nodes interact following exclusively the optimization of their own dynamical importance. Our results show that, although there is not a causal relationship between NetWorld’s framework and real astrochemical phenomena, a simple model grounded in network science and game theory captures key properties of the process toward chemical complexity and the creation of the building blocks of life. In particular, while our approach does not try to mimic real astrochemistry, it succeeds to explain the emergence of interstellar molecular complexity, and points out as yet unknown astrochemical relationships that could be of importance in our understanding of the formation of prebiotic species in interstellar space.
Multiple methods have been proposed to map real chemistry to artificial chemistry models. Graphs, binary strings, character strings or numbers, among others, have been used to represent molecules Farmer et al. (1986); Banzhaf (1993); Dittrich and Banzhaf (1998); Dittrich et al. (2000). Our networks describe molecules where atoms are nodes and their interactions are links. Beyond this mapping, one could add properties and impose more complex rules of interaction in order to get closer to real chemistry. Node labels and properties might be introduced to represent the atom type, the hybridization type, charge, valency, or radicals. Moreover, an energy function could be used to choose the structure resulting from a reaction on the basis of the change of energy Benkö et al. (2003). Based on the current state of our framework, adding these features in NetWorld is possible and, a priori, computationally feasible. However, we stress that fundamental features of NetWorld are its simplicity and abstraction, as we aim to present a framework that transcends chemistry to describe the interaction between complex structures of different nature and in diverse environments, from nodes representing atoms to biomolecules or even species.
In the same line of thought, the natural transition toward complexity emerged from our computational environment has also been observed in complex ecosystems. In particular, Fisher & Mehta Fisher and Mehta (2014) reported a strikingly similar pattern in which the skewness of biodiversity rank-abundance curves decreased and the overall diversity increased with carrying capacity, highlighting the sharp transition between stochastic, neutral regimes and selection-dominated, niche regimes. The environment parameter introduced here and the dust extinction Av in interstellar chemistry –two quantities directly related since the rate constants of interstellar UV photo-destruction reactions depend exponentially of Av Holdship et al. (2017)–, could be understood as loose proxies for the carrying capacity in the ecological context, in the sense that a low /low Av results in a “harsher” environment that limits network/molecules/species richness. Continuing the analogy, in the low /low Av regime our network communities and the interstellar molecular abundances show a highly skewed abundance distribution (see Figs. 4(a-b)) and are indeed dominated by stochasticity (the partition probability introduced in Eq. 1 and the interaction with UV radiation respectively). On the other hand, in the high /high Av regime they present low skewness and high diversity, and are dominated by selection of structures with a higher number of paths/reactions leading to them (as shown in Figs. 4(e-f)). All in all, we believe that (i) the similarities between the results in Fisher and Mehta (2014), based on models that are firmly rooted in classical ecological theory and checked with real data, (ii) those obtained from molecular abundances in interstellar clouds, and (iii) the ones introduced by our computational environment, derived from a simple framework with no a priori ecological or chemical assumptions, are not coincidental. They instead hint that the long path from the creation of the basic prebiotic compounds in the interstellar medium to the origin of life and its evolution on the early Earth could show universal patterns and common phenomenologies at all scales and across all stages.
Finally, while we have exclusively used sets of isolated and indistinguishable nodes as initial conditions, and have focused on the description of the emerging diversity created, the framework here introduced could be of use in many other contexts. Advancing in the subject of the origin and evolution of early life, potentially fruitful lines of future work could be the analysis of the interaction of small motifs to simulate the polymerization of simple chemical compounds, resembling the phenomenology present in the RNA World, or the search for autocatalytic reactions that could help us advance toward a proto-replication of networks where the concepts of mutation and fitness could be analysed as emerging properties of the system, instead of introducing them ad-hoc as has been done so far in the literature.
Acknowledgements.
The authors acknowledge fruitful conversations with A. Aguirre-Tamaral, C. Briones, M. Castro, J. García de la Concepción, J.A. García-Martín, R. Guantes, D. Hochberg, J. Iranzo, A. Lucía-Sanz, S. Manrubia and M. Ruiz-Bermejo, and technical support from N. Aguirre and J. Aguirre. I.J.-S. and J.A. received support from Projects PID2019-105552RB-C41, PID2021-122936NB-I00 and MDM-2017-0737 Unidad de Excelencia ”María de Maeztu”-Centro de Astrobiología (CSIC-INTA) by the Spanish Ministry of Science and Innovation/State Agency of Research MCIN/AEI/10.13039/501100011033 and by ”Fondo Europeo de Desarrollo Regional (FEDER) Una manera de hacer Europa”, through Project ESP2017-86582-C4-1-R. F.P-S. was supported by the European Union’s Horizon 2020 research and innovation programme under the Marie Skłodowska-Curie grant agreement No 892961.Author contributions
M.G.-S., I.J.-S., F.P.-S., and J.A. designed the project and wrote the paper; M.G.-S., F.P.-S., and J.A. conceived the computational environment; M.G.- S. and J.A. implemented the algorithm and performed the numerical experiments; and I.J.-S. and J.A. contributed to the applicability of the results to real astrochemical data.
Supporting Information
The Supporting Information of this paper consists of Supporting Figs. 1-5 and Supporting Information Texts S1-S7.
It is accessible at https://raw.githubusercontent.com/MiguelGarciaSanchez/NetWorld/main/garcia_sanchez_et_al_Supp_Info_2022.pdf
The titles of Supporting Information Texts S1-S7 are:
-
•
S1. NetWorld’s algorithm.
-
•
S2. Computation of the diversity and the relative abundance of the different configurations for a fixed environment in NetWorld.
-
•
S3. Computation of the number of paths to reach a configuration in NetWorld.
-
•
S4. Dependence of the computation time with NetWorld’s parameters.
-
•
S5. Algorithm availability.
-
•
S6. Molecular abundances measured toward diffuse molecular, translucent and dense clouds.
-
•
S7. Statistical analysis of the data associated with molecular clouds TMC-1 and L134N.
References
- Hollis et al. (2004) J. M. Hollis, P. R. Jewell, F. J. Lovas, and A. Remijan, apjl 613, L45 (2004).
- Belloche, A. et al. (2019) Belloche, A., Garrod, R. T., Müller, H. S. P., Menten, K. M., Medvedev, I., Thomas, J., and Kisiel, Z., A&A 628, A10 (2019), URL https://doi.org/10.1051/0004-6361/201935428.
- Jiménez-Serra et al. (2020) I. Jiménez-Serra, J. Martín-Pintado, V. M. Rivilla, L. Rodríguez-Almeida, E. R. Alonso Alonso, S. Zeng, E. J. Cocinero, S. Martín, M. Requena-Torres, R. Martín-Domenech, et al., Astrobiology 20, 1048 (2020), pMID: 32283036, eprint https://doi.org/10.1089/ast.2019.2125, URL https://doi.org/10.1089/ast.2019.2125.
- Rivilla et al. (2021) V. M. Rivilla, I. Jiménez-Serra, J. Martín-Pintado, C. Briones, L. F. Rodríguez-Almeida, F. Rico-Villas, B. Tercero, S. Zeng, L. Colzi, P. de Vicente, et al., Proceedings of the National Academy of Sciences 118 (2021), ISSN 0027-8424, eprint https://www.pnas.org/content/118/22/e2101314118.full.pdf, URL https://www.pnas.org/content/118/22/e2101314118.
- Altwegg et al. (2017) K. Altwegg, H. Balsiger, J. Berthelier, A. Bieler, U. Calmonte, S. Fuselier, F. Goesmann, S. Gasc, T. I. Gombosi, L. Le Roy, et al., Monthly Notices of the Royal Astronomical Society 469, S130 (2017), ISSN 0035-8711, eprint https://academic.oup.com/mnras/article-pdf/469/Suppl_2/S130/18563276/stx1415.pdf, URL https://doi.org/10.1093/mnras/stx1415.
- Furukawa et al. (2019) Y. Furukawa, Y. Chikaraishi, N. Ohkouchi, N. O. Ogawa, D. P. Glavin, J. P. Dworkin, C. Abe, and T. Nakamura, Proceedings of the National Academy of Sciences 116, 24440 (2019), ISSN 0027-8424, eprint https://www.pnas.org/content/116/49/24440.full.pdf, URL https://www.pnas.org/content/116/49/24440.
- Neumann and Burks (1966) J. V. Neumann and A. W. Burks, Theory of Self-Reproducing Automata (University of Illinois Press, USA, 1966).
- Wolfram (1983) S. Wolfram, Rev. Mod. Phys. 55, 601 (1983), URL https://link.aps.org/doi/10.1103/RevModPhys.55.601.
- Gardner (1970) M. Gardner, Scientific American 223, 120 (1970).
- Rasmussen et al. (1990) S. Rasmussen, C. Knudsen, R. Feldberg, and M. Hindsholm, Physica D: Nonlinear Phenomena 42, 111–134 (1990).
- Lenski et al. (1999) R. E. Lenski, C. Ofria, T. C. Collier, and C. Adami, Nature 400, 661–664 (1999).
- Adami et al. (2000) C. Adami, C. Ofria, and T. C. Collier, Proceedings of the National Academy of Sciences 97, 4463 (2000), ISSN 0027-8424, eprint https://www.pnas.org/content/97/9/4463.full.pdf, URL https://www.pnas.org/content/97/9/4463.
- Dittrich et al. (2001) P. Dittrich, J. Ziegler, and W. Banzhaf, Artificial Life 7, 225 (2001).
- Benkö et al. (2003) G. Benkö, C. Flamm, and P. F. Stadler, Journal of Chemical Information and Computer Sciences 43, 1085 (2003).
- Banzhaf and Yamamoto (2010) W. Banzhaf and L. Yamamoto, Artificial Chemistries (The MIT Press, Cambridge, MA, USA, 2010).
- Newman (2010) M. E. J. Newman, Networks: An Introduction (Oxford University Press, Inc., New York, NY, USA, 2010).
- Iranzo et al. (2016) J. Iranzo, J. M. Buldú, and J. Aguirre, Nature Communications 7, 13273 (2016).
- Iranzo et al. (2020) J. Iranzo, F. Pablo-Martí, and J. Aguirre, Phys. Rev. Research 2, 043352 (2020), URL https://link.aps.org/doi/10.1103/PhysRevResearch.2.043352.
- Gómez-Gardeñes et al. (2012) J. Gómez-Gardeñes, I. Reinares, A. Arenas, and L. M. Floria, Sci Rep 2, 620 (2012).
- Aguirre et al. (2013) J. Aguirre, D. Papo, and J. M. Buldú, Nature Physics 9, 230 (2013).
- Wang et al. (2014) Z. Wang, A. Szolnoki, and M. Perc, New Journal of Physics 16, 033041 (2014).
- Wang et al. (2015) Z. Wang, L. Wang, A. Szolnoki, and M. Perc, The European Physical Journal B 88, 124 (2015).
- Alvarez-Rodriguez et al. (2021) U. Alvarez-Rodriguez, F. Battiston, G. de Arruda, Y. Moreno, M. Perc, and V. Latora, Nature Human Behavior 5, 586 (2021).
- Kumar et al. (2021) A. Kumar, S. Chowdhary, V. Capraro, and M. c. v. Perc, Phys. Rev. E 104, 054308 (2021), URL https://link.aps.org/doi/10.1103/PhysRevE.104.054308.
- Bianconi (2021) G. Bianconi, Higher-Order Networks (Cambridge University Press, 2021).
- Jolliffe and Cadima (2016) I. T. Jolliffe and J. Cadima, Philosophical Transactions of the Royal Society A: Mathematical, Physical and Engineering Sciences 374, 20150202 (2016).
- Mcgill et al. (2007) B. J. Mcgill, R. S. Etienne, J. S. Gray, D. Alonso, M. J. Anderson, H. K. Benecha, M. Dornelas, B. J. Enquist, J. L. Green, F. He, et al., Ecology Letters 10, 995–1015 (2007).
- Pedrós-Alió (2012) C. Pedrós-Alió, Annual Review of Marine Science 4, 449 (2012), pMID: 22457983, eprint https://doi.org/10.1146/annurev-marine-120710-100948, URL https://doi.org/10.1146/annurev-marine-120710-100948.
- Gregori et al. (2016) J. Gregori, C. Perales, F. Rodriguez-Frias, J. I. Esteban, J. Quer, and E. Domingo, Virology 493, 227 (2016), ISSN 0042-6822, URL https://www.sciencedirect.com/science/article/pii/S004268221630037X.
- Fisher and Mehta (2014) C. K. Fisher and P. Mehta, Proceedings of the National Academy of Sciences 111, 13111 (2014), ISSN 0027-8424, eprint https://www.pnas.org/content/111/36/13111.full.pdf, URL https://www.pnas.org/content/111/36/13111.
- Snow and McCall (2006) T. P. Snow and B. J. McCall, Annual Review of Astronomy and Astrophysics 44, 367 (2006).
- Thiel, V. et al. (2017) Thiel, V., Belloche, A., Menten, K. M., Garrod, R. T., and Müller, H. S. P., A&A 605, L6 (2017), URL https://doi.org/10.1051/0004-6361/201731495.
- Corby, J. F. et al. (2018) Corby, J. F., McGuire, B. A., Herbst, E., and Remijan, A. J., Astronomy & Astrophysics 610, A10 (2018), URL https://doi.org/10.1051/0004-6361/201730988.
- Agúndez and Wakelam (2013) M. Agúndez and V. Wakelam, Chem. Rev. 113, 8710 (2013).
- Cernicharo, J. et al. (2021) Cernicharo, J., Agúndez, M., Cabezas, C., Tercero, B., Marcelino, N., Pardo, J. R., and de Vicente, P., A&A 649, L15 (2021), URL https://doi.org/10.1051/0004-6361/202141156.
- McGuire et al. (2021) B. A. McGuire, R. A. Loomis, A. M. Burkhardt, K. L. K. Lee, C. N. Shingledecker, S. B. Charnley, I. R. Cooke, M. A. Cordiner, E. Herbst, S. Kalenskii, et al., Science 371, 1265 (2021).
- McGuire (2018) B. A. McGuire, 239, 17 (2018), URL https://doi.org/10.3847/1538-4365/aae5d2.
- Wakelam et al. (2015) V. Wakelam, J.-C. Loison, E. Herbst, B. Pavone, A. Bergeat, K. Béroff, M. Chabot, A. Faure, D. Galli, W. D. Geppert, et al., ApJS 217, 20 (2015), URL https://doi.org/10.1088/0067-0049/217/2/20.
- Belloche, A. et al. (2016) Belloche, A., Müller, H. S. P., Garrod, R. T., and Menten, K. M., Astronomy & Astrophysics 587, A91 (2016), URL https://doi.org/10.1051/0004-6361/201527268.
- Jørgensen et al. (2016) J. K. Jørgensen, M. H. D. van der Wiel, A. Coutens, J. M. Lykke, H. S. P. Müller, E. F. van Dishoeck, H. Calcutt, P. Bjerkeli, T. L. Bourke, M. N. Drozdovskaya, et al., Astronomy & Astrophysics 595, A117 (2016), eprint 1607.08733.
- McGuire (2022) B. A. McGuire, The Astrophysical Journal Supplement Series 259, 30 (2022), URL https://doi.org/10.3847/1538-4365/ac2a48.
- Prasad and Huntress (1980) S. S. Prasad and J. Huntress, W. T., Astrophysical Journal 43, 1 (1980).
- Shannon et al. (2013) R. Shannon, M. Blitz, A. Goddard, and D. Heard, Nature Chemistry 5, 745 (2013), © 2013 Macmillan Publishers Limited. All rights reserved. This is an author produced version of a paper published in Nature Chemistry. Uploaded in accordance with the publisher’s self-archiving policy, URL https://eprints.whiterose.ac.uk/87629/.
- de la Concepción et al. (2021) J. G. de la Concepción, C. Puzzarini, V. Barone, I. Jiménez-Serra, and O. Roncero, The Astrophysical Journal 922, 169 (2021), URL https://doi.org/10.3847/1538-4357/ac1e94.
- Farmer et al. (1986) J. Farmer, S. A. Kauffman, and N. H. Packard, Physica D: Nonlinear Phenomena 22, 50 (1986), ISSN 01672789, URL https://linkinghub.elsevier.com/retrieve/pii/0167278986902332.
- Banzhaf (1993) W. Banzhaf, Biological Cybernetics 69, 275 (1993), ISSN 0340-1200, 1432-0770, URL http://link.springer.com/10.1007/BF00203124.
- Dittrich and Banzhaf (1998) P. Dittrich and W. Banzhaf, Artificial Life 4, 203 (1998), ISSN 1064-5462, 1530-9185, URL https://direct.mit.edu/artl/article/4/2/203-220/2298.
- Dittrich et al. (2000) P. Dittrich, F. Liljeros, A. Soulier, and W. Banzhaf, Physical Review Letters 84, 3205 (2000), ISSN 0031-9007, 1079-7114, URL https://link.aps.org/doi/10.1103/PhysRevLett.84.3205.
- Holdship et al. (2017) J. Holdship, S. Viti, I. Jiménez-Serra, A. Makrymallis, and F. Priestley, 154, 38 (2017), URL https://doi.org/10.3847/1538-3881/aa773f.