An Insight-HXMT view of the mHz quasi-regular modulation phenomenon in the black hole X-ray binary 4U 1630–47
Abstract
Here we report the spectral-timing results of the black hole X-ray binary 4U 1630–47 during its 2021 outburst using observations from the Hard X-ray Modulation Telescope (Insight-HXMT). Type-C quasi-periodic oscillations (QPOs) in 1.6–4.2 Hz and quasi-regular modulation (QRM) near 60 mHz are detected during the outburst. The mHz QRM has a fractional rms of 10%–16% in the 8–35 keV energy band with a Q factor (frequency/width) of 2–4. Benefiting from the broad energy band of Insight-HXMT, we study the energy dependence of the 60 mHz QRM in 1–100 keV for the first time. We find that the fractional rms of the mHz QRM increases with photon energy, while the time lags of the mHz QRM are soft and decrease with photon energy. Fast recurrence of the mHz QRM, in a timescale of less than one hour, has been observed during the outburst. During this period, the corresponding energy spectra moderately change when the source transitions from the QRM state to the non-QRM state. The QRM phenomena also shows a dependence with the accretion rate. We suggest that the QRM could be caused by an unknown accretion instability aroused from the corona.
1 Introduction
Black hole X-ray binary 4U 1630–47 is a transient source characterized by its frequent outbursts (Choudhury et al., 2015). The first known outburst was recorded by Vela-5B in 1969 (Priedhorsky, 1986). After that, the source goes into outbursts frequently with a typical period of 600–700 days (Jones et al., 1976; Priedhorsky, 1986; Parmar et al., 1995). No dynamical mass measurement has been made for 4U 1630–47 because of the difficulties in identifying an optical or IR counterpart up to now. By scaling the correlation of the photon index of the hard spectral component with low-frequency quasi-periodic oscillations (LFQPOs) and mass accretion rate, Seifina et al. (2014) estimated that the black hole mass as 10 and the inclination angle as deg. A potential distance of kpc was obtained by investigating the dust-scattering halo created by 4U 1630–47 (Kalemci et al., 2018). Liu et al. (2021) suggested a moderately high spin of (90% confident level) by fitting the reflection spectra of Insight-HXMT during its 2020 outburst. This value is lower than what had been reported by King et al. (2014), in which they suggested an extreme high spin of and an inclination angle of deg by fitting the NuSTAR spectra.
Fast variability observed in the X-ray band of black hole transients allows us to investigate the properties of the innermost region of accretion flow (van der Klis, 2006; Belloni & Stella, 2014). Meanwhile, the spectral-timing analysis allows us to understand the underlying radiation process. The Fourier transform serves as a powerful tool to study the fast X-ray variability (Ingram & Motta, 2019). LFQPOs with frequencies of 0.1–30 Hz are common in black hole X-ray binaries. Based on the shape of the power density spectrum (PDS), LFQPOs are divided into three types, namely, type-A, B and C QPOs (Casella et al., 2005). The property of LFQPOs is highly correlated with spectral states. Type-C QPOs usually appear in the low-hard state and hard-intermediate state, whereas type-B and type-A QPOs appear in the soft-intermediate state. Rapid transitions between different types of QPOs are sometimes observed during the hard-to-soft transition (Soleri et al., 2008; Motta et al., 2011; Sriram et al., 2013; Zhang et al., 2021). The physical origin of the LFQPOs is still under debate. It is suggested that a precessing hot inner flow/jet base can modulate the X-ray emission and produce the type-C QPO (Done et al., 2007; Ingram et al., 2009; Ingram & Done, 2010, 2011; Kalamkar et al., 2016; Huang et al., 2018; Bu et al., 2021; Ma et al., 2021; Méndez et al., 2022). This is currently the most promising model for type-C QPO. No comprehensive models have been proposed for the type-B and type-A QPOs.
In addition to different types of QPOs, we have observed quasi-regular flares or dips with a relatively long period of 10–200 s in the light curves of a handful of black hole candidates, e.g., 4U 1630–47 (Trudolyubov et al., 2001), GRS 1915+015 (Morgan et al., 1997), GRO J1655–40 (Remillard et al., 1999), IGR J17091–3624 (Altamirano et al., 2011; Zhang et al., 2013, 2014), H 1743–322 (Altamirano & Strohmayer, 2012). These variability patterns show in the PDS as a broad peak at several tens of mHz. Trudolyubov et al. (2001) named these signals as quasi-regular modulations (QRM). Taking GRS 1915+015 as an example, GRS 1915+015 is characterized by its complex X-ray variability which can be divided into 14 classes (Belloni et al., 2000; Klein-Wolt et al., 2002; Hannikainen et al., 2005). One of the most focused variability classes is the so-called ”” class (or ”heartbeat” state). ”Heartbeat” state is characterized by its regular flares which last 40–200 s (Weng et al., 2018). During the flare period, hardness ratio between different energy bands shows complex signatures (Neilsen et al., 2012). Based on a phase-resolved study, Neilsen et al. (2012) found that the temperature at the inner edge of the accretion disk increases with flux while the inner radius of the disk decreases during the flares. All these results support a radiation-pressure-driven evaporation or ejection event occurred in the inner accretion disk. At the inner region of the accretion disk where radiation pressure dominates, limit-cycle behaviour of accretion disk will cause periodic flux modulation due to the thermal viscous instability when the mass accretion rate increases to a certain level (Lightman & Eardley, 1974). The instability is usually used to explain the accretion rate dependent flux modulation. Based on a systematic analysis of the ”heartbeat” state in GRS 1915+105, Weng et al. (2018) found tight correlations among the recurrence time, the inner radius of the disk, and the luminosity of the non-thermal emission. They suggested that the change of the corona size can result in the observed correlations.
Dieters et al. (2000) and Trudolyubov et al. (2001) studied the RXTE observations of 4U 1630–47 during its 1998 outburst. They found that during a certain plateau state (1.4, 3–20 keV energy range), the source exhibits quasi-regular oscillations with a period of 10–20 s with simultaneous complex type-C QPOs. Trudolyubov et al. (2001) interpreted the type-C QPO by considering resonance oscillations of the shock, while the QRM is related to the time of the matter accumulation at the shock front (the shock stability timescale) .
In 2021, 4U 1630–47 experienced an outburst (peak500 mCrab) after 600 days from its 2020 outburst. In this work, we report the detection of the mHz QRM phenomenon during this outburst, and present a detailed study of the mHz QRM from 4U 1630–47, in which we have extended its energy dependence study up to 60–100 keV for the first time. In addition, we compare the spectra of the periods with different types of PDS to unveil the spectral parameters that are responsible for the transition. In Section 2, we describe the observation and data reduction process. The data analysis and results are presented in Section 3. We discuss our results in Section 4.
2 OBSERVATIONS AND DATA REDUCTION
Insight-HXMT is China’s first X-ray astronomy satellite, launched on 2017 June 15 (Zhang et al., 2020). It carries three slat-collimated instruments: the High Energy X-ray telescope (HE: 20–250 keV, Liu et al. 2020), the Medium Energy X-ray telescope (ME: 5–30 keV, Cao et al. 2020), and the Low Energy X-ray telescope (LE: 1–15 keV, Chen et al. 2020). Each telescope carries both large and small field-of-view (FoV) detectors in order to facilitate the background analyses. The small FoV detectors (LE: ; ME: ; HE: ) have a lower probability of source contamination, and thus are more suitable for pointing observation111http://hxmten.ihep.ac.cn/AboutHxmt.jhtml. Insight-HXMT started a high cadence monitoring of 4U 1630–47 from 2021 September 18 to 28 (see Table 1 for the log of the Insight-HXMT observation). The Insight-HXMT observations stopped after 2021 September 28 due to the small solar aspect angle ().
| ObsID | Start Time | LE Rate | ME Rate | HE Rate | PDSaaThe properties of the QPO and QRM are measured from the PDS of ME 8–35 keV. | Centroid Frequency | Fractional rmsbbfootnotemark: | Q factorccThe quality factor Q is defined as centroid frequency/FWHM. |
|---|---|---|---|---|---|---|---|---|
| (MJD) | (cts ) | (cts ) | (cts ) | (Hz) | (%) | |||
| P040426300101 | 59475.647 | QPO | ||||||
| P040426300201 | 59476.488 | QPO | ||||||
| P040426300301 | 59477.647 | QPO | ||||||
| P040426300401 | 59478.906 | QPO | ||||||
| P040426300501 | 59479.647 | QPO | ||||||
| P040426300601 | 59480.641 | QPO | ||||||
| P040426300701 | 59481.667 | QPO | ||||||
| P040426300801 | 59482.626 | QPO | ||||||
| P040426300901 | 59483.785 | QRM | ||||||
| P040426300902 | 59483.888 | QRM | ||||||
| P040426300903 | 59484.022 | QRM | ||||||
| P040426301001 | 59484.932 | QRM | ||||||
| P040426301002 | 59485.050 | QRM | ||||||
| P040426301003 | 59485.240 | None/QRM | ||||||
| P040426301004 | 59485.373 | None | None | None | None | |||
| P040426301005 | 59485.506 | None | None | None | None | |||
| P040426301006 | 59485.639 | None | None | None | None | |||
| P040426301007 | 59485.771 | None | None | None | None | |||
| P040426301008 | 59485.909 | None | None | None | None |
The fractional rms is measured for the QPO/QRM component.

The data are extracted from all three instruments using the Insight-HXMT Data Analysis software (HXMTDAS) v2.05 222The data analysis software is available from http://hxmten.ihep.ac.cn/software.jhtml., and filtered with the following criteria: (1) pointing offset angle less than ; (2) Earth elevation angle larger than ; (3) the value of the geomagnetic cutoff rigidity larger than 8 GV; (4) at least 300 s before and after the South Atlantic Anomaly passage. To avoid possible contamination from the bright Earth and nearby sources, we only use data from the small field of view (FoV) (Chen et al., 2018). The energy bands adopted for spectral analysis are 2–8 keV for LE, 8–28 keV for ME, and 28–100 keV for HE.
2.1 Background
The background estimations of LE, ME, and HE are performed using the stand-alone Python scripts LEBKGMAP, MEBKGMAP, and HEBKGMAP (Liao et al., 2020a, b; Guo et al., 2020). 4U 1630–47 locates in a crowded region near the Galactic plane. As a result, it may be contaminated by some other bright X-ray sources (Kuulkers et al., 1997). In Figure 1, we show the small FoVs of LE, ME, and HE, respectively. Each instrument consists of three Detection Boxes (DetBox No. 1, 2, and 3). As can be seen, relatively bright contaminating sources in the small FoVs of 4U 1630–47 are GX 340+0, GX 339–4, H1608–552 and J161741.2–510455. H1608–552 and J161741.2–510455 are transient sources that were in a quiescence state during the outburst of 4U 1630–47, thus their contribution can be ignored. GX 340+0 is a persistent Z source that shows fast X-ray variability. It constantly appears in the No.2 DetBox of the LE detector and No.2 DetBox of the ME detector. Following Bu et al. (2021), We create light curves and spectra from each DetBox and find that the contribution of the X-ray flux from GX 340+0 is larger than 5% for the LE and ME detectors. In addition, GX 339–4 was at the end stage of the outburst in 2021. It constantly appears in the No.1 DetBox of the LE detector, and contributes more than 50% extra counts to the LE No.1 DetBox detector. Therefore, we do not use the data from the No.1 and 2 DexBox of the LE detector and the No.2 DetBox of the ME detector for the following timing and spectral analysis.
3 ANALYSIS AND RESULTS
3.1 Fundamental diagrams
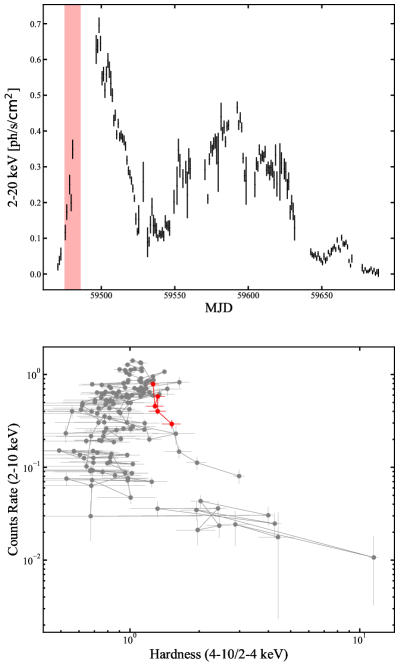
In the upper panel of Figure 2, we show the 2–20 keV light curve of 4U 1630–47 from its 2021 outburst obtained with MAXI/GSC. Three peaks can be observed from the light curve. The Insight-HXMT observations were performed during the initial rising phase of the first main peak. In the lower panel of Figure 2, we show the hardness-intensity diagram (HID) of this outburst. Based on their locations in the HID, we can identify that our Insight-HXMT observations are made during the intermediate state. In the 2021 outburst although we still lack bright hard states as previous outbursts (Abe et al., 2005; Tomsick et al., 2014; Capitanio et al., 2015), Insight-HXMT accumulates intensive observations in hard-intermediate/steep power-law state which are rare during RXTE epochs (Tomsick et al., 2005; Connors et al., 2021).
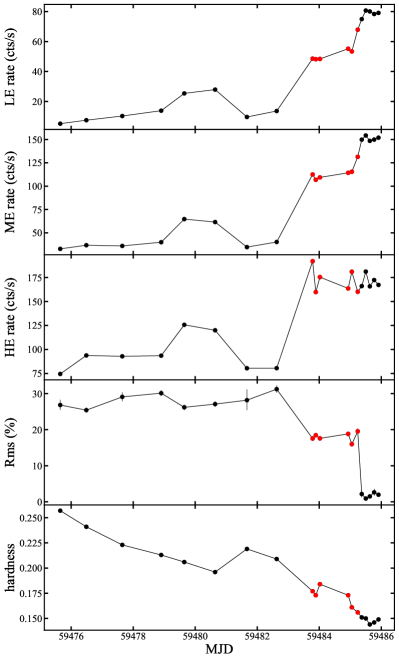
In Figure 3, we show the Insight-HXMT LE (1–10 keV), ME (8–35 keV), and HE (30–150 keV) light curves, together with the 0.01–64 Hz fractional rms, calculated in the ME (8–35 keV) band, and the hardness ratio, defined as the ratio of the count rates between the ME 20–30 keV and ME 10–20 keV bands, evolution during the outbursts. The LE/ME/HE count rates slowly increase from initial value, jump to a plateau around MJD 59483, and then remain stable at this flux level for about 3 days. Afterwards, the count rates rapidly increase to a higher flux level, accompanied by a decrease in hardness ratio. Meanwhile, at the beginning of the observation, the total fractional rms remains above 20%, whereas after MJD 59483, the rms drops sharply to between 20% and 10%. After MJD 59485, the PDS shows a very low rms amplitude (¡5%).
3.2 Timing analysis
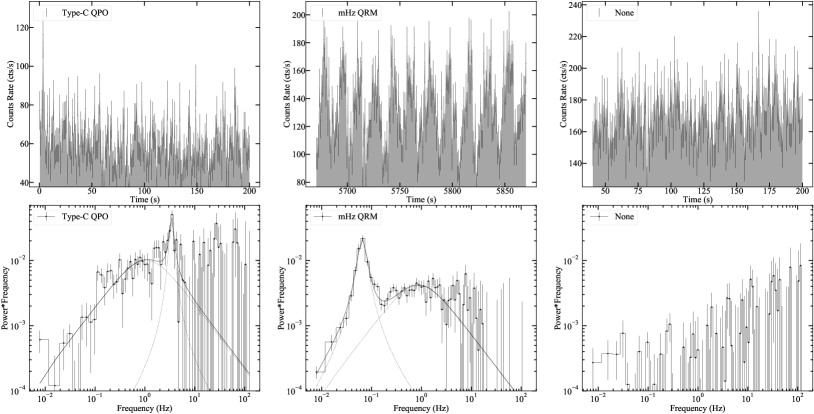
To study the fast X-ray variability, we create an averaged power spectrum for each of the Insight-HXMT observations. Based on the characteristics of the light curves and PDS, we divide the X-ray variability into three different types. In Figure 4, we show the representative light curves and their corresponding PDS for the three types, respectively. During MJD 59475.6–59482.6, the PDS (the left panels of Figure 4) is characterized by a relatively narrow QPO centered at 1.6–4.2 Hz with a band-limited noise component at low frequencies. During MJD 59483.8–59485.2, the PDS (the middle panels of Figure 4) is characterized by a relatively broad peak () near 60 mHz accompanied with a broadband noise component above its frequency. The corresponding light curves show regular flares of 16 s, which are clearly different from the light curves of the first type. We further refer this regular modulated signal as mHz QRM to distinguish it from the first type. In addition, the mHz QRM shows a transient behaviour near MJD 59485: the mHz QRM disappears in the first two orbits of this observation (ObsID P040426301003) and appears again in the last two orbits. After MJD 59485.4, the PDS is dominated by Possion noise without QPO/QRM.
For further studies, we create PDS with a 128 s long interval and 1/256 s time resolution. The PDS is applied to Miyamoto normalization (Miyamoto et al., 1991). We then fit the PDS with a multiple-Lorentzian model (Belloni et al., 2002) (see Figure 4). From the fittings, we obtain the fractional rms and characteristic frequency of the QPO/QRM. The fractional rms is background corrected according to the formular: (Belloni & Hasinger, 1990; Bu et al., 2015). The maximum power is observed at the characteristic frequency , where is the centroid frequency and is the FWHM of the Lorentzian function (Belloni et al., 1997b). The values of the frequency and rms of the QPO/QRM are listed in Table 1.
Two Lorentzian components are required to fit the PDS of the 1.6–4.2 Hz QPO: a narrow peak and a low-frequency broadband noise component. The frequency of the QPO is anti-correlated with spectral hardness and QPO fractional rms. The factor of this QPO is in the range of 4–10, with a fractional rms amplitude of 8–21. The broadband noise component is relatively strong with a typical rms of 20. Based on these characteristics, we identify this QPO as the type-C QPO detected in black hole X-ray binaries.
The PDS of the mHz QRM can be well fitted with two Lorentzian functions. However, their properties are quite different from those of the 1.6–4.2 Hz QPOs. The frequency of the peak is around 0.06 Hz, and stays stable among different observations. The width of the peak is broad, with a factor of 2–4. The fractional rms amplitude of the mHz peak is 11-16. The broadband noise component above the 0.06 Hz peak has a relatively lower rms of 10. From the view of the light curves, the mHz flux modulation is characterized by a fast rise following by a fast decay. The rise and decay times of the flare are almost the same (8 s). This is different from the characteristics of the ”heartbeat” light curves, which typically show a slow rise and fast decay profile (Weng et al., 2018; Mineo et al., 2021).
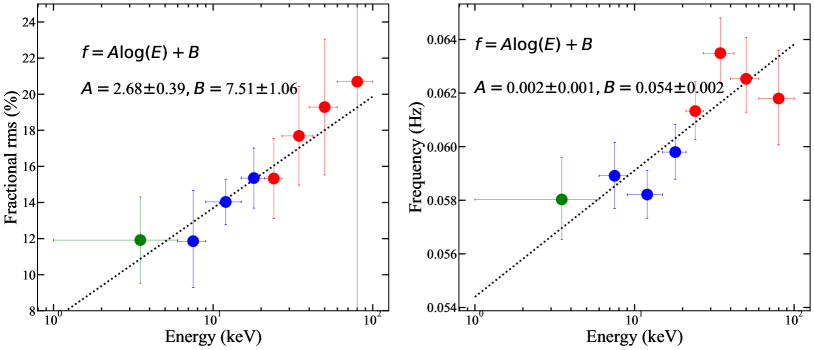
We further study the energy-dependent properties of the mHz QRM. Since the properties of the mHz QRM are similar among observations, we combine all the observations with the mHz QRM detection and compute averaged PDS for different energy bands. The fractional rms and the characteristic frequency of the mHz QRM as a function of photon energy are shown in Figure 5. From the left panel of Figure 5, we can see a positive correlation between the fractional rms of the mHz QRM and photon energy in the 1–100 keV energy band. The value of the rms increases from 12% to 20%. In order to check the significance of the increase, we fit this relation with a function of . The best-fitting slope is , which is more than 6 from zero. There is also a slightly increasing trend in characteristic frequency (the right panel of Figure 5). However, the change in characteristic frequency is relatively small, from Hz to Hz. We fit this relation with the function . The best-fitting slope is consistent with being zero within 2 level, suggesting that there is no significant change in characteristic frequency. Meanwhile, it should be noted that the mHz QRM peak is broad, and its rms or frequency could be affected by the variation of the underlying broad band noise component. In particular, a strong energy dependence of the broad band noise component has been found in previous studies (Yang et al., 2022; Feng et al., 2022).
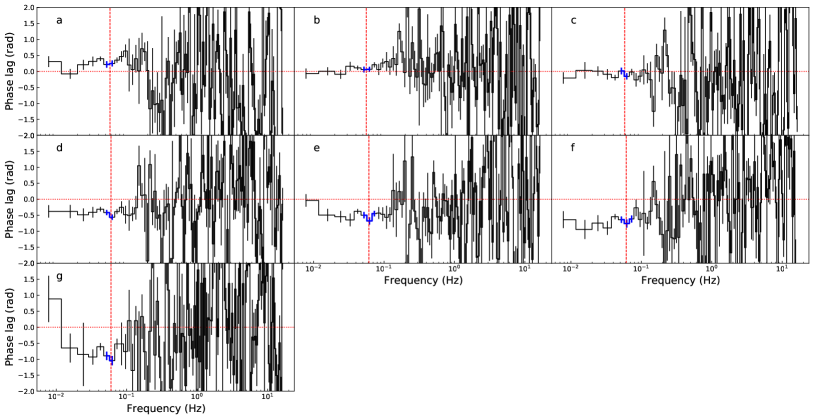
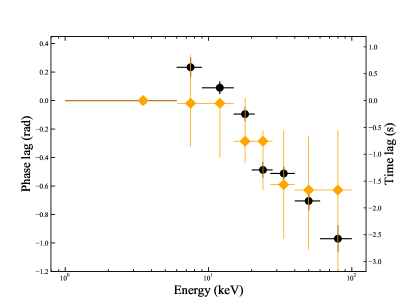
Phase/time lag is a commonly used tool to study the X-ray variability and can help us understand the geometry of the emission area. In Figure 6, we show the frequency-dependent phase-lag spectra for different energy bands, relative to the same reference band 1–6 keV. From this figure, we do not see clear features around the mHz QRM frequency range. The phase lags below 0.1 Hz remain more or less constant. This is consistent with the fact that the PDS below 0.1 Hz is completely dominated by the Lorentzian component of the QRM. This is in sharp contrast with that type-C QPOs, which are strongly interfered by the underlying broadband noise (Ma et al., 2021). Above 0.1 Hz, the phase lags can not be constrained well. We calculate the phase lags of the mHz QRM by averaging the lags over the mHz QRM frequency range , as we commonly do for QPOs (Vaughan & Nowak, 1997; Qu et al., 2010; Zhang et al., 2017). The results are shown in Figure 7 with black points. Below 10 keV, we find a slight hard lag or zero lag. Above 10 keV, the lags are soft and decrease with energy up to 100 keV. Since the light curve is mainly dominated by the flare (QRM), we also calculate the time lags from the cross-correlation in time domain (see orange points in Figure 7). Although the errors of the time lags measured from the cross-correlation are very large, we can see that the trend of the black and orange points is consistent.
3.3 Spectral changes during the transitions between different kinds of PDS
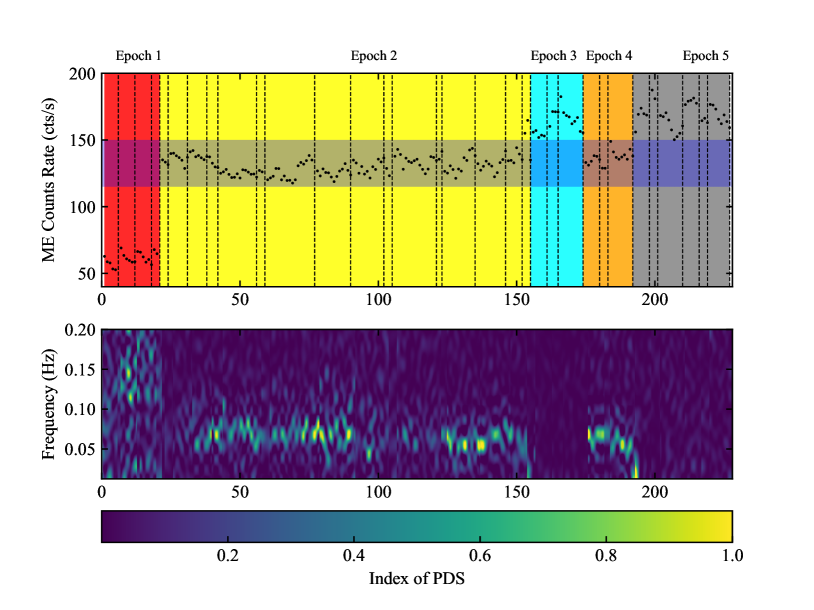
During the period between MJD 58482–58485, we observe fast transitions among different types of PDS, as shown in Figure 4. In Figure 8, we show the ME 8.0–35.0 keV light curve with 80-s binning and the corresponding dynamical PDS within this period. The dashed lines in the top panel mark the time gaps between orbits. The -axis label is the index of each 80-s PDS. Based on the characteristic of the PDS and the flux level, we divide this period into 5 epochs. During epoch 1, significant type-C QPOs with a strong band-limited noise at low frequencies are observed in the PDS. The type-C QPO disappears in epoch 2 and is replaced by the mHz QRM. The mHz QRM disappears in epoch 3, re-appears in epoch 4, and then disappears in epoch 5. It is clear that the mHz QRM is only observed within a narrow flux range (ME 8–35 keV count rates ). The behaviour of the regular flux modulation disappears outside of this range.
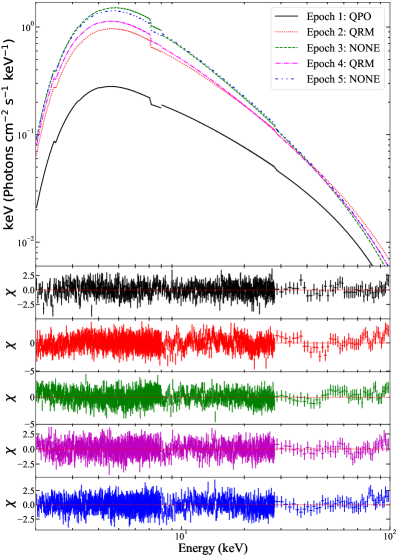
To study the spectral changes during the transitions among the epochs, we extract background-subtracted spectra for the 5 epochs, separately. We use XSPEC v12.12.0 for the following spectral studies (Arnaud, 1996). We have tried several continuum models, and found that the model is the best-fitting model. In this model, the multiplicative constant is used to quantify the cross-calibration uncertainties between the three instruments of Insight-HXMT. The component thcomp is a novel thermal Comptonization convolution model to describe the broadband X-ray power-law continuum, which is presented as a replacement for the nthcomp model (Zdziarski et al., 1996, 2020; Dziełak et al., 2021; Wang et al., 2022). To use the thcomp convolution model, we extend the energy grid from 0.1 keV to 500 keV with the XSPEC command ENERGIES to treat with the limited response matrices at high or low energies. Because the distance of 4U 1630–47 is not precisely measured, the hydrogen column density is still not well determined () (Tomsick et al., 1998; Pahari et al., 2018). Given that the column density of the Galactic absorption is not expected to change on short timescales, we fit the five spectra simultaneously with linked.
The best-fitting spectral parameters are listed in Table 2. The errors are given at 1 level. The best-fitting models are shown in Figure 9, along with the residual of each spectrum. From our fits, we get a moderate value of , which is consistent with previous results (Trudolyubov et al., 2001; Baby et al., 2020).
We first compare the spectra of the period with the type-C QPO and that with the mHz QRM (epochs 1 and 2). From epoch 1 to epoch 2, the disk temperature increases from keV to keV, accompanied by an increase in diskbb normalization. In addition to the disk variation, the electron temperature increases slightly from keV to keV. Meanwhile, a smaller optical depth is seen in epoch 2 () than that in epoch 1 ().
We then compare the spectra of the period with and without the mHz QRM (epochs 2, 3, 4 and 5). The disk temperature is lower when the QRM appears, while the diskbb normalization is slightly higher. The optical depth of the Comptonization region is slightly higher when the QRM appears.
Apart from the differences discussed above, is constrained at its upper limit for epochs 2,3,4 and 5, but its value is slightly smaller in epoch 1.
In order to constrain the minimum set of spectral parameters that dominate the spectral changes, we conduct a simultaneous fit for two sets of spectra: the spectra of the epochs with the type-C QPO and the QRM (epochs 1 and 2), and the spectra of the epochs with and without the QRM (epochs 2 and 3). As Sriram et al. (2013) did for type-B QPO, we first tie all parameters together, which leads to a very high . We then untie the parameters of diskbb and thcomp one by one, and check the change of (see Table 3). We find that, for both sets of spectra, untying the parameters of the disk component significantly improves the fits. The two parameters of diskbb, and , are highly correlated. Therefore, it is hard to distinguish which parameter leads to the changes. Freeing only or freeing only results in a similar . For both sets of spectra, the optical depth of the corona is also needed to be free to obtain an acceptable fit. Allowing and to vary only marginally improves the fit for the set epochs 1 and 2, and does not improve the fit any more for the set epochs 2 and 3. We have also tried to free the thcomp parameters first. However, freeing all the parameters of thcomp still leads to an unacceptable fit with .
Moreover, due to the relatively low flux of the source at the time of observation, we cannot perform phase-resolved spectral study or time-resolved spectral study for 4U 1630–47 as done for GRS 1915+105 (Neilsen et al., 2012; Rawat et al., 2022). Nevertheless, we performed a simple flux-resolved spectra comparison for the mHz QRM. We extracted spectra from data above the average count rate and below the average count rate, respectively. We fit the low-flux and high-flux spectra jointly with the model . The results show a slight difference in normalization, while the other parameters remain consistent within error.
| Component | Parameter | Epoch 1 | Epoch 2 | Epoch 3 | Epoch 4 | Epoch 5 |
|---|---|---|---|---|---|---|
| constant (LE) | 1.00 (F) | 1.00 (F) | 1.00 (F) | 1.00 (F) | 1.00 (F) | |
| constant (ME) | 1.07 | 1.00 | 0.91 | 0.97 | 1.05 | |
| constant (HE) | 1.02 | 0.94 | 0.87 | 0.95 | 0.98 | |
| TBabs | (link) | |||||
| diskbb | ||||||
| norm | ||||||
| ) | ||||||
| thcomp | ||||||
| 572/671 | 1045/1097 | 1054/1085 | 887/1019 | 984/1046 | ||
| Parameter | All tied | norm | ||||
| Epoch 1,2 | 30620/1759 | 1825/1758 | 1818/1757 | 1626/1756 | 1624/1755 | 1619/1754 |
| Epcoh 2,3 | 11200/2173 | 2623/2172 | 2622/2171 | 2102/2170 | 2102/2169 | 2102/2168 |
| Parameter | All tied | norm | ||||
| Epoch 1,2 | 30620/1759 | 1827/1758 | 1818/1757 | 1626/1756 | 1624/1755 | 1619/1754 |
| Epcoh 2,3 | 11200/2173 | 2676/2172 | 2622/2171 | 2102/2170 | 2102/2169 | 2102/2168 |
| Parameter | All tied | norm | ||||
| Epoch 1,2 | 30620/1759 | 4679/1758 | 4017/1757 | 3314/1756 | 1621/1755 | 1619/1754 |
| Epcoh 2,3 | 11200/2173 | 6742/2172 | 5143/2171 | 5143/2170 | 2118/2169 | 2102/2168 |
| Parameter | All tied | norm | ||||
| Epoch 1,2 | 30620/1759 | 5516/1758 | 4291/1757 | 4291/1756 | 1624/1755 | 1619/1754 |
| Epcoh 2,3 | 11200/2173 | 11122/2172 | 4726/2171 | 4726/2170 | 2118/2169 | 2102/2168 |
| Parameter | All tied | norm | ||||
| Epoch 1,2 | 30620/1759 | 3483/1758 | 3315/1757 | 3315/1756 | 1621/1755 | 1619/1754 |
| Epoch 2,3 | 11200/2173 | 6142/2172 | 5570/2171 | 4619/2170 | 2118/2169 | 2102/2168 |
4 DISCUSSION
In section 3, we have carried out a detailed timing and spectral analysis of the five epochs with type-C QPO and the secular mHz QRM in 4U1630-47, as observed by Insight-HXMT during the 2021 outburst. In this section, we will discuss the possible mechanisms behind the mHz QRM based on above results.
4.1 Appearance of the mHz QRM
In terms of 2021 outburst, the mHz QRM appears shortly after the disappearance of type-C QPO within one day (from MJD 59482.626 to MJD 59483.785), along with a drop of total fractional rms (see Figure 3). In the bottom panel of Figure 3, the fractional rms remains stable before MJD 59483 when the type-C QPO is prominent in PDS. After MJD 59483, the rms amplitude decreases from above 25% to below 20% when the mHz QRM appears. The drop of fractional rms during intermediate state is usually accompanied by the transition from hard intermediate state to soft intermediate state.
A similar mHz QRM was also observed in the 1998 outburst of 4U 1630–47 with RXTE (Trudolyubov et al., 2001). However, the light curves of the mHz QRM seen in the 1998 and 2021 outbursts are quite different. For the mHz QRM in the 1998 outburst, the light curve is characterized by the presence of quasi-regular dips with a period of 10–20 s, instead of the flare-like features shown in Figure 4. In particular, the PDS of the observation of the 1998 outburst show three extra prominent QPO features at 4.7 Hz, 7.0 Hz and 13 Hz, in addition to the peak of the mHz QRM (Dieters et al., 2000; Trudolyubov et al., 2001). Further, Trudolyubov et al. (2001) investigated the flux-dependent properties of this observation. They divided the observation into two different flux levels and found that the 13 Hz QPO is prominent at low fluxes, and disappears at high fluxes. The 4.7 Hz QPO was observed at low fluxes, and shifted to 7 Hz at high fluxes. However, in the 2021 outburst, the type-C QPO is not simultaneously detected with the mHz QRM. We have also made a comparison of the PDS between the low-flux period and the high-flux period for our observations with the mHz QRM. No significant QPO signal was found in the 1–20 Hz range. To check the possibility of the presence of a low-frequency QPO, we add an extra Lorentzian component to the PDS with the frequency fixed at any potential peak in the frequency range 1–10 Hz, and get a very low rms value (). Therefore, we can rule out the presence of a significant low-frequency QPO when the mHz QRM appears.
Meanwhile, the appearance of mHz QRM is related to the accretion rate based on our results (see Figure 8), corresponding to (assuming a distance of ). We have also checked the RXTE observations of the 1998 outburst and confirmed that the mHz QRM is also observed in a special flux plateau. Trudolyubov et al. (2001) suggested that the accretion-rate dependent flares might be common for black hole binaries emitting at a certain luminosity level. For 4U 1630–47, the appearance of the mHz QRM was observed at a very similar luminosity and position in HID compared to the 1998 outburst: the mHz QRM appears at a flux of in 3–20 keV for 2021 outburst and at for 1998 outburst. This behaviour can be explained by the local radiation dominated disk instability model, considering the occurrence of limit cycle behaviour under certain narrow accretion-rate range (Kato et al., 2008). Phenomenologically, the quasi-regular flare can be interpreted as the rapid removal and replenishment of matter forming the inner region of the accretion disk, as observed in GRS 1915+105 (Belloni et al., 1997a). This process finishes a cycle on the viscous/thermal timescale.
Although the light curves of the mHz QRM seen in the 1998 and 2021 outbursts show different variations, the energy-dependent fractional rms and lag of the mHz QRM are similar (Zhao et al. in preparation). Considering that the mHz QRM appears in a similar flux range, we suggest that the mHz QRM seen in the two outbursts may have a similar physical origin.
Apart from the comparison with the 1998 outburst, we also compare this mHz QRM with the 11 mHz QPO detected in H 1743–322 (Altamirano & Strohmayer, 2012; Cheng et al., 2019). Altamirano & Strohmayer (2012) reported the detection of a 11 mHz QPO in H 1743–322 at the beginning of the 2010 and 2011 outbursts. The mHz QPO was found at a similar spectral hardness value and intensity level, suggesting an accretion-rate dependence. We can see clear quasi-regular modulations from the light curves, similar to what we find in 4U 1630–47. However, the 11 mHz QPO is much narrower () than the QRM observed in 4U 1630–47. In addition, the fractional rms amplitude of the 11 mHz QPO is significantly lower (). Meanwhile, its energy-dependent properties also seems to be different from that found in 4U 1630–47 (Altamirano & Strohmayer, 2012; Cheng et al., 2019). Therefore, it is not clear whether the two mHz signals have a similar physical origin or not.
4.2 Properties of the mHz QRM
Thanks for the large effective area and broad energy range of Insight-HXMT, we are able to investigate the energy dependence of the QRM properties to higher energy band. From Figure 5, we can see that both the fractional rms and characteristic frequency of the QRM increase with energy up to 60–100 keV. This positive correlation is more significant in fractional rms than in frequency, inferred from the results of linear function fitting. The energy-dependent fractional rms provides important evidence to constrain the physical origin of the mHz QRM. The increasing fractional rms up to 60–100 keV implies that the mHz QRM phenomenon is more pronounced for no-thermal components, the so-called corona/hot flow region. It is worth noticing that some sub-Eddington sources, such as IGR J17091–3624, also show this exotic variability while other Eddington-limited sources, such as GX 17+2 and V404 Cyg, do not (Court et al., 2017). S\kadowski (2016) concluded that the disk size or minimum stabilizing large-scale magnetic field may be the unifying factor behind the objects that display GRS 1915-like variability. In conclusion, the results we obtained can well constrain the origin of the mHz QRM to the hot corona region.
The spectral evolution between different epochs provide more information on the physical origin of the transitions. We find two transitions: from the epoch with the type-C QPO to the appearance of the mHz QRM, and from the epoch with the mHz QRM to the disappearance of the mHz QRM. The transition from the type-C QPO epoch to the mHz QPO epoch appears to be accompanied by an increase in inner disk radius. By comparing the optical depth of corona and scattering factor between epochs 1 and 2, we find that only 76% of the seed photons are scattered in epoch 1, whereas nearly all photons from accretion disk are scattered in the Comptonization region in epoch 2. Meanwhile, the optical depth of the corona decreases from to . Compared to the period without the mHz QRM, we find a colder inner disk and a larger disk radius when the mHz QRM appears in epoch 2 and 4. In addition to changes in diskbb parameters, we also find that, when the mHz QRM appears, the optical depth is slightly higher. To summarize, the disk parameters and the optical depth have a significant effect on the goodness of the fits.
Meanwhile, the more or less zero lags below 10 keV and negative lags above 10 keV put strict restrictions on the origin of this mHz QRM. The magnitude of the time delays on timescales of seconds implies that they can not be produced by light travel time effects or Comptonization (Uttley et al., 2011). Considering the fast velocity of jet-like ejection (), we cannot attribute the change of time delay to the change of the size of ejection. If it is the case, its size will be larger than . Mir et al. (2016) used the RXTE/PCA archival data of GRS 1915+015 during the ”” class, and produced the energy-dependent rms and time lag for the ”heartbeat” modulation. They found that the time lags turn to a large soft lag at high energies, similar to what we found in 4U 1630–47 for the mHz QRM. However, the fractional rms turns around at 10 keV, and then decreases to a lower value with energy. This is opposite to the positive correlation we observed in 4U 1630–47. Mir et al. (2016) proposed that there is a delayed response of the inner disk radius to the accretion rate. In this model, the fluctuating accretion rate in the outer disk drives the oscillations of the inner radius after a time delay up to several seconds, , while the power-law component responds immediately. They showed that, in such a scenario, a pure sinusoidal oscillation of the accretion rate can explain the shape and magnitude of the energy dependent rms and time lag of the ”heartbeat” modulation seen in GRS 1915+015. However, in the case of 4U 1630–47, by broad band spectral analysis, we find that the spectra can be well-fitted by a single thermal Comptonization component () which fully scatters the seed photon from a multi-black body accretion disk. This means that the radiation from 1-100 keV is almost entirely from the Compton scattering of the corona. Meanwhile, the energy-dependent rms shown in Figure 5 cannot be fitted under the model that Mir et al. (2016) presented. A further investigation on the model is needed in the future to explain the results shown in our work.
From epcoh 1 to epoch 2, the decreasing optical depth suggests the expansion of the corona, leading to a decrease in electron density (Zdziarski et al., 2020). The expansion of the corona will also increase the coupled area between the disk and corona, thus leading to a fully scattered Comptonization spectrum and an increase in scattering fraction. We speculate that the joint region where the inner part of the accretion disk interacts with corona could be the place this flux modulation happens. An unknown instability with strict accretion rate dependence in the corona leads to the quasi-regular flux modulation . If the luminosity is slightly off the narrow luminosity range, the quasi-regular flux modulation will not appear to be accompanied with increasing disk temperature, which may reconstruct the coupling region between corona and accretion disk.
5 CONCLUSION
In this work, we present a detailed energy-dependent timing analysis and spectral comparison for the mHz QRM in 4U 1630–47. The main results are summarised as follows:
(1) The fractional rms of the mHz QRM increases with photon energy from 1 to 100 keV. The characteristic frequency of the mHz QRM increases marginally with energy. The phase/time lag of the mHz QRM is more or less zero below 10 keV and becomes negative above 10 keV. The absolute lag increases with energy from 10 keV up to 60–100 keV.
(2) The behaviour of the mHz QRM significantly depends on the accretion rate. The corresponding flux in 3–20 keV is about , which is very close to that observed in the 1998 outburst.
(3) We measure the spectral differences among the periods with the type-C QPO, with the mHz QRM and without the mHz QRM. Compared with the type-C QPO spectra, the inner disk temperature increases, while the optical depth of the corona decreases when the mHz QRM appears. Meanwhile, the scattering fraction increases marginally from type-C epoch to mHz QRM epoch. Compared with the period without the mHz QRM, the optical depth of the corona is higher, while the inner disk temperature is slightly lower when the mHz QRM appears.
This mHz QRM phenomenon could be interpreted by an unknown instability in corona that causes the flux modulation. Meanwhile, the change of corona optical depth/size and inner temperature of disk may be related to the appearance of the mHz QRM. However, a more complex model is needed to explain the energy-dependence rms and time lag. Observations of the mHz QRM with future X-ray telescopes, e.g., the enhanced X-ray Timing and Polarimetry mission (eXTP, Zhang et al. 2019), are required to perform a more detailed time/phase-resolved analysis and give a deeper insight into its physical origin.
Data Availability
The raw data underlying this article are available at http://hxmten.ihep.ac.cn/.
References
- Abe et al. (2005) Abe, Y., Fukazawa, Y., Kubota, A., Kasama, D., & Makishima, K. 2005, PASJ, 57, 629, doi: 10.1093/pasj/57.4.629
- Altamirano & Strohmayer (2012) Altamirano, D., & Strohmayer, T. 2012, ApJ, 754, L23, doi: 10.1088/2041-8205/754/2/L23
- Altamirano et al. (2011) Altamirano, D., Belloni, T., Linares, M., et al. 2011, ApJ, 742, L17, doi: 10.1088/2041-8205/742/2/L17
- Arnaud (1996) Arnaud, K. A. 1996, in Astronomical Society of the Pacific Conference Series, Vol. 101, Astronomical Data Analysis Software and Systems V, ed. G. H. Jacoby & J. Barnes, 17
- Astropy Collaboration et al. (2013) Astropy Collaboration, Robitaille, T. P., Tollerud, E. J., et al. 2013, A&A, 558, A33, doi: 10.1051/0004-6361/201322068
- Baby et al. (2020) Baby, B. E., Agrawal, V. K., Ramadevi, M. C., et al. 2020, MNRAS, 497, 1197, doi: 10.1093/mnras/staa1965
- Belloni & Hasinger (1990) Belloni, T., & Hasinger, G. 1990, A&A, 227, L33
- Belloni et al. (2000) Belloni, T., Klein-Wolt, M., Méndez, M., van der Klis, M., & van Paradijs, J. 2000, A&A, 355, 271. https://arxiv.org/abs/astro-ph/0001103
- Belloni et al. (1997a) Belloni, T., Méndez, M., King, A. R., van der Klis, M., & van Paradijs, J. 1997a, ApJ, 479, L145, doi: 10.1086/310595
- Belloni et al. (2002) Belloni, T., Psaltis, D., & van der Klis, M. 2002, ApJ, 572, 392, doi: 10.1086/340290
- Belloni et al. (1997b) Belloni, T., van der Klis, M., Lewin, W. H. G., et al. 1997b, A&A, 322, 857
- Belloni & Stella (2014) Belloni, T. M., & Stella, L. 2014, Space Sci. Rev., 183, 43, doi: 10.1007/s11214-014-0076-0
- Bu et al. (2015) Bu, Q.-c., Chen, L., Li, Z.-s., et al. 2015, ApJ, 799, 2, doi: 10.1088/0004-637X/799/1/2
- Bu et al. (2021) Bu, Q. C., Zhang, S. N., Santangelo, A., et al. 2021, ApJ, 919, 92, doi: 10.3847/1538-4357/ac11f5
- Cao et al. (2020) Cao, X., Jiang, W., Meng, B., et al. 2020, SCPMA, 63, 249504, doi: 10.1007/s11433-019-1506-1
- Capitanio et al. (2015) Capitanio, F., Campana, R., De Cesare, G., & Ferrigno, C. 2015, MNRAS, 450, 3840, doi: 10.1093/mnras/stv687
- Casella et al. (2005) Casella, P., Belloni, T., & Stella, L. 2005, ApJ, 629, 403, doi: 10.1086/431174
- Chen et al. (2020) Chen, Y., Cui, W., Li, W., et al. 2020, SCPMA, 63, 249505, doi: 10.1007/s11433-019-1469-5
- Chen et al. (2018) Chen, Y. P., Zhang, S., Qu, J. L., et al. 2018, ApJ, 864, L30, doi: 10.3847/2041-8213/aadc0e
- Cheng et al. (2019) Cheng, Z., Méndez, M., Altamirano, D., Beri, A., & Wang, Y. 2019, MNRAS, 482, 550, doi: 10.1093/mnras/sty2695
- Choudhury et al. (2015) Choudhury, M., Bhatt, N., & Bhattacharyya, S. 2015, MNRAS, 447, 3960, doi: 10.1093/mnras/stu2742
- Connors et al. (2021) Connors, R. M. T., García, J. A., Tomsick, J., et al. 2021, ApJ, 909, 146, doi: 10.3847/1538-4357/abdd2c
- Court et al. (2017) Court, J. M. C., Altamirano, D., Pereyra, M., et al. 2017, MNRAS, 468, 4748, doi: 10.1093/mnras/stx773
- Dieters et al. (2000) Dieters, S. W., Belloni, T., Kuulkers, E., et al. 2000, ApJ, 538, 307, doi: 10.1086/309108
- Done et al. (2007) Done, C., Gierliński, M., & Kubota, A. 2007, A&A Rev., 15, 1, doi: 10.1007/s00159-007-0006-1
- Dziełak et al. (2021) Dziełak, M. A., De Marco, B., & Zdziarski, A. A. 2021, MNRAS, 506, 2020, doi: 10.1093/mnras/stab1700
- Feng et al. (2022) Feng, M. Z., Kong, L. D., Wang, P. J., et al. 2022, arXiv e-prints, arXiv:2201.08588. https://arxiv.org/abs/2201.08588
- Guo et al. (2020) Guo, C.-C., Liao, J.-Y., Zhang, S., et al. 2020, Journal of High Energy Astrophysics, 27, 44, doi: 10.1016/j.jheap.2020.02.008
- Hannikainen et al. (2005) Hannikainen, D. C., Rodriguez, J., Vilhu, O., et al. 2005, A&A, 435, 995, doi: 10.1051/0004-6361:20042250
- Huang et al. (2018) Huang, Y., Qu, J. L., Zhang, S. N., et al. 2018, ApJ, 866, 122, doi: 10.3847/1538-4357/aade4c
- Hunter (2007) Hunter, J. D. 2007, Computing in Science and Engineering, 9, 90, doi: 10.1109/MCSE.2007.55
- Huppenkothen et al. (2019a) Huppenkothen, D., Bachetti, M., Stevens, A. L., et al. 2019a, ApJ, 881, 39, doi: 10.3847/1538-4357/ab258d
- Huppenkothen et al. (2019b) Huppenkothen, D., Bachetti, M., Stevens, A., et al. 2019b, The Journal of Open Source Software, 4, 1393, doi: 10.21105/joss.01393
- Ingram & Done (2010) Ingram, A., & Done, C. 2010, MNRAS, 405, 2447, doi: 10.1111/j.1365-2966.2010.16614.x
- Ingram & Done (2011) —. 2011, MNRAS, 415, 2323, doi: 10.1111/j.1365-2966.2011.18860.x
- Ingram et al. (2009) Ingram, A., Done, C., & Fragile, P. C. 2009, MNRAS, 397, L101, doi: 10.1111/j.1745-3933.2009.00693.x
- Ingram & Motta (2019) Ingram, A. R., & Motta, S. E. 2019, New A Rev., 85, 101524, doi: 10.1016/j.newar.2020.101524
- Jones et al. (1976) Jones, C., Forman, W., Tananbaum, H., & Turner, M. J. L. 1976, ApJ, 210, L9, doi: 10.1086/182291
- Kalamkar et al. (2016) Kalamkar, M., Casella, P., Uttley, P., et al. 2016, MNRAS, 460, 3284, doi: 10.1093/mnras/stw1211
- Kalemci et al. (2018) Kalemci, E., Maccarone, T. J., & Tomsick, J. A. 2018, ApJ, 859, 88, doi: 10.3847/1538-4357/aabcd3
- Kato et al. (2008) Kato, S., Fukue, J., & Mineshige, S. 2008, Black-Hole Accretion Disks — Towards a New Paradigm —
- King et al. (2014) King, A. L., Walton, D. J., Miller, J. M., et al. 2014, ApJ, 784, L2, doi: 10.1088/2041-8205/784/1/L2
- Klein-Wolt et al. (2002) Klein-Wolt, M., Fender, R. P., Pooley, G. G., et al. 2002, MNRAS, 331, 745, doi: 10.1046/j.1365-8711.2002.05223.x
- Kuulkers et al. (1997) Kuulkers, E., Parmar, A. N., Kitamoto, S., Cominsky, L. R., & Sood, R. K. 1997, MNRAS, 291, 81, doi: 10.1093/mnras/291.1.81
- Liao et al. (2020a) Liao, J.-Y., Zhang, S., Lu, X.-F., et al. 2020a, Journal of High Energy Astrophysics, 27, 14, doi: 10.1016/j.jheap.2020.04.002
- Liao et al. (2020b) Liao, J.-Y., Zhang, S., Chen, Y., et al. 2020b, Journal of High Energy Astrophysics, 27, 24, doi: 10.1016/j.jheap.2020.02.010
- Lightman & Eardley (1974) Lightman, A. P., & Eardley, D. M. 1974, ApJ, 187, L1, doi: 10.1086/181377
- Liu et al. (2020) Liu, C., Zhang, Y., Li, X., et al. 2020, SCPMA, 63, 249503, doi: 10.1007/s11433-019-1486-x
- Liu et al. (2021) Liu, Q., Liu, H., Bambi, C., & Ji, L. 2021, arXiv e-prints, arXiv:2111.00719. https://arxiv.org/abs/2111.00719
- Ma et al. (2021) Ma, X., Tao, L., Zhang, S.-N., et al. 2021, Nature Astronomy, 5, 94, doi: 10.1038/s41550-020-1192-2
- Méndez et al. (2022) Méndez, M., Karpouzas, K., García, F., et al. 2022, Nature Astronomy, 6, 577, doi: 10.1038/s41550-022-01617-y
- Mineo et al. (2021) Mineo, T., Massa, F., Massaro, E., & Feroci, M. 2021, A&A, 650, A122, doi: 10.1051/0004-6361/202040251
- Mir et al. (2016) Mir, M. H., Misra, R., Pahari, M., Iqbal, N., & Ahmad, N. 2016, MNRAS, 457, 2999, doi: 10.1093/mnras/stw156
- Miyamoto et al. (1991) Miyamoto, S., Kimura, K., Kitamoto, S., Dotani, T., & Ebisawa, K. 1991, ApJ, 383, 784, doi: 10.1086/170837
- Morgan et al. (1997) Morgan, E. H., Remillard, R. A., & Greiner, J. 1997, ApJ, 482, 993, doi: 10.1086/304191
- Motta et al. (2011) Motta, S., Muñoz-Darias, T., Casella, P., Belloni, T., & Homan, J. 2011, MNRAS, 418, 2292, doi: 10.1111/j.1365-2966.2011.19566.x
- Neilsen et al. (2012) Neilsen, J., Remillard, R. A., & Lee, J. C. 2012, ApJ, 750, 71, doi: 10.1088/0004-637X/750/1/71
- Pahari et al. (2018) Pahari, M., Bhattacharyya, S., Rao, A. R., et al. 2018, ApJ, 867, 86, doi: 10.3847/1538-4357/aae53b
- Parmar et al. (1995) Parmar, A. N., Angelini, L., & White, N. E. 1995, ApJ, 452, L129, doi: 10.1086/309730
- Priedhorsky (1986) Priedhorsky, W. 1986, Ap&SS, 126, 89, doi: 10.1007/BF00644177
- Qu et al. (2010) Qu, J. L., Lu, F. J., Lu, Y., et al. 2010, ApJ, 710, 836, doi: 10.1088/0004-637X/710/1/836
- Rawat et al. (2022) Rawat, D., Misra, R., Jain, P., & Yadav, J. S. 2022, MNRAS, 511, 1841, doi: 10.1093/mnras/stac154
- Remillard et al. (1999) Remillard, R. A., Morgan, E. H., McClintock, J. E., Bailyn, C. D., & Orosz, J. A. 1999, ApJ, 522, 397, doi: 10.1086/307606
- Seifina et al. (2014) Seifina, E., Titarchuk, L., & Shaposhnikov, N. 2014, ApJ, 789, 57, doi: 10.1088/0004-637X/789/1/57
- S\kadowski (2016) S\kadowski, A. 2016, MNRAS, 462, 960, doi: 10.1093/mnras/stw1852
- Soleri et al. (2008) Soleri, P., Belloni, T., & Casella, P. 2008, MNRAS, 383, 1089, doi: 10.1111/j.1365-2966.2007.12596.x
- Sriram et al. (2013) Sriram, K., Rao, A. R., & Choi, C. S. 2013, ApJ, 775, 28, doi: 10.1088/0004-637X/775/1/28
- Tomsick et al. (2005) Tomsick, J. A., Corbel, S., Goldwurm, A., & Kaaret, P. 2005, ApJ, 630, 413, doi: 10.1086/431896
- Tomsick et al. (1998) Tomsick, J. A., Lapshov, I., & Kaaret, P. 1998, ApJ, 494, 747, doi: 10.1086/305240
- Tomsick et al. (2014) Tomsick, J. A., Yamaoka, K., Corbel, S., et al. 2014, ApJ, 791, 70, doi: 10.1088/0004-637X/791/1/70
- Trudolyubov et al. (2001) Trudolyubov, S. P., Borozdin, K. N., & Priedhorsky, W. C. 2001, MNRAS, 322, 309, doi: 10.1046/j.1365-8711.2001.04073.x
- Uttley et al. (2011) Uttley, P., Wilkinson, T., Cassatella, P., et al. 2011, MNRAS, 414, L60, doi: 10.1111/j.1745-3933.2011.01056.x
- van der Klis (2006) van der Klis, M. 2006, in Compact stellar X-ray sources, Vol. 39, 39–112
- van der Walt et al. (2011) van der Walt, S., Colbert, S. C., & Varoquaux, G. 2011, Computing in Science and Engineering, 13, 22, doi: 10.1109/MCSE.2011.37
- Vaughan & Nowak (1997) Vaughan, B. A., & Nowak, M. A. 1997, ApJ, 474, L43, doi: 10.1086/310430
- Wang et al. (2022) Wang, P. J., Kong, L. D., Chen, Y. P., et al. 2022, MNRAS, 512, 4541, doi: 10.1093/mnras/stac773
- Weng et al. (2018) Weng, S.-S., Wang, T.-T., Cai, J.-P., Yuan, Q.-R., & Gu, W.-M. 2018, ApJ, 865, 19, doi: 10.3847/1538-4357/aad9a6
- Yang et al. (2022) Yang, Z.-X., Zhang, L., Bu, Q.-C., et al. 2022, ApJ, 932, 7, doi: 10.3847/1538-4357/ac63af
- Zdziarski et al. (1996) Zdziarski, A. A., Johnson, W. N., & Magdziarz, P. 1996, MNRAS, 283, 193, doi: 10.1093/mnras/283.1.193
- Zdziarski et al. (2020) Zdziarski, A. A., Szanecki, M., Poutanen, J., Gierliński, M., & Biernacki, P. 2020, MNRAS, 492, 5234, doi: 10.1093/mnras/staa159
- Zhang et al. (2017) Zhang, L., Wang, Y., Méndez, M., et al. 2017, ApJ, 845, 143, doi: 10.3847/1538-4357/aa8138
- Zhang et al. (2021) Zhang, L., Altamirano, D., Uttley, P., et al. 2021, MNRAS, 505, 3823, doi: 10.1093/mnras/stab1553
- Zhang et al. (2019) Zhang, S., Santangelo, A., Feroci, M., et al. 2019, Science China Physics, Mechanics, and Astronomy, 62, 29502, doi: 10.1007/s11433-018-9309-2
- Zhang et al. (2020) Zhang, S.-N., Li, T., Lu, F., et al. 2020, SCPMA, 63, 249502, doi: 10.1007/s11433-019-1432-6
- Zhang et al. (2014) Zhang, Z., Qu, J. L., Gao, H. Q., et al. 2014, A&A, 569, A33, doi: 10.1051/0004-6361/201323294
- Zhang et al. (2013) Zhang, Z., Qu, J. L., Gao, H. Q., & Zhou, J. N. 2013, in Feeding Compact Objects: Accretion on All Scales, ed. C. M. Zhang, T. Belloni, M. Méndez, & S. N. Zhang, Vol. 290, 364–366, doi: 10.1017/S174392131202042X