Dense Gas and Star Formation in Nearby Infrared Bright Galaxies: APEX survey of HCN and HCO+ =21
Abstract
Both Galactic and extragalactic studies on star formation suggest that stars form directly from dense molecular gas. To trace such high volume density gas, HCN and HCO+ have been widely used for their high dipole moments, relatively high abundances, and often being the strongest lines after CO. However, HCN and HCO+ emission could be arguably dominated by the gas components at low volume densities. HCN and HCO+ , with more suitable critical densities ( and ) and excitation requirements, would trace typical dense gas closely related to star formation. Here we report new observations of HCN and HCO+ towards 17 nearby infrared-bright galaxies with the APEX 12-m telescope. The correlation slopes between luminosities of HCN , and HCO+ and total infrared emission are 1.03 and 1.00, respectively. The correlations of their surface densities, normalised with the area of radio/sub-millimeter continuum, show even tighter relations (Slopes: and ). The eight AGN-dominated galaxies show no significant difference from the eleven star-formation dominated galaxies in above relations. The average HCN/HCO+ ratios are 1.150.26 and 0.980.42 for AGN-dominated and star-formation dominated galaxies, respectively, without obvious dependencies on infrared luminosity, dust temperature, or infrared pumping. The Magellanic Clouds roughly follow the same correlations, expanding to eight orders of magnitude. On the other hand, ultra-luminous infrared galaxies with active galactic nucleus (AGN) systematically lay above the correlations, indicating potential biases introduced by AGNs.
1 Introduction
Stars, as building blocks of galaxies, contribute most radiation of galaxies, dominate metal enrichment of galaxies, drive galactic outflows, and essentially construct galaxy structures. Therefore, star formation activity is one of the most important evolutionary processes in galaxies (Kennicutt & Evans, 2012). It has been found that molecular gas supplies the raw material of star formation, while the majority of molecular gas is not directly observable from the H2 emission (Bolatto et al., 2013). Molecular gas is often traced with the rotational transitions of other molecules excited by collisions with H2 molecules. Among them, CO transitions mostly trace the bulk of molecular gas, due to its weak permanent dipole moment (; Solomon & Vanden Bout, 2005) and low upper energy levels (5.5 K for ; Schöier et al., 2005), while the dense gas tracers, e.g., rotational transitions of HCN, HCO+, CS, N2H+, etc., can trace denser molecular clouds, due to their much higher dipole moments ( = 2.98 Debye and 3.92 Debye for HCN, HCO+ , respectively; Papadopoulos, 2007).
The star formation rates in galaxies, on the other hand, are usually traced with ultraviolet continuum emission, optical line tracers such as H and [O II], dust emission at infrared (IR) wavelengths, radio continuum emission, or X-ray emission (Kennicutt, 1998a; Kennicutt & Evans, 2012). Among them, the IR emission from dust normally traces the bolometric energy heated up by the young stars. The IR emission is in general extinction-free and often covered by multi-IR-wavelength space telescopes such as Herschel (Pilbratt et al., 2010), Spitzer (Werner et al., 2004), Infrared Astronomical Satellite (IRAS; Neugebauer et al., 1984), etc. Therefore, the total IR luminosity is widely adopted as a star-formation rate tracer for gas-rich galaxies (e.g., Galametz et al., 2016, 2020).
A long-standing question remains: which gas is forming stars? Kennicutt (1998b) found a super-linear correlation between the surface densities of star formation rate (SFR) and total gas mass, where the area was defined by CO or IR images. This correlation, however, turns to a linear shape with a slope index of unity, when the sample is limited to nearby normal spiral galaxies beyond 500-pc scales (e.g., Bigiel et al., 2008). On the other hand, Gao & Solomon (2004a) found that the dense molecular gas traced by HCN is the direct source of star formation. This correlation is further connected to Galactic massive star-forming regions on sub-pc scales (Wu et al., 2005, 2010). Furthermore, Heiderman et al. (2010) also found a similar result by counting young stellar objects in Galactic dense molecular clouds.
However, the emission of HCN and HCO+ could be largely contaminated by diffuse gas with relatively high column densities (Evans et al., 2020). Although the high- transitions (e.g., and ) of HCN and HCO+ (Zhang et al., 2014; Tan et al., 2018; Li et al., 2020b) are found to have linear correlations with star formation rate, these high- transitions are mainly from the densest molecular cores heated by massive stars, and leave out most emission from cold clumps.
HCN and HCO+ , which have moderate critical densities (= , = , for conditions of a kinetic temperature 50 K, optically thin, and no background Shirley, 2015) and suitable upper energy levels ( and , respectively; Shirley, 2015), could avoid aforementioned disadvantages of other transitions. On the other hand, the rest frequency of HCN is close to the H2O 177.3-GHz line in the Earth atmosphere, so the observation needs excellent weather conditions for nearby galaxies.
In this paper, we present Atacama Pathfinder Experiment (APEX) observations of HCN and HCO+ in a sample of 17 IR bright galaxies. In Sect.2 we describe observations with APEX 12-m telescope and ancillary data adopted in this paper. In Sect.3 we describe methods to derive line luminosities, photometry, and dust properties. In Sect.4 we present the obtained spectra, correlations between star formation rate and dense gas tracers, and line ratios. In Sect.5 we discuss the assumptions, caveats, and physical implications of our results. In Sect.6 we summarize our work. We adopt cosmological parameters of , , throughout this work (Spergel et al., 2007).
2 Observation and data reduction
| Source name | R.A. | Dec. | Redshift | Distance a | Ref. | HPBW1.4GHz | Ref. | d | Type | ||
|---|---|---|---|---|---|---|---|---|---|---|---|
| (h,m,s) | (d,m,s) | () | (Mpc) | (arcsec) | (mJy) | (mJy) | () | ||||
| NGC 4945 | 13:05:27.51 | 49:28:06.0 | 0.00188 | 3.8 0.3 | 1 | 9 | 6450 | 33 | 9887 28 | AGN | |
| NGC 1068 | 02:42:40.70 | 00:00:48.0 | 0.00379 | 10.1 2.0 | 1 | 9 | 4848 | 2.6 | 1903 77 | AGN | |
| NGC 7552 | 23:16:10.70 | 42:35:05.0 | 0.00536 | 14.8 1.3 | 2 | 9 | 280 | … e | 652 88 | SF | |
| NGC 4418 | 12:26:54.61 | 00:52:39.0 | 0.00727 | 23.9 2.2 | 3 | 10 | 41 | … e | 132 28 | SF | |
| NGC 1365 | 03:33:36.40 | 36:08:25.0 | 0.00546 | 17.5 3.5 | 1 | 9 | 376 | 4.57 f | 2166 102 | AGN | |
| NGC 3256 | 10:27:51.30 | 43:54:13.0 | 0.00935 | 37.4 6.0 | 4 | 9 | 668 | … e | 1223 8 | SF | |
| NGC 1808 | 05:07:42.30 | 37:30:47.0 | 0.00332 | 12.3 2.5 | 1 | 9 | 528 | … e | 1898 137 | SF | |
| IRAS 13120-5453 | 13:15:06.30 | 55:09:23.0 | 0.031249 | 129.3 9.1 | 1 | 9 | 118 | … e | 126 13 | SF | |
| IRAS 13242-5713 | 13:27:23.80 | 57:29:22.0 | 0.009788 | 37.6 2.6 | 5 | 9 | 97 | … e | … | SF | |
| MRK 331 | 23:51:26.80 | 20:35:10.0 | 0.01848 | 53 5 | 3 | 11 | 71 | 49.5 3.7 | SF | ||
| NGC 6240A | 16:52:58.90 | 02:24:03.5 | 0.02488 | 103 7 | 6 | 12 b | 396 | 5.4 | 333.2 33 | AGN | |
| NGC 6240B | 16:52:58.91 | 02:24:04.2 | |||||||||
| NGC 3628 | 11:20:17.00 | 13:35:23.0 | 0.00281 | 10.3 0.4 | 7 | 13 | 476 | 1309 25 | SF | ||
| NGC 3627 | 11:20:14.90 | 12:59:30.0 | 0.00243 | 10.7 0.5 | 1 | 13 | 459 | 4477 75 | AGN | ||
| IRAS 18293-3413 | 18:32:41.10 | 34:11:27.0 | 0.017996 | 74.8 5.3 | 5 | 9 | 226 | … e | 686.1 7.6 | SF | |
| NGC 7469 | 23:03:15.60 | 08:52:26.0 | 0.01632 | 59.7 1.6 | 3 | 11 | 181 | 32.5 | 48.1 3.5 | AGN | |
| IRAS 17578-0400 | 18:00:31.90 | 04:00:53.0 | 0.013325 | 60 6 | 3 | 9 | 80 | … e | … | SF | |
| IC 1623 | 01:07:47.20 | 17:30:25.0 | 0.02007 | 80.9 5.7 | 6 | 11 | 249 | 4.7 | 291 45 | AGN | |
| Arp 220A | 15:34:57.29 | 23:30:11.3 | 0.01813 | 84.1 5.9 | 6 | 12 c | 515 | 91.25 | 515 51 | SF | |
| Arp 220B | 15:34:57.22 | 23:30:11.5 | |||||||||
| IRAS 19254-7245 | 19:31:21.40 | 72:39:18.0 | 0.06171 | 273 18 | 8 | 14 | … | … | 58.8 5.9 | AGN |
Note. — a We adopt redshift-independent distances measures with Tully-Fisher relation, Tip of the Red-Giant Branch (TRGB) stars, supernova Ia (SN Ia), and Cepheids from NED for most of the galaxies. NGC 1068, NGC 7552, NGC 4418, NGC 3265, NGC 1808, MRK 331, NGC 3628, and IRAS 17578-0400 are measured using the Tully-Fisher relation (Nasonova et al., 2011; Russell, 2002; Theureau et al., 2007; Tully & Fisher, 1988; Tully et al., 2013). NGC 4945 and NGC 3627 are measured with TRGBs (Tully et al., 2015; Jang & Lee, 2017). NGC 1365 is measured with Cepheid (Willick & Batra, 2001). NGC 7469 is measured with SN Ia (Koshida et al., 2017). We adopt Hubble Flow Distance of the rest galaxies in our sample (Karachentsev & Makarov, 1996; de Vaucouleurs et al., 1991; Mould et al., 2000).
b Size of NGC 6240 is estimated from two-component Gaussian fitting of ALMA 480 GHz continuum observation (Project code: 2015.1.00717.S).
c Measurement of Arp 220 uses data of combination of VLA A configuration and MERLIN from Varenius et al. (2016).
d Fluxes of 1.4-GHz continuum only have uniform error of the survey and the errors of individual galaxy is hard to determine.
e These galaxies are all star-formation dominated, so their SMBHs would not affect 1.4 GHz continuum size. (Varenius et al., 2014; Saikia et al., 1990; Herrero-Illana et al., 2017)
f High resolution 1.4 GHz flux of NGC 1365 comes from VLA observation in Sandqvist et al. (1995)
References. — (1) Nasonova et al. (2011); (2) Russell (2002); (3) Theureau et al. (2007); (4) Tully & Fisher (1988); (5) de Vaucouleurs et al. (1991); (6) Mould et al. (2000); (7) Tully et al. (2013); (8) Fixsen et al. (1996); (9) Condon et al. (2021); (10) Costagliola et al. (2013); (11) Liu et al. (2015); (12) This work; (13) Condon (1987); (14) Imanishi et al. (2016)
2.1 Sample selection
Our sample was selected from the survey of CS , HCN , and HCO (Zhang et al., 2014), which contains nearby normal galaxies, luminous and ultra-luminous infrared galaxies (ULIRGs). These galaxies are originally selected from the Infrared Astronomical Satellite (IRAS) Revised Bright Galaxy Sample (Sanders et al., 2003). All galaxies have , and declination to be accessible from APEX. We exclude three targets without any detection of HCN and HCO. The final sample consists of 19 galaxies, which include 17 newly observed galaxies and two ULIRGs from the literature, Arp 220 (Galametz et al., 2016) and Superantennae (Imanishi et al., 2022).
The total IR luminosities range from to , which implies a range of SFR from to . The distance range is 3.72 – 273 Mpc. The molecular gas masses (estimated from CO ) range from to . We further divided the sample into AGN-dominated and Star formation (SF)-dominated galaxies according to the classifications on NASA/IPAC Extragalactic Database (NED)111http://ned.ipac.caltech.edu/. The final sample consists of eight AGN-dominated and eleven SF-dominated galaxies. The basic information of the sample is shown in Table 2.
2.2 HCN and HCO+ observations
The observation was conducted with the APEX 12-m telescope during 2016 July and August (Project ID: E-097.B-0986A-2016). The weather was in good (precipitable water vapour; PWV 0.9 mm) conditions for ten sources, and in normal conditions (PWV 1–1.4 mm) for the rest. The wobbler switching mode was adopted for all observations, with a switching frequency of 2 Hz and a beam throw of 120′′ at each side of the target. The beam size is 34.7′′ (from 34.2′′ to 35.2′′) on average, with a slight variation between targets, depending on the specific line and redshift.
We employed the Swedish-ESO PI Instrument for APEX (SEPIA) receivers (Belitsky et al., 2018) to observe HCN and HCO+ simultaneously, which have rest frequencies of 177.261 GHz and 178.375 GHz, respectively. The SEPIA-180 receiver offers two sidebands, double polarisations, and a 4-GHz bandwidth for each sideband. The targeted two lines are configured in the lower sideband. Focusing calibrations were conducted on Mars, Jupiter, IRAS 15194-5115, IK-Tau, and R-Dor, every 3–4 hrs. Pointing calibrations were conducted on Mars, Jupiter, or nearby () carbon stars every hour.
We used the class package in gildas 222https://www.iram.fr/IRAMFR/GILDAS/ to reduce the spectral line data. We checked the quality of all spectra by eye, fitted the baseline with a first-order polynomial profile, and averaged them together. Each sideband has 104,851 channels with an initial velocity resolution of 0.0644 . We smoothed each spectrum to a velocity resolution of 26 , at which the final r.m.s. noise ranges from 1.5 mK to 2 mK. The main beam temperature, , is converted from the antenna temperature, , using , where is the forward efficiency, and =0.73 is the main beam efficiency. We adopt Kelvin to Jansky conversion factor 39 to convert to flux density from the beam-covered regions. The observational results are shown in Table 2, including integrated flux, Gaussian fitting Full Width Half Maximum (FWHM) velocity width, and Gaussian fitting Peak flux density.
2.3 Infrared data
We obtained multi-wavelength photometric data of the Photodetector Array Camera and Spectrometer (PACS; for 70 , 100 , 160 ; Poglitsch et al., 2010) and the Spectral and Photometric Imaging REceiver (SPIRE; for 250 , 350 , 500 ; Griffin et al., 2010), on board the Herschel Space Observatory. These data were processed to level 2.5 and downloaded from European Space Agency (ESA)333http://archives.esac.esa.int/hsa/whsa/. We also downloaded available 24 data from the archival Spitzer Space Telescope (MIPS; Rieke et al., 2004), which were processed to level 2. The beam sizes, in Half Power Beam Width (HPBW), are 13.9′′, 6.4′′, 5.7′′, 7′′, 11.2′′, 18.2′′, 24.9′′, and 36.1′′ for WISE 22 , MIPS 24 , PACS 70 , 100 , 160 , SPIRE 250 , 350 , and 500 , respectively.
Because some nearby galaxies can not be fully enclosed by the APEX beam, we further measured the emission size of the PACS 70 images with the diameter which encloses 90% flux of the entire galaxy and listed them in Table 2. From the PACS 70 images, seven galaxies (NGC 4945, NGC 1068, NGC 7552, NGC 1365, NGC 1808, NGC 3627, and NGC 3628) have sizes (in diameter) larger than the APEX beam or can not be fully covered by the APEX beam, while the other 12 galaxies are fully enclosed by the APEX beam of 34.7′′ (FWHM). For these 12 point-like galaxies, we adopt the 25 , 60 , and 100 fluxes from the RBGS survey (Sanders et al., 2003), which was obtained with angular resolutions of 0.7′, 1.7′, 3′, respectively. For the seven extended galaxies, we adopt IRAS fluxes scaled from other wavelengths, as described in Section 3.2.
2.4 Radio continuum
We assume that the 1.4 GHz radio continuum emission is dominated by synchrotron radiation from supernova remnants (White, 1985) and free-free radiation from Hii regions (Condon & Ransom, 2016), both would trace recent star-forming activities. We use the 1.4 GHz radio continuum to measure the size of star-forming region, assuming that star formation contributes majority of the radio flux. To verify this assumption and to check possible AGN contamination, very high-resolution radio data is needed. Therefore, we collected very long baseline interferometric (VLBI) data in the literature, which are only available for a few targets.
For galaxies with multiple measurements of the radio size, we adopt the ones observed with highest angular resolutions (Table 2). Ten galaxies have sizes measured from MeerKAT data, which has an angular resolution of 7.5′′ (Condon et al., 2021). Sizes of NGC 3627 and NGC 3628 were measured using NRAO VLA Sky Survey (NVSS; Condon, 1987), which has an angular resolution of 45′′. The size of NGC 4418 is estimated from MERLIN observation at a resolution of (Costagliola et al., 2013). We adopt the 250-GHz ALMA continuum size for IRAS 19254-7245, which was measured by Imanishi et al. (2016).
For other galaxies, we measured their sizes using data downloaded from ALMA data archive and from the literature. We fit the maps with a 2-D Gaussian profile, using task imfit in casa (McMullin et al., 2007). The 1.4 GHz continuum data of Arp 220 was combined with MERLIN data and VLA A-configuration data in the literature (Varenius et al., 2016). NGC 6240 and IRAS 19254-7245 have strong AGN contribution to the 1.4 GHz continuum, we estimate their sizes using ALMA dust continuum data. We download ALMA 480-GHz data of NGC 6240 (Project code: 2015.1.00717.S) and fit its sizes with a two-component Gaussian model (NGC 6140A and NGC 6240B in Table 2).
The sizes and fluxes of the radio continuum are from the whole galaxies. When computing luminosity surface densities in Section 4.3, we adopt the radio area for galaxies with radio sizes smaller than the APEX beam. For galaxies with radio sizes larger than the APEX beam, we adopt the APEX beam area to compute the surface densities.
2.5 Ancillary CO data
Most of the velocity-integrated CO fluxes come from Baan et al. (2008), observed with the Institut de Radioastronomie Millimetrique (IRAM) 30-m telescope (HPBW 21′′) and the Swedish-ESO Submillimeter Telescope (SEST) 15-m telescope (HPBW 45′′). CO fluxes of IRAS 13120-5453 and NGC 4418 are from Sliwa et al. (2017) and Papadopoulos et al. (2012) observed with ALMA and IRAM 30 m, respectively. However, there is no low- CO data available for IRAS 13242-5713 and IRAS 17578-0400.
| Source name | HCN | HCO+ | Diameter70 a | ||||
|---|---|---|---|---|---|---|---|
| Integrated flux | FWHM | Peak | Integrated flux | FWHM | Peak | ||
| () | () | (mJy) | () | () | (mJy) | (arcsec) | |
| NGC 4945 | 885 11 | 328.2 1.9 | 3120 27 | 855 11 | 328.1 2.7 | 2917 35 | 85.2 b |
| NGC 1068 | 243.5 6.4 | 257.9 6.3 | 1076 35 | 180 6 | 253.4 8.7 | 807 39 | 38.6 b |
| NGC 7552 | 63.7 6.0 | 138.5 8.6 | 546 47 | 85.8 5.9 | 166.7 11.1 | 593 55 | 21.9 c |
| NGC 4418 | 54.4 5.9 | 193 20 | 261 35 | 38.7 5.9 | 107 17 | 215 43 | 11.3 |
| NGC 1365 | 95.7 8.7 | 328 29 | 343 39 | 71.1 8.5 | 241 24 | 351 47 | 19.2 c |
| NGC 3256 | 57.9 7.6 | 180 18 | 398 55 | 106.1 7.6 | 181 11 | 683 59 | 19.5 |
| NGC 1808 | 55.7 7.5 | 236 25 | 289 43 | 58.0 7.4 | 156 29 | 394 90 | 22.9 c |
| IRAS 13120-5453 | 48 11 | 333 52 | 187 39 | 43 11 | 362 85 | 152 47 | 11.5 |
| IRAS 13242-5713 | 57 11 | 223 42 | 300 78 | 108 11 | 194 18 | 636 82 | 16.7 |
| MRK 331 | 30.4 8.3 | 214 83 | 101 27 | 32 | … | … | 11.0 |
| NGC 6240 | 61 15 | 809 142 | 101 23 | 83 15 | 640 84 | 152 27 | 11.4 |
| NGC 3628 | 41 11 | 235 58 | 187 59 | 55 11 | 210 30 | 289 59 | 42.5 b |
| NGC 3627 | 46 12 | 332 62 | 179 43 | 54 | … | … | 63.8 b |
| IRAS 18293-3413 | 35 10 | 332 105 | 117 51 | 60 10 | 418 96 | 164 47 | 12.3 |
| NGC 7469 | 50.2 | … | … | 39.8 9.9 | 287 61 | 164 47 | 11.7 |
| IRAS 17578-0400 | 38.2 | … | … | 33 | … | … | 11.7 |
| IC 1623 | 32.1 | … | … | 30.6 8.8 | 208 47 | 187 55 | 14.0 |
Note. — a Diameter of PACS 70 image which encloses 90% flux of the entire galaxy, which is convolved with PACS 70 5.7′′ beam.
b NGC 4945, NGC 1068, NGC 3628, and NGC 3627 have larger diameters than APEX beam.
c NGC 7552, NGC 1365, and NGC 1808 have long structure disks which cannot be enclosed by APEX beam.
3 Method and Analysis
3.1 HCN and HCO+ line luminosity
We calculate the velocity-integrated main beam temperature and the associated thermal noise following Greve et al. (2009):
| (1) |
where = 26 is the final velocity resolution, is the number of channels that cover the line, is the number of the line-free channels, and is the channel-to-channel r.m.s. noise. We adopt 10 % as the absolute flux calibration error during observation.
Then we computed the line luminosities of the region observed in the whole galaxy using the equation from Gao & Solomon (2004b):
| (2) |
where luminosity distance, , and redshift, , are taken from NED (Table 2). We further propagate uncertainties from distance and flux to the final error of line luminosities, using the following formula:
| (3) |
| (4) |
| (5) |
where is the luminosity error propagated from flux error, is the luminosity error propagated from distance estimation, and is the distance error. Because all luminosities adopt the same distance, their ratios do not include errors of distances.
| Source name | MIPS 24 | IRAS 25 | IRAS 60 | PACS 70 | PACS 100 | PACS 160 | SPIRE 250 | SPIRE 350 | SPIRE 500 |
|---|---|---|---|---|---|---|---|---|---|
| (Jy beam-1) | (Jy) | (Jy) | (Jy beam-1) | (Jy beam-1) | (Jy beam-1) | (Jy beam-1) | (Jy beam-1) | (Jy beam-1) | |
| NGC 4945 | 9.7 1.0 | 42.3 4.3 | 625.5 62.7 | 734.5 73.5 | 1060 106 | 883.8 88.4 | 333 33 | 124 12 | 33.1 3.3 |
| NGC 1068 | 31.4 3.2 | 87.6 8.9 | 196.4 19.7 | 180.7 18.1 | … | 146.4 14.7 | 51.1 5.1 | 18.3 1.8 | 5.0 0.51 |
| NGC 7552 | … | 11.9 1.2 | 77.4 7.8 | 82.5 8.3 | 95.6 9.6 | 67.1 6.9 | 22.5 2.3 | 7.6 0.8 | 2.0 0.21 |
| NGC 4418 | 5.9 0.7 | 9.7 1.1 | 43.9 4.5 | 41.5 4.2 | 33.0 3.3 | 18.1 1.8 | 6.2 0.6 | 2.3 0.2 | 0.7 0.08 |
| NGC 1365 | 8.2 0.8 | 14.3 1.5 | 94.3 9.5 | 95.7 9.6 | 132.4 13.3 | 111.4 11.2 | 46.5 4.7 | 17.8 1.8 | 5.1 0.52 |
| NGC 3256 | 11.1 1.1 | 15.7 1.6 | 102.6 10.3 | 111.3 11.1 | 120.7 12.1 | 82.5 8.3 | 26.9 2.7 | 8.7 0.9 | 2.5 0.26 |
| NGC 1808 | 9.7 1.0 | 17.0 1.7 | 105.5 10.6 | 113.1 11.3 | 130.5 13.1 | 94.7 9.5 | 33.6 3.4 | 11.6 1.2 | 3.1 0.32 |
| IRAS 13120-5453 | 2.4 0.2 | 3.0 0.3 | 41.1 4.2 | 47.7 4.8 | 52.3 5.2 | 33.7 3.4 | 11.7 1.2 | 4.1 0.4 | 1.0 0.12 |
| IRAS 13242-5713 | 5.5 0.6 | 7.6 0.8 | 81.4 8.2 | 91.5 9.2 | 98.1 9.8 | 66.0 6.7 | 23.0 2.4 | 7.9 0.9 | 2.2 0.25 |
| MRK 331 | 1.9 0.2 | 2.5 0.3 | 18.0 1.8 | 20.0 2.0 | 22.5 2.3 | 16.3 1.7 | 5.8 0.6 | 2.1 0.2 | 0.5 0.06 |
| NGC 6240 | 2.9 0.3 | 3.5 0.4 | 22.9 2.3 | 25.0 2.5 | 26.2 2.6 | 17.2 1.9 | 5.8 0.6 | 2.0 0.2 | 0.6 0.07 |
| NGC 3628 | 2.1 0.4 | 4.8 0.5 | 54.8 5.6 | 50.6 5.1 | 52.0 5.2 | 67.8 6.8 | 29.1 2.9 | 10.8 1.1 | 3.1 0.32 |
| NGC 3627 | … | 8.6 0.9 | 66.3 6.7 | 15.2 1.5 | 22.8 2.3 | 19.0 1.9 | 7.0 0.7 | 2.5 0.3 | 0.8 0.08 |
| IRAS 18293-3413 | 3.1 0.3 | 4.0 0.4 | 35.7 3.6 | 42.8 4.3 | 55.1 5.5 | 42.6 4.3 | 15.0 1.5 | 5.6 0.6 | 1.5 0.16 |
| NGC 7469 | 4.6 0.5 | 6.0 0.6 | 27.3 2.8 | 28.9 3.1 | 32.9 3.7 | 23.3 2.8 | 8.2 1.0 | 2.9 0.4 | 0.7 0.10 |
| IRAS 17578-0400 | 0.7 0.1 | 1.1 0.2 | 27.7 3.0 | 31.4 3.3 | 34.5 3.7 | 23.3 2.6 | 8.5 1.0 | 3.0 0.4 | 0.8 0.10 |
| IC 1623 | 2.7 0.3 | 3.6 0.4 | 22.9 2.4 | 24.6 2.5 | 27.6 2.8 | 20.3 2.4 | 7.3 0.7 | 2.7 0.3 | 0.7 0.08 |
| Arp 220 | 5.3 0.5 | 8.0 0.8 | 104.1 10.5 | 132.8 13.4 | … | 83.3 8.4 | 30.6 3.1 | 10.7 1.1 | 3.7 0.39 |
| IRAS 19254-7245 | 1.1 0.1 | 1.4 0.2 | 5.2 0.6 | 5.5 0.6 | 5.8 0.6 | 4.1 0.4 | 1.5 0.2 | 0.5 0.1 | 0.1 0.02 |
Note. — Flux densities of MIPS, PACS, and SPIRE maps are extracted at the same positions as the APEX pointings. We first convolve their native angular resolutions to the same beamsize of our APEX observations and scale the map unit to Jy beam-1, by a factor of . The IRAS data are taken from Sanders et al. (2003) as flux densities of the entire galaxies.
3.2 Photometry, Infrared Luminosity, and Dust Temperature
Because our APEX observations have different beam sizes compared to that of the IR photometric data, it is not possible to directly compare dense gas tracers with IR data. Therefore, we convolve the Spitzer and Herschel maps to match the beam size of the APEX 12-m data, a 34.7′′ (diameter) Gaussian beam, using the convolution kernels provided by Aniano et al. (2011). Compared to aperture photometry, this method is more robust and is much less affected by the spatial distribution of the target (e.g., Tan et al., 2018). Details of the method were described in Tan et al. (2018).
To measure the photometric flux at each wavelength, and to estimate their associated noise levels, our photometry procedures are listed as follows: First, we subtract the background of an annulus region from 1.5 to 2 the maximum source size, which is estimated using the curve of growth (see Appendix A for details). Second, we scale the image units to Jy beam-1 by a factor of . Third, we measure the value of the central pixel to obtain the flux density at each IR band. Last, the error is estimated from the background regions. The photometric results are listed in Table 3. The flux error consists of photometric error, flux calibration error, and systematic error. We adopt an absolute flux calibration error of 7 % and a systematic error of 3 %, following Balog et al. (2014).
Since IRAS and Herschel SPIRE 500 data have lower resolutions than our APEX data, we scale the IRAS 25 , IRAS 60 , and SPIRE 500 data to obtain the beam-matched fluxes, using aperture correction factors obtained from MIPS 24 , PACS 70 , and SPIRE 350 maps, respectively. For example, we measure the flux of entire galaxy () and flux in the 34.7′′ gaussian beam of the PACS 70 (). Then we adopt as the IRAS 60 flux in the beam.
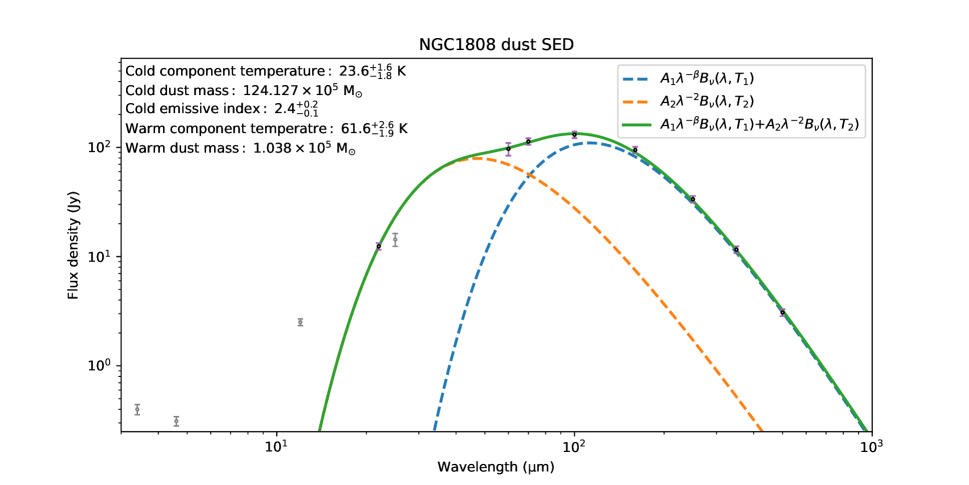
We then build dust spectral energy distribution (SED) for each galaxy and fit total IR luminosity and dust temperature. We fit the data with a two-component modified blackbody (MBB) dust model, following Galametz et al. (2013). Since the warm dust component contributes a non-negligible fraction to the 70 and 100 emission, a single MBB model would not match the Wien side of the SED and would overestimate the cold dust component. The two-component MBB model is described as follows:
| (6) |
where is the flux density obtained from photometry; is the Planck function; is the emissivity index of the cold component; and are the temperature of warm and cold components, respectively; and describe the peaks of the two components, respectively. To limit the number of free parameters, we fix , as a good approximation of dust model of Li & Draine (2001). So, the estimate of has an additional systematic error compared to .
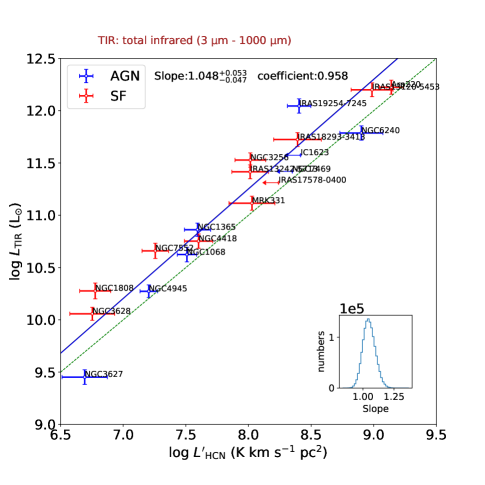
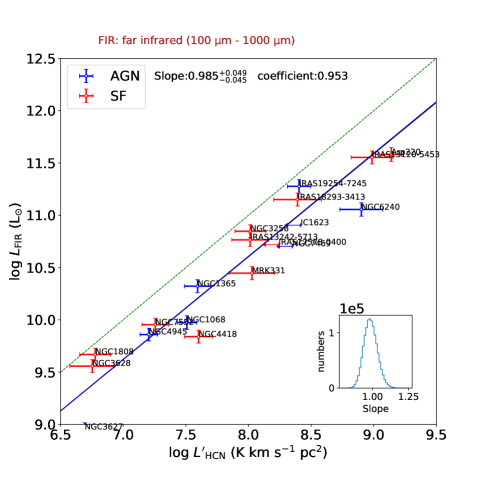
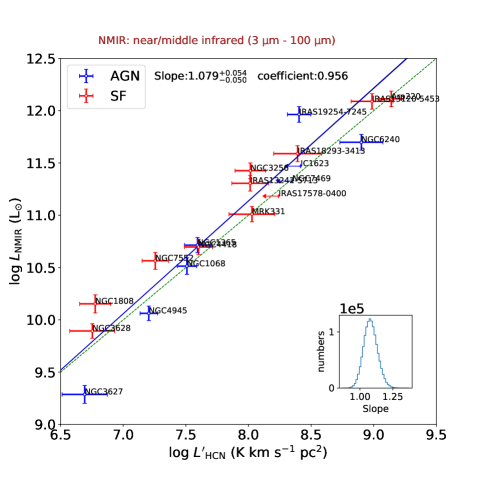
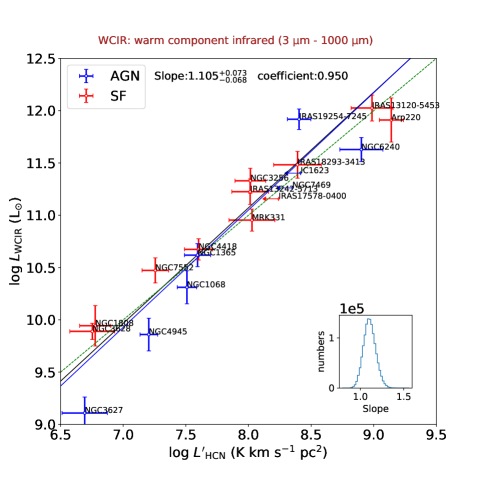
We fit the SEDs and estimate the uncertainties using the Markov Chain Monte Carlo (MCMC) package, emcee (Foreman-Mackey et al., 2013). Details of the dust SED fitting are shown in Appendix B. Parameters obtained from the SED fitting are listed in Table 4. Then we compute the total IR luminosity by integrating from 3 to 1000 , as , which is adopted as the SFR tracer. The beam-matched accounts for of from the whole galaxy provided by Sanders et al. (2003). In Appendix C, we present - correlations between Far-IR luminosity (from 100 to 1000 ), near-to-mid-IR luminosity (from 3 to 100 ) , and IR luminosity of the warm dust component.
within the 34.7′′ beam area ranges from 2.7 to 1.7. Cold dust temperature ranges from 16.9 K to 32.3 K, with an average value of 24 K. Compared with the result of the overlapped galaxies in U et al. (2012), our dust temperature is lower, possibly because of the inclusion of the Herschel/SPIRE data, which would better constrain the cold dust component. Our fitting result is consistent with Galametz et al. (2013).
3.3 Molecular gas mass and SFR estimation
In this work, we derive dense gas mass from and following Gao & Solomon (2004b):
| (7) |
where is the average density of the dense gas and is the brightness temperature of the dense gas tracer. The estimation of dense gas mass relies on both brightness temperature and density, where we adopt and for typical conditions of Galactic virialized cloud cores (Radford et al., 1991). There are few HCN and HCO+ observations in the literature (e.g., Immer et al., 2016). Therefore, we can derive an average HCN /HCN from HCN /HCN ratios with RADEX, by assuming the above physical conditions. We adopt the average HCN /HCN ratio of 0.260.10 found in Galactic dense cores (Wu et al., 2010), and the derived HCN /HCN ratio is , which is further adopted to convert from luminosity to the dense gas mass. We derive the dense gas mass traced by HCO+ with the same method, by assuming that the two lines have similar excitations. The derived dense gas mass ranges from to .
Following Tan et al. (2018), we adopt the SFR conversion calibrated by Kennicutt (1998a) and Murphy et al. (2011):
| (8) |
The SFR is calculated based on Kroupa (2001) IMF. The derived gas mass and SFR are shown in Table 4.
| Source name | |||||||||
|---|---|---|---|---|---|---|---|---|---|
| () | () | (K) | (K) | () | () | () | |||
| (1) | (2) | (3) | (4) | (5) | (6) | (7) | (8) | (9) | (10) |
| NGC 4945 | 1.7 0.4 | 1.6 0.4 | 19.0 0.8 | 23 1 | 2.4 0.2 | 49 2 | 1.8 0.4 | 1.8 0.4 | 3.5 0.4 |
| NGC 1068 | 3.2 1.6 | 2.4 1.2 | 42.3 3.1 | 28 1 | 2.1 0.1 | 74 10 | 3.4 1.8 | 2.5 1.3 | 7.3 1.1 |
| NGC 7552 | 1.8 0.5 | 2.4 0.7 | 40.0 2.3 | 23 2 | 2.5 0.2 | 62 2 | 1.9 0.6 | 2.7 0.7 | 7.9 1.2 |
| NGC 4418 | 4.0 1.3 | 2.8 1.0 | 55.2 2.7 | 30 4 | 1.8 0.2 | 62 2 | 4.3 1.3 | 3.1 1.0 | 9.6 1.4 |
| NGC 1365 | 3.8 1.9 | 2.8 1.5 | 69.7 3.3 | 22 1 | 2.3 0.2 | 58 2 | 4.2 2.1 | 3.0 1.6 | 12.2 1.7 |
| NGC 3256 | 10.4 4.6 | 19.0 8.1 | 351 18 | 25 2 | 2.4 0.2 | 62 3 | 11.2 5.1 | 20.6 8.8 | 53.3 8.1 |
| NGC 1808 | 1.1 0.6 | 1.1 0.6 | 20.7 0.8 | 23 2 | 2.5 0.2 | 61 2 | 1.2 0.6 | 1.2 0.6 | 3.5 0.5 |
| IRAS 13120-5453 | 97 36 | 87 35 | 1517 79 | 25 2 | 2.4 0.2 | 54 2 | 106 39 | 94 37 | 243.5 36.7 |
| IRAS 13242-5713 | 10.3 3.4 | 19.5 5.3 | 258 14 | 24 2 | 2.4 0.2 | 55 2 | 11.2 3.7 | 21.2 5.7 | 41.4 6.2 |
| MRK 331 | 10.7 4.6 | 11.1 | 125.0 6.5 | 23 2 | 2.5 0.2 | 59 2 | 11.6 4.9 | 11.9 | 21.3 3.1 |
| NGC 6240 | 80 30 | 107 36 | 586 35 | 25 2 | 2.3 0.2 | 60 2 | 87 32 | 117 39 | 95 15 |
| NGC 3628 | 0.6 0.2 | 0.8 0.2 | 11.7 0.5 | 17 1 | 2.8 0.2 | 51 1 | 0.6 0.3 | 0.9 0.3 | 2.2 0.3 |
| NGC 3627 | 0.7 0.3 | 0.8 | 2.7 0.1 | 23 1 | 2.4 0.1 | 57 3 | 0.7 0.3 | 0.9 | 0.7 0.1 |
| IRAS 18293-3413 | 25 10 | 42 13 | 521 25 | 23 2 | 2.4 0.2 | 58 2 | 26.7 11.3 | 46 15 | 83 12 |
| NGC 7469 | 22.4 | 17.8 6.3 | 250 16 | 23 2 | 2.4 0.2 | 63 3 | 24.3 | 19.3 6.9 | 41.8 6.4 |
| IRAS 17578-0400 | 17.4 | 14.9 | 205 10 | 23 2 | 2.4 0.2 | 48 1 | 18.8 | 16.1 | 32.8 4.8 |
| IC 1623 | 26.0 | 25 10 | 350 19 | 23 2 | 2.4 0.2 | 60 2 | 28.2 | 27.0 11.3 | 59.1 8.9 |
| Arp 220 | 138 36 | 70 19 | 1650 65 | 31 3 | 1.7 0.1 | 56 4 | 151 39 | 76 21 | 258 39 |
| IRAS 19254-7245 | 58.9 6.3 | 37.5 4.3 | 1153 97 | 22 2 | 2.6 0.2 | 64 2 | 64 15 | 40.7 9.9 | 171 27 |
Note. — Column 1: galaxy name. Column 2: HCN line luminosity. Column 3: HCO+ line luminosity. Column 4: total infrared luminosity. Column 5: cold component dust temperature. Column 6: cold component dust emissivity index. Column 7: warm component dust temperature. Column 8: dense gas mass derived from HCN . Column 9: dense gas mass derived from HCO+ . Column 10: star formation rate derived from infrared luminosity.
4 Results
4.1 Spectra
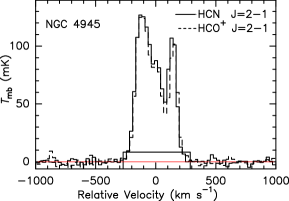
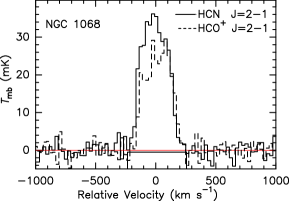
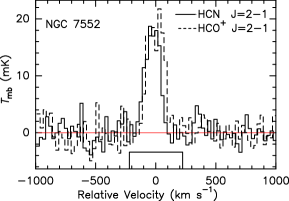
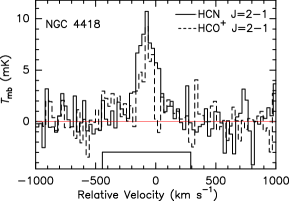
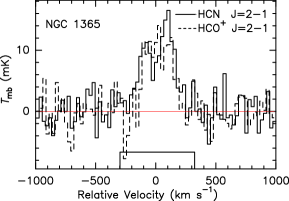
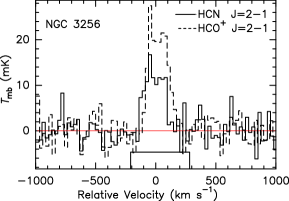
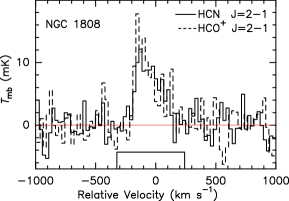
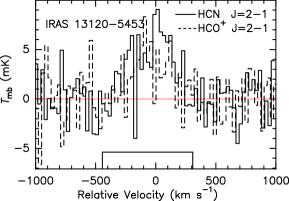
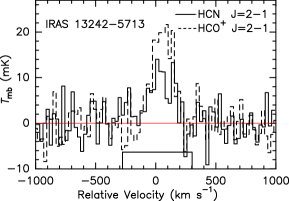
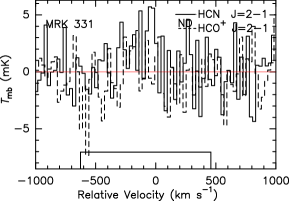
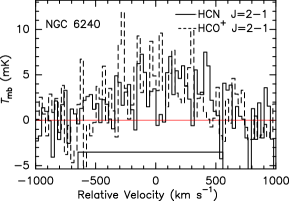
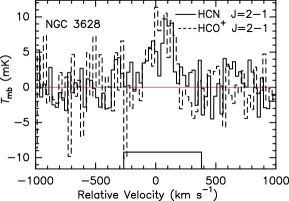
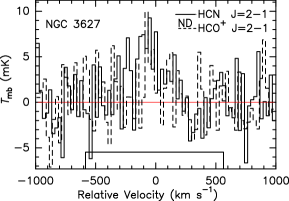
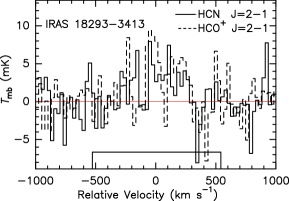
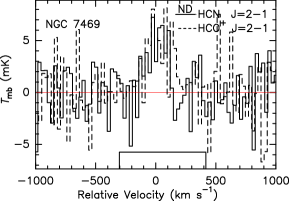
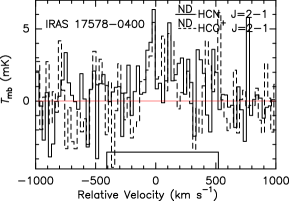
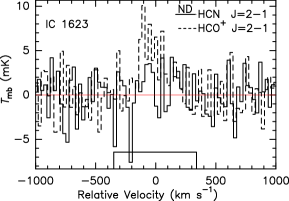
We present APEX spectra of HCN and HCO+ in Figure 1. In total, we detect 14 HCN and 14 HCO+ lines, with their velocity-integrated line intensities, . Twelve galaxies have detections of both HCN and HCO+ . IRAS 17578-0400 was not detected in either of the two lines. NGC 7469 and IC 1623 were not detected only in HCN , possibly because of their large distances. On the other hand, HCO+ is only marginally detected on 3- levels in these two galaxies. MRK 331 and NGC 3627 have non-detections of HCO+ . The velocity-integrated fluxes of all galaxies are shown in Table 2. We show 3- upper limits for those non-detected lines.
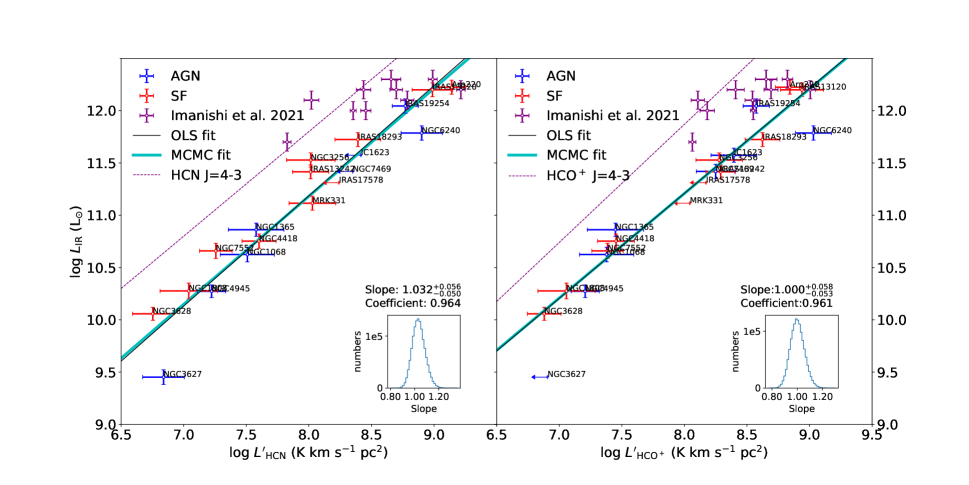
4.2 Correlation between luminosities of dense gas tracers and infrared emission
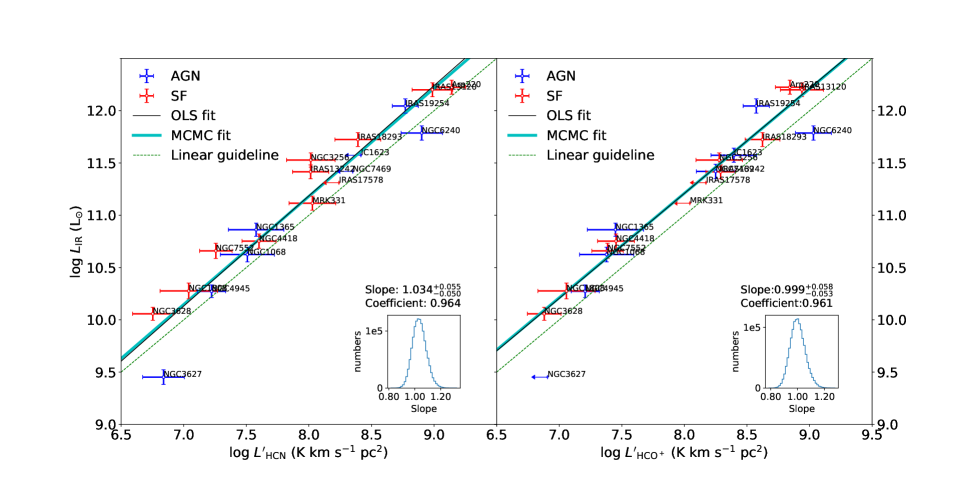
In Figure 2, we present the correlation using HCN and HCO+ line luminosities, which trace total dense gas mass. We fit linear regressions with both methods of Orthogonal Least Squares (OLS) and MCMC, to avoid possible bias from the fitting algorithm. The OLS was fitted with an IDL Astrolibrary sixlin, which adopts orthogonal distances from data points to the fit line. The code first assumes a linear slope to compute orthogonal distance, and then performs linear regression steps to compare with previous slopes, until it reaches steady state. We perform MCMC method using a Python package emcee: we first employ 64 walkers and each of them samples 5,000 steps. This would ensure that most sampling are convergent. Then we burn in them, and perform another 10,000 steps for each walker. This will offer a final sampling number of 640,000 for statistics. We adopt the range encompassing 68% of the data about the median of the posterior probability density distribution to represent approximate upper and lower 1- limits for Gaussian-like distributions. These fitted results from the two methods are shown in Figure 2, without significant difference between each other. The slope obtained from OLS fitting is within the 1- range of that from the Bayesian fitting.
We find linear correlations between with and . The Pearson correlation efficiencies, which quantifies linear correlations, are 0.96 and 0.97 with -values of and , respectively. The Spearman correlation efficiencies, which quantifies monotone correlations, are 0.98 and 0.96, with -values of and , respectively. AGN-dominated and SF-dominated galaxies are shown in blue and red points, respectively. The mcmc fitting results are listed below:
| (9) |
| (10) |
where the upper and lower errors are from probability density distributions of parameters. Non-detections are not included during fitting. We find no definite difference between AGN-dominated and SF-dominated galaxies, which essentially follow the same trend of and .
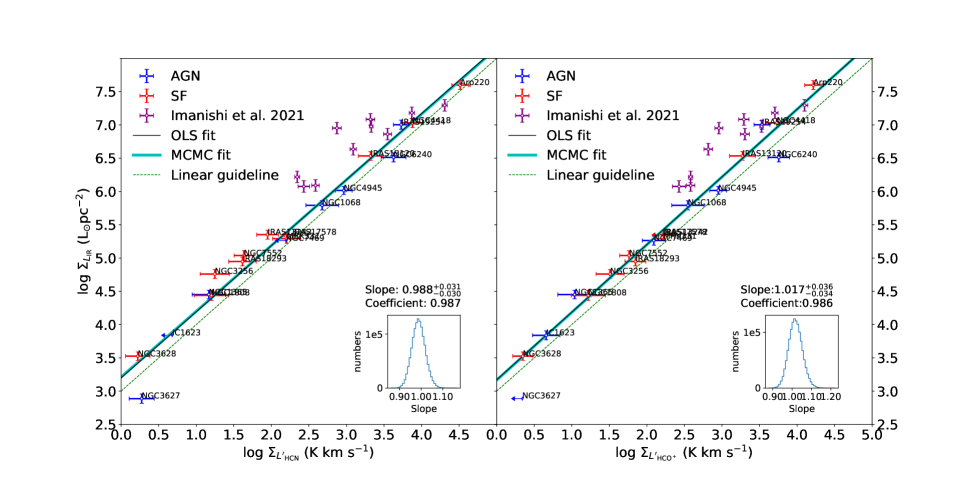
4.3 Correlations of Luminosity Surface Densities
Here we derive luminosity surface densities by adopting the area measured from the 1.4-GHz radio continuum images, which can eliminate the degeneracy introduced by the distance in luminosity correlations. The 1.4-GHz radio emission, which is contributed both by the synchrotron emission from supernova remnants and by the free-free emission from Hii regions, originates from the same star-forming regions as the IR emission (Bell, 2003). There exists rich archival radio data at high angular resolutions, which would help determine the 1.4 GHz continuum sizes (see details in section 2.4).
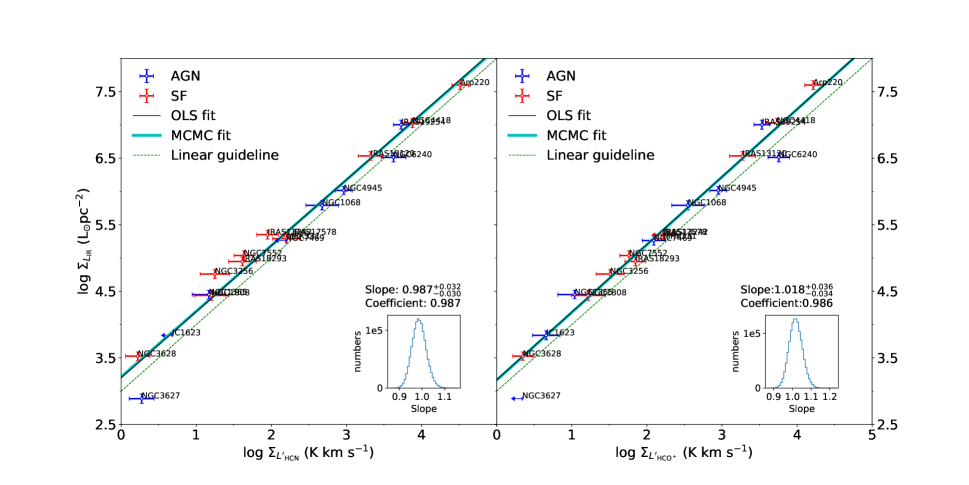
The correlations between the surface densities of IR luminosity () and dense gas tracer line luminosity () are shown in Figure 3. The MCMC fitting results are shown below:
| (11) |
| (12) |
where , is the luminosity surface density. The fitted slope indices of HCN and HCO+ are 0.99 and 1.02, respectively. Both OLS and MCMC methods give identical fitting results. The Pearson correlation efficiencies are 0.99 and 0.99 with -values of and , for HCN and HCO+ , respectively. The Spearman correlation efficiencies of these two lines are 0.99 and 0.98, with -values of and , respectively. Both correlation coefficients are higher than those obtained from the luminosity relations, showing much tighter correlations in the surface density relations.
Scatters in the surface density correlations are 0.150 and 0.113 dex for and HCO+ , respectively. These values are very close to the scatters in the luminosity correlations (0.147 and 0.113 dex). This is likely because the surface density correlations have larger dynamic ranges, and both types of correlations share the same physical origin.
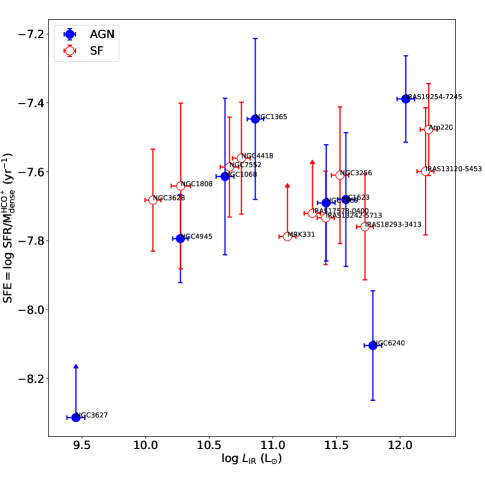
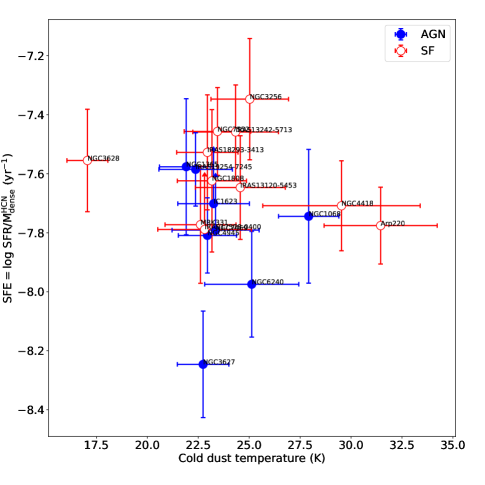
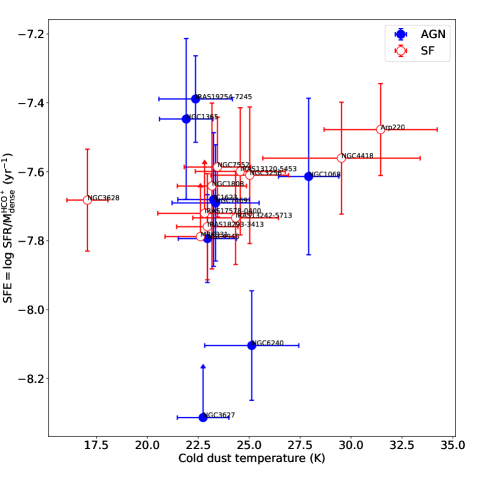
4.4 Star formation efficiency of dense molecular gas
Using HCN and HCO+ transitions in nearby star-forming galaxies, Tan et al. (2018) found that , which is a proxy of dense gas star formation efficiency (SFE), increases with within individual galaxies, but not for galaxy-integrated ratios. Furthermore, there seems to be also a correlation between and PACS 70/100 ratio (as a proxy of warm dust temperature).
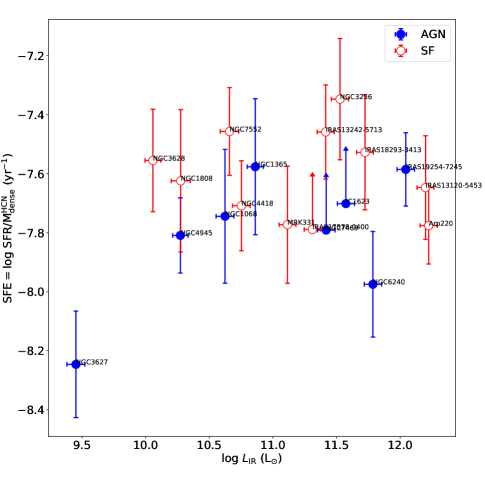
To further verify these trends, we plot SFE (derived from and ) as a function of IR luminosity In Figure 4. Our data do not show any statistical correlation in the SFE- diagram, with Spearman correlation -values of 0.99 and 0.85 for HCN and HCO+ , respectively (see Table 4), meaning that the data has a high chance to distribute randomly. These are consistent with the integrated results of Tan et al. (2018).
In general, SFE obtained from HCN and HCO+ seem to be both confined within a small range, with scatters of only 0.19 and 0.16. These small scatters are even less than that of HCN ( found in Gao & Solomon, 2004a). This indicates that the transition of HCN and HCO+ are more robust in tracing the dense gas mass in galaxies. However, the ratios have a much more diverged range of almost two orders of magnitude(Tan et al., 2018).
Unlike Tan et al. (2018), on the other hand, the SFE- diagram also does not show any correlations, with Spearman correlation -values of 0.46 and 0.91 for HCN and HCO+ , respectively. The transitions are more sensitive to the dust temperature, because they need very high density and relatively high temperature to be excited. These makes them to trace the dense gas close to young massive stars, instead of the global properties cold dense cores traced by the and transitions.
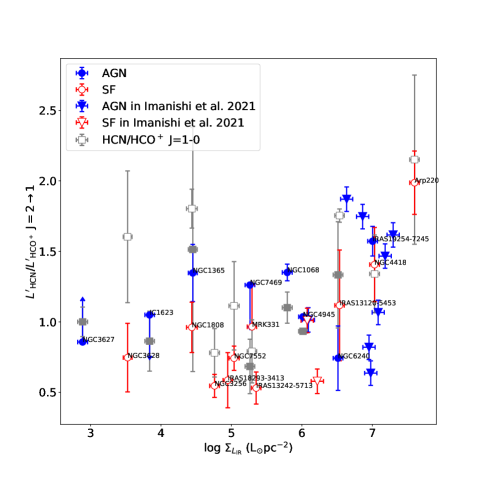
4.5 Ratios of /
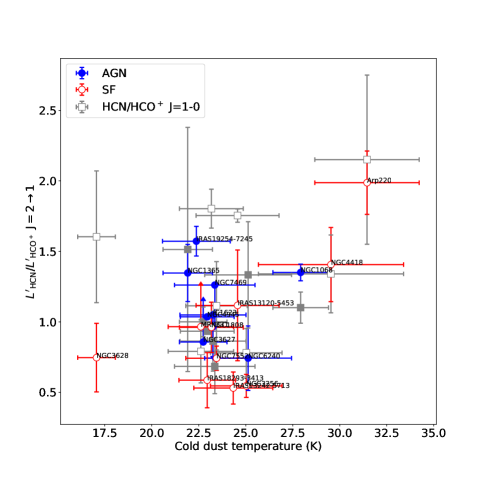
Figure 5 presents the line ratio of as a function of IR luminosity surface density and cold dust temperature. We also overlay HCN and HCO+ ratios collected from the literature (Wang et al., 2004; Baan et al., 2008; Gao & Solomon, 2004b; García-Burillo et al., 2006; Nguyen et al., 1992; Solomon et al., 1992; Krips et al., 2008). There seems no systematic difference between the ratios of both HCN/HCO+ and HCN/HCO+ . The average ratio is 1.25 0.42 and ratio is 1.05 0.42. ratio is higher, the difference is smaller than the scatter.
The ratio of may be changed by variation from astrochemistry (Imanishi et al., 2007; Lintott & Viti, 2006), molecular excitation (García-Burillo et al., 2006), radiative transfer (Knudsen et al., 2007), metallicities (Liang et al., 2006), and many other processes. Temperature and IR luminosity of dust grains would reflect the energy from young stars and their surrounding dense gas. Therefore, here we try to find possible dependence of this ratio on star formation intensity (traced by the IR luminosity surface density) and on of the cold dust temperature. We choose the temperature of the cold dust component, because 1). It comes from the bulk of the galactic dust composition, taking the majority of the dust mass (¿95%; e.g., Appendix B); 2). It is well sampled in our SED fitting (e.g., Fig. 10), and 3). It contributes the majority of the far-IR luminosity, which has an excellent correlation with the total IR luminosity (e.g., Zhu et al., 2008).
The average ratios of HCN/HCO+ are 1.150.26 and 0.980.42 for AGN-dominated galaxies and SF-dominated galaxies, respectively. Though it seems that AGN-dominated galaxies may systematically have higher HCN/HCO+ line ratios, the difference is still within 1 . There seems to also exist a weak trend between line ratio and dust temperature. But if we remove the data points of NGC 3628 and Arp 220, this trend disappears.
4.6 Dense gas fraction in galaxies
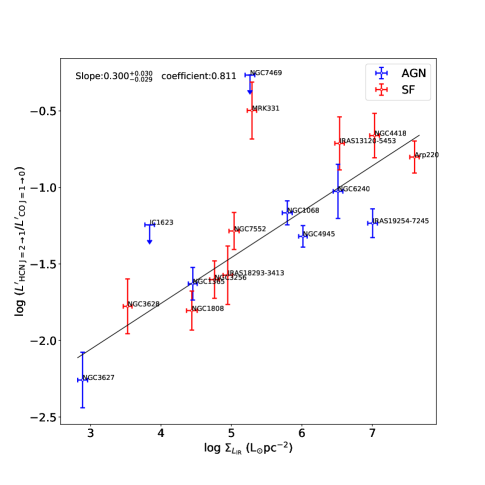
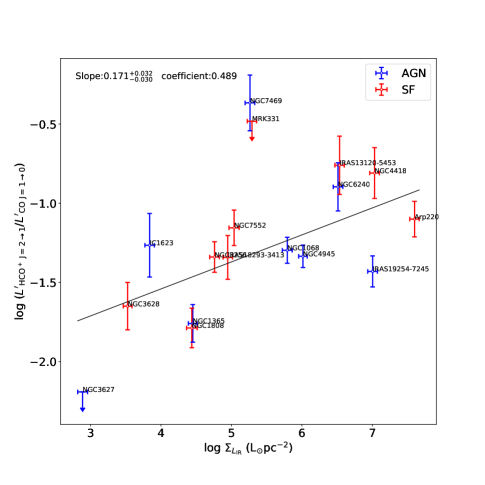
The ratios of and would roughly trace the dense gas fraction in galaxies, albeit the large uncertainties of the conversion factors both in CO and dense gas tracers. Similar to what was found in the =10 transition of HCN in Gao & Solomon (2004a), the ratios of and both show increasing trends as a function of and (Figure 6). The Pearson correlation coefficient between ratio and IR surface density is 0.81 (-value=2.4), which is higher than that of the ratio (0.49, -value=0.064), indicating that HCN/CO ratios might be more robust in tracing dense gas fractions.
These are also consistent with the positive correlations between ratio and (e.g., Juneau et al., 2009), who found a better correlation for the transition than that of indicating an increased molecular gas density in more IR-bright galaxies.
We summarize the statistics parameters of correlations and list all of them in Table 5, including MCMC fitting results, OLS fitting results, Pearson (linear relation) ordered correlation coefficient and -value, Spearman (monotonic relation) ordered correlation coefficient and -value, and scatter of diversions from the OLS fitting.
Correlations of luminosities () and luminosity surface densities () all show significant correlation (Spearman -value¡10-8). The correlations of , , and , are also statistically valid with -values 0.05 for both Pearson and Spearman rank. Those non-correlated relations show large error bars of linear fitting and large -values ( 0.05), and sometimes also show large difference between the results from MCMC and OLS.

| MCMC | OLS | Pearson | Spearman | ||||||
|---|---|---|---|---|---|---|---|---|---|
| Fitting name | slope | intercept | slope | intercept | -value | -value | scatter | ||
| (1) | (2) | (3) | (4) | (5) | (6) | (7) | (8) | (9) | (10) |
| 1.05 0.04 | 2.8 0.3 | 0.96 | 1.7 | 0.98 | 1.0 | 0.15 | |||
| 1.00 0.03 | 3.2 0.2 | 0.97 | 2.0 | 0.96 | 4.8 | 0.11 | |||
| 0.99 0.02 | 3.20 0.07 | 0.99 | 2.7 | 0.99 | 8.1 | 0.15 | |||
| 1.02 0.01 | 3.17 0.03 | 0.99 | 1.8 | 0.98 | 1.0 | 0.11 | |||
| 0.30 0.03 | -0.7 0.2 | 0.65 | 0.013 | 0.59 | 0.027 | 0.32 | |||
| 0.06 0.01 | -0.4 0.3 | 0.53 | 0.053 | 0.21 | 0.47 | 0.36 | |||
| SFR/ | 0.03 0.03 | -7.8 0.3 | 0.14 | 0.62 | -0.003 | 0.99 | 0.19 | ||
| SFR/ | -0.01 0.02 | -7.3 0.3 | -0.13 | 0.62 | -0.053 | 0.85 | 0.16 | ||
| SFR/ | -0.016 0.002 | -7.07 0.06 | -0.26 | 0.33 | -0.20 | 0.46 | 0.18 | ||
| SFR/ | 0.003 0.003 | -7.52 0.08 | 0.052 | 0.85 | -0.029 | 0.91 | 0.16 | ||
| SFR/ | 0.003 0.002 | -7.63 0.14 | 0.050 | 0.85 | 0.091 | 0.74 | 0.19 | ||
| SFR/ | 0.006 0.002 | -7.79 0.08 | 0.17 | 0.53 | 0.35 | 0.18 | 0.16 | ||
| 0.29 0.02 | -2.89 0.09 | 0.81 | 2.4 | 0.84 | 8.0 | 0.27 | |||
| 0.13 0.02 | -2.0 0.1 | 0.49 | 0.064 | 0.58 | 0.023 | 0.33 | |||
| 1.010 0.006 | 3.11 0.05 | 0.997 | 4.2 | 0.97 | 2.3 | 0.17 | |||
| 1.081 0.005 | 2.57 0.04 | 0.997 | 1.2 | 0.95 | 3.6 | 0.20 | |||
| 0.993 0.008 | 3.19 0.02 | 0.99 | 1.4 | 0.99 | 7.1 | 0.16 | |||
| 1.101 0.009 | 2.92 0.02 | 0.99 | 1.0 | 0.97 | 2.6 | 0.20 | |||
| 3.5 0.6 | 6 3 | 0.67 | 0.002 | 0.55 | 0.015 | 0.87 | |||
| 25 50 | -75 260 | 0.13 | 0.58 | 0.091 | 0.71 | 1.20 | |||
Note. — Column 1: fitting name. Column 2: slope fitted with Markov Chain Monte Carlo (MCMC). Column 3: intercept fitted with MCMC. Column 4: slope fitted with Orthogonal Least Squares (OLS). Column 5: intercept fitted with OLS. Column 6: Pearson rank-order correlation coefficient. Column 7: Pearson rank-order -value. Column 8: Spearman rank-order correlation coefficient. Column 9: Spearman rank-order -value. Column 10: scatter of diversion from the fitting.
∗ The fitting includes molecular clouds in LMC and SMC.
5 Discussion
We adopt the total IR luminosity (integrated from 3 to 1000 ) as the SFR tracer of galaxies. has been widely used as SFR tracer, while it still has some limitations. AGN may contribute to mid-infrared emission by their hot dusty tori (Padovani et al., 2017) and thus may overestimate SFR in strong AGN-dominated galaxies. On the other hand, traces SFR on relatively long timescales up to 200 Myr (Kennicutt & Evans, 2012) and it may overestimate significantly the instantaneous SFR of recent-quenched galaxies (Hayward et al., 2014). When converting from gas luminosity to dense gas mass, we assume that all molecular lines are collisionally excited. However, IR-pumping mechanism may also contribute to the line excitation and could largely enhance HCN and HCO+ emission. If the observed HCN and HCO+ fluxes are dominated by IR-pumping, the dense gas mass would be overestimated. Furthermore, variation in the stellar initial mass function (IMF) between different galaxies would also bias the SFR calculation from (e.g., Jeřábková et al., 2017; Zhang et al., 2018).
The sizes of star-forming regions may be biased by the compact radio emission contributed by AGN. Therefore, we collect VLBI high-resolution data from the literature (Lenc & Tingay, 2009; Roy et al., 1998; Varenius et al., 2014; Smith et al., 1998; Gallimore & Beswick, 2004; Cole et al., 1998; Deller & Middelberg, 2014; Lonsdale et al., 2003) and determine if our measured sizes are severely biased by AGN (see Table 2). For most galaxies, the central compact sources only contribute 10% of the total radio fluxes. Among all targets, NGC 7469 has the highest AGN contribution, which is 18%. For the rest of the sample, most of them are classified as star-formation dominated galaxies so AGN could not contribute much radio emission. For IRAS 19254-7245 and NGC 6240, we adopt ALMA 250 GHz and 480 GHz continuum to estimate star-forming region sizes, respectively.
5.1 Star formation relation for dense gas tracers
Our results show that SFR follows tight linear correlations with dense gas mass traced by both HCN and HCO+ , with Slopes of 1.03 0.05 and 1.00 0.06, Pearson coefficients of 0.96 and 0.97, and dispersions of 0.15 and 0.11 dex, respectively (see Figure 2). The star formation efficiencies are roughly constant (Pearson coefficients: 0.14 and -0.13) against SFR, with scatters of 0.19 dex and 0.16 dex (see Figure 4) for HCN and HCO+ , respectively. These suggest that dense gas clouds are direct sources of star formation, while HCN and HCO+ can be good tracers of dense molecular gas. On the other hand, we find no systematic variation between the slopes derived from the (1.030.05) and (1.000.05) transitions.
NGC 6240 and NGC 3627 are two outliers deviated from the relationship of IR and dense gas tracer luminosity. This makes their dense-gas star formation efficiencies, which are traced by infrared to dense gas luminosity ratio, about three times lower than the average value of other galaxies. This may indicate that star formation efficiency of these dense gas is suppressed, or the dense gas tracer emission is enhanced by the extra heating mechanisms for the same star-forming activity. NGC 6240 is a starburst galaxy in final merger stage (Tacconi et al., 1999; Iono et al., 2007; Papadopoulos et al., 2014; Kollatschny et al., 2020). The enormous shock condition across NGC 6240, shown both in the enhanced high- CO lines and in large scale shocked gas distribution (Meijerink et al., 2013; Cicone et al., 2018; Lu et al., 2015), could contribute mechanical heating to the dense gas, along with cosmic-ray and far-ultraviolet (FUV) radiation from photon-dominated regions (Papadopoulos et al., 2014). These extreme conditions in NGC 6240 may also enhance the HCN and HCO+ emission. Our observation of NGC 3627 is consistent with Murphy et al. (2015), who found that star formation efficiency in the nuclear region of NGC 3627 is several times lower than that in off-nuclear star-forming region. This could explain why NGC 3627 also shows offsets from both HCN and HCO+ correlations.
5.2 Connecting to star-forming clouds on small scales
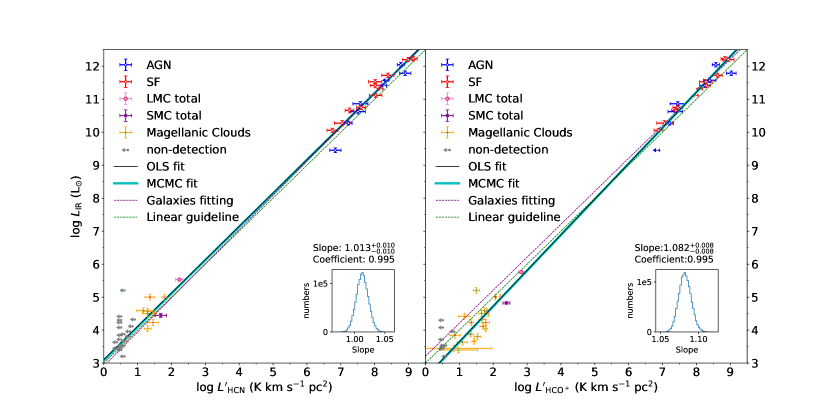
The correlations obtained on large scales may have contamination from non-star-forming activities such as shock-enhanced line emission, diffuse gas component, etc. Therefore, it is necessary to check if the correlations can be extended to pc scales that only contains star-forming dense molecular cores. Unfortunately, it is difficult to find systematic observations of the transition towards our Milky Way, while such observations do exist towards the Magellanic Clouds. Therefore, we compare the galaxy survey with the Magellanic Clouds data from Galametz et al. (2020), who presented HCN and HCO+ observations towards 30 LMC and SMC molecular clouds using APEX.
As shown in Figure 7, after including molecular clouds of the Magellanic Clouds into our galaxy sample, the correlations between – and – still hold with semi-linear slopes of 1.021 and 1.088, respectively. The upper limits of non-detections seem off the correlation, possibly due to different detection criteria in Galametz et al. (2020), who consider a 3- peak Gaussian fitting (instead of integrated flux) as the detection threshold. We also include data of Magellanic Clouds into the correlations of surface densities, by adopting the area from (e.g., Wong et al., 2011; Muller et al., 2010). The obtained slopes are 1.00 and 1.10 for – and –, respectively. Both HCN and HCO+ data averaged (summed) across the Magellanic Clouds are shown in Figure 7 as individual data points, which seem to also follow the correlations of – (–) and – (–) found in galaxies.
On the other hand, we also simply overlay the Magellanic Clouds data with our fitted galaxy-only correlations. The HCN data from Magellanic Clouds well match with the correlation fitted in the galaxy-only sample, while the HCO+ data from Magellanic Clouds systematically lay below the fitted lines from galaxies, indicating a systematic HCN/HCO+ ratio variation possibly due to different metallicities.
5.3 ratio and its origins
The average of HCN-to-HCO+ flux ratio of our sample is 1.150.26 and 0.980.42 for AGN-hosting and SF-dominated galaxies, respectively. Though it seems that the AGN-hosting galaxies may have relatively higher ratios than SF-dominated galaxies, the difference is still within 1 . So, we could not use this ratio to separate populations with AGNs. Our result of is consistent with that found in the lines (Privon et al., 2015; Li et al., 2020a).
Kohno et al. (2001) suggested that enhanced HCN emission originate from X-ray dominated region and can be used to search for pure AGNs, which is also supported by Imanishi et al. (2004, 2007). Imanishi et al. (2022) found significantly higher HCN-to-HCO+ flux ratios in a high fraction of, but not all, AGN-important ULIRGs than that in starburst-classified sources. Some starburst-dominated galaxies may have HCN enhancement, which seems not driven by a single process. We include their flux ratios (Figure 5). The ALMA-ULIRG sample(Imanishi et al., 2022) has extreme contribution from AGNs, as discussed in last paragraph of Section 5.5. In such conditions, the HCN/HCO+ line ratios might be enhanced by the chemistry from X-ray dominated regions (Kohno et al., 2001; Harada et al., 2015).
The average HCN-to-HCO+ flux ratio in Magellanic Clouds is 0.490.34, which seems to be systematically lower than the ratios found in galaxies. This is consistent with Braine et al. (2017), who also found that HCN/HCO+ is lower in low-metallicity environment.
In both the Milky Way and external galaxies, the [N/O] abundance ratio has a positive correlation with [O/H] and [Fe/H], because nitrogen mostly originates from low-mass stars and its nuclear production is a long-time process(Pilyugin et al., 2003; Liang et al., 2006). Therefore, the HCN/HCO+ abundance ratio would also decrease with [N/O] in low metallicity environments such as the Magellanic Clouds, compared to normal metal-rich star-forming galaxies.
5.4 Influence of infrared pumping
Vibrational transitions of HCN and HCO+ are difficult to be excited by collision, but they can be excited by absorbing infrared photons at 13 – 14 , through infrared pumping (Imanishi et al., 2017). Then the vibrational transitions can cascade to rotational transitions and enhance HCN and/or HCO+ lines. If infrared pumping becomes a dominant process, the dense gas mass estimated from HCN and/or HCO+ would be over-estimated.
Sakamoto et al. (2010, 2021) found strong detections of HCN v2=1 , in NGC 4418 and Arp 220 by ALMA observation, indicating somewhat impact on the HCN rotational line. All of our spectra do not show any detections of HCN v2=1 including NGC 4418 and Arp 220, possibly due to limited S/N of APEX observation. Both NGC 4418 and Arp 220 show elevated ratio, especially among SF-dominated galaxies (see Figure 5), indicating possible influence of IR pumping. NGC 4418 and Arp 220 are the most heavily influenced galaxies by infrared pumping in our sample. However, both NGC 4418 and Arp 220 do not show outliers in correlations of - and -, indicating limited enhancement towards HCN . Therefore, we do not expect a significant influence by IR pumping in our sample.
5.5 Comparison with other HCN and HCO+ work
Imanishi et al. (2022) reported ALMA observations of HCN and HCO+ towards ten ULIRGs, most of which contain AGNs. They also found positive correlations of - and -.
We obtained the data (Project code: 2017.1.00022.S and 2017.1.00023.S) from the ALMA archive, and processed HCN and HCO+ datacubes with the standard pipeline. Overall we got roughly consistent results compared to those in Imanishi et al. (2022). We then adopted the size estimated from dust continuum given by Imanishi et al. (2022). Details of the measured fluxes and sizes are shown in Appendix D and Table 6.
In Figure 8, we overplot the ALMA-ULIRG data on the HCN and HCO+ correlations. The ALMA-ULIRG data seem to be systemically above both correlations of and . For our APEX data, the orthogonal scatters on the correlation lines are and dex for and , respectively. And the mean orthogonal offset of the ALMA-ULIRG galaxies are and dex for and , respectively. Only two and one ALMA-ULIRG galaxies lie in the 1- range of our and correlation, respectively. Two and three galaxies of ALMA-ULIRGs are off by from the correlation lines of and , respectively.
This offset is consistent with that found by Imanishi et al. (2022), who found that the ALMA-ULIRG data follow relation given in Tan et al. (2018). Imanishi et al. (2022) interpret that both HCN and HCO+are thermalised, which would bring the and line luminosities comparable to those of transitions. From our APEX data, the fitted linear lines are systematically lower than those obtained from the data from Tan et al. (2018), making the ALMA-ULIRGs above the relations.
Considering most of ALMA-ULIRGs are AGN-important ULIRGs, their might be dominated by AGNs, similar to the hot dust-obscured galaxies (hot-DOGs) found with WISE mid-IR surveys (Wu et al., 2012; Tsai et al., 2015). The IR emission of hot-DOGs is mainly from the hot dust heated up by AGNs, which on average contribute of the bolometric luminosity (Fan et al., 2016). On the other hand, the hot-DOGs also have high dust temperature (), which seems to be the same for the ALMA-ULIRGs. The IRAS ratio of the ALMA-ULIRGs are all higher than those of the APEX galaxies, except for NGC 4418, with average ratios of 1.090.28 and 0.770.19 for the ALMA-ULIRGs and our APEX sample, respectively. Therefore, we suspect that the ALMA-ULIRGs are AGN-dominated, IR-overluminous galaxies, and they should behave similarly for the lines of both HCN and HCO+. Missing flux of ALMA observation may also help to explain in a few targets (details see Appendix D).
6 Summary
We present APEX observation towards HCN and HCO+ in 17 nearby infrared-bright star-forming galaxies. Combining HCN and HCO+ data in the literature, and with the total IR luminosity fitted from dust SED, we correlations slopes of and 1.00 for and , respectively.
To obtain correlations of surface densities, which could eliminate the biases from uncertain distances, we use the size of 1.4 GHz radio continuum to normalise the luminosities of both IR emission () and dense gas tracers ( and ). These surface density correlations also show linear slopes of and , for HCN and HCO lines, respectively. The slope errors and -values of the surface-density correlations are also smaller than those of the luminosity correlations. The Spearman correlation coefficients of the lines (0.98 and 0.96 for HCN and HCO+ ) are higher than those obtained from the (0.94 for HCN ; Gao & Solomon, 2004a) and the (0.89 and 0.84 for HCN and HCO+ ; Tan et al., 2018) transitions, indicating the advantage of the transitions of HCN and HCO+ in tracing the star-forming gas.
Comparing with the HCN and HCO+ data from star-forming clouds of the Magellanic Clouds (Galametz et al., 2020), we find that the low-metallicity environment not only slightly deviates the data from the overall surface-density correlations, but also would bias the HCN /HCO+ line ratio to low ratios. This is consistent with previous findings in low-metallicity galaxies (e.g., Braine et al., 2017). The systematically lower HCN/HCO+ ratios are possibly owing to the variation of [N/O] elemental abundance variation in low-metallicity environments.
On the other hand, when comparing with the ULIRGs sample from Imanishi et al. (2022), those AGN-important galaxies lay systematically above both correlations of - and - found in our APEX sample. This is likely due to the AGN contribution to the total IR luminosity for such compact objects, which could heavily overestimate SFRs. Therefore, the contribution from AGNs may not be negligible in such extreme conditions.
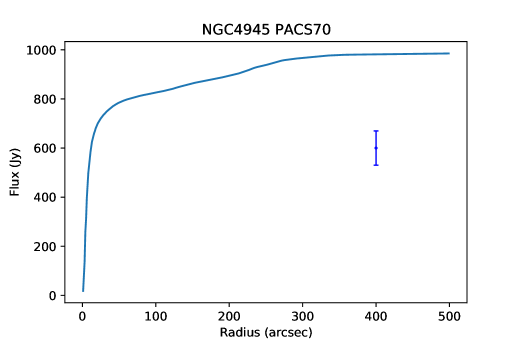
Appendix A Background subtraction
When measuring the infrared flux of each galaxy, we need to subtract the background to avoid possible contamination from other nearby sources and compute the error from root mean square error of infrared image. First, we remove strong sources higher than using python package photutils444https://pypi.org/project/photutils/0.4/. Then we take the initial flat field subtraction using average flux of selected background area. We compute the total flux in a small circle and increase the radius of the circle until the flux in the circle do not increase. To show the size which can cover total flux of the galaxy, we plot the flux vary with the circle radius in Figure 9. Finally we choose the annulus within and this radius as the background.
Appendix B Two-component dust SED fitting
We download eleven bands infrared data observed by SPITZER and HERSCHEL from 3.4 to 500 . We convolve them to same resolution and then do the photometry. We try SED fitting with different bands data, and we find that short wavelength bands (¡ 12 ) could suffer from contamination of stars or PAH emission, and they are higher than that modified-blackbody expect. We also put IRAS low resolution () flux for comparison, for most cases they include total fluxes of the whole galaxies. We compute the scaling factor from MIPS 24 and PACS 70 data. We include 60 and exclude 25 data points . One example of dust SED fitting is shown in Figure 10.
Appendix C Different infrared bands as SFR tracer
To infer infrared band could better trace star-formation rate, we compare total infrared (3-1000 ), far infrared (100-1000 ), near/middle infrared (3-100 ) and warm component luminosity versus dense gas luminosity. We fit the relationship with MCMC and Least Square method to get the slope and compute the coefficient with python package . We show the comparison plots in Figure 11. We find that near/middle infrared contribute most of total infrared luminosity and 3 times higher than far infrared luminosity. However, far infrared luminosity is a little more stable than near/middle infrared according to their slopes using different SED fitting methods with different infrared bands. We finally choose total infrared luminosity to trace star formation rate.
Appendix D Re-measure ALMA and flux
We reprocessed and data reported in Imanishi et al. (2022). For IRAS 12127-1412, IRAS 13509+0442, and Superantennae, there is no available and imaging products. So we downloaded their data and reprocessed with the pipeline and re-imaged with ′′robust=1.5′′ with task tclean. For others, we adopted the delivered data products. We re-measured line fluxes of and in all targets with the aperture size determined by curve of flux growth (described in Appendix A) of moment 0 map of initial estimated and . The re-measured line fluxes are shown in Table 6. The fluxes of NGC 1614, IRAS 13509+0442 and IRAS 22491-1808 are significantly higher than that reported in Imanishi et al. (2022) (¿80%) and fluxes of three other galaxies are higher.
Missing flux of large scale structures during the interferometric observations may also play a role in biasing the sample distributions, along with AGN bolometric contribution. For example, NGC 1614 has been observed with CO and 13CO (König et al., 2016), which all show a gaseous disk of in diameter. The ALMA HCN observations only revealed the central emitting region of in diameter, which may indicate potentially extended fluxes filtered by ALMA. While IRAS 12112+0305 has been resolved into two nuclei, Evans et al. (2002) imaged its CO distribution and shown extended emission around the nuclei.
ALMA’s shortest baseline is , corresponding to largest scale of 30′′. However, in the data of IRAS 12127-1412, IRAS 13509+0442, and Superantennae, most shortest baselines are flagged possibly due to antenna shadowing. Thus, the largest recovered scale is 12′′, similar to scales of NGC 1614 and IRAS 12112+0305. However it is difficult to evaluate how much would be the missing flux without single dish observations.
| Source name | Redshift | Distance | HPBWdust | |||
|---|---|---|---|---|---|---|
| (Mpc) | () | () | (10-3arcsec) | () | ||
| (1) | (2) | (3) | (4) | (5) | (6) | (7) |
| NGC1614 | 0.0160 | 68 | 11.56 0.29 | 19.99 0.31 | 1710 1630 | 11.7 |
| IRAS06035-7102 | 0.0795 | 356 | 3.77 0.25 | 3.72 0.29 | 705 613 | 12.2 |
| IRAS08572+3915 | 0.0580 | 256 | 1.44 0.12 | 1.76 0.13 | 318 287 | 12.1 |
| IRAS12112+0305 | 0.0730 | 326 | 8.63 0.27 | 5.89 0.28 | 283 186 | 12.3 |
| IRAS12127-1412 | 0.1332 | 620 | 0.79 0.07 | 0.74 0.08 | 151 96 | 12.2 |
| IRAS13509+0442 | 0.1364 | 636 | 1.25 0.16 | 1.24 0.19 | 481 367 | 12.3 |
| IRAS15250+3609 | 0.0552 | 243 | 4.31 0.19 | 2.31 0.19 | 445 375 | 12 |
| Superantennae | 0.0617 | 273 | 7.47 0.54 | 4.27 0.38 | 348 284 | 12.1 |
| IRAS20551-4250 | 0.0430 | 188 | 5.51 0.03 | 8.67 0.03 | 367 346 | 12 |
| IRAS22491-1808 | 0.0776 | 347 | 12.9 0.36 | 8.00 0.39 | 217 131 | 12.2 |
Note. — Column 1: galaxy name. Column 2: Redshifts from Imanishi et al. (2022). Column 3: Luminosity distance from Imanishi et al. (2022). Column 4: HCN line flux we measured. Column 5: HCO+ line fluxed we measured. Column 6: galaxy sizes: Half Power Beam Width (HPBW) of 178 dust continuum from Imanishi et al. (2022). Column 7: logarithmic value of infrared luminosity inferred from IRAS observation (Imanishi et al., 2022)
Appendix E Dust temperature in AGN-host and SF-dominated galaxies.
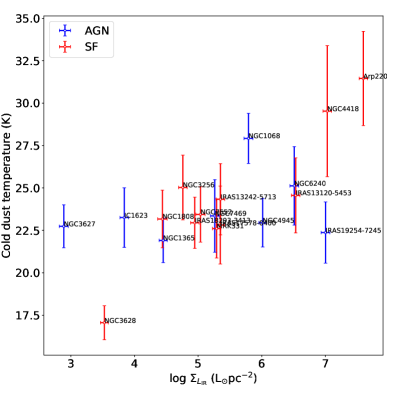
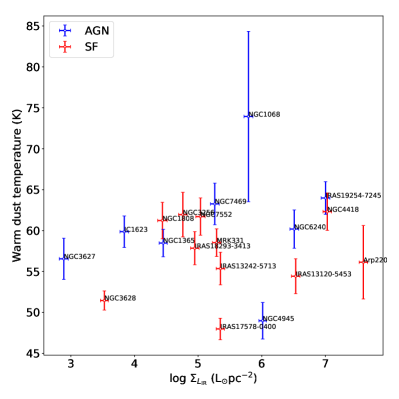
Infrared luminosity of ULIRGs in Imanishi et al. (2022) may be enhanced by AGN-heated hot dust (Section 5.5). Here we check if the dust temperature of galaxies in our sample are influenced by AGN activities, by plotting dust temperature versus infrared luminosity surface density in different galaxy types ( see Figure 12). Dust temperature are obtained under assumption of a modified blackbody with a fixed warm component emissivity index of 2. Figure 12 shows results of the infrared luminosity surface density and the cold dust temperature fitted with these assumptions in the left panel. The right panel of Figure 12 shows infrared luminosity surface density versus warm dust temperature. The caption mentions and equals to cold and warm dust temperature, respectively. There is no significant relation between dust temperature and galaxy type or .
References
- Aniano et al. (2011) Aniano, G., Draine, B. T., Gordon, K. D., & Sandstrom, K. 2011, Publications of the Astronomical Society of the Pacific, 123, 1218, doi: 10.1086/662219
- Baan et al. (2008) Baan, W. A., Henkel, C., Loenen, A. F., Baudry, A., & Wiklind, T. 2008, A&A, 477, 747, doi: 10.1051/0004-6361:20077203
- Balog et al. (2014) Balog, Z., Müller, T., Nielbock, M., et al. 2014, Experimental Astronomy, 37, 129, doi: 10.1007/s10686-013-9352-3
- Belitsky et al. (2018) Belitsky, V., Lapkin, I., Fredrixon, M., et al. 2018, A&A, 612, A23, doi: 10.1051/0004-6361/201731458
- Bell (2003) Bell, E. F. 2003, ApJ, 586, 794, doi: 10.1086/367829
- Bigiel et al. (2008) Bigiel, F., Leroy, A., Walter, F., et al. 2008, AJ, 136, 2846, doi: 10.1088/0004-6256/136/6/2846
- Bolatto et al. (2013) Bolatto, A. D., Wolfire, M., & Leroy, A. K. 2013, ARA&A, 51, 207, doi: 10.1146/annurev-astro-082812-140944
- Bradley et al. (2019) Bradley, L., Sipocz, B., Robitaille, T., et al. 2019, astropy/photutils: v0.6, v0.6, Zenodo, doi: 10.5281/zenodo.2533376
- Braine et al. (2017) Braine, J., Shimajiri, Y., André, P., et al. 2017, A&A, 597, A44, doi: 10.1051/0004-6361/201629781
- Cicone et al. (2018) Cicone, C., Severgnini, P., Papadopoulos, P. P., et al. 2018, ApJ, 863, 143, doi: 10.3847/1538-4357/aad32a
- Cole et al. (1998) Cole, G. H. J., Mundell, C. G., & Pedlar, A. 1998, MNRAS, 300, 656, doi: 10.1046/j.1365-8711.1998.01870.x
- Condon (1987) Condon, J. J. 1987, ApJS, 65, 485, doi: 10.1086/191234
- Condon et al. (2021) Condon, J. J., Cotton, W. D., Jarrett, T., et al. 2021, arXiv e-prints, arXiv:2108.07891. https://arxiv.org/abs/2108.07891
- Condon & Ransom (2016) Condon, J. J., & Ransom, S. M. 2016, Essential Radio Astronomy
- Costagliola et al. (2013) Costagliola, F., Aalto, S., Sakamoto, K., et al. 2013, A&A, 556, A66, doi: 10.1051/0004-6361/201220634
- de Vaucouleurs et al. (1991) de Vaucouleurs, G., de Vaucouleurs, A., Corwin, Herold G., J., et al. 1991, Third Reference Catalogue of Bright Galaxies
- Deller & Middelberg (2014) Deller, A. T., & Middelberg, E. 2014, AJ, 147, 14, doi: 10.1088/0004-6256/147/1/14
- Evans et al. (2002) Evans, A. S., Mazzarella, J. M., Surace, J. A., & Sanders, D. B. 2002, ApJ, 580, 749, doi: 10.1086/343867
- Evans et al. (2020) Evans, Neal J., I., Kim, K.-T., Wu, J., et al. 2020, ApJ, 894, 103, doi: 10.3847/1538-4357/ab8938
- Fan et al. (2016) Fan, L., Han, Y., Nikutta, R., Drouart, G., & Knudsen, K. K. 2016, ApJ, 823, 107, doi: 10.3847/0004-637X/823/2/107
- Fixsen et al. (1996) Fixsen, D. J., Cheng, E. S., Gales, J. M., et al. 1996, ApJ, 473, 576, doi: 10.1086/178173
- Foreman-Mackey et al. (2013) Foreman-Mackey, D., Hogg, D. W., Lang, D., & Goodman, J. 2013, PASP, 125, 306, doi: 10.1086/670067
- Galametz et al. (2013) Galametz, M., Kennicutt, R. C., Calzetti, D., et al. 2013, Monthly Notices of the Royal Astronomical Society, 431, 1956, doi: 10.1093/mnras/stt313
- Galametz et al. (2016) Galametz, M., Zhang, Z. Y., Immer, K., et al. 2016, MNRAS, 462, L36, doi: 10.1093/mnrasl/slw122
- Galametz et al. (2020) Galametz, M., Schruba, A., De Breuck, C., et al. 2020, A&A, 643, A63, doi: 10.1051/0004-6361/202038641
- Gallimore & Beswick (2004) Gallimore, J. F., & Beswick, R. 2004, AJ, 127, 239, doi: 10.1086/379959
- Gao & Solomon (2004a) Gao, Y., & Solomon, P. M. 2004a, ApJ, 606, 271, doi: 10.1086/382999
- Gao & Solomon (2004b) —. 2004b, ApJS, 152, 63, doi: 10.1086/383003
- García-Burillo et al. (2006) García-Burillo, S., Graciá-Carpio, J., Guélin, M., et al. 2006, ApJ, 645, L17, doi: 10.1086/506204
- Greve et al. (2009) Greve, T. R., Papadopoulos, P. P., Gao, Y., & Radford, S. J. E. 2009, ApJ, 692, 1432, doi: 10.1088/0004-637X/692/2/1432
- Griffin et al. (2010) Griffin, M. J., Abergel, A., Abreu, A., et al. 2010, A&A, 518, L3, doi: 10.1051/0004-6361/201014519
- Harada et al. (2015) Harada, N., Riquelme, D., Viti, S., et al. 2015, A&A, 584, A102, doi: 10.1051/0004-6361/201526994
- Harris et al. (2020) Harris, C. R., Millman, K. J., van der Walt, S. J., et al. 2020, Nature, 585, 357, doi: 10.1038/s41586-020-2649-2
- Hayward et al. (2014) Hayward, C. C., Lanz, L., Ashby, M. L. N., et al. 2014, MNRAS, 445, 1598, doi: 10.1093/mnras/stu1843
- Heiderman et al. (2010) Heiderman, A., Evans, Neal J., I., Allen, L. E., Huard, T., & Heyer, M. 2010, ApJ, 723, 1019, doi: 10.1088/0004-637X/723/2/1019
- Herrero-Illana et al. (2017) Herrero-Illana, R., Pérez-Torres, M. Á., Randriamanakoto, Z., et al. 2017, MNRAS, 471, 1634, doi: 10.1093/mnras/stx1672
- Imanishi et al. (2016) Imanishi, M., Nakanishi, K., & Izumi, T. 2016, AJ, 152, 218, doi: 10.3847/0004-6256/152/6/218
- Imanishi et al. (2017) —. 2017, ApJ, 849, 29, doi: 10.3847/1538-4357/aa7ff9
- Imanishi et al. (2022) Imanishi, M., Nakanishi, K., Izumi, T., & Baba, S. 2022, ApJ, 926, 159, doi: 10.3847/1538-4357/ac3a68
- Imanishi et al. (2004) Imanishi, M., Nakanishi, K., Kuno, N., & Kohno, K. 2004, AJ, 128, 2037, doi: 10.1086/424620
- Imanishi et al. (2007) Imanishi, M., Nakanishi, K., Tamura, Y., Oi, N., & Kohno, K. 2007, AJ, 134, 2366, doi: 10.1086/523598
- Immer et al. (2016) Immer, K., Belitsky, V., Olberg, M., et al. 2016, The Messenger, 165, 13
- Iono et al. (2007) Iono, D., Wilson, C. D., Takakuwa, S., et al. 2007, ApJ, 659, 283, doi: 10.1086/512362
- Jang & Lee (2017) Jang, I. S., & Lee, M. G. 2017, ApJ, 836, 74, doi: 10.3847/1538-4357/836/1/74
- Jeřábková et al. (2017) Jeřábková, T., Kroupa, P., Dabringhausen, J., Hilker, M., & Bekki, K. 2017, A&A, 608, A53, doi: 10.1051/0004-6361/201731240
- Juneau et al. (2009) Juneau, S., Narayanan, D. T., Moustakas, J., et al. 2009, ApJ, 707, 1217, doi: 10.1088/0004-637X/707/2/1217
- Karachentsev & Makarov (1996) Karachentsev, I. D., & Makarov, D. A. 1996, AJ, 111, 794, doi: 10.1086/117825
- Kennicutt (1998a) Kennicutt, Robert C., J. 1998a, ARA&A, 36, 189, doi: 10.1146/annurev.astro.36.1.189
- Kennicutt (1998b) —. 1998b, ApJ, 498, 541, doi: 10.1086/305588
- Kennicutt & Evans (2012) Kennicutt, R. C., & Evans, N. J. 2012, ARA&A, 50, 531, doi: 10.1146/annurev-astro-081811-125610
- Knudsen et al. (2007) Knudsen, K. K., Walter, F., Weiss, A., et al. 2007, ApJ, 666, 156, doi: 10.1086/519761
- Kohno et al. (2001) Kohno, K., Matsushita, S., Vila-Vilaró, B., et al. 2001, in Astronomical Society of the Pacific Conference Series, Vol. 249, The Central Kiloparsec of Starbursts and AGN: The La Palma Connection, ed. J. H. Knapen, J. E. Beckman, I. Shlosman, & T. J. Mahoney, 672. https://arxiv.org/abs/astro-ph/0206398
- Kollatschny et al. (2020) Kollatschny, W., Weilbacher, P. M., Ochmann, M. W., et al. 2020, A&A, 633, A79, doi: 10.1051/0004-6361/201936540
- König et al. (2016) König, S., Aalto, S., Muller, S., et al. 2016, A&A, 594, A70, doi: 10.1051/0004-6361/201628535
- Koshida et al. (2017) Koshida, S., Yoshii, Y., Kobayashi, Y., et al. 2017, ApJ, 842, L13, doi: 10.3847/2041-8213/aa7553
- Krips et al. (2008) Krips, M., Neri, R., García-Burillo, S., et al. 2008, ApJ, 677, 262, doi: 10.1086/527367
- Kroupa (2001) Kroupa, P. 2001, MNRAS, 322, 231, doi: 10.1046/j.1365-8711.2001.04022.x
- Lenc & Tingay (2009) Lenc, E., & Tingay, S. J. 2009, AJ, 137, 537, doi: 10.1088/0004-6256/137/1/537
- Li & Draine (2001) Li, A., & Draine, B. T. 2001, ApJ, 554, 778, doi: 10.1086/323147
- Li et al. (2020a) Li, F., Wang, J., Fang, M., et al. 2020a, MNRAS, 494, 1095, doi: 10.1093/mnras/staa676
- Li et al. (2020b) —. 2020b, PASJ, 72, 41, doi: 10.1093/pasj/psaa025
- Liang et al. (2006) Liang, Y. C., Yin, S. Y., Hammer, F., et al. 2006, ApJ, 652, 257, doi: 10.1086/507592
- Lintott & Viti (2006) Lintott, C., & Viti, S. 2006, ApJ, 646, L37, doi: 10.1086/506524
- Liu et al. (2015) Liu, L., Gao, Y., & Greve, T. R. 2015, ApJ, 805, 31, doi: 10.1088/0004-637X/805/1/31
- Lonsdale et al. (2003) Lonsdale, C. J., Lonsdale, C. J., Smith, H. E., & Diamond, P. J. 2003, ApJ, 592, 804, doi: 10.1086/375778
- Lu et al. (2015) Lu, N., Zhao, Y., Xu, C. K., et al. 2015, ApJ, 802, L11, doi: 10.1088/2041-8205/802/1/L11
- McMullin et al. (2007) McMullin, J. P., Waters, B., Schiebel, D., Young, W., & Golap, K. 2007, in Astronomical Society of the Pacific Conference Series, Vol. 376, Astronomical Data Analysis Software and Systems XVI, ed. R. A. Shaw, F. Hill, & D. J. Bell, 127
- Meijerink et al. (2013) Meijerink, R., Kristensen, L. E., Weiß, A., et al. 2013, ApJ, 762, L16, doi: 10.1088/2041-8205/762/2/L16
- Mould et al. (2000) Mould, J. R., Huchra, J. P., Freedman, W. L., et al. 2000, ApJ, 529, 786, doi: 10.1086/308304
- Muller et al. (2010) Muller, E., Ott, J., Hughes, A., et al. 2010, ApJ, 712, 1248, doi: 10.1088/0004-637X/712/2/1248
- Murphy et al. (2011) Murphy, E. J., Condon, J. J., Schinnerer, E., et al. 2011, ApJ, 737, 67, doi: 10.1088/0004-637X/737/2/67
- Murphy et al. (2015) Murphy, E. J., Dong, D., Leroy, A. K., et al. 2015, ApJ, 813, 118, doi: 10.1088/0004-637X/813/2/118
- Nasonova et al. (2011) Nasonova, O. G., de Freitas Pacheco, J. A., & Karachentsev, I. D. 2011, A&A, 532, A104, doi: 10.1051/0004-6361/201016004
- Neugebauer et al. (1984) Neugebauer, G., Habing, H. J., van Duinen, R., et al. 1984, ApJ, 278, L1, doi: 10.1086/184209
- Nguyen et al. (1992) Nguyen, Q. R., Jackson, J. M., Henkel, C., Truong, B., & Mauersberger, R. 1992, ApJ, 399, 521, doi: 10.1086/171944
- Padovani et al. (2017) Padovani, P., Alexander, D. M., Assef, R. J., et al. 2017, A&A Rev., 25, 2, doi: 10.1007/s00159-017-0102-9
- Papadopoulos (2007) Papadopoulos, P. P. 2007, ApJ, 656, 792, doi: 10.1086/510186
- Papadopoulos et al. (2012) Papadopoulos, P. P., van der Werf, P. P., Xilouris, E. M., et al. 2012, MNRAS, 426, 2601, doi: 10.1111/j.1365-2966.2012.21001.x
- Papadopoulos et al. (2014) Papadopoulos, P. P., Zhang, Z.-Y., Xilouris, E. M., et al. 2014, ApJ, 788, 153, doi: 10.1088/0004-637X/788/2/153
- Pety (2005) Pety, J. 2005, in SF2A-2005: Semaine de l’Astrophysique Francaise, ed. F. Casoli, T. Contini, J. M. Hameury, & L. Pagani, 721
- Pilbratt et al. (2010) Pilbratt, G. L., Riedinger, J. R., Passvogel, T., et al. 2010, A&A, 518, L1, doi: 10.1051/0004-6361/201014759
- Pilyugin et al. (2003) Pilyugin, L. S., Thuan, T. X., & Vílchez, J. M. 2003, A&A, 397, 487, doi: 10.1051/0004-6361:20021458
- Poglitsch et al. (2010) Poglitsch, A., Waelkens, C., Geis, N., et al. 2010, A&A, 518, L2, doi: 10.1051/0004-6361/201014535
- Privon et al. (2015) Privon, G. C., Herrero-Illana, R., Evans, A. S., et al. 2015, ApJ, 814, 39, doi: 10.1088/0004-637X/814/1/39
- Radford et al. (1991) Radford, S. J. E., Delannoy, J., Downes, D., et al. 1991, in Dynamics of Galaxies and Their Molecular Cloud Distributions, ed. F. Combes & F. Casoli, Vol. 146, 303
- Rieke et al. (2004) Rieke, G. H., Young, E. T., Engelbracht, C. W., et al. 2004, ApJS, 154, 25, doi: 10.1086/422717
- Roy et al. (1998) Roy, A. L., Colbert, E. J. M., Wilson, A. S., & Ulvestad, J. S. 1998, ApJ, 504, 147, doi: 10.1086/306071
- Russell (2002) Russell, D. G. 2002, ApJ, 565, 681, doi: 10.1086/337917
- Saikia et al. (1990) Saikia, D. J., Unger, S. W., Pedlar, A., et al. 1990, MNRAS, 245, 397
- Sakamoto et al. (2010) Sakamoto, K., Aalto, S., Evans, A. S., Wiedner, M. C., & Wilner, D. J. 2010, ApJ, 725, L228, doi: 10.1088/2041-8205/725/2/L228
- Sakamoto et al. (2021) Sakamoto, K., Martín, S., Wilner, D. J., et al. 2021, ApJ, 923, 240, doi: 10.3847/1538-4357/ac29bf
- Sanders et al. (2003) Sanders, D. B., Mazzarella, J. M., Kim, D. C., Surace, J. A., & Soifer, B. T. 2003, AJ, 126, 1607, doi: 10.1086/376841
- Sandqvist et al. (1995) Sandqvist, A., Joersaeter, S., & Lindblad, P. O. 1995, A&A, 295, 585
- Schöier et al. (2005) Schöier, F. L., van der Tak, F. F. S., van Dishoeck, E. F., & Black, J. H. 2005, A&A, 432, 369, doi: 10.1051/0004-6361:20041729
- Shirley (2015) Shirley, Y. L. 2015, PASP, 127, 299, doi: 10.1086/680342
- Sliwa et al. (2017) Sliwa, K., Wilson, C. D., Aalto, S., & Privon, G. C. 2017, ApJ, 840, L11, doi: 10.3847/2041-8213/aa6ea4
- Smith et al. (1998) Smith, H. E., Lonsdale, C. J., & Lonsdale, C. J. 1998, ApJ, 492, 137, doi: 10.1086/305020
- Solomon et al. (1992) Solomon, P. M., Downes, D., & Radford, S. J. E. 1992, ApJ, 387, L55, doi: 10.1086/186304
- Solomon & Vanden Bout (2005) Solomon, P. M., & Vanden Bout, P. A. 2005, ARA&A, 43, 677, doi: 10.1146/annurev.astro.43.051804.102221
- Spergel et al. (2007) Spergel, D. N., Bean, R., Doré, O., et al. 2007, ApJS, 170, 377, doi: 10.1086/513700
- Tacconi et al. (1999) Tacconi, L. J., Genzel, R., Tecza, M., et al. 1999, ApJ, 524, 732, doi: 10.1086/307839
- Tan et al. (2018) Tan, Q.-H., Gao, Y., Zhang, Z.-Y., et al. 2018, The Astrophysical Journal, 860, 165, doi: 10.3847/1538-4357/aac512
- Theureau et al. (2007) Theureau, G., Hanski, M. O., Coudreau, N., Hallet, N., & Martin, J. M. 2007, A&A, 465, 71, doi: 10.1051/0004-6361:20066187
- Tsai et al. (2015) Tsai, C.-W., Eisenhardt, P. R. M., Wu, J., et al. 2015, ApJ, 805, 90, doi: 10.1088/0004-637X/805/2/90
- Tully & Fisher (1988) Tully, R. B., & Fisher, J. R. 1988, Catalog of Nearby Galaxies
- Tully et al. (2015) Tully, R. B., Libeskind, N. I., Karachentsev, I. D., et al. 2015, ApJ, 802, L25, doi: 10.1088/2041-8205/802/2/L25
- Tully et al. (2013) Tully, R. B., Courtois, H. M., Dolphin, A. E., et al. 2013, AJ, 146, 86, doi: 10.1088/0004-6256/146/4/86
- U et al. (2012) U, V., Sanders, D. B., Mazzarella, J. M., et al. 2012, ApJS, 203, 9, doi: 10.1088/0067-0049/203/1/9
- van der Walt et al. (2011) van der Walt, S., Colbert, S. C., & Varoquaux, G. 2011, Computing in Science and Engineering, 13, 22, doi: 10.1109/MCSE.2011.37
- Varenius et al. (2014) Varenius, E., Conway, J. E., Martí-Vidal, I., et al. 2014, A&A, 566, A15, doi: 10.1051/0004-6361/201323303
- Varenius et al. (2016) —. 2016, A&A, 593, A86, doi: 10.1051/0004-6361/201628702
- Wang et al. (2004) Wang, M., Henkel, C., Chin, Y. N., et al. 2004, A&A, 422, 883, doi: 10.1051/0004-6361:20035722
- Werner et al. (2004) Werner, M. W., Roellig, T. L., Low, F. J., et al. 2004, ApJS, 154, 1, doi: 10.1086/422992
- White (1985) White, R. L. 1985, ApJ, 289, 698, doi: 10.1086/162933
- Willick & Batra (2001) Willick, J. A., & Batra, P. 2001, ApJ, 548, 564, doi: 10.1086/319005
- Wong et al. (2011) Wong, T., Hughes, A., Ott, J., et al. 2011, ApJS, 197, 16, doi: 10.1088/0067-0049/197/2/16
- Wu et al. (2005) Wu, J., Evans, Neal J., I., Gao, Y., et al. 2005, ApJ, 635, L173, doi: 10.1086/499623
- Wu et al. (2010) Wu, J., Evans, Neal J., I., Shirley, Y. L., & Knez, C. 2010, ApJS, 188, 313, doi: 10.1088/0067-0049/188/2/313
- Wu et al. (2012) Wu, J., Tsai, C.-W., Sayers, J., et al. 2012, ApJ, 756, 96, doi: 10.1088/0004-637X/756/1/96
- Zhang et al. (2014) Zhang, Z.-Y., Gao, Y., Henkel, C., et al. 2014, ApJ, 784, L31, doi: 10.1088/2041-8205/784/2/L31
- Zhang et al. (2018) Zhang, Z.-Y., Romano, D., Ivison, R. J., Papadopoulos, P. P., & Matteucci, F. 2018, Nature, 558, 260, doi: 10.1038/s41586-018-0196-x
- Zhu et al. (2008) Zhu, Y.-N., Wu, H., Cao, C., & Li, H.-N. 2008, ApJ, 686, 155, doi: 10.1086/591121