Early results from GLASS-JWST. IX: First spectroscopic confirmation of low-mass quiescent galaxies at with NIRISS
Abstract
How passive galaxies form, and the physical mechanisms which prevent star formation over long timescales, are some of the most outstanding questions in understanding galaxy evolution. The properties of quiescent galaxies over cosmic time provide crucial information to identify the quenching mechanisms. Passive galaxies have been confirmed and studied out to , but all of these studies have been limited to massive systems (mostly with ). Using James Webb Space Telescope (JWST) NIRISS grism slitless spectroscopic data from the GLASS JWST ERS program, we present spectroscopic confirmation of two quiescent galaxies at and (3 errors) with stellar masses of and (corrected for magnification factors of and , respectively). The latter represents the first spectroscopic confirmation of the existence of low-mass quiescent galaxies at cosmic noon, showcasing the power of JWST to identify and characterize this enigmatic population.
1 Introduction
Two of the most outstanding questions in understanding galaxy evolution are how quiescent galaxies form and what mechanisms are responsible for the halting of the star formation activity. Several physical processes and theoretical explanations have been suggested to first stop star formation in a galaxy and then maintain it quiescent over its lifetime (see Man & Belli 2018 for a brief review of quenching mechanisms). The properties of quiescent galaxies as a function of cosmic time (e.g., stellar mass function and number density, star-formation history, stellar age, metallicity, [/Fe] abundance, size and morphology, kinematics, and environment) provide crucial information to identify the quenching mechanisms and their relative importance at different times in the cosmic history.
Over the last decade, incredibly dedicated effort and investment on ground-based 8-10m telescopes and the Hubble Space Telescope (HST) repeatedly pushed the spectroscopic confirmation of the existence of quiescent galaxies to , when the Universe was only 1.5 Gyr old, progressively challenging theoretical models of galaxy formation and evolution (Gobat et al. 2012; Marsan et al. 2015; Glazebrook et al. 2017; Kado-Fong et al. 2017; Forrest et al. 2020a). Multi-object deep near-infrared (NIR) (i.e., rest-frame optical) spectroscopy of quiescent galaxies has allowed for the measurements of their stellar populations and star-formation histories (Schreiber et al. 2018; Belli et al. 2019; D’Eugenio et al. 2020, 2021; Estrada-Carpenter et al. 2020; Forrest et al. 2020a, b; Saracco et al. 2020; Valentino et al. 2020), kinematics, sizes, and morphologies (van de Sande et al. 2013; Belli et al. 2017; Hill et al. 2016; Newman et al. 2018; Tanaka et al. 2019; Estrada-Carpenter et al. 2020; Saracco et al. 2020; Stockmann et al. 2021; Esdaile et al. 2021; Forrest et al. 2022), metallicity (Morishita et al. 2019; Saracco et al. 2020), [/Fe] abundances (Kriek et al., 2016), and environment (McConachie et al., 2022).
However, all of these studies have been limited to the most massive quiescent galaxies (mostly , with only a small fraction with ). No low-mass (i.e., , hereafter; corresponding to 1/3 of the characteristic stellar mass of the galaxy stellar mass function, e.g., Muzzin et al. 2013) quiescent galaxy at has been spectroscopically confirmed yet, preventing the exploration of quenching mechanisms to the low stellar mass regime at cosmic noon. For example, while some form of feedback generally attributed to active galactic nuclei (AGN) is supposed for the quenching of galaxies at the massive end, it is unclear whether AGN feedback can also operate in low-mass galaxies. Furthermore, halo quenching is not expected to operate in dark matter halos below M⊙ at (Dekel & Birnboim, 2008), corresponding to roughly M⊙ (Behroozi et al., 2013). Indeed, multi-wavelength photometric surveys have been able to push photometric measurements of the stellar mass function of quiescent galaxies down to at , finding a sharp decline in the number density of quiescent galaxies with (e.g., Tomczak et al. 2014), although spectroscopic redshift measurements are needed to confirm these findings.
The advent of the James Webb Space Telescope (JWST) with its amazing set of instruments finally enables us to definitively identify low-mass quiescent galaxies at and to spectroscopically characterize their properties for the first time.
In this Letter, we present spectroscopic confirmation of two quiescent galaxies at , including the first spectroscopic confirmation of a low-mass quiescent galaxy at , using JWST NIRISS grism slitless spectroscopic data obtained from the GLASS JWST Early Release Science (ERS-1324; PI Treu) program. GLASS-JWST is obtaining NIRISS (Doyon et al. 2012; Willott et al. 2022) and NIRSpec (Jakobsen et al. 2022) spectroscopy in the center of the A2744 cluster field, while obtaining NIRCAM (Rieke et al. 2005) images of two parallel fields. GLASS-JWST consists of the deepest extragalactic data amongst the ERS programs. Details can be found in the survey paper (Treu et al., 2022).
This Letter is organized as follows. In Section 2 we introduce the selection of the low-mass quiescent galaxy candidates from multi-wavelength photometric catalogs in the Abell2744 cluster field. In Section 3 we present the JWST-NIRISS grism spectra of the low-mass quiescent galaxies, their spectroscopic redshifts, robust stellar masses obtained from the modeling of the photometry, and gravitational lensing magnification corrections. We conclude in Section 4. Magnitudes are given in the AB system and a standard cosmology with and is assumed when necessary, along with a Chabrier (2003) initial mass function (IMF).
2 Sample of low-mass quiescent galaxies
Candidate low-mass quiescent galaxies were selected from the HFF-DeepSpace catalogs in the Abell 2744 cluster (A2744-clu, hereafter) pointing constructed by Shipley et al. (2018), and cross validated using the HFF-ASTRODEEP catalogs (Castellano et al., 2016; Merlin et al., 2016).
The NIR-selected HFF-DeepSpace A2744-clu photometric catalog covers an area of 5.4 arcmin2 with complete coverage in 14 bands from the HST-UVIS F275W to the Spitzer-IRAC 8 m down to a 75% detection completeness of 28.2 mag in the F160W band. EAZY (Brammer et al., 2008) was used to derive photometric redshifts () and rest-frame colors. FAST (Kriek et al., 2009) was used to derive stellar population properties adopting Bruzual & Charlot (2003) stellar population synthesis models, a delayed exponentially declining star-formation history (SFH)111SFR , solar metallicity, and a Calzetti et al. (2000) dust attenuation law with . See Shipley et al. (2018) for a detailed description of the HFF-DeepSpace catalogs and high-level science data.
| ID | RA | DEC | H160 | |||||
|---|---|---|---|---|---|---|---|---|
| [HFF-DS] | [deg] | [deg] | [AB] | [M⊙] | [yr-1] | [M⊙] | ||
| 4877† | 3.605219 | -30.39540 | 23.15 | 2.540.06 | 10.97 | -11.20 | 2.0 | 10.67 |
| 1412 | 3.575537 | -30.41321 | 22.77 | 2.520.03 | 10.83 | -11.11 | 2.1 | 10.52 |
| 6555 | 3.582519 | -30.38545 | 24.23 | 3.020.09 | 10.83 | -12.00 | 4.0 | 10.23 |
| 4111 | 3.568355 | -30.39953 | 23.43 | 2.360.05 | 10.42 | -10.46 | 2.3 | 10.06 |
| 1103 | 3.585363 | -30.41533 | 22.98 | 2.310.19 | 10.50 | -11.18 | 2.8 | 10.06 |
| 5607† | 3.601594 | -30.39150 | 23.70 | 2.460.04 | 10.24 | -11.11 | 2.1 | 9.92 |
| 2500 | 3.572230 | -30.40686 | 24.81 | 2.710.12 | 10.06 | -11.20 | 2.2 | 9.73 |
| 5715 | 3.586502 | -30.39048 | 25.16 | 3.550.26 | 10.35 | -9.83 | 9.1 | 9.39 |
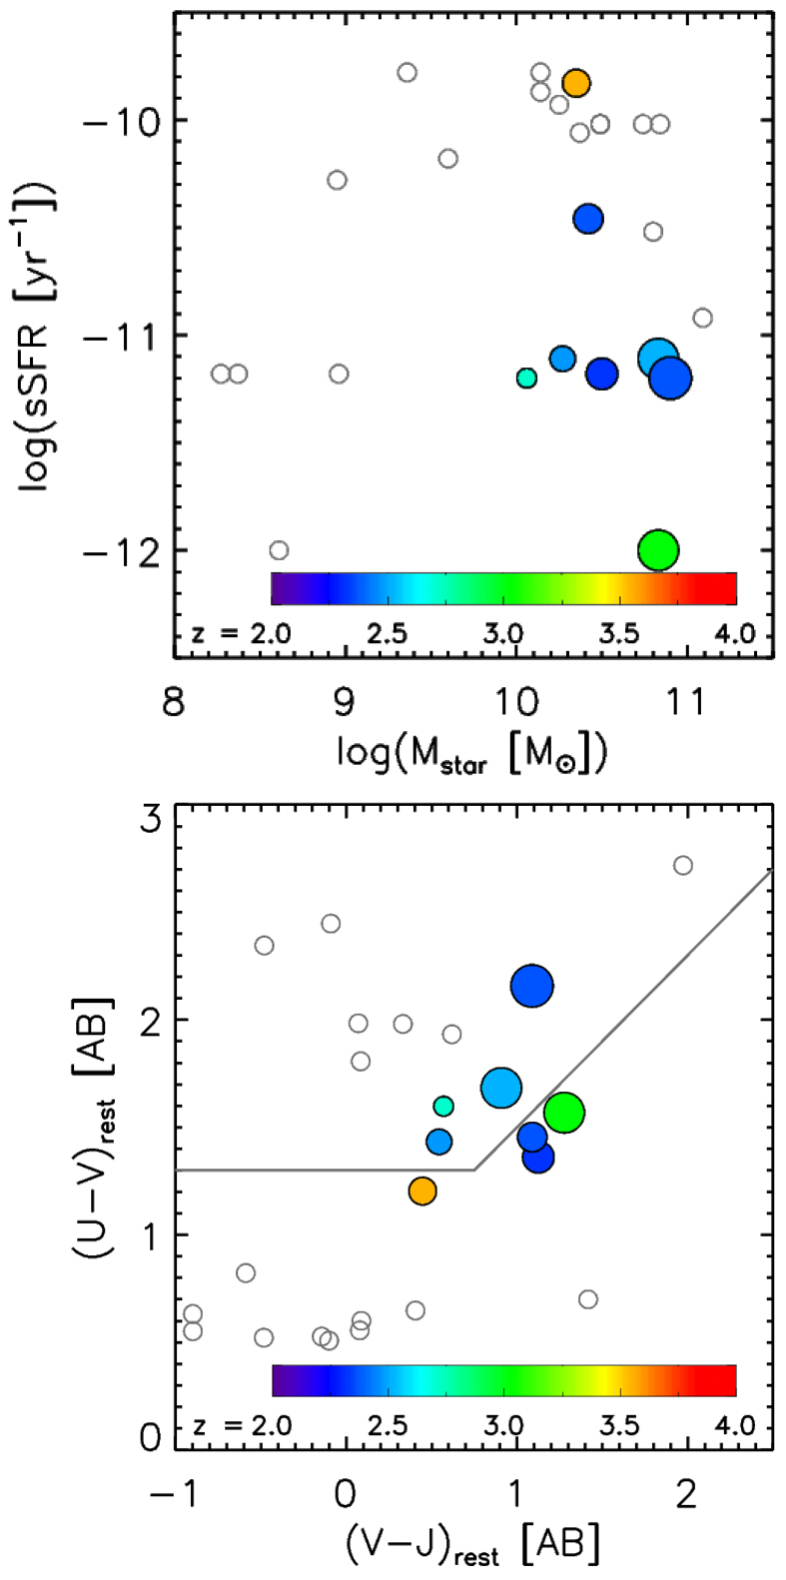
First, we selected all galaxies with , photometric redshift , stellar mass M⊙, and specific star-formation rate (sSFR) , and use_phot=1222The flag use_phot1 excludes stars, sources close to a bright star, sources with in the F160W band, catastrophic photometric redshift fits, and catastrophic stellar population fits; see Shipley et al. (2018).. We then visually inspected postage stamps of the HST images, detection image, and segmentation map of all resulting objects using the HFFexplorer333http://cosmos.phy.tufts.edu/danilo/HFF/HFFexplorer/ to remove any spurious or problematic objects (e.g., galaxies contaminated by stellar diffraction spikes, objects detected too close to subtracted bright cluster galaxies, very broad/unconstrained photometric redshift probability functions, blended objects, and potentially merging systems). This resulted in 25 galaxies, shown in the sSFR– diagram (Fig. 1, top panel) and in the rest-frame vs diagram (Fig. 1, bottom panel; UVJ diagram, hereafter).
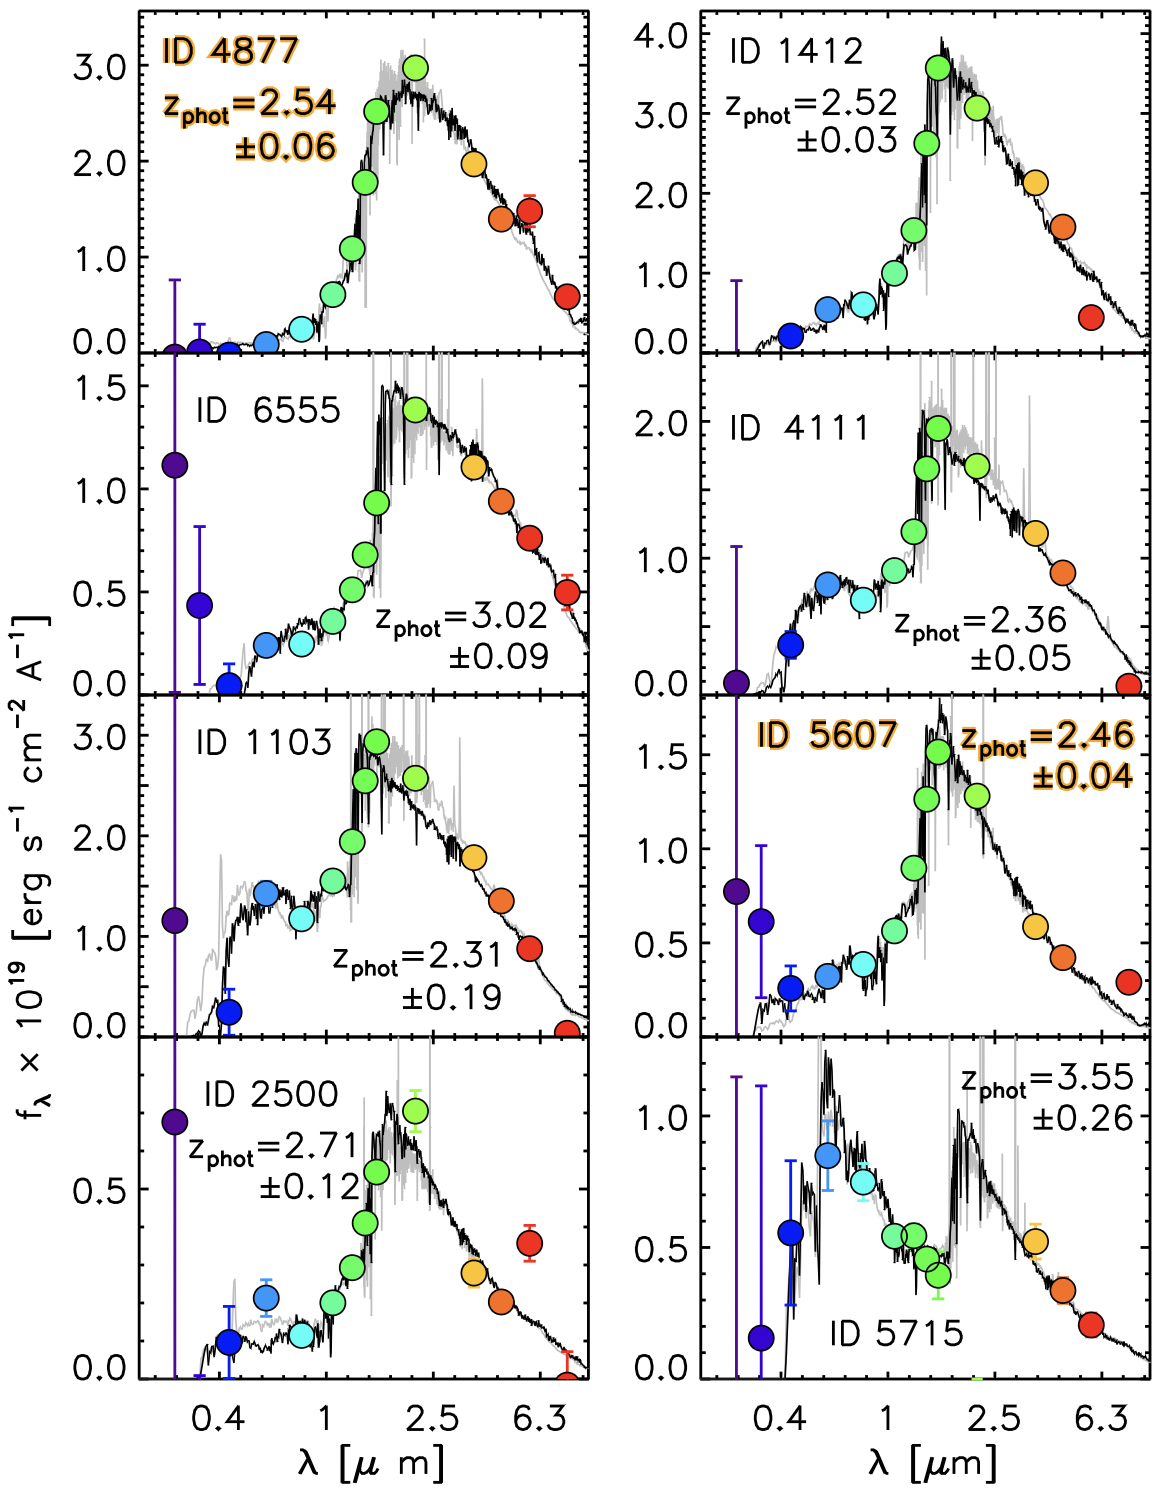
Candidate quiescent galaxies were finally selected based on their positions within (or close to the boundary of) the quiescent wedge in the UVJ diagram and from visual inspection of their spectral energy distributions (SEDs), looking for strong rest-frame optical Balmer/4000 Å breaks. A few additional objects with poorly sampled SEDs around the rest-frame optical breaks were removed from the initial sample. This resulted in the identification of eight low-mass quiescent galaxies shown as filled colored circles in Figure 1. Their SEDs are shown in Figure 2, while Table 1 lists their photometrically derived properties.
Several works (e.g., Marsan et al. 2015; Merlin et al. 2018, 2019; Schreiber et al. 2018; Carnall et al. 2020) have shown that the standard selection of quiescent galaxies in the UVJ diagram (in particular the criterion) is potentially biased against unobscured recently quenched (i.e., younger than a few hundred Myr) post-starburst galaxies, which still have significant emission in the UV due to massive bright stars not yet evolved off the main sequence (see, e.g., ID=5715 in Fig. 2). Here we apply a conservative approach, selecting unambiguous evolved quiescent galaxies, and we postpone a systematic and complete search for quiescent distant galaxies to future studies.
3 Analysis and results
The GLASS-ERS program, executed on June 28-29 2022, performed wide-field slitless spectroscopy at 1.0–2.2m with NIRISS with a single pointing roughly centered on the core of A2744-clu. The reduction of the NIRISS data, along with the extraction of the spectra and modeling of the contamination, performed with the Grizli444https://github.com/gbrammer/grizli analysis software (Brammer & Matharu, 2021), is presented in another companion paper (Roberts-Borsani et al., 2022, Paper I).
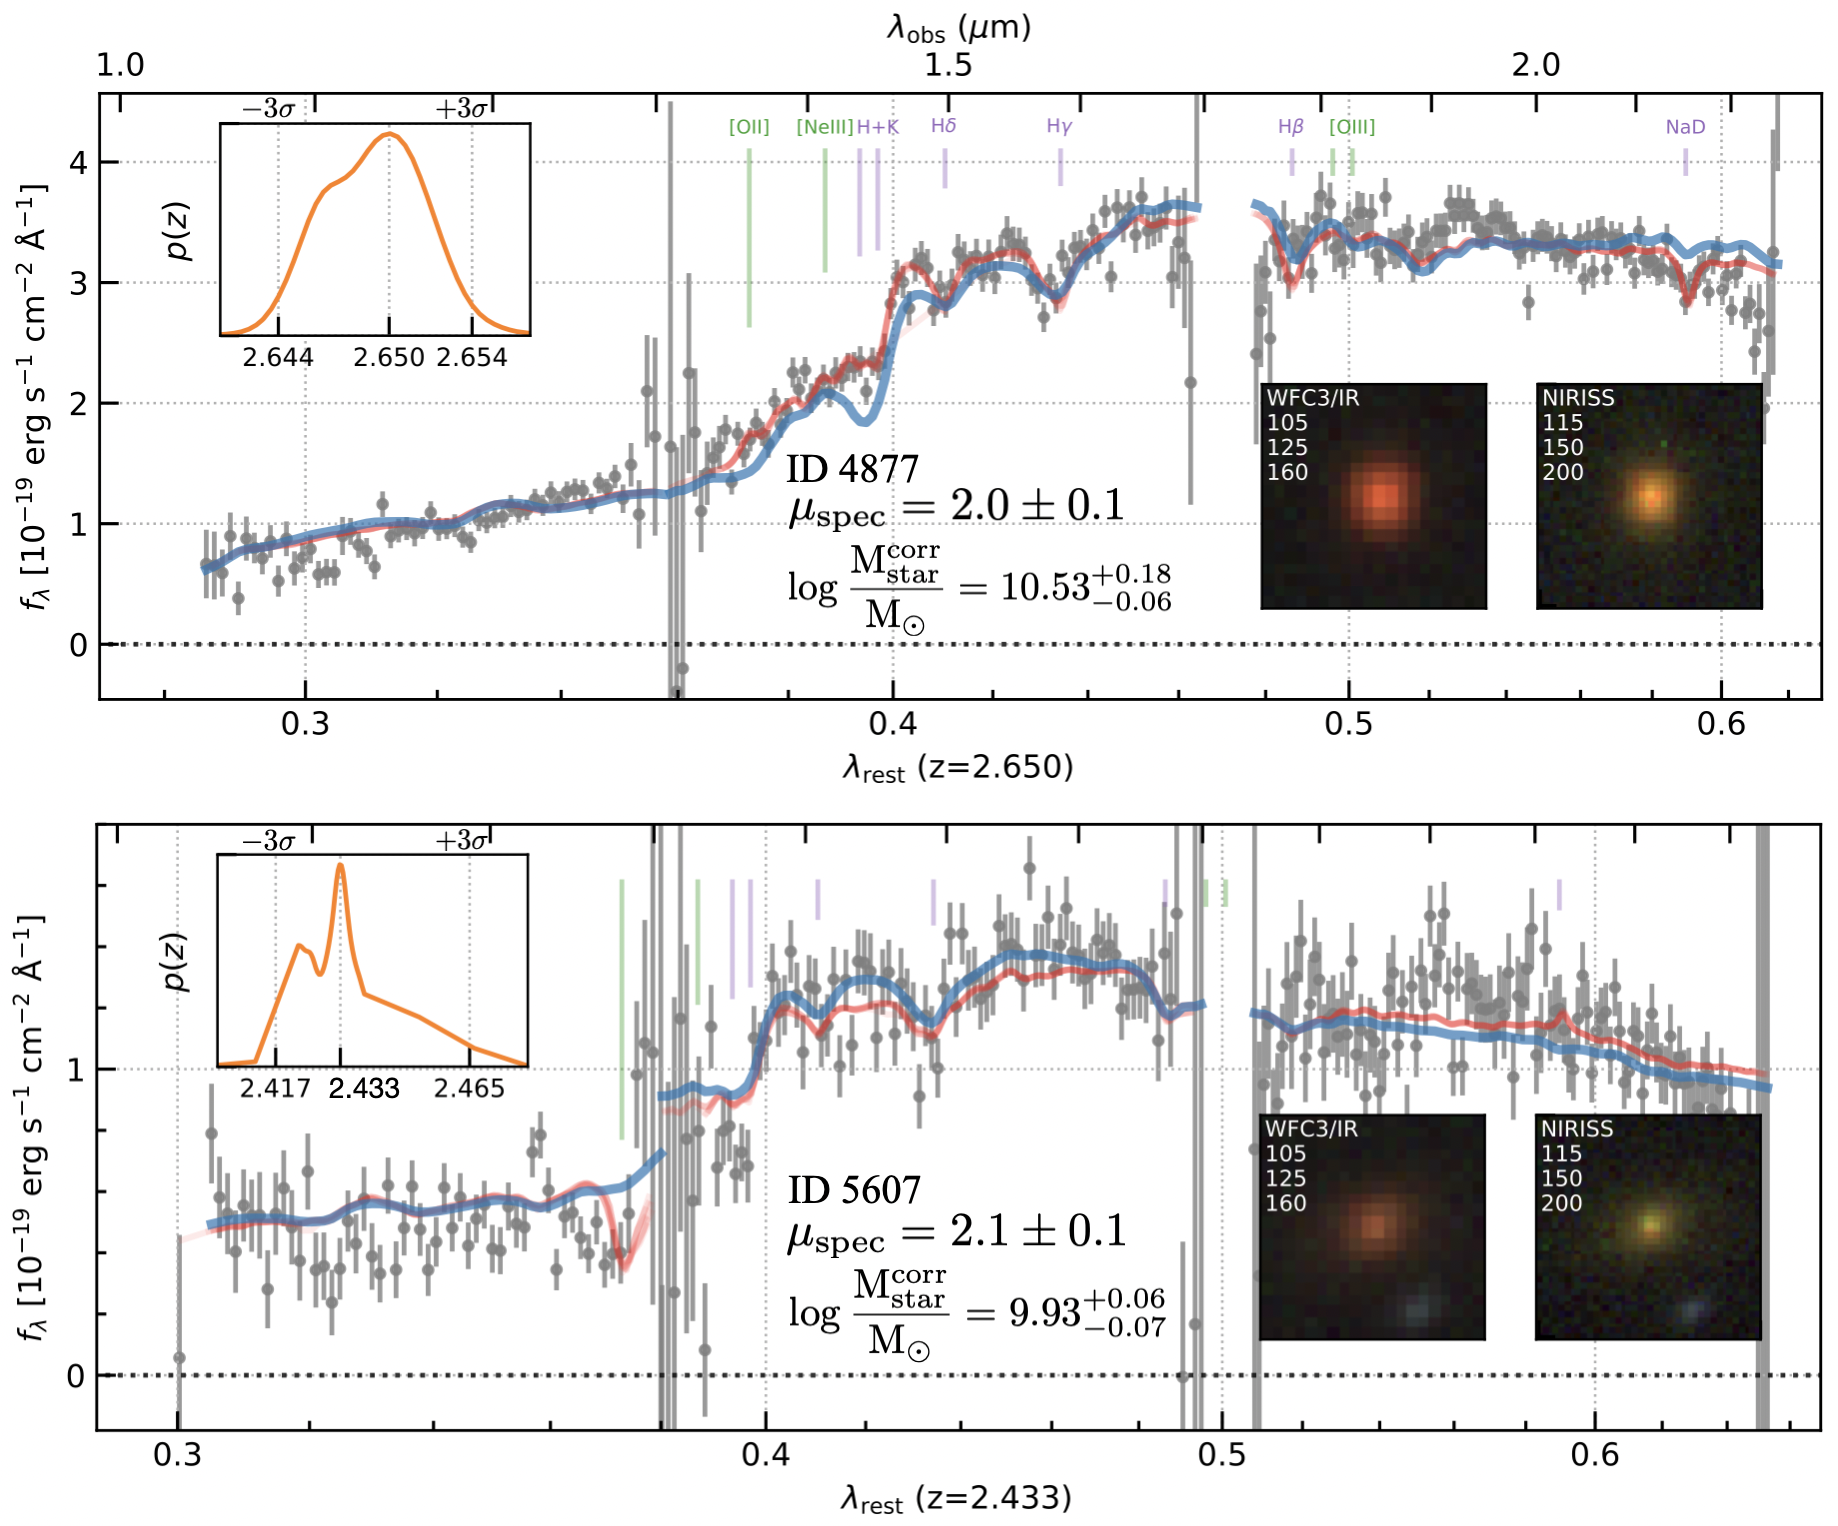
Of the eight candidates listed in Table 1, three (IDs=1412, 2500, 4111) are outside of the NIRISS pointing, whereas three others (IDs=6555, 1103, an 5715) have a significant level of contamination from bright nearby sources which cannot be optimally corrected for with the current preliminary calibration files (see Paper I for details). The Grizli extracted 1D NIRISS spectra of the remaining two candidates are shown in Figure 3, along with their false-color images constructed from both HST-WFC3/NIR bands and JWST-NIRISS bands separately. Although ID=4877 is the most massive quiescent candidate of the sample, with it is comparable to the lowest mass quiescent galaxy spectroscopically confirmed at to-date (Estrada-Carpenter et al., 2020). On the other hand, ID=5607, with , pushes the limit well below previous works, since it has a stellar mass estimate before lensing magnification correction M⊙.
Figure 3 shows the best-fit Grizli model (red curve) which places them, respectively, at redshifts of and (3 errors). The NIRISS spectra show strong Balmer/4000Å breaks, as well as other blended stellar continuum absorption features (the locations of CaII HK, H, H, H, and NaD are highlighted in Fig. 3). Furthermore, the NIRISS spectra do not show evidence of emission lines, confirming the quiescent nature of the candidates. For ID=4877, emission line forced photometry returns erg s-1 cm-2, erg s-1 cm-2, and erg s-1 cm-2, whereas for ID=5607 we measure erg s-1 cm-2, erg s-1 cm-2, although both [OII] and H are right at the longer wavelength end of the F115W and F150W spectra, respectively, whereas [OIII] falls in the gap between F150W and F200W.
We used FAST to model the HFF-DeepSpace photometry fixing the redshift at the spectroscopic redshift. Compared to the SED-modeling assumptions presented in §2, we allowed for a range of stellar metallicities from sub-solar (Z=0.004) to super-solar (Z=0.05). Figure 3 shows in blue the best-fit FAST model.
The best-fit stellar masses (not corrected for lensing magnification factor ) at the spectroscopic redshifts are and for ID=4877 and ID=5607, respectively, in good agreement within the errors with those previously determined adopting the photometric redshifts. The SED modeling confirms the quiescent nature of these two candidates, with 1 upper limits on the star-formation rates of SFR0.1-0.2 M⊙ yr-1, and on the sSFR of and , for ID=4877 and ID=5607, respectively, compared to for typical main-sequence star-forming galaxies at with similar stellar masses (Whitaker et al., 2014).
Using revised lensing magnification maps from Bergamini et al. (2022) and adopting the spectroscopic redshifts, we find and for ID=4877 and ID=5607, respectively. We note that this does not include systematic uncertainty arising from lens modeling assumptions, although we expect this uncertainty to be modest given the magnification factors. The gravitational lensing magnification corrected stellar masses are therefore found to be for ID=4877 and for ID=5607. With a stellar mass below M⊙, HFF-DS 5607 is the lowest mass quiescent galaxy to be spectroscopically confirmed at to-date.
4 Summary and conclusions
This Letter presents a first look at low-mass quiescent galaxies in the JWST NIRISS data from the GLASS-ERS survey in the Abell 2744 cluster. The power of JWST for spectroscopic studies of low-mass quiescent galaxies at cosmic noon (i.e., ) is demonstrated by spectroscopic confirmation of the quiescent nature of two galaxies, which were identified through SED modeling as passive candidates in the HFF-DeepSpace photometric catalogs. Our results are summarized as follows:
-
•
We measure the spectroscopic redshifts of two low-mass quiescent galaxies via their Balmer/4000Å breaks and stellar absorption features from NIRSS spectra ( for HFF-DS 4877 and for HFF-DS 5607; 3 errors).
-
•
The quiescent nature of the two galaxies is further confirmed by SED modeling, resulting in SFR0.2 M⊙ yr-1 and , i.e., star formation activity suppressed by more than two orders of magnitude compared to typical star-forming galaxies with similar masses at .
-
•
No nebular emission lines (i.e., [OII], H, and [OIII]) are detected in the spectra, further supporting the quiescent nature of these two galaxies.
-
•
HFF-DS 5607, with a gravitational lensing magnification corrected stellar mass , is the first spectroscopically confirmed low-mass quiescent galaxy at .
Soon-to-be-released updates and improvements to the existing NIRISS reference and calibration files are expected to further improve wavelength calibrations, spectral trace offset measurements, flux calibrations, and contamination modeling. This will enable for the confirmation of a larger sample of low-mass quiescent galaxies at in the Abell 2744 cluster ERS data, as well as allowing for the inclusion of the NIRISS spectra in the SED modeling for robust derivations of, e.g., SFH and stellar ages, thus providing the crucial information to discriminate between the multiple quenching mechanisms characterized by different timescales. JWST is finally allowing us, for the first time, to spectroscopically identify and study the population of low-mass () quiescent galaxies at .
References
- Behroozi et al. (2013) Behroozi, P. S., Wechsler, R. H., & Conroy, C. 2013, ApJ, 762, L31, doi: 10.1088/2041-8205/762/2/L31
- Belli et al. (2017) Belli, S., Newman, A. B., & Ellis, R. S. 2017, ApJ, 834, 18, doi: 10.3847/1538-4357/834/1/18
- Belli et al. (2019) —. 2019, ApJ, 874, 17, doi: 10.3847/1538-4357/ab07af
- Bergamini et al. (2022) Bergamini, P., Acebron, A., Grillo, C., et al. 2022, arXiv e-prints, arXiv:2207.09416. https://arxiv.org/abs/2207.09416
- Brammer & Matharu (2021) Brammer, G., & Matharu, J. 2021, gbrammer/grizli: Release 2021, 1.3.2, Zenodo, Zenodo, doi: 10.5281/zenodo.1146904
- Brammer et al. (2008) Brammer, G. B., van Dokkum, P. G., & Coppi, P. 2008, ApJ, 686, 1503, doi: 10.1086/591786
- Bruzual & Charlot (2003) Bruzual, G., & Charlot, S. 2003, MNRAS, 344, 1000, doi: 10.1046/j.1365-8711.2003.06897.x
- Calzetti et al. (2000) Calzetti, D., Armus, L., Bohlin, R. C., et al. 2000, ApJ, 533, 682, doi: 10.1086/308692
- Carnall et al. (2020) Carnall, A. C., Walker, S., McLure, R. J., et al. 2020, MNRAS, 496, 695, doi: 10.1093/mnras/staa1535
- Castellano et al. (2016) Castellano, M., Amorín, R., Merlin, E., et al. 2016, A&A, 590, A31, doi: 10.1051/0004-6361/201527514
- Chabrier (2003) Chabrier, G. 2003, PASP, 115, 763, doi: 10.1086/376392
- Dekel & Birnboim (2008) Dekel, A., & Birnboim, Y. 2008, MNRAS, 383, 119, doi: 10.1111/j.1365-2966.2007.12569.x
- D’Eugenio et al. (2020) D’Eugenio, C., Daddi, E., Gobat, R., et al. 2020, ApJ, 892, L2, doi: 10.3847/2041-8213/ab7a96
- D’Eugenio et al. (2021) —. 2021, A&A, 653, A32, doi: 10.1051/0004-6361/202040067
- Doyon et al. (2012) Doyon, R., Hutchings, J. B., Beaulieu, M., et al. 2012, in Society of Photo-Optical Instrumentation Engineers (SPIE) Conference Series, Vol. 8442, Space Telescopes and Instrumentation 2012: Optical, Infrared, and Millimeter Wave, ed. M. C. Clampin, G. G. Fazio, H. A. MacEwen, & J. Oschmann, Jacobus M., 84422R, doi: 10.1117/12.926578
- Esdaile et al. (2021) Esdaile, J., Glazebrook, K., Labbé, I., et al. 2021, ApJ, 908, L35, doi: 10.3847/2041-8213/abe11e
- Estrada-Carpenter et al. (2020) Estrada-Carpenter, V., Papovich, C., Momcheva, I., et al. 2020, ApJ, 898, 171, doi: 10.3847/1538-4357/aba004
- Forrest et al. (2020a) Forrest, B., Annunziatella, M., Wilson, G., et al. 2020a, ApJ, 890, L1, doi: 10.3847/2041-8213/ab5b9f
- Forrest et al. (2020b) Forrest, B., Marsan, Z. C., Annunziatella, M., et al. 2020b, ApJ, 903, 47, doi: 10.3847/1538-4357/abb819
- Forrest et al. (2022) Forrest, B., Wilson, G., Muzzin, A., et al. 2022, ApJ, xxx, xx, doi: tbd
- Glazebrook et al. (2017) Glazebrook, K., Schreiber, C., Labbé, I., et al. 2017, Nature, 544, 71, doi: 10.1038/nature21680
- Gobat et al. (2012) Gobat, R., Strazzullo, V., Daddi, E., et al. 2012, ApJ, 759, L44, doi: 10.1088/2041-8205/759/2/L44
- Hill et al. (2016) Hill, A. R., Muzzin, A., Franx, M., & van de Sande, J. 2016, ApJ, 819, 74, doi: 10.3847/0004-637X/819/1/74
- Jakobsen et al. (2022) Jakobsen, P., Ferruit, P., Alves de Oliveira, C., et al. 2022, A&A, 661, A80, doi: 10.1051/0004-6361/202142663
- Kado-Fong et al. (2017) Kado-Fong, E., Marchesini, D., Marsan, Z. C., et al. 2017, ApJ, 838, 57, doi: 10.3847/1538-4357/aa6037
- Kriek et al. (2009) Kriek, M., van Dokkum, P. G., Labbé, I., et al. 2009, ApJ, 700, 221, doi: 10.1088/0004-637X/700/1/221
- Kriek et al. (2016) Kriek, M., Conroy, C., van Dokkum, P. G., et al. 2016, Nature, 540, 248, doi: 10.1038/nature20570
- Man & Belli (2018) Man, A., & Belli, S. 2018, Nature Astronomy, 2, 695, doi: 10.1038/s41550-018-0558-1
- Marsan et al. (2015) Marsan, Z. C., Marchesini, D., Brammer, G. B., et al. 2015, ApJ, 801, 133, doi: 10.1088/0004-637X/801/2/133
- Martis et al. (2016) Martis, N. S., Marchesini, D., Brammer, G. B., et al. 2016, ApJ, 827, L25, doi: 10.3847/2041-8205/827/2/L25
- McConachie et al. (2022) McConachie, I., Wilson, G., Forrest, B., et al. 2022, ApJ, 926, 37, doi: 10.3847/1538-4357/ac2b9f
- Merlin et al. (2016) Merlin, E., Amorín, R., Castellano, M., et al. 2016, A&A, 590, A30, doi: 10.1051/0004-6361/201527513
- Merlin et al. (2018) Merlin, E., Fontana, A., Castellano, M., et al. 2018, MNRAS, 473, 2098, doi: 10.1093/mnras/stx2385
- Merlin et al. (2019) Merlin, E., Fortuni, F., Torelli, M., et al. 2019, MNRAS, 490, 3309, doi: 10.1093/mnras/stz2615
- Morishita et al. (2019) Morishita, T., Abramson, L. E., Treu, T., et al. 2019, ApJ, 877, 141, doi: 10.3847/1538-4357/ab1d53
- Muzzin et al. (2013) Muzzin, A., Marchesini, D., Stefanon, M., et al. 2013, ApJ, 777, 18, doi: 10.1088/0004-637X/777/1/18
- Newman et al. (2018) Newman, A. B., Belli, S., Ellis, R. S., & Patel, S. G. 2018, ApJ, 862, 125, doi: 10.3847/1538-4357/aacd4d
- Rieke et al. (2005) Rieke, M. J., Kelly, D., & Horner, S. 2005, in Society of Photo-Optical Instrumentation Engineers (SPIE) Conference Series, Vol. 5904, Cryogenic Optical Systems and Instruments XI, ed. J. B. Heaney & L. G. Burriesci, 1–8, doi: 10.1117/12.615554
- Roberts-Borsani et al. (2022) Roberts-Borsani et al. 2022, Submitted to ApJ
- Saracco et al. (2020) Saracco, P., Marchesini, D., La Barbera, F., et al. 2020, ApJ, 905, 40, doi: 10.3847/1538-4357/abc7c4
- Schreiber et al. (2018) Schreiber, C., Glazebrook, K., Nanayakkara, T., et al. 2018, A&A, 618, A85, doi: 10.1051/0004-6361/201833070
- Shipley et al. (2018) Shipley, H. V., Lange-Vagle, D., Marchesini, D., et al. 2018, ApJS, 235, 14, doi: 10.3847/1538-4365/aaacce
- Stockmann et al. (2021) Stockmann, M., Jørgensen, I., Toft, S., et al. 2021, ApJ, 908, 135, doi: 10.3847/1538-4357/abce66
- Tanaka et al. (2019) Tanaka, M., Valentino, F., Toft, S., et al. 2019, ApJ, 885, L34, doi: 10.3847/2041-8213/ab4ff3
- Tomczak et al. (2014) Tomczak, A. R., Quadri, R. F., Tran, K.-V. H., et al. 2014, ApJ, 783, 85, doi: 10.1088/0004-637X/783/2/85
- Treu et al. (2022) Treu, T., Roberts-Borsani, G., Bradac, M., et al. 2022, ApJ, in press, arXiv:2206.07978. https://arxiv.org/abs/2206.07978
- Valentino et al. (2020) Valentino, F., Tanaka, M., Davidzon, I., et al. 2020, ApJ, 889, 93, doi: 10.3847/1538-4357/ab64dc
- van de Sande et al. (2013) van de Sande, J., Kriek, M., Franx, M., et al. 2013, ApJ, 771, 85, doi: 10.1088/0004-637X/771/2/85
- Whitaker et al. (2014) Whitaker, K. E., Franx, M., Leja, J., et al. 2014, ApJ, 795, 104, doi: 10.1088/0004-637X/795/2/104
- Willott et al. (2022) Willott, C. J., Doyon, R., Albert, L., et al. 2022, PASP, 134, 025002, doi: 10.1088/1538-3873/ac5158