Early results from GLASS-JWST. V: the first rest-frame optical size-luminosity relation of galaxies at
Abstract
We present the first rest-frame optical size-luminosity relation of galaxies at , using the NIRCam imaging data obtained by the GLASS James Webb Space Telescope Early Release Science (GLASS-JWST-ERS) program, providing the deepest extragalactic data of the ERS campaign. Our sample consist of 19 photometrically selected bright galaxies with at and at . We measure the size of the galaxies in 5 bands, from the rest-frame optical () to the ultra-violet (UV; ) based on the Sérsic model, and analyze the size-luminosity relation as a function of wavelength. Remarkably, the data quality of NIRCam imaging is sufficient to probe the half-light radius down to pc at . Given the limited sample size and magnitude range, we first fix the slope to that observed for larger samples in rest-frame UV using HST samples. The median size at the reference luminosity decreases slightly from rest-frame optical ( pc) to UV ( pc). We then re-fit the size-luminosity relation allowing the slope to vary. The slope is consistent with for all bands except F150W, where we find a marginally steeper slope of . The steep UV slope is mainly driven by the smallest and faintest galaxies. If confirmed by larger samples, it implies that the UV size-luminosity relation breaks toward the faint end as suggested by lensing studies.
1 Introduction
The size of a galaxy is a fundamental observable quantity. Its evolution and scaling relation with other properties such as luminosity and stellar mass provide important clues on the formation and evolution of galaxies across cosmic time (Conselice, 2014).
At , the study of the size-luminosity relation has been limited so far to the rest-frame UV wavelength due to the lack of high-resolution imaging beyond the near-infrared bands. The nature of the size and size-luminosity relation in the rest-frame optical still remains an open question. Numerical studies predict a range of options for how the size of galaxies varies between UV and optical bands. Ma et al. (2018) predicted that galaxy sizes measured in the rest-frame UV are smaller than those in optical because the UV emission tends to trace the clumpy star-forming regions, while Wu et al. (2020) predicted similar sizes in two bands. In contrast, Marshall et al. (2022); Roper et al. (2022) found that the perceived size of galaxies at the rest-frame UV is larger than in redder bands due to concentration of the dust in the central regions. They predicted that the slope in the rest-frame optical band should be flatter than that in the UV band at these redshifts.
The UV sizes of galaxies (defined by half-light radius, ) are compact and marginally resolved by the Hubble Space Telescope (HST). Many studies have analyzed UV galaxy sizes and UV size-luminosity relation at , expressed with parameterization . Using HST data, Shibuya et al. (2015) found a constant across redshift range , which is consistent with many others (Grazian et al., 2012; Huang et al., 2013; Ono et al., 2013; Holwerda et al., 2015), and a median size pc at at luminosity . the magnification power of gravitational lensing can boost the effective resolution of HST (Kawamata et al., 2018; Bouwens et al., 2022; Yang et al., 2022), but it cannot lift the limitation in wavelength coverage.
The James Webb Space Telescope (JWST) is revolutionizing our understanding of galaxies at by providing unprecedented depth and spatial resolution at both rest-frame optical and UV wavelengths. The NIRCam filter F444W enables us to probe the rest-frame optical size of galaxies at at a similar angular resolution to that provided by HST WFC3-IR in the rest-frame UV i.e., F160W. Based on observations from the GLASS James Webb Space Telescope Early Release Science (GLASS-JWST-ERS) program (Treu et al., 2022a), we present the first measurement of the size of bright galaxies at across multiple broadband wavelengths. We derive their size-luminosity relation as a function of wavelength from rest-frame optical to UV.
For this study, we limit ourselves to relatively bright/high signal-to-noise (SNR) galaxies, which alleviates the potential impact of incompleteness. A more sophisticated analysis, including the full GLASS-JWST dataset (i.e., another half part of data will be achieved in the near future, see details in Section 2), a treatment of incompleteness, and evolutionary trends, is deferred to a forthcoming paper. A companion paper in this focus issue examines the wavelength dependency of morphological features such as clumpiness and asymmetry for the same sample (Treu et al., 2022b).
2 JWST Program and Sample Selection
2.1 GLASS-JWST-ERS program
The GLASS-JWST-ERS program is obtaining the deepest ERS observations with NIRISS, NIRSpec, and NIRCam (Doyon et al., 2012; Jakobsen et al., 2022; Ferruit et al., 2022; Rieke et al., 2005). In primary mode, it is obtaining NIRISS and NIRSpec spectroscopy of galaxies lensed by the HFF cluster Abell 2744 in the cluster core field (see details in Paper I, Roberts-Borsani et al., 2022). In parallel mode, it is obtaining NIRCam imaging of galaxies in two flanking fields, i.e., 3-8 arcmins away from the center of the cluster, to NIRISS and NIRSpec, respectively. We refer the reader to Treu et al. (2022a) for details about the program and observational strategy. GLASS-JWST-ERS utilizes 7 filters in NIRCam, 4 filters in the short wavelength channel (F090W, F115W, F150W, and F200W) and 3 filters (F277W, F356W and F444W) in the long wavelength channel.
In this letter, we focus on the NIRCam data obtained in parallel with NIRISS on June 28-29 2022. The data are described in more detail by Merlin et al. (2022, hereafter, Paper II). Modest lensing magnification is expected to present in the parallel fields (Medezinski et al., 2016; Bergamini et al., 2022), so that the sizes and luminosities should be considered as upper limits. In this first analysis, we neglect this effect. The issue will be revisited after the completion of the campaign.
2.2 Sample selection
Our sample is composed of the combination of two photometrically-selected galaxies samples, of galaxies at (Leethochawalit et al., 2022, hereafter, Paper X) and of galaxies at (Castellano et al., 2022, hereafter, Paper III). The samples are selected from the photometric catalog of Merlin et al. (2022, hereafter, Paper II). We refer the reader to Paper II for details of the image reduction and photometry.
Taking advantage of multiple filters, the catalogs employ the Lyman-break dropout technique and photometric redshift selection to make a robust selection of galaxies at . Both catalogs require detection in F444W to ensure high purity of the selected candidates. The contamination rate of low- galaxies is expected to be . Based on the two catalogs, our sample consists of 13 galaxies at and 6 galaxies at . Their limits are and respectively.
3 Size Measurement
To measure the size of each galaxy, we utilize the python software Galight 111https://github.com/dartoon/galight (Ding et al., 2020). The code inherits the image modeling capabilities of Lenstronomy (Birrer et al., 2015; Birrer & Amara, 2018; Birrer et al., 2021), and adopts a forward modeling technique to measure the size of galaxies. The sizes derived by Galight/Lenstronomy are robust as demonstrated by Kawinwanichakij et al. (2021); Yang et al. (2021) and the results are consistent with those measured by traditional software such as GALFIT (Peng et al., 2002).
We model the light distribution of the sources assuming a Sérsic light profile (Sersic, 1968):
| (1) |
where the surface brightness amplitude at the half-light radius , is a constant related to the Sérsic index . We adopt the definition, , where the coordinates depend on the position angle and the center position of the light, and is the axial ratio. In addition, we stack several bright stars in the same field and use it as a point-spread function (PSF) in the forward modeling.
We use the mosaics images, with common aligned pixel grid (pixel size is 31 mas) in each band to measure the size of each galaxy in a cutout, see details of mosaics images in Paper II. We fix to 1, which is appropriate for star-forming galaxies (Morishita et al., 2014; Shibuya et al., 2015), and the axial ratio is limited to the range 0.1-1. In some cases, the cutout includes contamination, and we mask out or fit contaminants by additional Sérsic light profiles. We apply the same strategy to fit the galaxies in each band independently. We visually inspect the fitting result for each galaxy in the sample in each band. We flag and remove the bands in which we are not confident of the size measurement owing to a poor fit or edge effects or defects. Our results are summarized in Table 1.
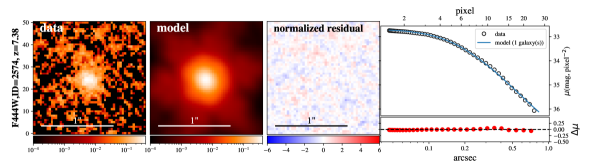
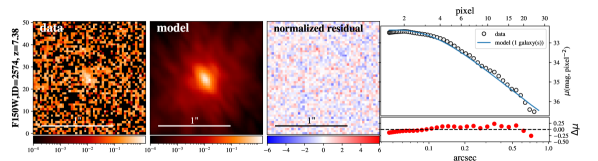
We show an example of the modeling procedures in the rest-frame optical (F444W) and UV (F150W) bands in Figure 1. In general, the galaxies are well fitted by an exponential disk with . We also perform the fitting while allowing to vary in the range 0.3-4 and find there is no significant change in size on average ( dex). More detailed morphology analysis can be found in a companion paper (Treu et al., 2022b).
| ID | RA | Dec | ||||||||||||
|---|---|---|---|---|---|---|---|---|---|---|---|---|---|---|
| (kpc) | (kpc) | (kpc) | (kpc) | (kpc) | ||||||||||
| 1470 | 3.5137 | -30.3628 | 7.65 | 0.66 0.09 | -19.0 0.13 | 0.59 0.11 | -18.9 0.13 | 0.46 0.12 | -18.2 0.26 | 0.69 0.20a | -18.6 0.32 | -18.7 0.25 | ||
| 2236 | 3.4899 | -30.3545 | 7.99 | 0.20 0.04 | -18.8 0.12 | 0.12 0.05a | -17.9 0.24 | 0.18 0.07a | -18.4 0.30 | 0.14 0.04 | -18.5 0.31 | 0.11 0.03a | -18.6 0.27 | -18.7 0.20 |
| 2574 | 3.4955 | -30.3508 | 7.38 | 0.45 0.06 | -19.3 0.13 | 0.39 0.06 | -19.3 0.08 | 0.39 0.08 | -19.0 0.12 | 0.43 0.07 | -19.4 0.13 | 0.34 0.06 | -18.9 0.17 | -19.2 0.15 |
| 2911 | 3.5118 | -30.3468 | 6.94 | 0.46 0.02 | -20.7 0.04 | 0.43 0.02 | -20.7 0.02 | 0.36 0.03 | -20.1 0.05 | 0.36 0.05 | -19.9 0.09 | 0.23 0.03 | -19.5 0.10 | -19.5 0.15 |
| 2936 | 3.5119 | -30.3467 | 7.23 | 0.61 0.04 | -20.0 0.07 | 0.61 0.04 | -20.0 0.05 | 0.68 0.06 | -19.8 0.08 | 0.90 0.13 | -19.7 0.14 | 0.62 0.11 | -19.5 0.15 | -19.4 0.30 |
| 3120 | 3.5203 | -30.3439 | 7.45 | 0.64 0.06 | -19.7 0.07 | 0.92 0.11 | -19.9 0.08 | 0.73 0.08 | -19.8 0.09 | 0.67 0.08 | -19.7 0.12 | 0.67 0.11 | -19.5 0.15 | -20.1 0.20 |
| 4542 | 3.4880 | -30.3254 | 8.97 | 0.47 0.07 | -19.4 0.12 | 0.17 0.09 | -18.6 0.19 | 0.40 0.10a | -19.2 0.13 | 0.14 0.03 | -18.9 0.18 | 0.10 0.02 | -19.0 0.17 | -19.5 0.15 |
| 4863 | 3.4867 | -30.3272 | 8.07 | 0.24 0.05 | -19.3 0.12 | 0.35 0.09 | -18.9 0.12 | 0.20 0.09 | -18.7 0.14 | 0.27 0.04 | -19.3 0.12 | 0.18 0.03 | -19.2 0.15 | -19.3 0.10 |
| 5001 | 3.4997 | -30.3177 | 8.10 | 1.01 0.20 | -19.6 0.13 | 1.40 0.22 | -19.5 0.18 | 3.14 1.10a | -19.8 0.23 | 1.07 0.28 | -19.7 0.20 | 1.23 0.32a | -19.9 0.18 | -19.4 0.15 |
| 1708 | 3.4906 | -30.3604 | 7.83 | 0.52 0.03 | -20.1 0.09 | 1.04 0.85a | -19.7 0.47 | 0.41 0.06 | -19.5 0.09 | 0.32 0.04 | -19.5 0.12 | -19.5 0.20 | ||
| 4397 | 3.4747 | -30.3226 | 8.06 | 0.87 0.08 | -19.9 0.14 | 0.34 0.35a | -18.6 0.79 | 0.65 0.15a | -19.1 0.18 | 1.11 0.11 | -19.8 0.17 | -19.4 0.25 | ||
| 6116 | 3.5046 | -30.3079 | 8.24 | 0.32 0.05 | -19.4 0.09 | 0.72 0.19a | -19.1 0.16 | 4.34 0.49a | -20.4 0.24 | 0.40 0.28a | -18.4 0.27 | -18.8 0.30 | ||
| 6263 | 3.4697 | -30.3090 | 8.21 | 0.54 0.07 | -19.5 0.14 | 0.95 0.76a | -19.5 0.45 | 0.39 0.12 | -19.1 0.16 | 0.37 0.10a | -19.2 0.15 | -19.3 1.90 | ||
| 560b | 3.5119 | -30.3718 | 10.63 | 0.50 0.02 | -21.2 0.05 | 0.46 0.02 | -21.0 0.09 | 0.49 0.03 | -21.0 0.11 | 0.43 0.02 | -21.0 0.15 | 0.37 0.03 | -20.6 0.20 | -21.0 0.06 |
| 5153b | 3.4990 | -30.3248 | 12.30 | 0.17 0.02 | -20.4 0.04 | 0.10 0.02 | -20.4 0.06 | 0.12 0.02 | -20.6 0.07 | 0.12 0.01 | -21.1 0.10 | -21.2 0.20 | ||
| 1351b | 3.5289 | -30.3638 | 9.33 | 0.76 0.05 | -20.5 0.07 | 0.78 0.06 | -20.7 0.08 | 0.67 0.08 | -20.4 0.13 | 0.88 0.09 | -20.8 0.13 | 0.68 0.15 | -19.7 0.44 | -20.7 0.09 |
| 2488b | 3.5137 | -30.3516 | 9.93 | 2.01 0.37a | -19.9 0.12 | 1.07 0.34 | -19.4 0.28 | 0.39 0.14a | -18.9 0.32 | 0.39 0.09 | -19.3 0.34 | -20.0 0.27 | ||
| 4131b | 3.4944 | -30.3076 | 9.20 | 0.28 0.11a | -18.5 0.08 | 0.17 0.07a | -18.6 0.09 | 0.19 0.12a | -17.9 0.11 | 0.21 0.08a | -18.9 0.19 | 0.16 0.07a | -18.7 0.39 | -20.2 0.18 |
| 5889b | 3.4791 | -30.3149 | 9.05 | 0.63 0.12 | -19.4 0.11 | 0.39 0.11 | -19.0 0.17 | 0.52 0.13a | -19.1 0.34 | 0.45 0.09 | -19.0 0.49 | 0.61 0.34a | -18.6 0.61 | -19.7 0.21 |
| a.the size measurement is not confident. | ||||||||||||||
| b.the sources from 560 - 5889 are corresponding to GHZ1 - GHZ6 in Paper III. | ||||||||||||||
| c., rest-frame UV absolute magnitude, calculated in Paper X and Paper III. | ||||||||||||||
4 Size-luminosity distribution
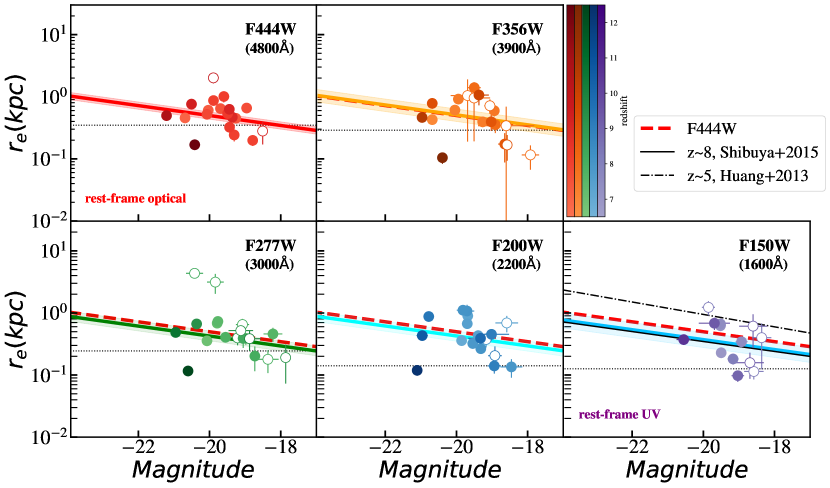
In Figure 2, we present the size-luminosity distribution of galaxies at from the rest-frame optical ( Å) to UV ( Å) bands. The source luminosity is calculated from the best-fit magnitude of our Sérsic fits.
In this Section, we apply an analytic method to derive the size-luminosity relation and report the best-fits results. Given the relatively small sample size at in this first dataset, we do not consider potential evolution of the intercept with redshift.
4.1 Size-Luminosity relation in analytical form
In order to carry out our fit, we assume that the size distribution at a given luminosity obeys a log-normal function and that the size-luminosity relation can be described by a power-law (Shen et al., 2003; Holwerda et al., 2015).
In this way, the probability density function (PDF) of the size-luminosity pair is expressed as,
| (2) |
and
| (3) |
where r0, , and are the median radius at , the log-normal dispersion of , the slope of the size-luminosity relation, and the characteristic luminosity (corresponding to ), respectively.
Given the relatively small sample size and narrow brightness range, for our baseline analysis we opt to fix the slope. Since many studies have found consistent UV slope for entire redshift range (Huang et al., 2013; Ono et al., 2013; Shibuya et al., 2015; Holwerda et al., 2015), we fix the slope as reported by Shibuya et al. (2015) at from HST data. We then use a standard Bayesian approach and run a Markov chain Monte Carlo (MCMC) process to derive the posterior distribution of parameters r0, and .
4.2 The size-luminosity relation as a function of wavelength
In each panel of Figure 2, colored points and lines represent the data and fitting results in the corresponding band. We performed size measurements on 19, 19, 19, 18, and 13 galaxies in the F444W, F356W, F277W, F200W, and F150W band, respectively. The failures in F200W and F150W bands are due to a combination of factors: galaxies are out of the detector, have too low SNR (i.e.,), or have an extremely bright contaminant nearby. Some galaxies are not confidently measured, as judged by significant residuals to the Sérsic model fit. Those sources are identified by empty circles, They are shown for completeness and are excluded from the size-luminosity relation fit. Some galaxies are extremely small, i.e., smaller than the PSF size. We performed mock tests using a Sérsic profile to model the galaxies, and it turns out that the radius can be correctly recovered down to half of the PSF size, i.e., mas at the F444W band.
We fit our sample galaxies in the size-luminosity plane of each filter in Figure 2. The best-fit parameters are summarized in Table 2. We re-iterate that for this initial analysis, we have limited ourselves to relatively bright galaxies , and have neglected the effects of potential incompleteness bias and lensing magnification. We will revisit these issues in future work, after the completion of the campaign.
The red dash lines indicate the baseline measured in F444W, for comparison of galaxy size at different rest-frame wavelengths. The median size is pc, and slightly decreases from pc in rest-frame optical to pc in rest-frame UV. The scatter, , does not vary significantly across the filters.
In one of the panels (F150W), we show the best-fit relation of Lyman-break galaxies from Shibuya et al. (2015), measured based on HST images, which is consistent with our results. As a comparison to lower redshift, we also show the best-fit relation of Lyman-break galaxies from Huang et al. (2013).
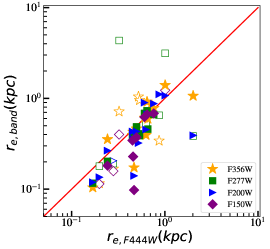
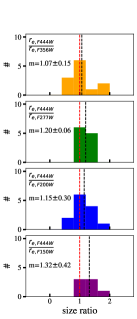
Lastly, we compare the sizes obtained from the F444W band to those obtained with the other four bluer bands on an individual basis in Figure 3. In the left panel, we see that the average and median galaxy sizes becomes smaller at shorter wavelengths, with F150W the most significantly different one. In the right panel, we demonstrate the size ratio distribution and find the median values are , , and for /, /, /, and /, respectively.
| Filter | /kpc | ||
|---|---|---|---|
| F444W | 4800 | -0.22 0.06 | 0.52 0.10 |
| F356W | 3900 | -0.21 0.10 | 0.78 0.18 |
| F277W | 3000 | -0.29 0.08 | 0.63 0.16 |
| F200W | 2200 | -0.29 0.08 | 0.76 0.15 |
| F150W | 1600 | -0.35 0.12 | 0.76 0.23 |
5 Discussion & Conclusions
In the spirit of a preliminary exploration, we re-fit the size-luminosity relation allowing the slope to vary. These results should be taken with a grain of salt considering the small sample size. We find that the slopes in F444W, F356W, F277W, F200W and F150W are , , , and , respectively. The slopes in F444W, F356W F277W, and F200W bands are in agreement with the slope assumed in the analysis above, . However, the slope in F150W (rest UV) is marginally steeper than that, and rather consistent with the results reported from several studies that analysed lensed galaxies in the Hubble Frontier Fields (Kawamata et al., 2018; Bouwens et al., 2022; Yang et al., 2022). We note that the tentative steepening is driven by the smallest and faintest galaxies which might not be resolved by HST without lensing. If confirmed by larger samples, it would imply that the UV size-luminosity might be a broken power-law, i.e., a flatter slope at the brighter end and a steeper slope at the fainter end as suggested by Bouwens et al. (2022).
We have shown that the median size decrease slightly from the optical to the far UV, pc, to pc at . However, we stress that the effect is small and less than we would have expected if the UV emission were confined in a small star forming region surrounded by a larger envelope of older stars.
The moderate size variation as a function of wavelength is consistent with the analysis of other morphological parameters, i.e. the Gini structural parameter, M20, concentration, asymmetry and smoothness, reported in the companion paper by Treu et al. (2022b). We refer the reader to Treu et al. (2022b) for more discussion of the physical interpretation of our findings. We just caution the reader that our results apply to galaxies selected primarily through the Lyman Break technique. Heavily dust obscured or fully quiescent galaxies (if they exist) would not of course be described by our findings.
We also report a tentative detection of a steepening of the slope toward fainter end in the bluest UV filter.
In the future, after the completion of the campaign, we will revisit this work by including the entire sample, correcting the incompleteness bias, and taking the potential lensing effect into consideration.
Acknowledgments
References
- Bergamini et al. (2022) Bergamini, P., Acebron, A., Grillo, C., et al. 2022, arXiv:2207.09416, arXiv:2207.09416. https://arxiv.org/abs/2207.09416
- Birrer & Amara (2018) Birrer, S., & Amara, A. 2018, Physics of the Dark Universe, 22, 189, doi: 10.1016/j.dark.2018.11.002
- Birrer et al. (2015) Birrer, S., Amara, A., & Refregier, A. 2015, ApJ, 813, 102, doi: 10.1088/0004-637X/813/2/102
- Birrer et al. (2021) Birrer, S., Shajib, A., Gilman, D., et al. 2021, The Journal of Open Source Software, 6, 3283, doi: 10.21105/joss.03283
- Bouwens et al. (2022) Bouwens, R. J., Illingworth, G. D., van Dokkum, P. G., et al. 2022, ApJ, 927, 81, doi: 10.3847/1538-4357/ac4791
- Castellano et al. (2022) Castellano, M., Fontana, A., Treu, T., et al. 2022, arXiv e-prints, arXiv:2207.09436. https://arxiv.org/abs/2207.09436
- Conselice (2014) Conselice, C. J. 2014, ARA&A, 52, 291, doi: 10.1146/annurev-astro-081913-040037
- Ding et al. (2020) Ding, X., Silverman, J., Treu, T., et al. 2020, ApJ, 888, 37, doi: 10.3847/1538-4357/ab5b90
- Doyon et al. (2012) Doyon, R., Hutchings, J. B., Beaulieu, M., et al. 2012, in Society of Photo-Optical Instrumentation Engineers (SPIE) Conference Series, Vol. 8442, Space Telescopes and Instrumentation 2012: Optical, Infrared, and Millimeter Wave, ed. M. C. Clampin, G. G. Fazio, H. A. MacEwen, & J. Oschmann, Jacobus M., 84422R, doi: 10.1117/12.926578
- Ferruit et al. (2022) Ferruit, P., Jakobsen, P., Giardino, G., et al. 2022, A&A, 661, A81, doi: 10.1051/0004-6361/202142673
- Fukugita et al. (1996) Fukugita, M., Ichikawa, T., Gunn, J. E., et al. 1996, AJ, 111, 1748, doi: 10.1086/117915
- Grazian et al. (2012) Grazian, A., Castellano, M., Fontana, A., et al. 2012, A&A, 547, A51, doi: 10.1051/0004-6361/201219669
- Holwerda et al. (2015) Holwerda, B. W., Bouwens, R., Oesch, P., et al. 2015, ApJ, 808, 6, doi: 10.1088/0004-637X/808/1/6
- Huang et al. (2013) Huang, K.-H., Ferguson, H. C., Ravindranath, S., & Su, J. 2013, ApJ, 765, 68, doi: 10.1088/0004-637X/765/1/68
- Jakobsen et al. (2022) Jakobsen, P., Ferruit, P., Alves de Oliveira, C., et al. 2022, A&A, 661, A80, doi: 10.1051/0004-6361/202142663
- Kawamata et al. (2018) Kawamata, R., Ishigaki, M., Shimasaku, K., et al. 2018, ApJ, 855, 4, doi: 10.3847/1538-4357/aaa6cf
- Kawinwanichakij et al. (2021) Kawinwanichakij, L., Silverman, J. D., Ding, X., et al. 2021, ApJ, 921, 38, doi: 10.3847/1538-4357/ac1f21
- Leethochawalit et al. (2022) Leethochawalit, N., Trenti, M., Santini, P., et al. 2022, arXiv e-prints, arXiv:2207.11135. https://arxiv.org/abs/2207.11135
- Ma et al. (2018) Ma, X., Hopkins, P. F., Boylan-Kolchin, M., et al. 2018, MNRAS, 477, 219, doi: 10.1093/mnras/sty684
- Marshall et al. (2022) Marshall, M. A., Wilkins, S., Di Matteo, T., et al. 2022, MNRAS, 511, 5475, doi: 10.1093/mnras/stac380
- Medezinski et al. (2016) Medezinski, E., Umetsu, K., Okabe, N., et al. 2016, ApJ, 817, 24, doi: 10.3847/0004-637X/817/1/24
- Merlin et al. (2022) Merlin, E., Bonchi, A., Paris, D., et al. 2022, arXiv e-prints, arXiv:2207.11701. https://arxiv.org/abs/2207.11701
- Morishita et al. (2014) Morishita, T., Ichikawa, T., & Kajisawa, M. 2014, ApJ, 785, 18, doi: 10.1088/0004-637X/785/1/18
- Oke & Gunn (1983) Oke, J. B., & Gunn, J. E. 1983, ApJ, 266, 713, doi: 10.1086/160817
- Ono et al. (2013) Ono, Y., Ouchi, M., Curtis-Lake, E., et al. 2013, ApJ, 777, 155, doi: 10.1088/0004-637X/777/2/155
- Peng et al. (2002) Peng, C. Y., Ho, L. C., Impey, C. D., & Rix, H.-W. 2002, AJ, 124, 266, doi: 10.1086/340952
- Rieke et al. (2005) Rieke, M. J., Kelly, D., & Horner, S. 2005, in Society of Photo-Optical Instrumentation Engineers (SPIE) Conference Series, Vol. 5904, Cryogenic Optical Systems and Instruments XI, ed. J. B. Heaney & L. G. Burriesci, 1–8, doi: 10.1117/12.615554
- Roberts-Borsani et al. (2022) Roberts-Borsani, G., Morishita, T., Treu, T., et al. 2022, arXiv e-prints, arXiv:2207.11387. https://arxiv.org/abs/2207.11387
- Roper et al. (2022) Roper, W. J., Lovell, C. C., Vijayan, A. P., et al. 2022, MNRAS, doi: 10.1093/mnras/stac1368
- Sersic (1968) Sersic, J. L. 1968, Atlas de Galaxias Australes
- Shen et al. (2003) Shen, S., Mo, H. J., White, S. D. M., et al. 2003, MNRAS, 343, 978, doi: 10.1046/j.1365-8711.2003.06740.x
- Shibuya et al. (2015) Shibuya, T., Ouchi, M., & Harikane, Y. 2015, ApJS, 219, 15, doi: 10.1088/0067-0049/219/2/15
- Treu et al. (2022a) Treu, T., Roberts-Borsani, G., Bradac, M., et al. 2022a, arXiv e-prints, arXiv:2206.07978. https://arxiv.org/abs/2206.07978
- Treu et al. (2022b) Treu, T., Calabro, A., Castellano, M., et al. 2022b, arXiv e-prints, arXiv:2207.13527. https://arxiv.org/abs/2207.13527
- Wu et al. (2020) Wu, X., Davé, R., Tacchella, S., & Lotz, J. 2020, MNRAS, 494, 5636, doi: 10.1093/mnras/staa1044
- Yang et al. (2021) Yang, L., Roberts-Borsani, G., Treu, T., et al. 2021, MNRAS, 501, 1028, doi: 10.1093/mnras/staa3713
- Yang et al. (2022) Yang, L., Leethochawalit, N., Treu, T., et al. 2022, MNRAS, 514, 1148, doi: 10.1093/mnras/stac1236