Perun: Performance Version System
Abstract
In this paper, we present Perun: an open-source tool suite for profiling-based performance analysis. At its core, Perun maintains links between project versions and the corresponding stored performance profiles, which are then leveraged for automated detection of performance changes in new project versions. The Perun tool suite further includes multiple profilers (and is designed such that further profilers can be easily added), a performance fuzz-tester for workload generation, methods for deriving performance models, and numerous visualization methods. We demonstrate how Perun can help developers to analyze their program performance on two examples: detection and localization of a performance degradation and generation of inputs forcing performance issues to show up.
Supplementary materials—git repository [1], demo video and replication package [2].
Index Terms:
version system, profiling, performance analysis, fuzz-testing, performance testing.I Introduction
Performance bugs are a common problem in software development, often encountered during new software releases. Despite such bugs need not crash the software, neglecting them can lead to losing the customers’ trust. Moreover, the need of efficient software is nowadays becoming more important than ever due to the rising scale of software and growing pressure on saving resources such as, e.g., battery power on mobile devices [3] or the huge power consumption of computing centers [4]. Finally, software performance is also a matter of security as performance bugs can be exploited to effectively kill a system by some form of a denial-of-service attack (DoS), making it run exceptionally long on some inputs.
Profiling-based analysis is arguably one of the most widely adopted techniques used when analysing software performance. Here, profiling means monitoring a running program and collecting performance-related data, e.g., function call counts, function run times, etc. These then need to be analysed and possibly compared with previous profiling results to identify the most costly functions (often called hotspots or bottlenecks), to see whether some performance degradation did happen, and if so, what the root cause may be (and even if no degradation happened, what the main targets for further optimisation should be).
The described process is laborious and moreover repeating. Indeed, before every new software release (at the latest), one should profile the new version, analyze the results, compare them with past profiling, and store the results for future profiling. Hence, it is highly desirable to automate the process as much as possible. However, while there exist various widely-used open-source profilers (e.g., GNU gprof or Callgrind), we are not aware of any actively-maintained open-source solution that would cover profiling-based performance analysis in a complex way. Here, by complex, we mean solutions not focusing just on collecting various performance metrics (on time, memory, energybut also on other needed steps (degradation detection, workload generation, etc.).
Perun has been designed to address the above gap and provide developers with automated, extensible, open-source support of the entire process of performance analysis. In line with this, Perun covers the following tasks: 1) The core of Perun provides storage for performance profiles (i.e., results of profiling) for all project versions (chosen by the developer) and maintains links between the project versions and the corresponding profiles. 2) Perun includes a highly configurable runtime profiler called Tracer capable of collecting various data about profiled C/C++ functions 111In fact, Tracer can profile any executable (not just C/C++) with a symbol table. However, making sense of the profiling output for, e.g., executables compiled from automatically generated code may be difficult since the symbol table will likely contain a large number of functions unknown to the developer. (note that the rest of Perun is language-agnostic), several other profilers, and a wrapper-based support for adding profilers on further metrics and/or languages. 3) Perun also supports fuzz-testing for generating suitable inputs for programs under performance analysis (i.e., the so-called workloads). 4) Further, Perun implements methods for deriving performance models from saved profiles as well multiple methods for automated detection of performance degradations, including creeping ones (which require one to look deeper into the history of profiles than just to the immediate predecessor), in new project versions. 5) Finally, Perun also includes various methods for visualising the obtained performance data and their models.
Below, we first describe the architecture of Perun and the methods implemented in it, and then discuss various ways in which it can be used. We illustrate the usefulness of Perun on two concrete tasks. First, we show how it can be used to automatically detect and locate a degradation between two software versions, namely a recent performance degradation introduced in the 3.11.0a7 version of the CPython interpreter [5]. Second, we present how Perun can be used to automatically generate inputs that force performance issues to manifest, e.g., to test different hashing algorithms or vulnerability against ReDoS (regex denial of service) attacks.
II Architecture of Perun
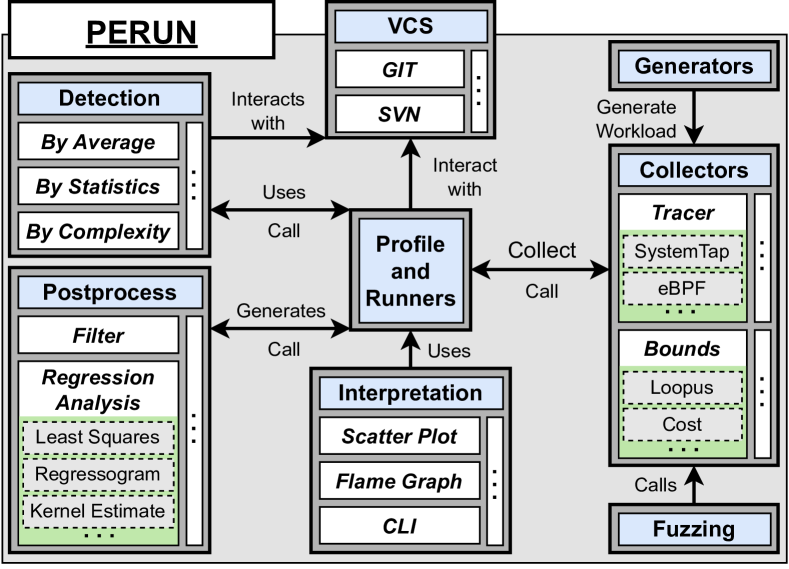
Perun consists of a tool suite and a wrapper over Version Control Systems (VCS), such as git, that keeps track of performance profiles for different project versions. Figure 2 shows the architecture of Perun. It builds on a generic JSON-based format for storing performance profiles and other artifacts (e.g., performance models). To implement a flexible and extensible automation of its various supported tasks, Perun uses so-called runners that manage jobs: sequences of calls of individual tools from its tool suite, i.e., data collectors, methods deriving performance models, detection methods, or tools used for interpretation of the results (e.g., various visualisation methods). Jobs may produce profiles or other results (such as performance models). Perun’s tools share a simple API, and developers can therefore easily register their own tools. Moreover most Perun’s tools are highly configurable, allowing their fine-tuning based on domain knowledge of the profiled program. Perun also contains workload generators: a fuzz-tester focused on generating time-consuming workloads or automatic generators of gradually scaled workloads (e.g., longer and longer files) that are fed to the profiled program.
Perun’s current profilers mainly focus on profiling the runtime of functions or programs. The main runtime profiler is Tracer (described in more detail below). Perun further includes a lightweight runtime profiler with minimum overhead that is simply a wrapper over the Unix time utility as well as a memory profiler, which is, however, so far experimental and not too scalable. Other profilers (such as Callgrind) can be easily added to Perun in a similar fashion as time.
Below, we describe selected tools of Perun in more detail.
Tracer
Tracer leverages multiple instrumentation frameworks to monitor programs and measure the runtime of C/C++ functions while also keeping track of the call hierarchy (i.e., the caller-callee relations). Tracer currently supports the SystemTap [6] and the eBPF [7, 8] frameworks, and can be extended by other frameworks. SystemTap injects instrumentation probes into the profiled program through an on-demand-compiled kernel module; while eBPF applies a more dynamic approach based on a lightweight in-kernel virtual machine allowing better dynamic probe runtime manipulation (e.g., probe activation/deactivation). Due to its rich parameterization, Tracer is highly configurable, e.g., by choosing the instrumentation framework, the functions to be monitored, or the frequency with which they should be monitored.
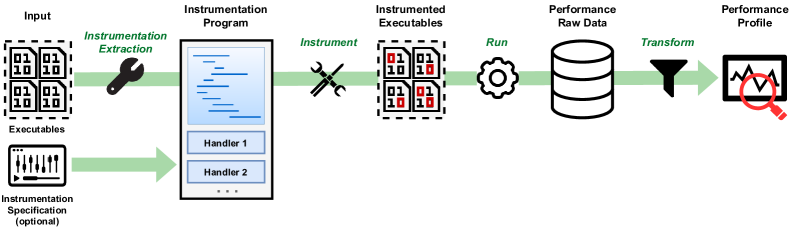
Tracer works as follows: 1. It is invoked with the target executables (including libraries). The functions to be instrumented can be specified by the user or extracted from the executables automatically. 2. For every instrumented function, Tracer assembles and compiles handlers that generate the performance data. 3. It instruments the target executables, invokes the profiled program and collects performance data until the program terminates or a timeout is reached. More precisely, the collected data are in the form of time stamps recorded at the entry and exit of each instrumented function. 4. Finally, the raw performance data are parsed into a profile. Figure 1 illustrates the Tracer workflow.
Models and Detection Techniques
Perun allows one to summarize profiles into performance models mostly having the form of functions mapping input sequence numbers to the expected runtime. By suitably constructing the workload, the users can then get, e.g., the classical complexity models (this is, Big-O classes such as linear, quadratic, etc.) showing the dependence of runtime on the size of the input (by the workload exercising the program/function for larger and larger inputs), or to see how the performance is changing over time (by providing inputs as they would arrive in time). Such workloads can be generated by workload generators coming with Perun or implemented by the users. The derived models are then used in Perun’s performance degradation detection methods and/or visualization methods.
Perun currently supports four kinds of methods of deriving performance models: the least-square regression line, regressogram, moving average, and kernel regression line (for their details, see, e.g., [9, 10] or the Perun’s documentation). For each function/profile we can, naturally, have multiple models. Perun implements multiple methods of detecting changes in the performance, ranging from simple heuristics to more elaborate techniques, building on well-known principles from the complexity theory [11, 12, 13], statistics [14] and calculus [15]. Each method can be applied to each pair of profiles (or models obtained from them) for the same functions in any pair of versions of the program under analysis.
Here are three examples of the detection methods: 1. The best model-order equality builds models representing various asymptotic complexity classes of the involved functions (linear, quadratic, etc.), selects those that are statistically the most precise (based on values of coefficients of determination ) for the respective functions, and compares the orders of the models considered the most precise for different versions of a given function (e.g., the change from a linear to a quadratic model of a function indicates a performance degradation). 2. The integral comparison approach is a heuristic based on an assumption that the area under the performance models viewed as mathematical functions (e.g., linear, quadratic, logarithmic functions obtained by regression analysis) should stay approximately the same: the technique thus computes and compares the integrals of the most precise models. This approach may in particular be used as a complement of the best model-order equality, where one sometimes gets a model of a higher order for a new software version but with such coefficients that make it practically the same as the previously derived model of a lower order (on the considered range of inputs). One can thus reduce the number of likely false alarms. 3. The exclusive-time outliers checks whether the function’s exclusive runtime (not including the runtime of the functions it calls) changes so much it becomes an outlier w.r.t. other functions. In particular, this method utilizes three well-known statistical techniques for outlier detection using well-established thresholds for comparison: the modified z-score (), interquartile range (), and standard deviation ().
Performance Fuzzing
Perun’s tool suite includes Perun-fuzz: an automated fuzz-testing generator of workloads focused on triggering performance issues. Fuzz-testing is an approach of automated testing that feeds a program with randomised or mutated inputs to force unexpected/untested behaviour. However, most of the existing approaches focus only on manifesting program crashes, memory leaks, or failed assertions; not on manifesting performance issues.
Well-established fuzzers, such as afl [16], often build on mutation rules that work on the level of bits in the binary encoding of program inputs, for which, in our experience, it may be difficult to derive inputs that could make performance issues to surface. For Perun-fuzz, we developed mutation rules inspired by various known performance issues such as the following ones developed specifically for text-file inputs: “double the size of a line” (inspired by the issues of the gedit editor with long lines), “repeat a random word on a line” (to force issues, e.g., in hash tables), “sort words or numbers on a line” (to force issues in algorithms expecting randomly sorted inputs), or “prepend whitespaces” (inspired by the issues of Stack Overflow [17] that froze this web site).
Whenever a new workload is derived, the gcov tool that measures code coverage (and counts also multiple visits of a location) is used for a quick check whether the mutation led to a coverage increased by more than some threshold. If so, Perun is used to profile the program and to check whether some performance degradation did indeed happen and where.
Limitations
Perun currently has the below limitations: 1. It relies mostly on dynamic analysis, hence its analyses are limited to seen runtime behaviour. 2. Detectable performance changes are limited to those trackable by VCS; changes not reflected in VCS, such as values of environment variables or system/hardware settings, are not covered. 3. Perun’s profiler suite is limited; it needs to be extended to support profiling of, e.g., memory or energy consumption, and/or other languages than C/C++. 4. Finally, Perun is limited to Linux systems, with Tracer needing a sufficiently recent kernel. 5. Perun-fuzzis limited to text-file inputs.
III Usage of Perun
The most common usage of Perun is to analyze newly released program versions. The usual scenario goes as follows: 1. The user makes a set of code changes and commits them into the repository of the program of interest. 2. The commit triggers a new build of the program, and Tracer is used over the resulting binary to collect new performance profiles of the involved functions. 3. New performance models of the functions are derived and stored. 4. Profiles and models of the functions from the previous version are retrieved from the persistent storage of Perun. 5. For each pair of corresponding previous and new profiles (or performance models, depending on the detection method used), a selected performance degradation detection method is run. 6. The method returns a set of located performance changes with their severity (i.e., how good or bad the change is), location (i.e. where the change has happened), and confidence (i.e., how likely the change is real).
Another common usage scenario for Perun is in debugging. In its case, one can use the rich parameterization of Tracer to switch between quick and thorough profiling while, e.g., trying to locate some suspected bottlenecks or opportunities for optimisation. To help this process, some of the workload generators (generating, e.g., random files) or the performance fuzzer Perun-fuzz may be used. Further, to help understanding what happens with performance in a given program, various well-established visualizations of profiles and models implemented in Perun can be used. These include, e.g., scatter plots, bar plots, flamegraphs, or flowgraphs—with several more in the works (for some samples, see the appendix or [2]).
Perun can be used through its rich command-line interface, but it can also be easily integrated with git hooks or other continuous integration solutions so that checks for performance degradation are triggered automatically upon a commit. Moreover, adapters based on OSLC [18] and the Unite and Unic tools [19, 20] are available for using Perun as a web service and for its integration with the Eclipse IDE.
IV Illustrative Examples
We now demonstrate how Perun and its tool suite can aid developers with two common performance analysis tasks.
Finding Performance Degradations
First, we will focus on showing how Perun can help with identifying a performance degradation and its root cause. In particular, we will illustrate this on the CPython project where a recent release of the ver. 3.11.0a7 introduced a performance degradation compared to the ver. 3.10.4. The problem appeared in the ctypes module222https://github.com/python/cpython/issues/92356. The developer who discovered the bug has already proposed a fix, which has been merged into the upstream. Below, we replicate the issue and detect it with Perun.
CPython comes with a benchmarking suite pyperformance that is used to evaluate the performance of various modules. However, this particular issue has not been detected by these benchmarks. Since the bug was reported and fixed, a new benchmark targeting the ctypes module has been implemented and is currently pending as a pull request at the time of writing of this paper. Although the new benchmark now retrospectively detects the presence of the ctypes performance degradation, finding the exact source of the issue can still pose a challenge as it requires a manual inspection of all relevant code changes since the last version.
Perun and its version-sensitive performance analysis can nicely complement the benchmarking approach by automatically flagging the offending function(s), thus aiding the developers in promptly hotfixing the issue.
Our experiments with CPython were performed on a machine with an Intel i7-4770 CPU at 3.4 GHz with 4 cores, 32 GiB RAM running Linux Fedora 34 with the x86-64 architecture. The system uses a custom-compiled version of the kernel 5.11.15-300. The custom kernel is necessary to change the default linux instrumentation limit of uprobes nestedness333See the corresponding commit introducing the change: https://github.com/torvalds/linux/commit/ded49c55309a37129dc30a5f0e85b8a64e5c1716 (used by both SystemTap and eBPF). The limit is generally acceptable for small to medium scale programs, however, it is too restrictive for large-scale applications, such as CPython. Furthermore, each Perun profile consists of benchmark repetitions preceded by warm-up benchmark runs, using the default configuration as set in the pyperformance benchmark444See the benchmark PR: https://github.com/python/pyperformance/pull/197.
In our experiment, we did the following steps, simulating what the developers could have done with Perun when going between the mentioned versions: 1. We collected a baseline profile of the ctypes benchmark, linked to the 3.10.4 release (normally, it would already be stored in Perun). 2. For the CPython version 3.11.0a7, we ran perun collect with the same profiling configuration of the ctypes benchmark as for the 3.10.4 release and obtained a target profile for the release 3.11.0a7. 3. Next, we ran perun check profiles to perform an automated detection of performance changes between the baseline and target profiles. We chose the exclusive time outliers method for detecting the degradation. 4. The check successfully identified the two functions that were responsible for the performance degradation as shown in Table I. TABLE I: Performance regression details of ctypes as reported by the exclusive time outliers. The two functions responsible for the majority of the slowdown are highlighted. Location Result [ms] [%] _ctypes_init_fielddesc NotInBaseline 77.95 5.23 _ctypes_get_fielddesc SevereDegradation 52.9 3.55 _ctypes_callproc Degradation 2.84 0.19 … _ctypes.cpython-311 TotalDegradation 136.92 9.19 The () is the absolute (relative) exclusive time change w.r.t. the total duration of the program or library which contains the function. Note that the total degradation we measured is comparable to the degradation of around 8 % reported in the original issue. 5. We created a hotfix in a new VCS branch hotfix-issue-92357 and repeated the profiling to obtain a new target profile for the branch hotfix-issue-92357. 6. Finally, we checked that the fix was successful: we ran perun check profiles using the original baseline and the new target profiles. This time, the check report given in Table II shows that both of the previously degraded functions have comparable performance with the release 3.10.4 (see the table below). Note that the ctypes module still reports a minor degradation, corresponding to the pyperformance benchmarking results.
| Location | Result | [ms] | [%] |
|---|---|---|---|
| _ctypes_callproc | SevereDegradation | 9.7 | 0.7 |
| … | |||
| _ctypes_get_fielddesc | MaybeDegradation | 0.89 | 0.06 |
| _ctypes_init_fielddesc | NotInBaseline | 0.02 | 0.00 |
| _ctypes.cpython-311 | TotalDegradation | 23.45 | 1.70 |
In the usual profiling scenario, should the developer wish to continue with optimizations, the next most severe degradation would be targeted next. The exclusive time outliers method aids the developer with this effort and reports a new severe degradation, relative to the other found degradations: _ctypes_callproc. To define a stopping point for this workflow, a cut-off threshold for can be set, so that no degradations or improvements below this threshold are reported.
For detection of creeping performance degradations, one can utilize the same approach as above with a slight modification only. Namely, the baseline profile should be selected such that it corresponds to an older project version or release.
Inferring Interesting Workloads
In our second example, we will demonstrate how to automatically generate workloads suitable for performance analysis. In this example, we will use minimalistic single-purpose projects. We believe that such programs are enough at least if our goal is to find workloads for testing specific code patterns.
In particular, we will generate workloads to (1) identify potentially expensive regex matching and (2) to compare the efficiency of various hash functions used to implement a hash table. All experiments with inferring the interesting workloads were run on a Lenovo G580 machine with an Intel Core i3-3110M CPU at 2.40 GHz using 4 cores, 4 GiB RAM, and Ubuntu 18.04.2 LTS. For each experiment, we list the size of each workload denoted as (with the starting, manually prepared workload denoted as ), the runtime of the program under test on the given workload, the slowdown w.r.t. the runtime on the seed, and the number of mutation rules that led to the workload.
First, we focus on regex matching that can be very expensive for some matchers
and some regexes, potentially admitting a ReDoS (Regex Denial of Service)
attack [21, 17, 22].
These were reported in various applications, e.g., the following regex used for
Java classname validation [21]:
^(([a-z])+.)+[A-Z]([a-z])+$.
The issue here is that the developer did not escape the ‘.’
character, which makes some matchers to perform an excessive number of
backtracking steps on some non-matching words.
We tested the std::regex_search function with several offending regexes that can cause ReDoS attacks. In Table III, we present results for the above Java Classname validation regex. For other regexes and results, see [2].
| Java Class validation regex [21] | ||||
|---|---|---|---|---|
| Input | Size [B] | Time [s] | Slowdown | Used rules |
| seed | 19 | 0.005 | - | - |
| 19 | 0.016 | 3.2 | 9 | |
| 36 | 1.587 | 317.4 | 6 | |
| 78 | timeout (13h) | 5 | ||
The results in Table III show that, at least for the considered regexes, we can find workloads possibly triggering ReDoS attacks with only a few applications of our mutation rules. Indeed, some generated inputs were only 4x bigger than the seed, yet leading to a timeout of thirteen hours.
Finally, we tested a simple word frequency counter that uses a hash table. We compared its performance using two different hash functions: (1) the hash function used in the Java 1.1 string library, which examined only 8–9 evenly spaced characters, and, (2) the DJB hash function [23], one of the most efficient hash functions. The results in Table IV show that with increasing sizes of the workload, the DJB hash function does indeed perform in a much more stable way compared to the inefficient implementation of Java 1.1.
| Work | Java 1.1. | DJB | |||
|---|---|---|---|---|---|
| Input | Size [kB] | Time [s] | Slowdown | Time [s] | Slowdown |
| seed | 210 | 0.026 | - | 0.013 | - |
| 458 | 0.115 | 4.4 | 0.027 | 2.1 | |
| 979 | 0.187 | 7.19 | 0.043 | 3.3 | |
V Related Work
Perhaps the closest solution to Perun is PerfRepo [24] whose idea is similar to what Perun aims to achieve, but it covers profiling-based analysis in a less complex way (e.g., it does not include a profiler, workload generation, etc.) and it lacks a tight VCS integration (this is, it lacks built-in linkage between profiles and project VCS versions). Moreover, its development seems to be discontinued, based on the GitHub repository activity. Kieker [25] provides a tool suite for performance data collection and results interpretation but lacks any form of project version context. Valgrind [26], a widely-adopted profiling tool suite, lacks support for results comparison, and VCS/CI integration.
A range of individual profilers, either sampling or event-based, for heap, memory or CPU profiling exist. We can list, e.g., OProfile [27], Perf [28], GNU gprof [29], or gperftools [30]. Furthermore, we can mention various commercial solutions such as, e.g., the Intel V-Tune Profiler [31], AMD Prof [32], Arm MAP [33], or the Oracle Developer Studio Performance Analyzer [34]. Additionally, there are other performance analysis tools based on machine learning [35], code patterns [36], learning from performance bug trackers [37], automated and compositional load test generation [38, 39], checking correlation between performance testing results [40], clustering and comparing performance counters [41], or using statistical process control techniques [42]. However, these tools do either not provide as complex coverage of profiling-based performance analysis as Perun does (being often restricted to profiling only) and/or they are not open source, often quite expensive and/or coming with some additional hardware or software requirements for unlocking their full potential.
Finally, as for performance fuzzing, the only tools of this kind we are aware of are Perffuz [43] and Badger [44]. Unlike Perun-fuzz, which is, however, just one part of Perun, they use other fuzzing rules, working on the binary level as in afl (Badger combines fuzzing with symbolic execution too). As an alternative to performance fuzzing, causal profiling [45] aims at finding particular functions to optimise (by slowing down other functions to virtually simulate the speed-up). PerfBlower [46] forces memory-related errors by amplifying their effects on performance. A support of such techniques could be added to Perun in the future.
VI Conclusion
Perun is a new, open-source framework for managing project’s performance throughout its development history and for debugging performance-related issues. It links performance profiles to their respective project versions to keep the context of performance changes, and, moreover, comes with a comprehensive suite of performance tools that collect, analyze, model and visualize performance data. As for the future, we are working on further performance data collectors, visualisation methods, as well as optimisations of the profiling process. We plan to use various statically or dynamically collected pieces of information to leave out functions with minimal performance impact from the profiling (or to profile them sparsely only).
Acknowledgement. The work was supported by the project 20-07487S of the Czech Science Foundation and the Brno Ph.D. Talent Scholarship Programme.
References
- [1] T. Fiedor and J. Pavela, “Perun: Lightweight Performance Version System.” [Online]. Available: https://github.com/tfiedor/perun
- [2] ——, “Perun Tool Demonstration Website.” [Online]. Available: https://www.fit.vutbr.cz/research/groups/verifit/tools/perun-demo/
- [3] D. Ferreira, A. Dey, and V. Kostakos, “Understanding Human-Smartphone Concerns: A Study of Battery Life,” in Proc. of Pervasive Computing, 2011.
- [4] M. Dayarathna, Y. Wen, and R. Fan, “Data Center Energy Consumption Modeling: A Survey,” IEEE Commun. Surv. Tutorials, vol. 18, no. 1, pp. 732–794, 2016.
- [5] “CPython: The Python programming language.” [Online]. Available: https://github.com/python/cpython
- [6] V. Prasad, W. Cohen, F. Eigler, M. Hunt, J. Keniston, and B. Chen, “Locating System Problems Using Dynamic Instrumentation,” in Proc. of Linux Symposium’05, 2005.
- [7] S. McCanne and V. Jacobson, “The BSD Packet Filter: A New Architecture for User-Level Packet Capture,” in Proc. of USENIX’93, 1993.
- [8] J. Corbet, “BPF: the universal in-kernel virtual machine.” [Online]. Available: https://lwn.net/Articles/599755/
- [9] J. L. Devore, Probability and Statistics for Engineering and the Sciences, 8th ed. Brooks/Cole, 2011, ISBN-13: 978-0-538-73352-6.
- [10] K. Takezawa, Introduction to Nonparametric Regression, 1st ed. Wiley, 2006, ISBN-13: 978-0471745839.
- [11] E. Çiçek, M. Bouaziz, S. Cho, and D. Distefano, “Static Resource Analysis at Scale (Extended Abstract),” in Proc. of SAS’20, ser. LNPSE, vol. 12389. Springer, 2020.
- [12] “Cost: Runtime Complexity Analysis,” online. [Online]. Available: https://fbinfer.com/docs/checker-cost
- [13] M. Sinn, F. Zuleger, and H. Veith, “Complexity and Resource Bound Analysis of Imperative Programs Using Difference Constraints,” Journal of Automated Reasoning, vol. 59, no. 1, 2017.
- [14] B. Iglewicz and D. Hoaglin, How to Detect and Handle Outliers, ser. ASQC basic references in quality control. ASQC Quality Press, 1993.
- [15] NCSS, “Comparing Two ROC Curves – Independent Groups Design,” NCSS Statistical Software, Documentation, 2022.
- [16] M. Zalewski, “American Fuzzy Lop (AFL) Fuzzer—Technical Details,” 2018. [Online]. Available: http://lcamtuf.coredump.cx/afl/technical_details.txt
- [17] “Malformed Stack Overflow Post Chokes Regex, Crashes Site – ADTmag,” online. [Online]. Available: https://adtmag.com/Blogs/Dev-Watch/2016/07/stack-overflow-crash.aspx
- [18] OASIS, “Open Services for Lifecycle Collaboration,” https://open-services.net/, 2022.
- [19] O. Vašíček, “Unite – GitLab,” 2022. [Online]. Available: https://pajda.fit.vutbr.cz/verifit/unite
- [20] J. Fiedor, “Unic – GitLab,” 2022. [Online]. Available: https://pajda.fit.vutbr.cz/verifit/oslc-client
- [21] “OWASP Validation Regex Repository — OWASP Foundation,” online. [Online]. Available: https://owasp.org/www-community/OWASP_Validation_Regex_Repository
- [22] “Regular Expression Library,” online. [Online]. Available: https://regexlib.com/REDetails.aspx?regexp_id=1757
- [23] “.:: General Purpose Hash Function Algorithms - By Arash Partow ::.” online. [Online]. Available: http://www.partow.net/programming/hashfunctions/#DJBHashFunction
- [24] “Meet PerfRepo,” online. [Online]. Available: https://github.com/PerfCake/PerfRepo
- [25] A. van Hoorn, M. Rohr, W. Hasselbring, J. Waller, J. Ehlers, S. Frey, and D. Kieselhorst, “Continuous Monitoring of Software Services: Design and Application of the Kieker Framework,” Department of Computer Science, University of Kiel, Germany, Tech. Rep. TR-0921, 2009.
- [26] N. Nethercote and J. Seward, “Valgrind: A Framework for Heavyweight Dynamic Binary Instrumentation,” in Proc. of PLDI’07. ACM, 2007.
- [27] “OProfile - A System Profiler for Linux,” online. [Online]. Available: https://oprofile.sourceforge.io/news/
- [28] “Perf: Linux Profiling With Performance Counters,” online. [Online]. Available: https://perf.wiki.kernel.org/index.php/Main_Page
- [29] “GNU gprof,” online. [Online]. Available: https://sourceware.org/binutils/docs/gprof/index.html
- [30] “Gperftools,” online. [Online]. Available: https://github.com/gperftools/gperftools
- [31] “Intel V-Tune Profiler,” online. [Online]. Available: https://www.intel.com/content/www/us/en/developer/tools/oneapi/vtune-profiler.html
- [32] “AMD Prof,” online. [Online]. Available: https://developer.amd.com/amd-uprof/
- [33] “Arm MAP,” online. [Online]. Available: https://www.arm.com/products/development-tools/server-and-hpc/forge/map
- [34] “Oracle Developer Studio Performance Analyzer,” online. [Online]. Available: https://docs.oracle.com/cd/E77782_01/html/E77798/index.html
- [35] S. Tsakiltsidis, A. V. Miranskyy, and E. Mazzawi, “Towards Automated Performance Bug Identification in Python,” CoRR, vol. abs/1607.08506, 2016.
- [36] A. Nistor, L. Song, D. Marinov, and S. Lu, “Toddler: Detecting Performance Problems via Similar Memory-access Patterns,” in Proc. of ICSE’13. IEEE CS, 2013.
- [37] G. Jin, L. Song, X. Shi, J. Scherpelz, and S. Lu, “Understanding and Detecting Real-World Performance Bugs,” in Proc. of PLDI’12. ACM, 2012.
- [38] P. Zhang, S. G. Elbaum, and M. B. Dwyer, “Automatic Generation of Load Tests,” in Proc of ASE’11, 2011, pp. 43–52.
- [39] P. Zhang, S. Elbaum, and M. B. Dwyer, “Compositional Load Test Generation for Software Pipelines,” in Proc. of ISSTA’12, 2012, pp. 89–99.
- [40] K. C. Foo, Z. M. Jiang, B. Adams, A. E. Hassan, Y. Zou, and P. Flora, “Mining Performance Regression Testing Repositories for Automated Performance Analysis,” in Proc. of QSIC’10, 2010.
- [41] W. Shang, A. E. Hassan, M. N. Nasser, and P. Flora, “Automated Detection of Performance Regressions Using Regression Models on Clustered Performance Counters,” in Proc. of ICPE’15, 2015.
- [42] T. H. D. Nguyen, B. Adams, Z. M. Jiang, A. E. Hassan, M. N. Nasser, and P. Flora, “Automated Detection of Performance Regressions Using Statistical Process Control Techniques,” in Proc. of ICPE’12. ACM, 2012.
- [43] C. Lemieux, R. Padhye, K. Sen, and D. Song, “PerfFuzz: Automatically Generating Pathological Inputs,” in Proc. of ISSTA’18. ACM, 2018.
- [44] Y. Noller, R. Kersten, and C. S. Pasareanu, “Badger: Complexity Analysis with Fuzzing and Symbolic Execution,” in Proc. of ISSTA’18. ACM, 2018.
- [45] C. Curtsinger and E. D. Berger, “Coz: Finding Code That Counts with Causal Profiling,” Communications of the ACM, vol. 61, 2018.
- [46] L. Fang, L. Dou, and G. H. Xu, “PerfBlower: Quickly Detecting Memory-Related Performance Problems via Amplification,” in Proc. of ECOOP’15, 2015.
Appendix A Visualization Examples
Perun supports a number of visualization methods, namely bar plots, flow plots, flame graphs and scatter plots. In general, some visualizations may be applicable, or suitable, only for certain profile types. Below, we briefly discuss some of the supported visualisation means. To see the full gallery of Perun visualization capabilities, please visit the Perun tool page [2].
A-A Bar Plots
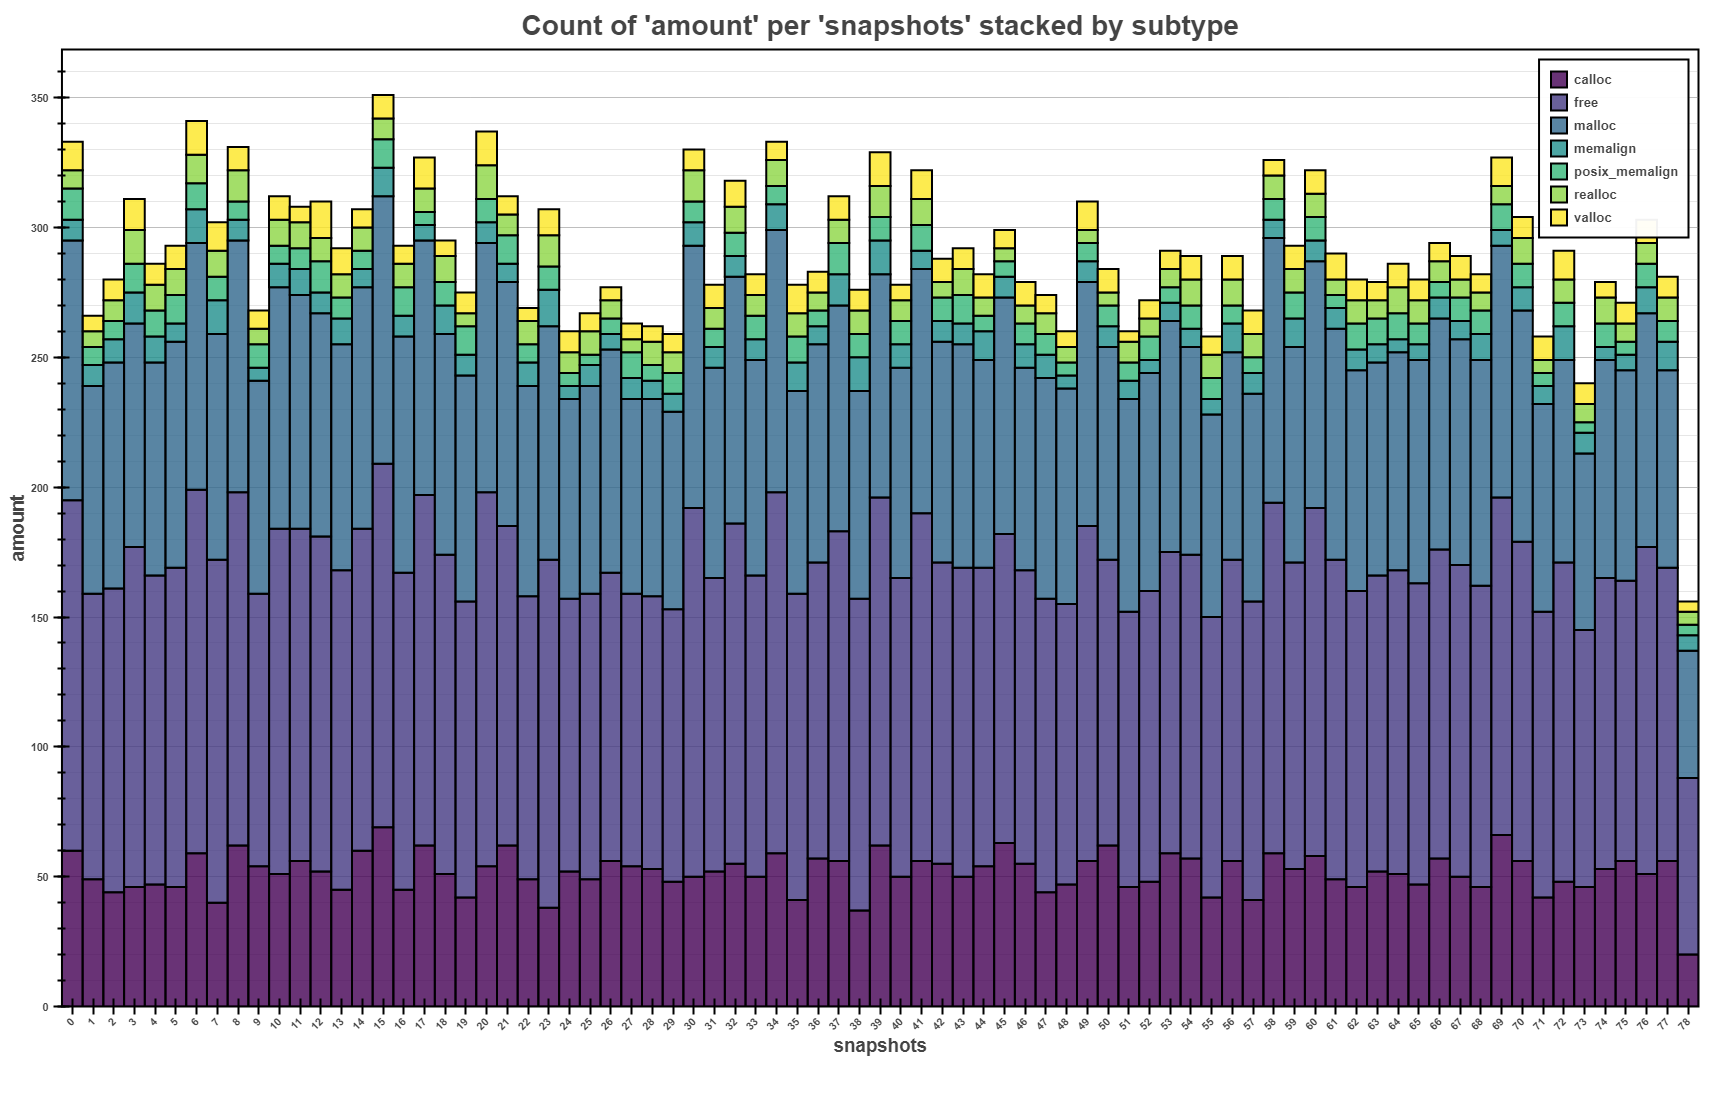
Bar plots depict collected data about consumed resources (e.g., runtime, memory consumption) as bars, which can be displayed in either a stacked or grouped format. Figure 3(a) shows an example of a stacked bar plot of memory consumption by different functions at regular time points during the run of a program (snapshots).
A-B Flow Plots
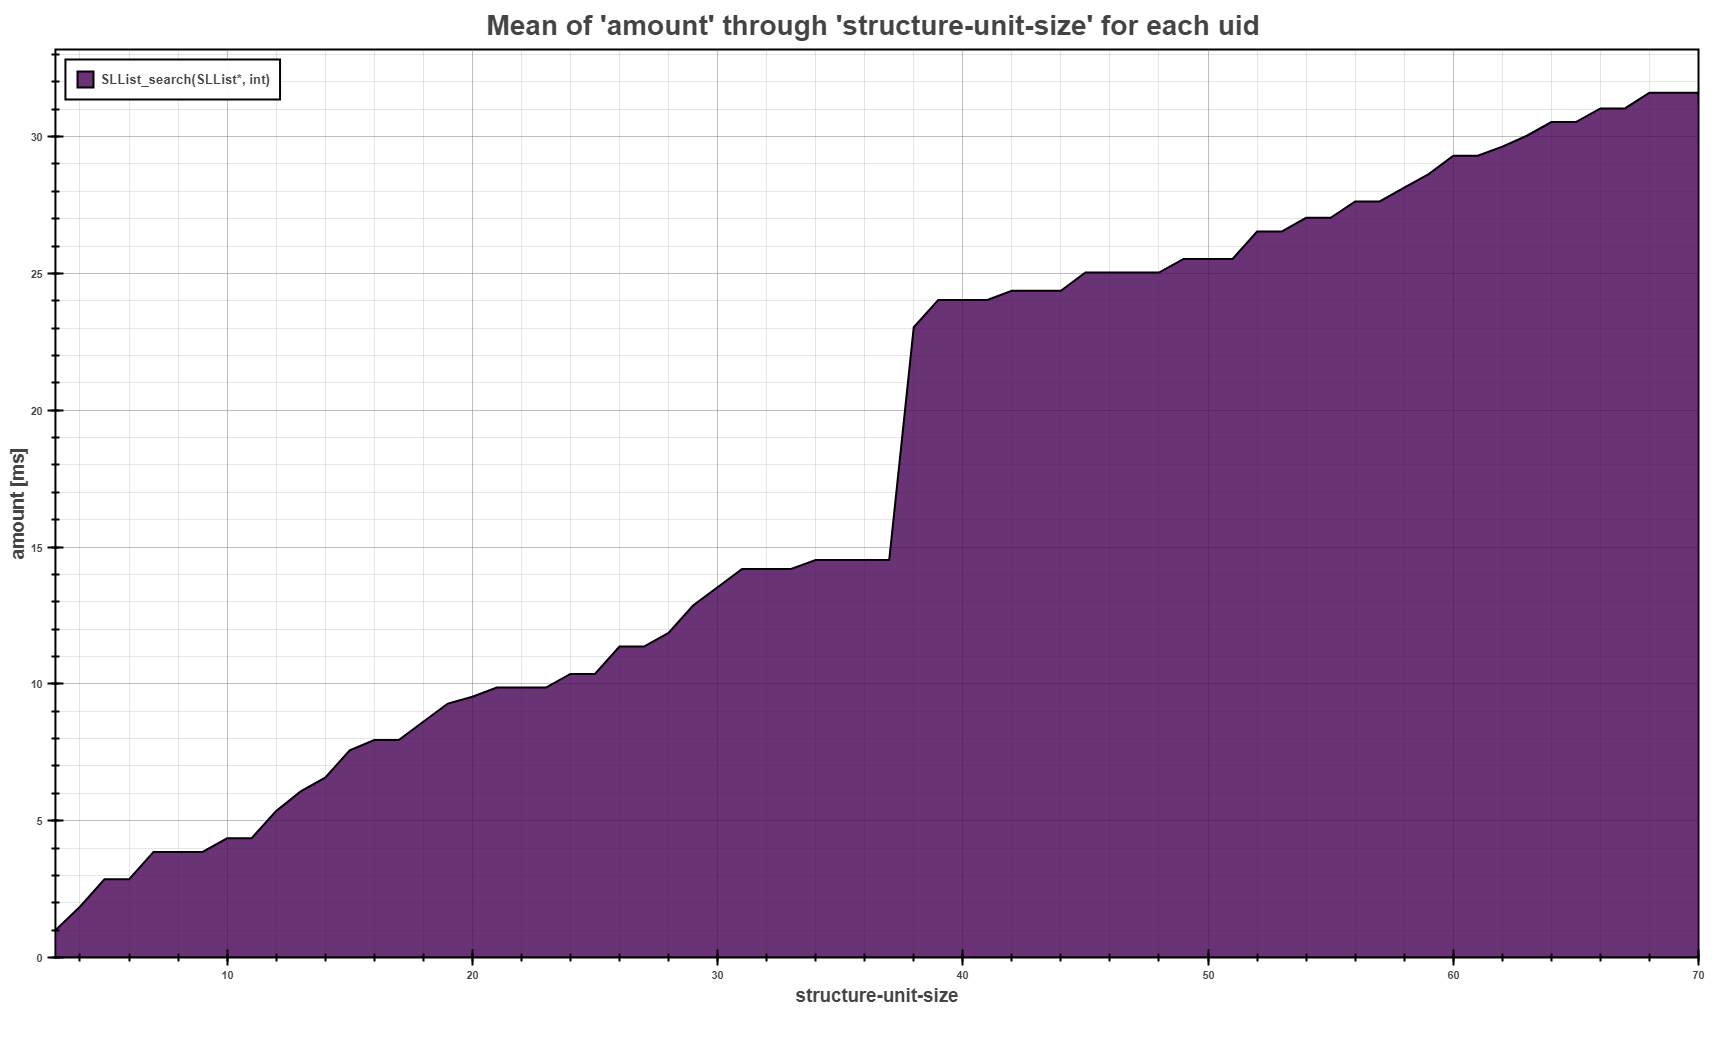
Flow plots show the dependency of the recorded resource consumption on some independent variable chosen by the user (e.g., the size of the input, the sequential number of the input, etc.). Similarly to bar plots, flow plots can also accumulate or stack the resource consumption values. For example, Figure 3(b) shows the trend of the average duration of an SLList_search function, providing some implementation of searching in singly-linked lists (SLLs), depending on the size of the SLL it is executed on.
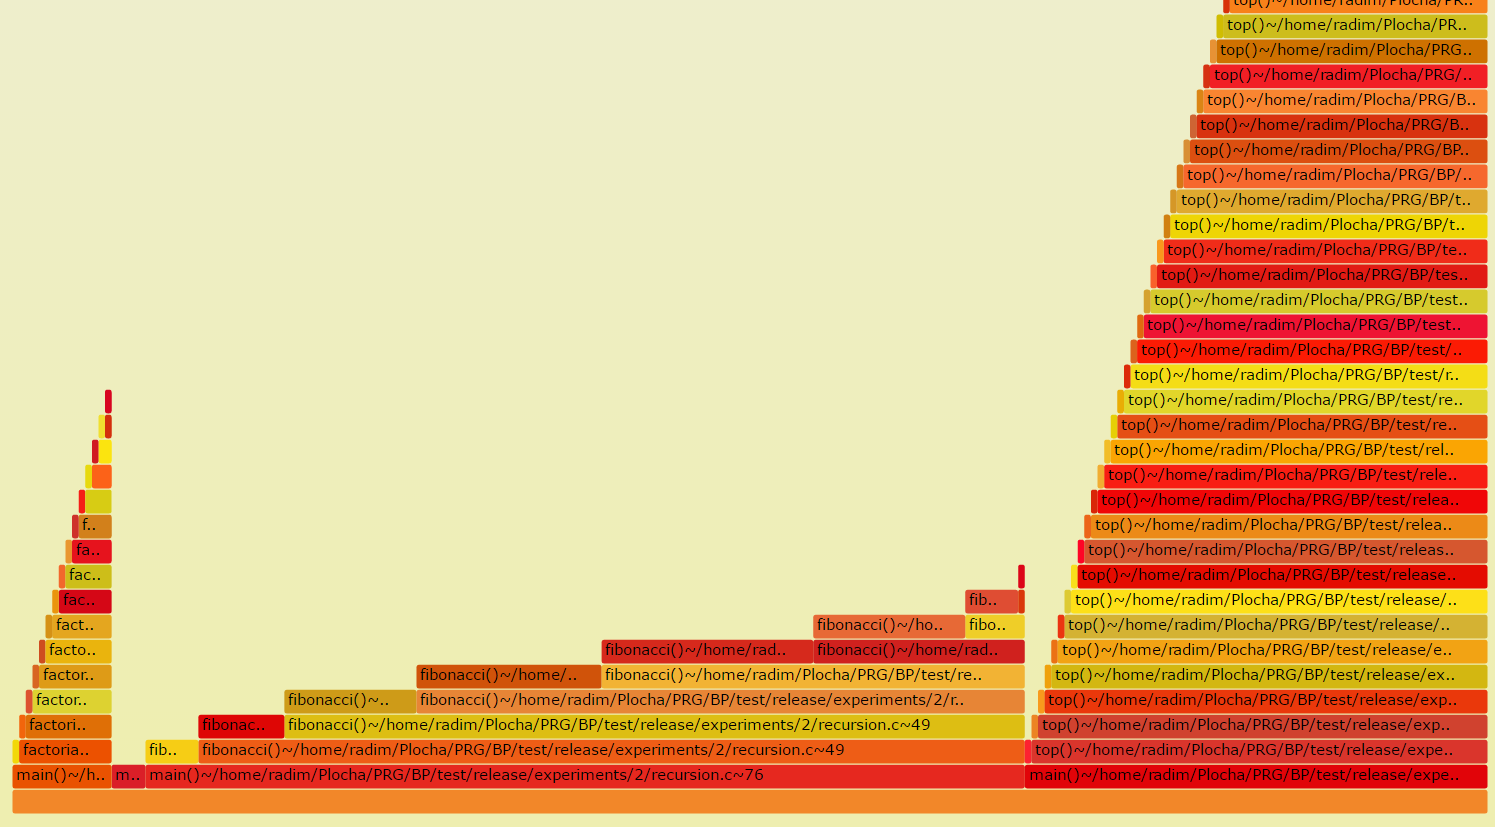
A-C Flame Graphs
Flame graphs show the relative recorded consumption of resources w.r.t. the execution trace leading to the program construction that caused the resource consumption. Flame graphs aid in faster localization of resource consumption hotspots. Figure 3(c) shows the memory consumption of a simple program that calls selected recursive functions, such as Fibonacci or factorial. Each rectangle represents an allocation of the memory, and its width is scaled according to how much memory has been allocated at a given function and a given line (e.g., when we call the malloc function).
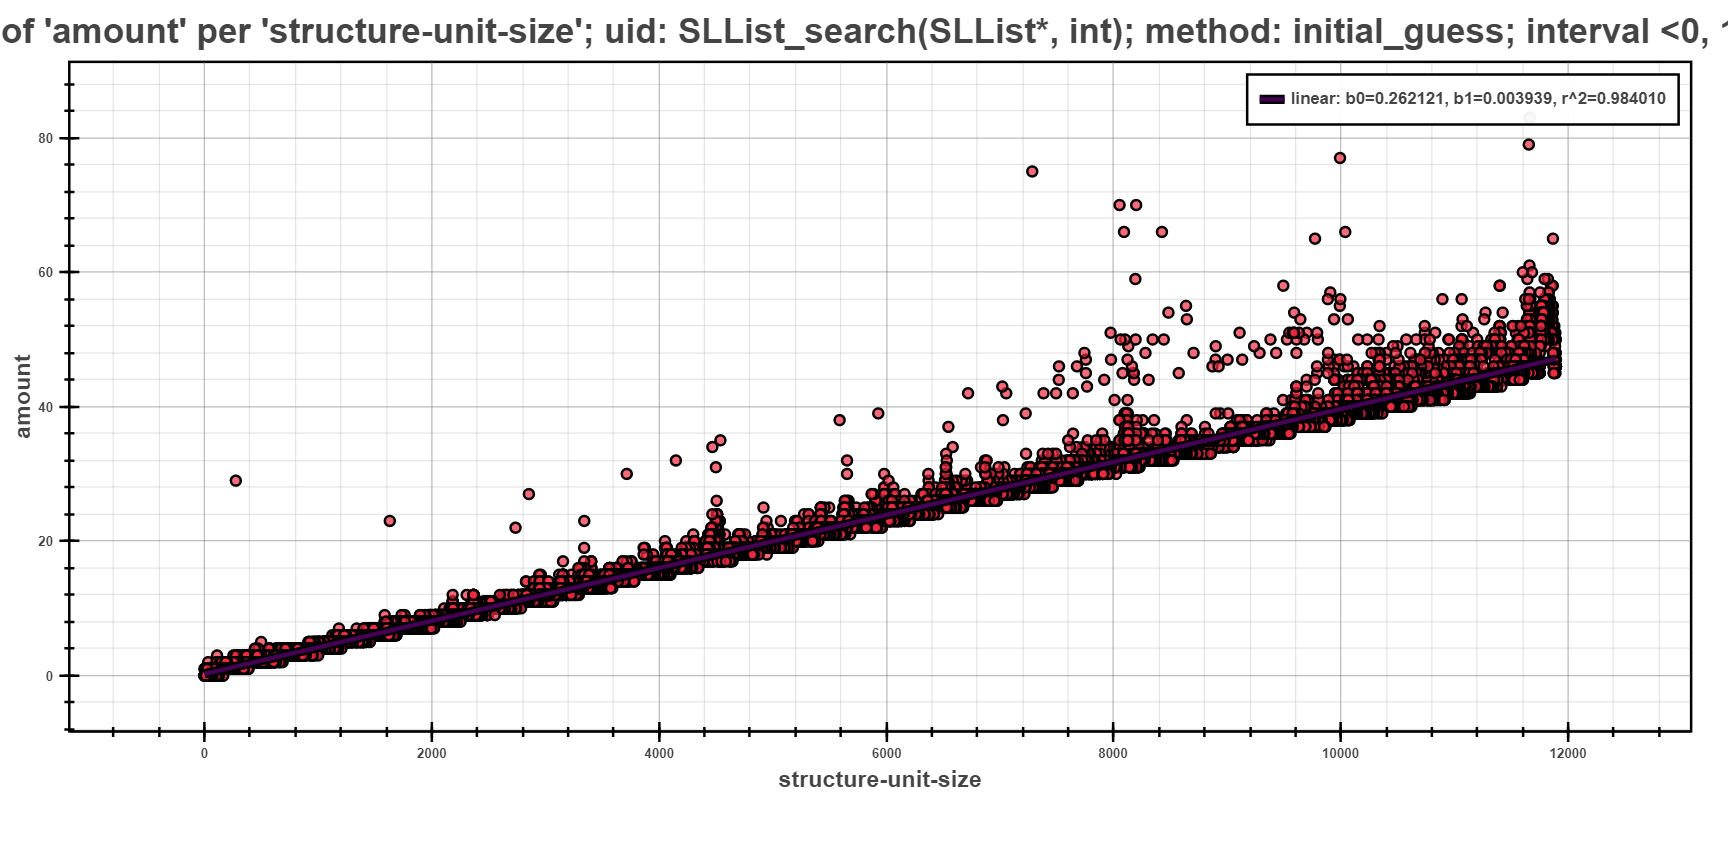
A-D Scatter Plots
Scatter plots visualize recorded resource consumption as points on a two dimensional grid where the X-axis (Y-axis) typically represents values of an independent variable (the collected resource value), respectively. Figure 3(d) shows the dependency of the SLList_search function on the size of the single-linked list structure it is executed on. Furthermore, the plot also shows the best regression model (based on the coefficient of determination value) that captures the dependency of the runtime on the structure size.