Unveiling the disc structure in ultraluminous X-ray source NGC 55 ULX-1
Abstract
Ultraluminous X-ray sources (ULXs) are the most extreme among X-ray binaries in which the compact object, a neutron star or a black hole, accretes matter from the companion star and exceeds a luminosity of in the X-ray energy band alone. Despite two decades of studies, it is still not clear whether ULX spectral transitions are due to stochastic variability in the wind or variations in the accretion rate or in the source geometry. The compact object is also unknown for most ULXs. In order to place constraints onto such scenarios and on the structure of the accretion disc, we studied the temporal evolution of the spectral components of the variable source NGC 55 ULX-1. Using recent and archival data obtained with the XMM-Newton satellite, we modelled the spectra with two blackbody components which we interpret as thermal emission from the inner accretion flow and the regions around or beyond the spherization radius. The luminosity-temperature (L-T) relation of each spectral component agrees with the L T4 relationship expected from a thin disc model, which suggests that the accretion rate is close to the Eddington limit. However, there are some small deviations at the highest luminosities, possibly due to an expansion of the disc and a contribution from the wind at higher accretion rates. Assuming that such deviations are due to the crossing of the Eddington or supercritical accretion rate, we estimate a compact object mass of 6-14, favouring a stellar-mass black hole as the accretor.
keywords:
Accretion, accretion discs — X-rays: binaries — X-rays: individual: NGC 55 ULX-11 Introduction
Ultraluminous X-ray sources (ULXs) are empirically defined as bright, non-nuclear, point-like, mainly extragalactic sources with an X-ray luminosity (Kaaret et al. 2017). They are brighter than the Eddington luminosity limit for a black hole (BH) and can even reach luminosities in excess of in the canonical X-ray band (0.3-10 keV, Walton et al. 2021).
Many conjectures have been made to account for the high luminosity of these sources. Initially, ULXs were thought to be powered by black holes with masses greater than 10 and, potentially, in the intermediate-mass regime (, Miller et al. 2004) with the best IMBH candidate being HLX-1 (Webb et al. 2012). An alternative scenario suggested stellar-mass black holes whose light was beamed along the line of sight (LOS) of the observer by a thick disc-wind cone (e.g. King et al. 2001; Poutanen et al. 2007). However, the discovery of coherent X-ray pulsations from M 82 ULX-2 with NuSTAR provided unambiguous evidence in support of a ULX hosting a neutron star (NS, Bachetti et al. 2014). Other notable examples are NGC 7793 P13 and NGC 5907 ULX-1 with similar properties (Fürst et al. 2016; Israel et al. 2017). NGC 7793 P13, the second discovered pulsating ULX (or pULX), is also the only ULX for which an upper limit to the mass of the compact object was dynamically obtained (, Motch et al. 2014). The pulsating source NGC 5907 ULX-1 reaches (Fürst et al. 2017), which corresponds to 500 times the Eddington limit of a NS, de facto making it the brightest NS known. As of today, only 10 pulsating ULXs (including transient ULXs, see e.g. King et al. 2020 and references therein) are confirmed among the 1800 ULXs known (Walton et al. 2021). However, the fraction of pulsating neutron stars might be higher in ULXs as only about 30 ULXs have data with sufficiently good quality to search for pulsations. This suggests that neutron stars might power % of the nearby, bright, ULXs (see e.g. Rodríguez Castillo et al. 2020).
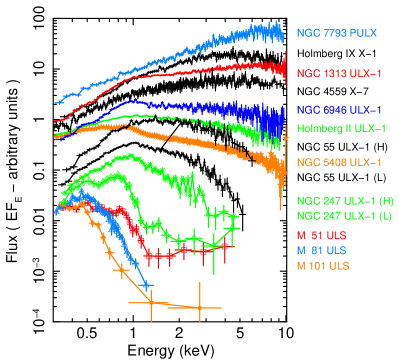
The so-called ultraluminous state (Gladstone et al., 2009) is characterized by a strong curvature between 2–10 keV (e.g. Walton et al. 2020 and references therein), and often a soft excess below 2 keV (see Fig. 1). Sutton et al. (2013) classified ULXs into three main regimes according to their spectral slope in the 0.3–10 keV band (soft ultraluminous/SUL for or hard ultraluminous/HUL for ). In the latter case, if the X-ray spectrum has a single peak and is dominated by a blackbody-like component in the 2–5 keV band, it is classified as in the broadened disc (BD) regime. ULXs often switch between different spectral regimes (Walton et al. 2020). The presence of the low-energy spectral turnover rules out models of sub-Eddington accretion onto intermediate mass black holes because the temperature of the soft component would require black hole masses of up to 1000s with (accretion rate) , which disagree with their soft spectra.
Short time-scales variability from seconds to hours has been observed in several ULXs (Heil et al., 2009) rarely associated to quasi-periodic patterns (Alston et al., 2021; Strohmayer & Mushotzky, 2003; Strohmayer et al., 2007; Gúrpide et al., 2021) but is generally at a lower level than in sub-Eddington AGN and black hole X-ray binaries. Long-term variability is also observed on time-scales of a few months and could be associated with super-orbital motions due to precession and is most common in the HUL regime and, particularly, in pulsating ULXs (Walton et al., 2016; Fürst et al., 2018; Brightman et al., 2019; Gúrpide et al., 2021). Heil & Vaughan (2010) and De Marco et al. (2013) showed that the soft energy band lagged the hard band in the ULX NGC 5408 ULX-1 at frequencies of 10 mHz. More recently, very long soft lags of the order of a few ks were found in NGC 55 ULX-1, NGC 1313 ULX-1 and NGC 7456 ULX-1 which show a broad range of spectral hardness (Pinto et al. 2017; Kara et al. 2020; Pintore et al. 2020). The time lags range between a few seconds to ks and it is not clear whether they are produced by the same mechanism. They could be produced by down scattering of hard X-ray photons through a thick disc wind cone in the LOS. In fact, super-Eddington accretion predicts the launch of powerful, relativistic (), winds (Takeuchi et al. 2013).
Evidence in support of winds in ULXs was found through the presence of strong, although unresolved, features at soft X-ray energies ( 2 keV) in CCD low-resolution spectra (Strohmayer et al., 2007). Their time variability and correlation with the source spectral hardness suggested that they might be produced by the ULX itself in the form of a wind (Middleton et al. 2015b). This scenario was unambiguously confirmed through the first detection and identification of emission and absorption lines in the high-resolution XMM-Newton (here and after XMM) / RGS spectra of NGC 1313 ULX-1 and NGC 5408 ULX-1 (Pinto et al. 2016). In particular, the line-emitting gas is generally close to rest (see, e.g., Kosec et al. 2021) with some exceptions such as NGC 5204 ULX-1 (, Kosec et al. 2018) and in NGC 55 ULX-1 (, Pinto et al. 2017). The absorption lines are highly blueshifted (). The ionisation state increases with the outflow velocity and the source spectral hardness, which indicates a detection of hotter and faster phases coming from the inner region at lower inclinations (Pinto et al. 2020a).
An interesting sub-class of ULXs are ultraluminous supersoft sources (ULSs or SSUL regime). These objects are identified with X-ray spectra dominated by a cool blackbody-like component with , a bolometric luminosity , and very little emission above 1 keV. The discovery of similar winds in archetypal, persistent, ULXs (Pinto
et al. 2016) and very recently in NGC 247 ULX-ULS 1 (Pinto
et al. 2021), and the presence of a variable hard X-ray tail in some ULSs suggested that they are similar super-Eddington accretors but viewed at a different angle with respect to the disc-wind cone. The fainter hard tail and strong variability such as the presence of dips in the lightcurves of ULSs may be the consequence of a higher inclination angle or a higher accretion rate and a thicker (and variable) wind in the LOS (see, e.g., Urquhart &
Soria 2016; Pinto et al. 2017; Alston
et al. 2021; D’Aì et al. 2021).
Despite two decades of dedicated studies several open questions remain unanswered.
Are ULX spectral transitions driven by stochastic changes in the wind or variations in the accretion rate / geometry? What is the fraction of matter lost into the wind and, therefore, the net accretion rate onto the compact object? What is the fraction of NS-powered ULXs?
ULXs which exhibit strong spectral variability are the ideal targets to tackle them.
1.1 NGC 55 ULX-1
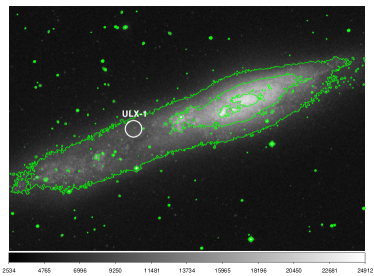
ULX-1 is the brightest X-ray source in the NGC 55 galaxy (see Fig. 2). At a distance of 1.94 Mpc111https://ned.ipac.caltech.edu, this source has an X-ray luminosity peak of about (see, e.g., Gúrpide et al. 2021). The X-ray light curve exhibits sharp drops and 100s-long dips, during which the source flux is quenched in the 2.0 - 4.5 keV band (Stobbart et al. 2004). The spectrum is very soft (if modelled with a powerlaw it yields a slope , Pinto et al. 2017) and similar to the brightest ULSs, but with a stronger hard tail above 1 keV. It is possible to see from Fig. 1 that the X-ray spectrum of NGC 55 ULX-1 fits just in between the spectra of bright ULSs and the soft-intermediate spectra of ULXs and, therefore, the source can be considered as a link between these subclasses of ULXs. NGC 55 ULX-1 is the ideal target for our study as it is very bright, has a spectral curvature above 1 keV similar to (although less severe than) ULSs and both broadband and wind properties are halfway between ULSs and soft-intermediate ULXs (see Pinto et al. 2020a). Moreover, its X-ray luminosity often crosses the threshold, giving an opportunity to test disc structural changes around the Eddington limit, assuming the accretor is a stellar mass BH or a NS. Finally, its flux and spectral variability provide the workbench necessary to fit L-T trends and break model degeneracies.
In order to study the spectral variability of NGC 55 ULX-1 and the wind response to changes in the broadband flux, our team has requested and has been awarded with three full XMM orbits in different AOs (about 390 ks, PI: Pinto). The first observation occurred in 2018 and caught the source in a low state, while the two latter ones were triggered in 2020 and 2021 in order to obtain well-exposed RGS spectra during intermediate-high states. More detail on the triggering and the RGS analysis will be provided in a forthcoming paper.
This paper is the first in a series and will focus on the broadband spectral variability. This paper is organized as follows. In Sect. 2 we report the details on the observations, the spectral modeling in Sect. 3. In Sect. 4 we discuss our results and provide our conclusions in Sect. 5. All uncertanties are at 1 (68 % level).
2 Observations and data reduction
XMM-Newton observed NGC 55 ULX-1 ten times over a period of 20 years. As we can see from Table 1, XMM-Newton observed NGC 55 ULX-1 six times with reasonably long ( ks) observations, which enabled us to study the evolution of the spectra over two decades. Four additional short ( ks net) observations were taken in the recent years. This permits us to probe both short-term (hours-days) and long-term (months-years) variability time scales.
| Obs. ID | Date | t [s] | t [s] | CR [c/s] |
|---|---|---|---|---|
| 0028740201 | 2001-11-14 | 33619 | 27223 | 1.197 0.007 |
| 0028740101 | 2001-11-15 | 31518 | 24718 | 0.578 0.005 |
| 0655050101 | 2010-05-24 | 127437 | 95295 | 0.772 0.003 |
| 0824570101 | 2018-11-17 | 139800 | 90733 | 0.513 0.002 |
| 0852610101 | 2019-11-27 | 11000 | 4079 | 1.10 0.02 |
| 0852610201 | 2019-12-27 | 8000 | 4055 | 1.09 0.02 |
| 0852610301 | 2020-05-11 | 9000 | 4909 | 0.422 0.009 |
| 0852610401 | 2020-05-19 | 8000 | 3969 | 0.152 0.006 |
| 0864810101 | 2020-05-24 | 132800 | 102158 | 0.707 0.003 |
| 0883960101 | 2021-12-12 | 130200 | 92294 | 0.872 0.003 |
t is the exposure time after the removal of periods with high solar flares and CR is the net source count rate.
The data were reduced with the Science Analysis System (SAS) version 18.0.0222https://www.cosmos.esa.int/web/XMM-Newton. The raw data were obtained from the XMM-Newton Science Archive (XSA)333https://www.cosmos.esa.int/web/XMM-Newton/xsa. We used recent calibration files (February 2021). We ran the epproc and emproc tasks to build the EPIC-PN and EPIC-MOS 1,2 event files, respectively. These are subsequently filtered for the flaring particle background. We chose the recommended cutting threshold in the lightcurves above 10 keV (count rate 0.5 c/s for EPIC-PN and 0.35 c/s for EPIC-MOS 1 and 2).
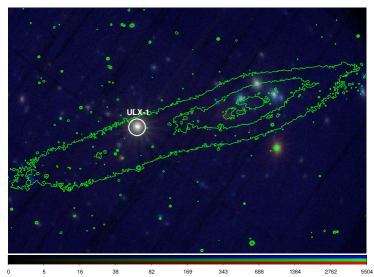
We extracted EPIC MOS 1-2 and PN images in three energy bands to create a false-color RGB image (red 0.3-1 keV, green 1-2 keV, blue 2-10 keV)444https://sites.google.com/cfa.harvard.edu/saoimageds9. The images from the same energy band and different observations were stacked to increase the statistics. The final RGB mosaic is shown in Fig. 2 (bottom panel). ULX-1 is the yellow-white, brightest object, in the central-left region. Some fainter and harder (blue) X-ray binaries are present near the galaxy centre. The soft (red) source outside the galaxy contours is a field star in our Galaxy. Overlaid are the contours of surface brightness of the optical image obtained from the Digitized Sky Survey (DSS)555DSS, https://irsa.ipac.caltech.edu/data/DSS/ (top panel).
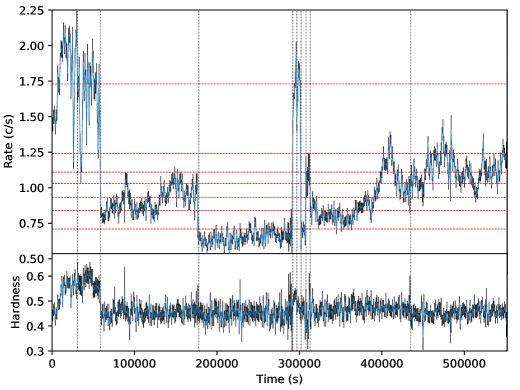
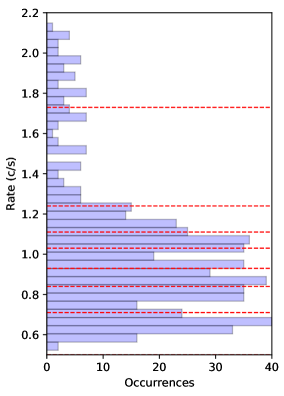
We also extracted background-corrected lightcurves for ULX-1 and each individual observation after carefully selecting the source and the background regions using the epiclccorr task. For the source we selected a circular region of 0.5 arcmin radius centered on the Chandra X-ray estimated position (RA: 00h 15m 28.89s DEC: -39∘ 13’ 18.8”), while for the background we chose a larger circular region a few arc minutes away from the source and avoiding contamination from the copper ring (wherever it was possible) in the same chip of the source region and away from of chip gaps. There might be a very small loss of counts in the observations, especially for Obs. ID: 0028740101, with the ULX-1 off-axis but this should be marginal given the softness of its spectra. Indeed, despite the larger off-axis angle, its spectrum appears as the brightest and hardest (see Sect. 3.2). The 0.3-10 keV EPIC-PN lightcurves of the individual observations were joined with PYTHON and shown in Fig. 3 (top-left panel). The XMM lightcurves confirm that the source flux changed dramatically as anticipated in Sect. 1. In the early XMM observations - when the source was brighter - the lightcurve exhibited flux dips lasting hundreds of seconds where its flux dropped by a factor of 2. In the top-right panel we also show the histogram of the count rate for the all-time lightcurve. In particular, defining the hardness ratio (HR) as the ratio between the counts in the 1-10 keV and the 0.3-10 keV energy band, respectively, we show that the HR is generally higher when the source is brighter and that decreases in proximity of the dips (Fig. 3 bottom-left panel).
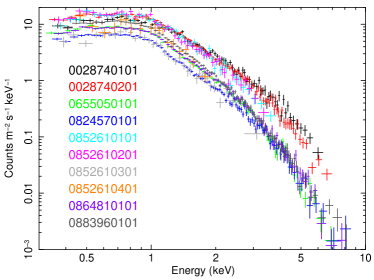
We extracted EPIC PN and MOS spectra for each observations using the same source and background regions chosen for the lightcurves extraction. The rmfgen and arfgen tasks were used to generate response matrices and effective area files. The EPIC-PN spectra of all the observations are shown in Fig. 5.
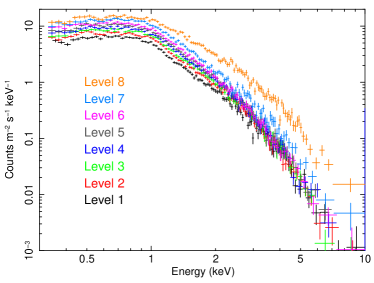
The individual observations have exposure times which differ by up to an order of magnitude and do not show dramatic changes in the spectral hardness despite their substantial flux variability in agreement with the lightcurve. The spectra extracted for some observations are also nearly superimposable (see Fig. 5). In order to compare spectra with similar statistics, we also extracted spectra in ranges of count rate selected ad-hoc according to the count rate histogram (see also Pinto et al. 2017). We split the XMM all-time lightcurve in eight regimes of count rate as shown in Fig. 3. These regimes were chosen in order to balance the total counts for each level (see Table LABEL:frs_table for more detail) and some spikes appearing in the count-rate histogram (Fig. 3 top-right panel). The count-rate selected spectra were then stacked among the different observations in order to obtain eight time-averaged flux-resolved spectra (one per EPIC camera). This selection criterium allow us to probe variability mechanisms at different time scales. The flux-selected EPIC-PN spectra are plotted in Fig. 5.
| Range | EPIC-PN | MOS1 | MOS2 | EPIC-PN | MOS1 | MOS2 |
|---|---|---|---|---|---|---|
| [c/s] | Cnts | Cnts | Cnts | Exp. [s] | Exp. [s] | Exp. [s] |
| 0.50-0.71 | 38392 | 13274 | 13121 | 76795 | 95051 | 95322 |
| 0.71-0.84 | 43729 | 13977 | 14160 | 72282 | 84108 | 84206 |
| 0.84-0.93 | 43845 | 14728 | 14699 | 64371 | 79211 | 78945 |
| 0.93-1.03 | 41879 | 14215 | 13847 | 55327 | 66468 | 66286 |
| 1.03-1.11 | 42008 | 13816 | 13925 | 50550 | 61191 | 60917 |
| 1.11-1.24 | 40366 | 12964 | 13021 | 44413 | 53436 | 53513 |
| 1.24-1.73 | 31926 | 10640 | 10737 | 36211 | 42301 | 42391 |
| 1.73-2.25 | 29716 | 10735 | 10657 | 28954 | 32309 | 32332 |
3 Spectral modelling
The spectra were modelled with the SPEX fitting package v3.06 (Kaastra et al., 1996). In order to use statistics, we rebinned the EPIC PN and MOS 1,2 spectra with bins of at least 1/3 of the spectral resolution and with at least 25 counts using the SAS task specgroup. All emission components were corrected for absorption from the circumstellar and interstellar medium with the hot model (freezing the temperature of the gas to keV, which provides a neutral gas in SPEX). For all emitting and absorbing plasma components we adopted the recommended Solar abundances of Lodders & Palme (2009) which are the default abundances in SPEX. The spectral models accounted for the source redshift as well (666https://ned.ipac.caltech.edu). Each spectral model is fitted simultaneously to the EPIC MOS 1,2 and PN spectra as they overlap in the 0.3-10 keV energy band.
3.1 Testing different spectral models for Obs. ID 0655050101
It is common to use multiple thermal models (e.g. blackbody emission components) to reproduce ULX spectra (see, e.g., Stobbart et al. 2006; Pintore et al. 2015; Walton et al. 2018; Gúrpide et al. 2021). At first, we tested several models with the spectra from the observation 0655050101. On the one hand we wanted to compare the new SPEX code used for this spectral modelling with the previous versions and other codes, e.g. XSPEC or other SPEX versions, used in the recent years for the same source (see, e.g., Pinto et al. 2017, Pintore et al. 2015). On the other hand, the comparison of the values (and degrees of freedom or d.o.f.) from different spectral models constrains the best fitting continuum model. Finally, we aimed at understanding the systematic effects when we have not modelled the features.
The spectral models that we tested were based on different combinations of the following continuum components: blackbody emission (bb model in SPEX), blackbody modified by coherent 777 SPEX manual for more detail at https://personal.sron.nl/ jellep/spex/manual.pdf Compton scattering (mbb), multi-temperature disc blackbody (dbb), and Comptonization of soft photons in a hot plasma (comt). The components used to fit emission and absorption lines are: gaussian line (gaus), collisional-ionisation equilibrium emission (cie) and photoionisation-equilibrium absorption (xabs, see SPEX manual for more details).
Here there is a summary of the models tested.
- RHB: simple blackbody emission (B) corrected for redshift (R) and neutral interstellar absorption (H).
- RHBB: two blackbody components are used to account for a different structure in the inner and outer regions of the accretion disc.
- RHBD: a cool blackbody describes the outer disc and a disc blackbody (D) reproduces the inner disc.
- RHBM: a modified blackbody model (M) describes the inner disc.
- RHBCom: a Comptonization emission is added to the RHB model.
- RHBMC: a cie emission model (C) is added to the RHBM model.
- RHBMCX: The xabs absorption model is added to the RHBMC.
- RHBMCG(G): One or more gaussian lines (G) are used to fit emission and absorption lines.
The first 5 models were primarily used to reproduce the broadband shape and continuum spectrum of the source. All the continuum models leave strong residuals around 1 keV (positive) and 0.7-0.8 keV and 1.2-1.3 keV (negative), see e.g. Fig. 6. These were resolved in groups of narrow lines with the high-resolution RGS spectrometers (Pinto et al., 2017; Pinto et al., 2021).
The other 4 models mentioned above were therefore used to account for any wind features. The cie emission model was used mainly to describe the broad emission feature at around 1 keV, which is the most intense. CCD detectors cannot resolve the small velocity shift of the emission lines and we therefore considered the cie to be at rest. The dominant absorption component of the wind was found to be outflowing at (Pinto et al. 2017) which is a shift large enough to be detected even with the EPIC detectors. However, we chose to fix the outflow velocity for the xabs absorption component to this value, in order to avoid model degeneracies with the ionization parameter . Both absorption and emission lines were found to be narrow ( km/s) in RGS, which cannot be resolved by EPIC and, therefore, we adopted the default velocity dispersion of 100 km/s for the cie and xabs components (EPIC resolution 1000 km/s around 1 keV). The gaussian model provided an alternative phenomenological approach to measure the strength of the dominant spectral emission feature around 1 keV and the absorption features around 0.75 keV and 1.25 keV.
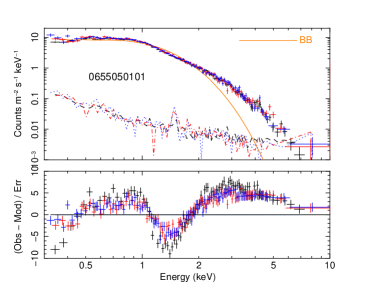
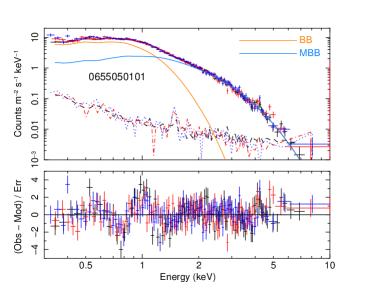
In Fig. 6 we show three representative examples of our fits for Obs. ID 06555050101 showing a single bb component continuum model (top panel), a bb+mbb model (middle panel) and a model which also accounts for wind emission lines (bb+mbb+cie, bottom panel). As expected, a single thermal component provided a very poor description of the spectral continuum. Two thermal models were able to fit the broadband shape, while the inclusion of the cie accounts for the dominant wind emission feature at 1 keV.
In Table LABEL:table:_XMM_0655050101_spectral_fits we report the results from our fits of Obs. ID 06555050101. Among all pure-continuum models the best-fit one turned out to be the RHBM model, composed of a cool ( keV) blackbody and a hot ( keV) blackbody modified by coherent Compton scattering (see SPEX manual for more details), although comparable results were achieved by a hot disc-blackbody or Comptonization component. The results obtained with the RHBM model on the observation 0655050101 were fully consistent with Pinto et al. (2017). We therefore decided to keep such model as the baseline continuum model for the rest of the analysis.
The total column density of cold gas in the LOS towards the source, , was about , a few times larger than the Galactic value ()888https://heasarc.gsfc.nasa.gov/cgi-bin/Tools/w3nh/w3nh.pl. This suggested that a substantial amount of gas found along the LOS is located in the circumstellar medium around the ULX or in the host galaxy.
The inclusion of the wind (both emission and absorption models) significantly improved the overall quality of the fits. The addition of the wind emission corresponded to a decrease in the overall of 73 for 2 additional d.o.f. (normalisation and temperature of the cie) which flattened most residuals around 1 keV (see Fig. 6). The addition of the wind absorption yields a further for 2 more d.o.f. (column density and ionisation parameter of the xabs). However, it is important to notice that these additional line components did not strongly affect the continuum parameters nor the total bolometric luminosity as previously found by Pinto et al. (2020b) and Walton et al. (2020).
| Parameter / | RHB | RHBB | RHBD | RHBM | RHBCom | RHBMC | RHBMCX | RHBMG | RHBMGG |
| component | Model | Model | Model | Model | Model | Model | Model | Model | Model |
| 0.72 0.01 | 0.98 0.09 | 0.9 0.1 | 0.93 0.02 | 0.8 0.1 | 0.8 0.1 | 1.0 0.3 | 0.8 0.1 | 1.3 0.3 | |
| — | 0.36 0.02 | — | — | — | — | — | — | — | |
| — | — | — | 0.57 0.02 | — | 0.56 0.03 | 0.6 0.1 | 0.61 0.03 | 0.63 0.03 | |
| — | — | 0.58 0.04 | — | — | — | — | — | — | |
| — | — | — | — | 0.7 0.1 | — | — | — | — | |
| — | — | — | — | — | 0.07 0.01 | 0.08 0.02 | — | — | |
| — | — | — | — | — | — | — | 0.025 0.004 | 0.008 0.003 | |
| kTbb1 | 0.287 0.001 | 0.179 0.002 | 0.164 0.002 | 0.164 0.001 | 0.158 0.005 | 0.159 0.003 | 0.164 0.004 | 0.159 0.003 | 0.147 0.003 |
| kTbb2 | — | 0.482 0.005 | — | — | — | — | — | — | — |
| kTmbb | — | — | — | 0.680 0.007 | — | 0.668 0.008 | 0.673 0.008 | 0.663 0.008 | 0.654 0.008 |
| kTdbb | — | — | 1.2 0.1 | — | — | — | — | — | — |
| kTseed | — | — | — | — | 0.158 (coupled) | — | — | — | — |
| kTe | — | — | — | — | 0.58 0.02 | — | — | — | — |
| — | — | — | — | 12 2 | — | — | — | — | |
| kTCIE | — | — | — | — | — | 1.11 0.05 | 1.10 0.05 | — | — |
| 0.733 0.001 | 2.23 0.07 | 2.52 0.07 | 2.53 0.07 | 2.5 0.1 | 2.44 0.09 | 2.3 0.1 | 2.40 0.09 | 3.0 0.2 | |
| — | — | — | — | — | — | 0.14 | — | — | |
| — | — | — | — | — | — | 3.7 0.1 | — | — | |
| — | — | — | — | — | — | — | 0.98 0.01 | 1.01 0.02 | |
| — | — | — | — | — | — | — | — | 0.76 0.01 | |
| FWHM | — | — | — | — | — | — | — | 0.22 0.03 | 0.12 0.03 |
| — | — | — | — | — | — | — | 1.6 0.3 | 0.5 0.2 | |
| — | — | — | — | — | — | — | — | -2.7 | |
| /d.o.f | 4537/287 | 463/285 | 437/285 | 428/285 | 438/284 | 360/283 | 342/281 | 346/282 | 325/279 |
| 2368 | 214 | 204 | 202 | 206 | 145 | 133 | 132 | 120 | |
| 1064 | 141 | 125 | 122 | 122 | 118 | 117 | 123 | 112 | |
| 1104 | 108 | 108 | 109 | 110 | 96 | 91 | 91 | 92 |
Parameter units: and (in keV unit) refer to the centroids of the first and second gaussian, respectively. and (in units) refer to the normalisations of the first and second gaussian, respectively. The temperatures kT (for each model) and FWHM are expressed in keV unit. The X-ray and bolometric luminosities and (always intrinsic or unabsorbed) are calculated, respectively, between the 0.3 - 10 keV and 0.001 - 1000 keV bands, and are expressed in erg/s unit. The ionisation parameter is in erg/s cm. The column density of the cold gas is in 1021/cm2 unit, while is in 1024/cm2 unit. is the optical depth of the Comptonization component.

3.2 Spectral modelling of individual observations
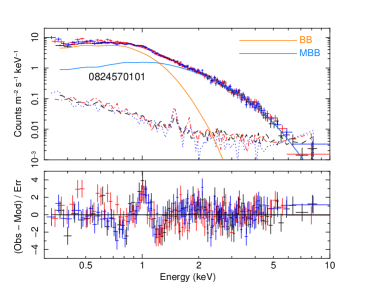
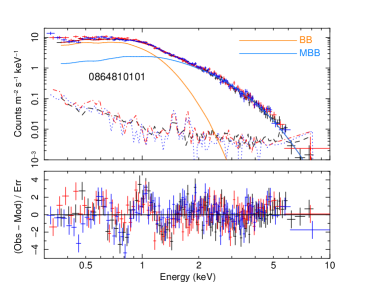
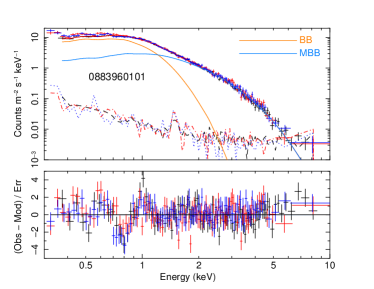
In Fig. 5 we show the EPIC-PN spectra of the 10 XMM observations (the other two EPIC MOS 1,2 cameras are not shown here for clarity). We fitted the EPIC PN and MOS 1,2 from all observations using only continuum models because in some observations the residuals were too weak to constrain the parameters of the wind model. Besides the inclusion of the wind does not alter the continuum parameters even for the high quality spectra.
As for observation 06555050101, the spectral modelling was performed again simultaneously to the EPIC-PN, MOS1,2 spectra for each observation and testing all models mentioned before (blackbody, modified blackbody, powerlaw, and Comptonization). However, for clarity purposes and means of comparison with previous work, we focussed on the results obtained with a double thermal model. A warm ( 0.2 keV) blackbody component reproduces the soft X-ray emission, presumably from the outer disc and the wind photosphere. A hot ( 0.7 keV) blackbody component modified by coherent Compton scattering, accounts for the inner disc emission. The results are shown in detail in Table LABEL:Results_RHBM_model and the plots for the four observations with longest ( ks net) exposure and, therefore, the spectral fits are shown in Fig. 6 (middle panel) and Fig. 7.
This model provided a good description of the data except for the usual strong, narrow, residuals around 1 keV due to the well-known winds. Indeed, by adding a wind photoionisation absorption or collisionally ionised components - as previously found with the high-resolution RGS detectors - we could get rid of most spectral residuals (see observation 06555050101 as an example in Fig. 6 bottom panel and table LABEL:table:_XMM_0655050101_spectral_fits). Our results are fully consistent with previous work and, in particular, seem to indicate that both thermal components become increasingly hotter (i.e. with a higher kT) at higher luminosities (Pintore et al. 2015; Pinto et al. 2017). For a comparison with results from the literature see Sect. 4.
The neutral column density was consistent among all high-quality, deep ( ks) exposures. The shortest ( ks) exposures did not have sufficient signal-to-noise ratio to constrain both the spectral shape and the neutral ISM absorption. In particular, testing several models from single to multiple components model (RHB, RHBB, RHBM, etc.), we obtained values ranging from . This was likely due to degeneracy produced by the lower statistics. Therefore, whilst fitting the spectra of these six short exposures we preferred to fix the to the average value obtained in the latter observations as previously done in e.g. Robba et al. (2021) for NGC 1313 ULX-2.
| Parameter / | 0028740201 | 0028740101 | 0655050101 | 0824570101 | 0852610101 | 0852610201 | 0852610301 | 0852610401 | 0864810101 | 0883960101 |
|---|---|---|---|---|---|---|---|---|---|---|
| component | Obs | Obs | Obs | Obs | Obs | Obs | Obs | Obs | Obs | Obs |
| 1.50 0.06 | 1.12 0.08 | 0.93 0.02 | 0.71 0.02 | 1.5 0.2 | 1.6 0.2 | 0.7 0.1 | 1.1 0.2 | 0.91 0.02 | 1.15 0.03 | |
| 1.37 0.06 | 1.48 0.08 | 0.57 0.02 | 0.38 0.01 | 1.2 0.2 | 1.2 0.2 | 0.46 0.03 | 0.6 0.2 | 0.58 0.02 | 0.67 0.02 | |
| kTbb | 0.172 0.002 | 0.174 0.003 | 0.164 0.001 | 0.162 0.001 | 0.168 0.004 | 0.162 0.004 | 0.153 0.005 | 0.163 0.006 | 0.167 0.001 | 0.166 0.001 |
| kTmbb | 0.82 0.01 | 0.90 0.02 | 0.680 0.007 | 0.755 0.008 | 0.71 0.03 | 0.69 0.03 | 0.67 0.04 | 0.68 0.05 | 0.713 0.007 | 0.680 0.006 |
| 2.5 | 2.5 | 2.53 0.07 | 2.57 0.09 | 2.5 | 2.5 | 2.5 | 2.5 | 2.52 0.07 | 2.5 | |
| /d.o.f | 334/275 | 294/240 | 428/285 | 413/279 | 192/153 | 139/137 | 135/97 | 87/87 | 463/285 | 378/294 |
| 3.19 | 2.85 | 1.71 | 1.26 | 3.15 | 3.17 | 1.32 | 2.01 | 1.69 | 2.08 |
Units are the same as in the Table LABEL:table:_XMM_0655050101_spectral_fits.
3.3 Spectral modelling of different flux levels
In order to confirm and corroborate any trends between spectral hardness and source flux we fit the eight flux-resolved spectra shown in Sect. 2 with the RHBM model as done before for the individual observations. The results of the spectral fits, fixing the column density to the average value obtained in the previous results (), are shown in table LABEL:Results_RHBM_model-FRS. At higher luminosities, the temperature of the hot modified blackbody component increased from 0.70 to 0.86 keV while the one for the cooler component increased by just 0.01 keV. An exception was the lowest flux level 1, which was largely dominated by Obs. ID: 0824570101, where there seemed to be an increase in the mbb temperature. An interesting result is the consistency between the parameters of the cool bb component between the highest level 8 and the bright, dipping, level 7. At odds, there was instead a clear drop in the luminosity and temperature of the hot mbb component during level 7. The results from these spectral fits are discussed later on in Sect. 4.
In Sect. 3.4 we show how gaussian lines can describe the spectral residuals in these high-quality flux-resolved spectra, discuss their variability and how they may provide insights on the overall disc evolution and structure.
| Parameter / | Level | Level | Level | Level | Level | Level | Level | Level |
| component | 1 | 2 | 3 | 4 | 5 | 6 | 7 | 8 |
| 0.70 0.02 | 0.81 0.03 | 0.90 0.03 | 1.00 0.03 | 1.11 0.03 | 1.20 0.04 | 1.39 0.05 | 1.40 0.07 | |
| 0.38 0.02 | 0.50 0.02 | 0.55 0.03 | 0.60 0.03 | 0.65 0.03 | 0.70 0.04 | 0.89 0.05 | 1.65 0.07 | |
| kTbb | 0.162 0.001 | 0.162 0.001 | 0.165 0.001 | 0.166 0.001 | 0.166 0.001 | 0.167 0.001 | 0.170 0.001 | 0.175 0.002 |
| kTmbb | 0.75 0.01 | 0.704 0.008 | 0.705 0.009 | 0.694 0.009 | 0.692 0.009 | 0.669 0.009 | 0.74 0.01 | 0.89 0.01 |
| 2.5 | 2.5 | 2.5 | 2.5 | 2.5 | 2.5 | 2.5 | 2.5 | |
| /d.o.f | 452/282 | 431/276 | 390/279 | 350/274 | 366/271 | 295/262 | 324/270 | 390/295 |
| 1.24 | 1.49 | 1.65 | 1.82 | 2.00 | 2.17 | 2.58 | 3.36 |
Units are the same as in the Table LABEL:table:_XMM_0655050101_spectral_fits.
3.4 Variability of the wind features
In order to study the strength of the spectral features and their variability in NGC 55 ULX-1, we performed a quick fit of the flux resolved spectra modifying our baseline bb + mbb model by adding three gaussian lines (RHBMGGG model). Following Pinto et al. (2021), we fixed the line width to 1 eV for all three gaussian lines since EPIC spectra lack the necessary spectral resolution around 1 keV. The energy centroids were free to vary however they agreed within the error bars with 0.8 and 1.2 keV for the absorption lines and 1.0 keV for the emission line.
The normalisations of the gaussian lines for the eight spectra are shown in Fig. 8. They do not show strong trends with the flux, possibly due to fairly large uncertainties, with the exception of the lowest-energy line at 0.8 keV, which seems to get stronger at high fluxes in agreement with NGC 1313 ULX-1 (Pinto et al. 2020b) and NGC 247 ULX-1 (Pinto et al. 2021). These trends were also attributed to an increasing .
4 Discussion
The aim of this work is to investigate the processes that trigger the spectral transitions in ULXs, particularly between the soft and intermediate hardness regimes. The main question is whether they are driven by stochastic variability in the wind (e.g. Kobayashi et al. 2018) or variations in the accretion rate, which in turn produce variability in the wind and in the obscuration of the innermost, hottest, regions (e.g. Urquhart & Soria 2016). Geometrical effects may also play a relevant role in systems where the accretion disc precesses (e.g. Middleton et al. 2015a).
According to radiation-magnetohydrodynamic (r-MHD) simulations of super-Eddington accretion discs (e.g. Takeuchi et al. 2013), the winds are expected to become optically thick enough to block and reprocess a fraction of the disc X-ray photons, making the source appear as a soft thermal emitter or ultraluminous (super)soft X-ray source (e.g. Guo et al. 2019) at moderately high inclination angles. A comprehensive study would require to measure the properties of the winds and compare them to the characteristics of the spectral continuum (similarly to the Pinto et al. 2020b for the intermediate-to-hard source NGC 1313 ULX-1). In order to do this, we used the XMM-Newton observations of one of the most variable and brightest (in flux) nearby source NGC 55 ULX-1. The X-ray spectra of this ULX fit in just between the softest and intermediate ULX spectra (see Fig. 1). Indeed, the temperatures of the bb fits are among the lowest in ULXs (e.g. Sutton et al. 2013). Moreover, we benefited from three new deep observations that enabled us to achieve more statistics in the low-flux regime and 4 new short observations which fill the gaps between the high- and low-flux regimes. In this work we focused on the evolution of the spectral continuum throughout the different epochs. A follow-up work will focus on the study of the high-resolution X-ray spectra which are however available only for the low-intermediate flux on-axis observations and the evolution of the wind in detail.
4.1 X-ray broadband properties
The XMM-Newton/EPIC lightcurves showed evidence for strong variability by up to a factor 4 in flux over timescales of a few days (see Fig. 3, top panel) along with dips lasting a few 100s to a few ks, which have been interpreted as due to wind clumps that temporarily obscured the central object (see, e.g., Stobbart et al. 2004; Pintore et al. 2015). In fact, during the dips the spectral hardness decreased and reached levels comparable to the low-flux observations although the dip flux was 2-3 times higher than that of the low-flux observations (Fig. 3, bottom panel). The dips appear mainly when the source is bright indicating that the accretion rate increases thereby launching optically-thick wind clouds into the LOS. This suggests the presence of at least two different ongoing variability processes (see also below). Swift/XRT long-term lightcurves taken between 2013 and 2021 confirm the general source behavior with flux variations by a factor of up to 6 with the spectrum of the source appearing harder when brighter (Jithesh, 2021).
We extracted spectra for individual observations to probe variations on timescales of a few days to years as well as flux-resolved spectra to probe the nature of on different timescales variability (see Fig. 5 and 5). Flux level 1 mainly sampled the lowest flux observation (Obs. ID:082457), while flux levels 7 and 8 described the dip and no-dip time intervals in the bright epochs (Obs. ID: 002874-0201, from 2001, see Fig. 3). The other levels (2-6) traced the intermediate-flux epochs (Obs. ID: 065505,086481). All spectra peaked around 1 keV with the peak slightly shifting towards higher energies at higher fluxes. Interestingly, the lowest-flux spectrum appeared harder than the intermediate-flux ones in contradiction with the trend sees at higher fluxes.
Our analysis confirmed that the spectrum requires at least two components with a blackbody-like shape. A double blackbody model could indeed reproduce the overall spectral shape with the hotter component being broader and likely modified by Compton scattering in the wind (see Fig. 6 and Table LABEL:table:_XMM_0655050101_spectral_fits). This agrees with the general picture and the typical properties of soft ULXs (see, e.g., Sutton et al. 2013). The inclusion of wind features in the model in the form of gaussian lines or physical components produced significant improvements to the spectral fits in terms of but did not affect the continuum parameters albeit slightly increasing the uncertainties (see Table LABEL:table:_XMM_0655050101_spectral_fits).
The spectral fits of both the individual observations and the eight flux levels showed that both the soft and hard components became hotter (i.e. with a higher kT) at higher luminosities (see Table LABEL:Results_RHBM_model and LABEL:Results_RHBM_model-FRS), which indicates that either the accretion rate is increasing or that we are progressively having a clearer view of the inner accretion flow through a less dense wind photosphere. However, the results on the wind features (e.g. the more intense 0.8 keV line at high fluxes) would favor an increase in the (see Sect. 3.4). This agrees with a scenario in which variations in the local accretion rate are driving the transition from soft/fainter to hard/brighter spectra. The brightest ones are associated to epochs in which a surplus of matter may launch optically-thick clouds that obscure the innermost region thereby producing the flux dips.
4.2 Comparison with disc models
The nature of the compact object powering NGC 55 ULX-1 is not yet known and therefore the accretion in Eddington units is uncertain. Although the best-fit values of temperatures might not exactly correspond to gas temperatures due to the unknown structure of the emitting regions (because we have modelled a thick disk with a thin disk template), it is still very useful to compare them with the bolometric luminosities of the blackbody components. This is indeed a commonly adopted procedure to understand the behaviour of the thermal components and, in particular, to place some constraints on the disc structure and accretion regime, possibly providing some information on the nature of the compact object, especially for not too high accretion rates or luminosities ( erg/s, e.g., Urquhart & Soria 2016; Earnshaw & Roberts 2017; Walton et al. 2020; Gúrpide et al. 2021; Robba et al. 2021; D’Aì et al. 2021).
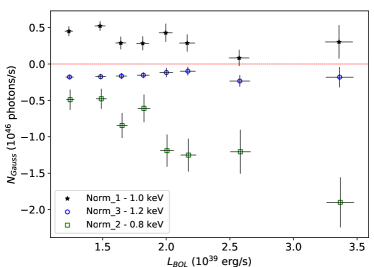
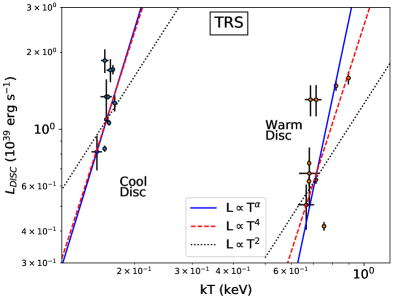
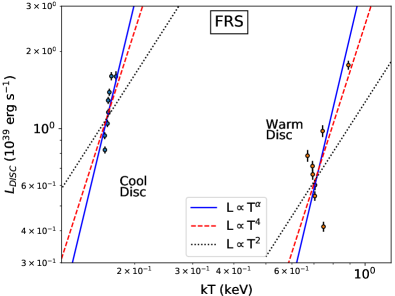
It is useful to compare the Luminosity–Temperature () trends measured for NGC 55 ULX-1 with those expected from theoretical models such as the thin disc in a sub-Eddington regime (L ) with a constant emitting area (SS73, Shakura & Sunyaev 1973) and the advection-dominated disc model with L (Watarai & Mineshige 2001). In Fig. 9 (top panel) we show the trends between the temperature and the bolometric luminosity for both the cool (blue points) and warm (orange points) blackbody components from the spectral fits of the ten individual XMM observations. Overlaid are the best-fitting least-squares regression line (solid blue, ), the L (dashed red) and the L (dotted black) trends. In Fig. 9 (bottom panel) we show the same results obtained with the eight spectra extracted in the count rate ranges of the XMM lightcurve (see Fig. 3). The bolometric (or total) luminosities of the cool blackbody and warm modified blackbody components are computed between 0.001-1000 keV by extrapolation, although most of the flux is emitted in the 0.1-10 keV range. Both plots show that the measured L–T relationship is in broad agreement with the thin SS73 disc. From the regression lines we obtain a power index, with the time resolved spectroscopy and , for the cool and hot components, respectively. Instead, with the flux resolved spectroscopy, the power indices are and . The possible correlation of the points in the L–T plot, for the cool and hot components, can be established with the Pearsons and Sperman correlation coefficients. These are reported in the Table 6 by using scipy.stats.pearsonsr and scipy.stats.spearmanr routine in PYTHON. They do not show always strong correlations.
| Correlation coefficient | TRS | FRS | ||
|---|---|---|---|---|
| Pearsons | 0.48 | 0.65 | 0.90 | 0.83 |
| Spearman | 0.39 | 0.55 | 0.93 | 0.05 |
TRS and FRS acronyms stand for time-resolved spectroscopy and flux-resolved spectroscopy, respectively.
Locally there are small deviations in Fig. 9 from the tight correlations. In particular, at high luminosities the temperature of the cool component is lower than the predictions from the L model or the regression line, which suggests that the disc is expanding and, perhaps, that the wind starts to contribute to the emission or the radius of the thermal component is not constant. The lowest-flux observation also shows a notable deviation, especially for the warm disc component, with a temperature higher than as predicted from the trends. This could be a hint of low/hard - high/soft behavior seen in Galactic X-ray binaries and might indicate a spectral transition below erg/s, although the spectra of NGC 55 ULX-1 never get as hard as the Galactic X-Ray Binaries (XRBs) likely due to its persistently high accretion rate (Koljonen et al. 2010).
Fig. 9 shows that there are deviations for the luminosity and temperatures from the best-fit regression line, approximately for total luminosity greater than . This fact can be used to give a rough estimate of the mass of the compact object. For instance, if we assume that the deviation is due to the total luminosity reaching the Eddington limit () and that the apparent luminosity is comparable to the intrinsic luminosity, using the definition erg/s, we estimate that the mass of the compact object is about 14 . Instead, if we assume that the deviation is due to the disc becoming supercritical (, Poutanen et al. 2007), then we obtain a value for the mass of the compact object of about 6 . Of course, should the intrinsic luminosity be greater than the apparent luminosity, which is possible given the weakness of the hard component, then the mass of the compact object would be larger. Bright ULXs with hard spectra typically have erg/s, which would result in 10–30 for NGC 55 ULX-1. Therefore, the mass range obtained would suggest that the compact object is a black hole. This agrees with the results obtained by Fiacconi et al. (2017) using wind arguments. Interestingly, some deviations are also seen in Galactic XRBs above (e.g. Steiner et al. 2009). If the deviations that we see refer to such threshold, then a larger mass of the compact object, i.e. a heavier BH, is forecast.
The radius of the cool component has a value of the order of ; instead the radius of the hot component is of the order of , (estimated with the relations between luminosity and temperature and blackbody definition). These correspond to, respectively, 200 and 10 , assuming a black hole of 10 . The radii of both components from the first to the eighth flux level do not vary significantly possibly due to the much larger uncertainties with respect to the temperature. Such results show a slight tension with Jithesh (2021) in which a tentative anti-correlation between the radius and the temperature of the cool component was found albeit at large uncertainties. This is probably due to the fact that we fixed the column density since we do not expect a strong variation of the neutral gas within a few hours, which are the timescale of the dips and the separation between consecutive observations.
By considering that the spherisation radius is and assuming that , the radius of the hot blackbody component is comparable to the spherisation radius () (Poutanen et al. 2007), instead the radius of the cool component is significantly larger than identifying the outer disc. However, these results are correct if the intrinsic luminosity is comparable with the observed one or if there are not large losses due to the occultation of the inner portion of the disc by the wind. Jithesh (2021) also used NuSTAR data to better constrain the hard band; we do no think the use of these data might alter our conclusions, since there is only marginal flux in the NuSTAR band which is not covered by the EPIC-PN. Besides, there are only a few simultaneous XMM/NuSTAR observations.
4.3 Comparison with other ULXs
In the brighter ( up to erg/s) and pulsating source NGC 1313 ULX-2 there is a clear anti-correlation between the bolometric luminosity and the temperature of the cool blackbody-like component (Robba et al. 2021). In that source the trend is in agreement with the L relationship predicted by X-ray emission from a wind photosphere rather than a disc (e.g. Qiu & Feng 2021, Kajava & Poutanen 2009, King 2009), and is likely due to the higher observed luminosity and possibly higher accretion rate for the pulsating neutron star. In the even brighter source in same galaxy, NGC 1313 ULX-1, Walton et al. (2020) found a deviation in the L–T relationship for the warm disc-like component which has been attributed to an intervening wind or a higher disc scale height. The cool component seems fairly constant in luminosity in NGC 1313 ULX-1. The debate on the nature of the different L-T trends is still open.
The lightcurve of NGC 55 ULX-1 shows a dipping behavior during the high-flux epochs which is very similar to that one shown by supersoft ULXs such as NGC 247 ULX-1 (Feng et al. 2016). There are much more data available for NGC 247 ULX-1 thanks to a recent deep XMM-Newton campaign (PI: Pinto). The results from the broadband analysis were shown by D’Aì et al. (2021) who reported on a complex hardness-intensity diagram characterised by two main branches; here at high luminosities the source enters the dipping branch in which the spectrum becomes progressively softer. It is possible that the deviation of the temperature of the cool component shown by NGC 55 ULX-1 at high luminosities (see above and Fig. 9) is the first stage of the dipping behavior seen in NGC 247 ULX-1 but with the wind not optically-thick enough to completely obscure the emission above 1 keV. This could be due to either a lower accretion rate or inclination angle in NGC 55 ULX-1. Given the lower luminosity and harder spectrum of NGC 55 ULX-1 as compared with the NGC 247 ULX-1 (see, e.g., Pinto et al. 2021), it is reasonable to speculate that the former is at a lower accretion rate with a thinner wind in the line of sight. Indeed, the dominant emission line blend at 1 keV from the wind is much stronger in NGC 247 ULX-1. More precisely, when modelled it with a cie component we obtained erg/s in NGC 55 ULX-1 (see Table LABEL:table:_XMM_0655050101_spectral_fits), while for NGC 247 ULX-1 it was erg/s (Pinto et al., 2021), i.e. twice as strong. A more powerful wind in NGC 247 ULX-1 is likely a consequence of a higher accretion rate.
5 Conclusions
In this work we have performed a spectral analysis to understand the structure and evolution of the accretion disc in the ultraluminous X-ray source NGC 55 ULX-1. The archival data was enriched with three deep XMM-Newton observations that we obtained in 2018, 2020 and 2021. This enabled to follow up the continuum changes and their relation with the source luminosity. As for most ULXs, it is necessary to use at least two spectral components to reproduce the spectral shape. The spectrum can be well fit with a two-blackbody model composed of a cool blackbody component, that describes the softer X-ray emission coming from the outer and cool part of the accretion disc and the wind photosphere, and a hotter blackbody modified by Compton scattering, that instead accounts for the emission from the hot inner disc. Both components become hotter at higher luminosities, indicating either a better and clearer view of the inner disc, due to e.g. a reduction of the wind photosphere density, or to an increase in the accretion rate. The variability of the wind features would favour the latter case. The trends between the bolometric luminosity and temperature of each component broadly agree with the relationship expected from constant area such as a thin disc. This suggests that the intrinsic luminosity of the source is not extremely high and likely close to the Eddington limit of a 10 black hole. At high luminosities the cool component is cooler than the predictions from the thin-disc model and the best-fit regression line. This would imply an expansion of the disc and a contribution to the emission from the wind. If the deviation occurs between the Eddington limit and the supercritical accretion rate, a black hole within 6-14 is foreseen.
6 Data availability
All of the data, with the exception of the Obs. ID 0883960101, and software used in this work are publicly available from ESA’s XMM-Newton Science Archive (XSA999https://www.cosmos.esa.int/web/XMM-Newton/xsa) and NASA’s HEASARC archive101010https://heasarc.gsfc.nasa.gov/.
Acknowledgements
This work is based on observations obtained with XMM-Newton, an ESA science mission funded by ESA Member States and USA (NASA). This work has been partially supported by the ASI-INAF program I/004/11/4 from the agreement ASI-INAF n.2017-14-H.0 and from the INAF mainstream grant. We acknowledge the XMM-Newton SOC for the great support in scheduling our observations. AM acknowledges a financial support from the agreement ASI-INAF n.2017-14-H.0 (PI: T. Belloni, A. De Rosa), the HERMES project by the Italian Space Agency (ASI) n. 2016/13 U.O, the H2020 ERC Consolidator Grant “MAGNESIA” No. 817661 (PI: Rea) and National Spanish grant PGC2018-095512-BI00.
References
- Alston et al. (2021) Alston W. N., et al., 2021, MNRAS, 505, 3722
- Bachetti et al. (2014) Bachetti M., Harrison F. A., Walton D. J., Grefenstette B. W., Chakrabarty D., et al., 2014, Nature, 514, 202
- Brightman et al. (2019) Brightman M., et al., 2019, ApJ, 873, 115
- D’Aì et al. (2021) D’Aì A., Pinto C., Pintore F., Del Santo M., Robba A., Ambrosi E., et al., 2021, MNRAS, 507, 5567
- De Marco et al. (2013) De Marco B., Ponti G., Miniutti G., Belloni T., Cappi M., Dadina M., Muñoz-Darias T., 2013, MNRAS, 436, 3782
- Earnshaw & Roberts (2017) Earnshaw H. M., Roberts T. P., 2017, MNRAS, 467, 2690
- Feng et al. (2016) Feng H., Tao L., Kaaret P., Grisé F., 2016, ApJ, 831, 117
- Fiacconi et al. (2017) Fiacconi D., Pinto C., Walton D. J., Fabian A. C., 2017, MNRAS, 469, L99
- Fürst et al. (2016) Fürst F., Walton D. J., Harrison F. A., et al., 2016, ApJ, 831, L14
- Fürst et al. (2017) Fürst F., Walton D., Stern D., Bachetti M., Barret D., Brightman M., HARRISON F., Rana V., 2017, Astrophys.J., 834, 77
- Fürst et al. (2018) Fürst F., Walton D. J., Heida M., Harrison F. A., Barret D., et al., 2018, A&A, 616, A186
- Gladstone et al. (2009) Gladstone J. C., Roberts T. P., Done C., 2009, MNRAS, 397, 1836
- Guo et al. (2019) Guo J., Sun M., Gu W.-M., Yi T., 2019, MNRAS, 485, 2558
- Gúrpide et al. (2021) Gúrpide A., Godet O., Koliopanos F., Webb N., Olive J. F., 2021, A&A, 649, A104
- Heil & Vaughan (2010) Heil L. M., Vaughan S., 2010, MNRAS, 405, L86
- Heil et al. (2009) Heil L. M., Vaughan S., Roberts T. P., 2009, MNRAS, 397, 1061
- Israel et al. (2017) Israel G. L., Belfiore A., Stella L., Esposito P., Casella P., et al., 2017, Science, 355, 817
- Jithesh (2021) Jithesh V., 2021, MNRAS,
- Kaaret et al. (2017) Kaaret P., Feng H., Roberts T. P., 2017, ARA&A, 55, 303
- Kaastra et al. (1996) Kaastra J. S., Mewe R., Nieuwenhuijzen H., 1996, in Yamashita K., Watanabe T., eds, UV and X-ray Spectroscopy of Astrophysical and Laboratory Plasmas. pp 411–414
- Kajava & Poutanen (2009) Kajava J. J. E., Poutanen J., 2009, Monthly Notices of the Royal Astronomical Society, 398, 1450
- Kara et al. (2020) Kara E., et al., 2020, MNRAS, 491, 5172
- King (2009) King A. R., 2009, MNRAS, 393, L41
- King et al. (2020) King A., et al., (2020), MNRAS, 494, pp.3611
- King et al. (2001) King A. R., Davies M. B., Ward M. J., Fabbiano G., Elvis M., 2001, ApJ, 552, L109
- Kobayashi et al. (2018) Kobayashi H., Ohsuga K., Takahashi H. R., Kawashima T., Asahina Y., Takeuchi S., Mineshige S., 2018, PASJ, 70, 22
- Koljonen et al. (2010) Koljonen K. I. I., Hannikainen D. C., McCollough M. L., Pooley G. G., Trushkin S. A., 2010, MNRAS, 406, 307
- Kosec et al. (2021) Kosec P., et al., 2021, MNRAS, 508, 3569
- Kosec et al. (2018) Kosec P., Pinto C., Fabian A. C., Walton D. J., 2018, MNRAS, 473, 5680
- Lodders & Palme (2009) Lodders K., Palme H., 2009, Meteoritics and Planetary Science Supplement, 72, 5154
- Middleton et al. (2015a) Middleton M. J., Heil L., Pintore F., Walton D. J., Roberts T. P., 2015a, MNRAS, 447, 3243
- Middleton et al. (2015b) Middleton M. J., Walton D. J., Fabian A., Roberts T. P., Heil L., Pinto C., et al., 2015b, MNRAS, 454, 3134
- Miller et al. (2004) Miller J. M., Fabian A. C., Miller M. C., 2004, The Astrophysical Journal, 607, 931
- Motch et al. (2014) Motch C., Pakull M. W., Soria R., Grisé F., Pietrzyński G., 2014, Nature, 514, 198
- Pinto et al. (2016) Pinto C., Middleton M. J., Fabian A. C., 2016, Nature, 533, 64
- Pinto et al. (2017) Pinto C., Alston W., Soria R., Middleton M. J., Walton D. J., et al., 2017, MNRAS, 468, 2865
- Pinto et al. (2020a) Pinto C., Mehdipour M., Walton D. J., et al., 2020a, MNRAS, 491, 5702
- Pinto et al. (2020b) Pinto C., Walton D. J., Kara E., Parker M. L., Soria R., et al., 2020b, MNRAS, 492, 4646
- Pinto et al. (2021) Pinto C., Soria R., Walton D. J., et al., 2021, MNRAS, 505, 5058
- Pintore et al. (2015) Pintore F., Esposito P., Zampieri L., Motta S., Wolter A., 2015, MNRAS, 448, 1153
- Pintore et al. (2020) Pintore F., et al., 2020, The Astrophysical Journal, 890, 166
- Poutanen et al. (2007) Poutanen J., Lipunova G., Fabrika S., Butkevich A. G., Abolmasov P., 2007, Monthly Notices of the Royal Astronomical Society, 377, 1187
- Qiu & Feng (2021) Qiu Y., Feng H., 2021, ApJ, 906, 10
- Robba et al. (2021) Robba A., Pinto C., Pintore F., et al., 2021, A&A, 652, 16
- Rodríguez Castillo et al. (2020) Rodríguez Castillo G. A., et al., 2020, ApJ, 895, 60
- Shakura & Sunyaev (1973) Shakura N. I., Sunyaev R. A., 1973, A&A, 500, 33
- Steiner et al. (2009) Steiner J. F., McClintock J. E., Remillard R. A., Narayan R., Gou L., 2009, ApJ, 701, L83
- Stobbart et al. (2004) Stobbart A. M., Roberts T. P., Warwick R. S., 2004, MNRAS, 351, 1063
- Stobbart et al. (2006) Stobbart A. M., Roberts T. P., Warwick R. S., 2006, MNRAS, 370, 25
- Strohmayer & Mushotzky (2003) Strohmayer T. E., Mushotzky R. F., 2003, The Astrophysical Journal, 586, L61–L64
- Strohmayer et al. (2007) Strohmayer T. E., Mushotzky R. F., Winter L., Soria R., Uttley P., Cropper M., 2007, The Astrophysical Journal, 660, 580–586
- Sutton et al. (2013) Sutton A. D., Roberts T. P., Middleton M. J., 2013, MNRAS, 435, 1758
- Takeuchi et al. (2013) Takeuchi S., Ohsuga K., Mineshige S., 2013, PASJ, 65, 88
- Urquhart & Soria (2016) Urquhart R., Soria R., 2016, MNRAS, 456, 1859
- Walton et al. (2016) Walton D. J., et al., 2016, The Astrophysical Journal, 827, L13
- Walton et al. (2018) Walton D. J., et al., 2018, ApJ, 856, 128
- Walton et al. (2020) Walton D. J., et al., 2020, MNRAS, 494, 6012
- Walton et al. (2021) Walton D. J., Mackenzie A. D. A., Gully H., Patel N. R., Roberts T. P., Earnshaw H. P., Mateos S., 2021, MNRAS,
- Watarai & Mineshige (2001) Watarai K.-y., Mineshige S., 2001, Publications of the Astronomical Society of Japan, 53, 915
- Webb et al. (2012) Webb N., Cseh D., Lenc E., Godet O., Barret D., et al., 2012, Science, 337, 554