The Physical Conditions of Emission-Line Galaxies at Cosmic Dawn
from JWST/NIRSpec Spectroscopy in the SMACS 0723 Early Release Observations
Abstract
We present rest-frame optical emission-line flux ratio measurements for five galaxies observed by the James Webb Space Telescope Near-Infared Spectrograph (NIRSpec) in the SMACS 0723 Early Release Observations. We add several quality-control and post-processing steps to the NIRSpec pipeline reduction products in order to ensure reliable relative flux calibration of emission lines that are closely separated in wavelength, despite the uncertain absolute spectrophotometry of the current version of the reductions. Compared to galaxies in the literature, the galaxies have similar ratios, similar ratios, and higher (0.5 dex) ratios. We compare the observations to MAPPINGS V photoionization models and find that the measured , , and emission-line ratios are consistent with an interstellar medium that has very high ionization (, units of cm s-1), low metallicity (), and very high pressure (, units of cm-3). The combination of and line ratios indicate very high electron temperatures of , further implying metallicities of with the application of low-redshift calibrations for “-based” metallicities. These observations represent a tantalizing new view of the physical conditions of the interstellar medium in galaxies at cosmic dawn.
i
1 Introduction
Emission lines provide a wealth of information about the physical conditions of galaxies. In particular, rest-frame optical lines can reveal the star formation rate (Kennicutt & Evans, 2012), nebular dust attenuation (Buat et al., 2002; Groves et al., 2012), active galactic nucleus (AGN) content (Baldwin et al., 1981; Veilleux & Osterbrock, 1987), and the metallicity (Lequeux et al., 1979; Tremonti et al., 2004), ionization (Kewley et al., 2019b), and density (Dopita et al., 2000) of the interstellar medium (ISM). Pairs of high-ionization and low-ionization lines that are closely separated in wavelength – for example, , , , and – are relatively insensitive to dust attenuation and so are especially useful as probes of ISM conditions.
The advent of efficient, multi-object optical and near-infrared spectroscopic surveys has expanded our knowledge of galaxy physical conditions from the local Universe to the peak of cosmic star formation at (Madau & Dickinson, 2014). Galaxies at have lower metallicity than galaxies of the same stellar mass (Henry et al., 2013; Steidel et al., 2014; Maiolino & Mannucci, 2019; Sanders et al., 2021), as expected from enrichment by star formation. But beyond the metallicity evolution they also have higher ionization (Liu et al., 2008; Kewley et al., 2015; Shapley et al., 2015; Strom et al., 2018; Backhaus et al., 2022; Papovich et al., 2022). Compared to the current epoch, galaxies at have higher AGN content (Trump et al., 2011; Juneau et al., 2014; Coil et al., 2015), higher-density Hii regions (Brinchmann et al., 2008; Liu et al., 2008; Davies et al., 2021), and more -enrichment from Wolf-Rayet stars and/or massive binaries (Masters et al., 2014; Strom et al., 2017; Sanders et al., 2020).
About a quarter of the stars in our Universe assemble at (Madau & Dickinson, 2014). Galaxies at these early times are expected to have even more extreme ISM conditions, with lower metallicity and higher ionization observed in their rest-frame UV emission (Smit et al., 2014; Stark et al., 2015; Amorín et al., 2017; Stark et al., 2017; Hutchison et al., 2019). The observed mid-infrared colors of high-redshift galaxies also suggest contribution from rest-frame optical emission lines with very high equivalent widths (van der Wel et al., 2011; González et al., 2012; Smit et al., 2014; Endsley et al., 2021), implying high star formation rates and a highly-ionized ISM. But directly measuring rest-frame optical emission lines of galaxies at has been enormously challenging due to high sky background from the ground, and has been entirely impossible at … until now.
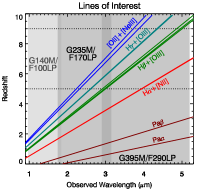
The launch of the James Webb Space Telescope (JWST, Gardner et al., 2006) opens an entirely new window on the high-redshift Universe. JWST/NIRSpec spectroscopy spans observed-frame 1-5 m, enabling detection of rest-frame optical emission lines to . Figure 1 highlights the coverage of the JWST/NIRSpec medium-resolution gratings for various rest-frame optical emission lines as a function of redshift. The advent of JWST observations finally allows a direct comparison of physical conditions over 13 Gyr of cosmic time, using the same set of rest-frame optical emission-line diagnostics from cosmic dawn to the current epoch.
In this paper we investigate the emission-line properties of five galaxies with JWST/NIRSpec spectroscopy from Early Release Observations of the galaxy cluster SMACS J0723.3–7327 (henceforth SMACS 0723). Section 2 describes the observations and data reduction, which includes some post-processing to ensure reliable relative flux calibration. Section 3 describes our spectral fitting and measurements of emission-line flux ratios. In Section 4 we compare our new line-ratio measurements with previous observations at lower redshift and with theoretical photoionization models, finding that the high-redshift galaxies have very high ionization () and low (but nonzero) metallicities (). We summarize the results in Section 5.
2 Observations
SMACS 0723 was observed by program #2736 as part of the JWST Early Release Observations111https://www.stsci.edu/jwst/science-execution/approved-programs/webb-first-image-observations (Pontoppidan et al., 2022). In this paper we focus on the NIRSpec observations of the 5 galaxies at that were presented by Carnall et al. (2022). All 5 of these galaxies are gravitationally lensed by the foreground cluster: ID 4590 () has a magnification factor of 8, while the other 4 galaxies have more modest magnification factors of 1.5-2 (using the parametric model of Pascale et al., 2022). SMACS 0723 was also observed with NIRISS spectroscopy and with NIRCam and MIRI imaging although we do not use those data in this work.
The JWST data used in this paper can be found in MAST: http://dx.doi.org/10.17909/67ft-nb86 (catalog 10.17909/67ft-nb86).
2.1 NIRSpec Observational Setup
The details of the NIRSpec instrument and the microshutter array (MSA) are described by Jakobsen et al. (2022) and Ferruit et al. (2022), respectively.
SMACS 0723 was observed with the G235M/F170LP (1.75-3.15m) and G395M/F290LP (2.9-5.2m) grating/filter pairs, each of which has spectral resolution of . Each grating was observed with two NIRSpec visits, with each visit using a three-nod pattern and two integrations of 20 groups (2918 s) per nod. The coadded spectra from each visit (combining from the three nods) have a total exposure time of 8754 s in each grating. Targets for the MSA configuration were selected using the NIRCam imaging in the field, especially prioritizing targets with photometric redshifts of . Each target was observed using a “slitlet” aperture of three microshutters and the design also included empty shutters for background subtraction.
2.2 Data Reduction and Quality Checks
We perform a complete reduction from Level 0 raw uncalibrated data (“_uncal.fits” files) available on the Mikulski Archive for Space Telescopes server (MAST)222https://mast.stsci.edu/, processed using version 1.8.2 of the JWST Science Calibration Pipeline with the “jwst-1015.pmap” calibration context. This reduction includes updates to the instrument models, gain response, flats and detector-level calibration files released in the months following the observations of the ERO programs. The reduced two-dimensional (2D) spectra (“s2d”) have a rectified trace with a flat slope, drizzled from the significantly curved (by 14-24 pixels over the spectral range) trace observed on the detector. The pipeline-reduced one-dimensional (1D) spectra (“x1d”) are extracted from the 2D spectra using an “extended” aperture with a width of 8 pixels. We instead extract spectra using a narrower “point-source” aperture, as described below.
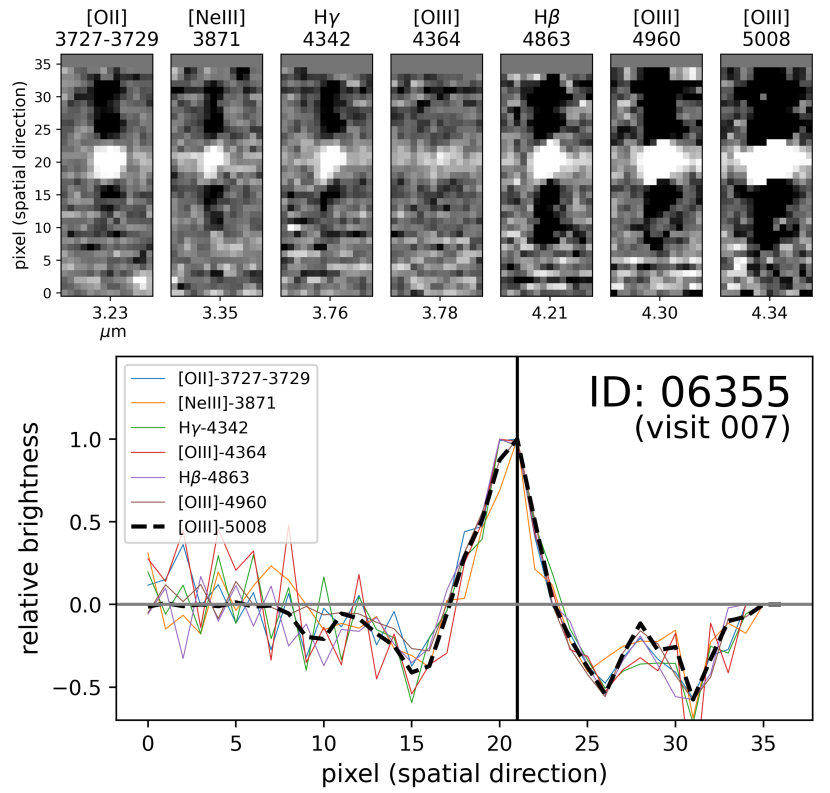
We confirmed that the reduced 1D spectra have excellent wavelength calibration, with differences of in best-fit line centers for different emission lines across the observed spectral range. We also confirmed that the reduced 2D spectra have a flat trace, with consistent spatial profiles of emission lines over the spectral range of each grating. The 2D line profiles for the galaxies are shown in Figure 2.
The current (version 1.8.2) data reduction pipeline uses a flux calibration that relies on knowledge of the instrument before launch. The pre-launch instrument throughput is known to differ from the post-launch performance (see Figure 20 of Rigby et al. 2022). We also find that synthetic photometry from the spectra have a median difference of 30% from the NIRCam photometry in the F200W, F356W, and F444W filters (and a smaller median difference of 14% in the F277W filter). For these reasons we avoid analysis and interpretation that require absolute spectrophotometric calibration, like using individual emission line fluxes or widely separated line ratios (e.g., [Oiii]/[Oii]). We confirm below that the spectra have reliable relative spectrophotometry for pairs of emission lines that are closely separated in wavelength.
The default 8-pixel “extended” extraction width used by the current (version 1.8.2) pipeline is generally too large for the compact high-redshift sources that are the focus of this paper: Figure 2 shows that all of our sources have their spectral trace confined to 4-5 pixels. We also found that the “extended” extraction apertures were often not well-centered on the target, such that the 1D spectrum included a significant amount of the “negative-nod” flux above and below the coadded 2D spectrum. The 1D spectra produced by these wide extraction apertures often include emission from serendipitous sources and detector artifacts that lie outside the trace of the main source. The wide-extraction spectra generally have inconsistent emission-line flux measurements between the two visits that differ by up to a factor of 2, with even worse (factor of 10) differences in the continuum emission. In addition, the wide-extraction spectra often have unphysical Balmer line ratios: e.g., compared to atomic calculations of for a broad range of temperature and density (Osterbrock, 1989). Other work on this same dataset (Schaerer et al., 2022; Curti et al., 2022; Taylor et al., 2022; Brinchmann, 2022) noted some of the same issues with the flux calibration of the pipeline-reduced data and took independent approaches to mitigating them.
| ID | Redshift | Visit | [Oii] | [Neiii] | H | [Oiii]4364 | H | ||
|---|---|---|---|---|---|---|---|---|---|
| 4590 | 8.4957 | 7 | 2.1 | 3.9 | 11.9 | 3.8 | 14.1 | 11.2 | 24.2 |
| 4590 | 8.4957 | 8 | 2.6 | 5.6 | 8.8 | 3.5 | 14.9 | *** | 29.8 |
| 5144 | 6.3792 | 7 | 5.2 | 8.0 | 11.0 | 2.8 | 20.5 | 31.9 | 62.9 |
| 5144 | 6.3792 | 8 | 5.3 | 7.3 | 10.7 | 5.1 | 18.4 | 32.9 | 59.3 |
| 6355 | 7.6651 | 7 | 17.2 | 11.1 | 11.5 | 3.1 | 19.0 | 36.0 | 70.6 |
| 6355 | 7.6651 | 8 | 16.2 | 10.8 | 8.8 | 2.1 | 18.2 | 33.7 | 66.2 |
| 8140 | 5.2753 | 7 | 9.0 | 2.4 | 0.8 | *** | 6.1 | 11.5 | 21.0 |
| 8140 | 5.2753 | 8 | 10.4 | 4.0 | 1.0 | 1.3 | 4.3 | 9.5 | 19.4 |
| 10612 | 7.6597 | 7 | 4.2 | 9.5 | 9.5 | 5.1 | 17.5 | 29.9 | 57.4 |
| 10612 | 7.6597 | 8 | *** | 9.1 | 9.4 | 4.2 | 15.8 | 27.6 | 52.5 |
| ID | Redshift | [Neiii]/[Oii] | |||
|---|---|---|---|---|---|
| 4590 | 8.4957 | ||||
| 5144 | 6.3792 | ||||
| 6355 | 7.6651 | ||||
| 8140 | 5.2753 | *** | |||
| 10612 | 7.6597 |
Rather than using the wide-extraction 1D spectra from the pipeline, we produce new 1D spectra from a narrower “point-source” extraction width individually optimized for each source (typically 4 pixels wide). This required significant customization of the (version 1.8.2) NIRSpec reduction pipeline in order to accurately align the extraction window with the position of the source. These narrow-extraction 1D spectra represent a dramatic improvement over the wide-extraction versions: they avoid much of the contamination from serendipitous sources and detector artifacts and have emission-line fluxes that are 2-4 larger due to avoiding the negative-nod emission present in the “extended” apertures. Most importantly, they have consistent emission-flux measurements between visits (with one exception noted in Section 3). We also visually inspect the 1D and 2D spectra and mask obvious defects in the spectra, generally caused by chip gaps or bad pixels on the CCD.
The flux uncertainties of our reduced 1D spectra appear to be underestimated by a factor of 2 (and by a factor of 1.3 in the wide-extraction spectra), as measured from a comparison of the normalized median absolute deviation (NMAD) of the flux with the median of the flux uncertainty for each source, calculated in wavelength regions without emission lines and avoiding chip gaps and bad pixels. We increase the flux uncertainty of the spectra using the ratio of the NMAD of the flux to the median flux uncertainty, i.e. an error rescaling factor of . We note that this error rescaling may still remain an underestimate of the true noise if the pixels of the spectrum are correlated.
Our post-processing improvements in flux calibration and 1D extraction represent a significant improvement over the (version 1.8.2) pipeline-reduced 1D spectra. However, our flux calibration additionally relies on pre-launch knowledge of the instrument that differs from the measured post-launch performance (Figure 20 of Rigby et al. 2022). In addition, the wavelength-dependent spatial resolution of NIRSpec will cause wavelength-dependent effects from aperture losses when using a fixed-width 2D spectral extraction. Despite these potential problems in the absolute flux calibration, we find that the relative flux calibration is consistent for pairs of emission lines that are near one another in wavelength. The line ratios of near-pair lines are also consistent between visits, as discussed in the next Section. Thus we are confident in using ratios of emission lines that are closely separated in wavelength, but we caution against the use of emission-line fluxes and equivalent widths, and against the direct comparison of lines that are widely separated in wavelength (like ).
3 Emission-Line Flux Ratio Measurements
We fit for the following emission lines in each spectrum (noted by vacuum wavelengths in Angstroms):
-
•
(the 3727+3729 doublet is blended in the medium-resolution NIRSpec grating)
-
•
-
•
-
•
-
•
-
•
-
•
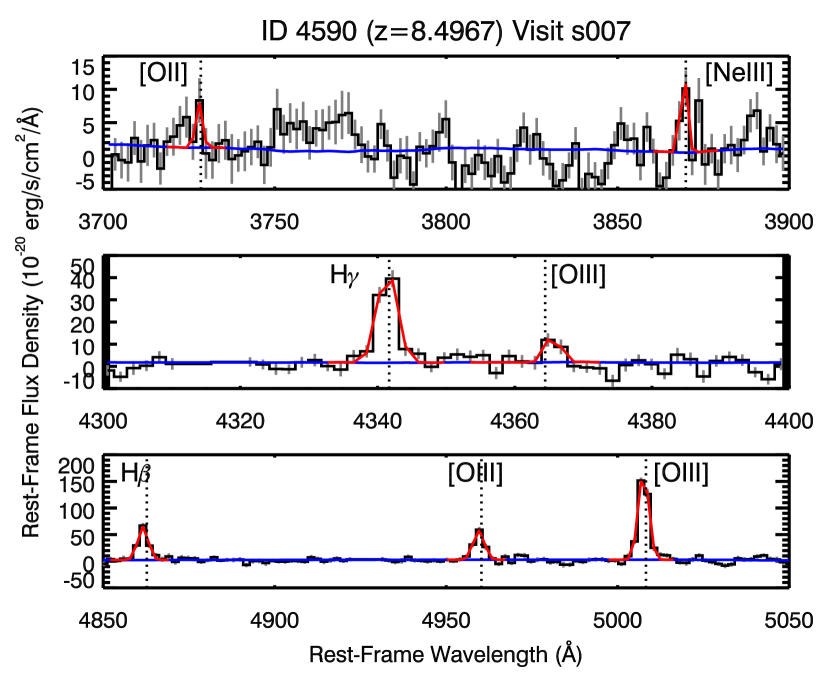
We find the best-fit Gaussian function (and associated uncertainties) for each emission line using a Levenberg-Marquardt least-squares method implemented by the mpfit IDL code333https://pages.physics.wisc.edu/craigm/idl/fitting.html. We subtract a continuum that is determined by smoothing (by a boxcar of 100 pixels) and interpolating the flux from all regions that are 5 above the median flux of the spectrum (i.e., over line-free regions). We fit the spectra from each of the two visits independently. Examples of the emission-line fits are shown in Figure 3. In a few cases, a line flux cannot be measured due to contaminating emission that extends beyond the main spectral trace (likely from a detector artifact or serendipitous source):
-
•
ID 4590, second visit:
-
•
ID 8140, first visit:
-
•
ID 10612, second visit:
Table 1 presents the source IDs, spectroscopic redshifts, and signal-to-noise (SNR) of each emission-line measurement for each visit of the observations. Table 2 presents the measured line ratios, generally computed from the average line measurements of the two visits. The line ratio is measured from only one visit if a line of the ratio cannot be measured in the other visit, i.e. for ID 4590 and for ID 10612. Neither nor H are robustly (3) detected in ID 8140 and so the line ratio is unconstrained for this galaxy.
We determined the spectroscopic redshift for each source using the best-fit line center for , which was the brightest emission line in each spectrum. As noted in Section 2.2, the reduced NIRSpec 1D spectra have excellent wavelength calibration and we found differences of only when measuring the redshift from the line centers of other emission lines.
Most of the emission lines are measured from the G395M spectrum, with bluer lines measured in the G235M spectrum for the lower-redshift sources. Because comparison with NIRCam photometry of the same galaxies indicates that the absolute flux calibration is suspect by a factor of 30%, we use only ratios of near-pair emission lines rather than individual emission-line fluxes. In cases where an emission line is measured in the wavelength range that is covered by both gratings, we take care to measure both lines in a given ratio from the same grating, given the differences in line flux measured from each grating (noted in Section 2.2).
The measured line strengths are generally consistent within their uncertainties between the two visits. ID 4590 is an exception, with a a factor of 2 difference in the measured line fluxes between the two visits. This is caused by a shutter that failed to open in one of the nod positions of the first (007) visit, as identified by Curti et al. (2022). Excluding ID 4590, the ratio of emission-line strengths measured in each visit is (mean and standard deviation of the sample) for lines that are 3 detected. Note that despite the difference in line fluxes, the emission-line ratios of ID 4590 are consistent between the two visits. Table 2 also demonstrates that the measured (mean and standard deviation of the sample), matching the atomic physics calculation (Storey & Zeippen, 2000) and establishing the reliability of the relative flux calibration for near-wavelength line pairs.
4 Line-Ratio Diagnostics
We infer galaxy properties from emission-line pairs that are closely separated in wavelength: namely , , and . The use of ratios of emission lines that are closely separated in wavelength avoids the issues with the absolute flux calibration described in Section 2.2, and is also largely insensitive to dust attenuation.
In each subsection below, we compare the observations with model spectra from Kewley et al. (2019a), produced using the MAPPINGS V photoionization code (Sutherland et al., 2018). These models use input stellar ionizing spectra from Starburst99 (Leitherer et al., 1999), which use a Salpeter (1955) initial mass function and include stellar mass loss. MAPPINGS V uses atomic data from the CHIANTI 8 database (Dere et al., 1997; Del Zanna et al., 2015) and applies photoionization, recombination, excitation, and dust depletion of model Hii regions in a plane-parallel geometry for the ionizing spectra. We use the “Pressure Models” of Kewley et al. (2019a) for a grid of pressure , ionization444We quantify ionization using , noting that many papers also use (or ) for ionization. , and metallicity :
-
•
Pressure , units of cm-3
-
•
Ionization , units of cm s-1
-
•
Metallicity
The MAPPINGS V models are characterized in terms of the total metallicity with respect to solar, but relative abundances of each element are not simply scaled from the solar abundances. At low metallicities the models use -enhanced abundances as described in Nicholls et al. (2017): for example, the relative [O/Fe] abundance is 0.5 dex higher than solar for . The alpha-enhancement at low metallicity in the MAPPINGS V models is motivated by studies of stellar abundances (e.g., Amarsi et al., 2019) and is also similar to the alpha-enhancement observed in nebular emission from both low-metallicity galaxies at (e.g., Steidel et al., 2016; Topping et al., 2020; Cullen et al., 2021) and from a more detailed study of relative abundances in our galaxies (Arellano-Córdova et al., 2022)
The ionizing spectra of low-metallicity stars are not well-constrained by observations and at the spectrum is essentially extrapolated from the Starburst99 inputs. That means the model spectra are most uncertain at the lowest metallicities, although they generally appear to be smooth continuations of the better-constrained models with higher metallicity. The MAPPINGS V models also use a single plane-parallel geometry for the ionization and may not effectively model Hii regions with multi-phase pressure and ionization and/or more complex geometries (Xiao et al., 2018; Kewley et al., 2019b).
4.1 OHNO: and
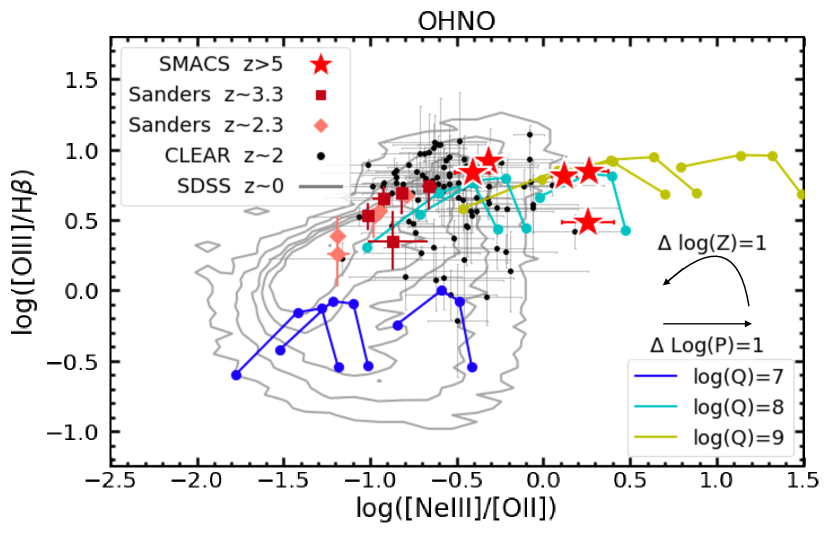
Figure 4 presents the “OHNO” line-ratio diagnostic of vs. , with the line-ratio measurements of the galaxies shown by large red stars. We use the samples of Backhaus et al. (2022) as a low-redshift comparison, with line ratios for galaxies in the CLEAR survey (Simons et al. in prep) measured from HST/WFC3 grism spectroscopy. A sample of 28,000 galaxies with detected OHNO emission lines from the Sloan Digital Sky Survey (SDSS, York et al., 2000) is shown by gray contours. Figure 4 also shows stacked line-ratio measurements from MOSDEF observations (Sanders et al., 2021) as pink and maroon points. The high- and low-redshift samples have different line-luminosity selection limits and so inter-comparison is nontrivial. The lack of robust absolute flux calibration means that we cannot construct samples of low-redshift galaxies that are matched to our galaxies (following, e.g., Juneau et al., 2014; Backhaus et al., 2022). Instead, we generally focus our discussion below on comparing the galaxies to the most extreme (highest ionization and lowest metallicity) galaxies present in the low-redshift samples.
Compared to the lower-redshift comparison samples, the galaxies in SMACS 0723 have similar ratios but have ratios that are higher by 0.5 dex. The redshift evolution of at fixed appears to be broadly consistent from to to to , with MOSDEF and CLEAR ratios that are higher than the “evolution-matched” sample and ratios that are even higher than the and ) ratios. The redshift evolution of from to and has been discussed in previous work (e.g. Zeimann et al., 2015; Strom et al., 2017; Kewley et al., 2019b; Jeong et al., 2020; Sanders et al., 2021; Backhaus et al., 2022) and requires a harder ionizing spectrum, likely caused by some combination of massive -enhanced low-metallicity stars, higher-density (and higher-pressure) Hii regions, and increased AGN content at higher redshift.
Here we demonstrate the same trend of increasing with redshift in galaxies at . The redshift evolution cannot be explained by the observed anticorrelation of with stellar mass (e.g., Sanders et al., 2021; Backhaus et al., 2022) since the lowest-mass SDSS, CLEAR, and MOSDEF galaxies have lower (by 0.5 dex) than the low-mass galaxies. We note that there is not an obvious trend of with redshift among the galaxies: for example a (ID 6355) galaxy has the lowest and a (ID 5144) galaxy has the highest , with ratios that are 3 inconsistent given their observational uncertainties. This likely indicates a diversity of ratios in individual galaxies, perhaps associated with the diversity of stellar mass, star formation rate, abundances, and/or age among this sample.
Figure 4 additionally compares the observed line ratios with MAPPINGS V theoretical models, as described above. In general the line ratios are well-described by MAPPINGS V models with an ISM that is highly ionized (), high pressure (), and/or low metallicity (), with some degeneracy between the three quantities to best describe the observations.
4.2 and
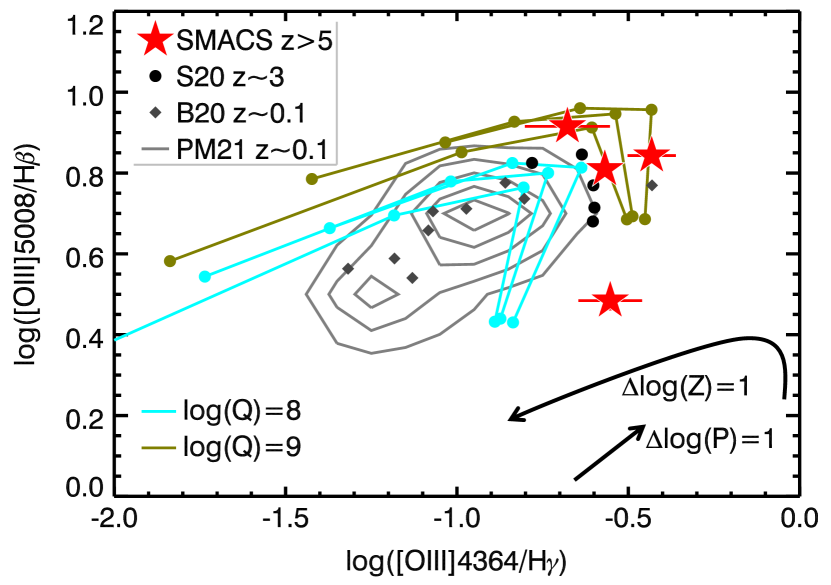
Figure 5 presents a comparison of the measured and line ratios of the four galaxies in our sample (shown again as large red stars). ID 8140 () is not shown in this Figure because its and H lines are only marginally (2) detected. Also shown in Figure 5 are line ratios of 5 galaxies measured by Sanders et al. (2020). We also compare to a low-redshift () sample of “green pea” galaxies from Brunker et al. (2020) that are selected based on their high-EW emission lines and are potential analogs to high-redshift / high-ionization starburst galaxies (see also, e.g., Henry et al., 2015; Flury et al., 2022). In addition, the gray contours in Figure 5 show the line-ratio distribution of 1800 extreme equivalent-width galaxies at identified from SDSS observations by Pérez-Montero et al. (2021).
As similarly noted in Section 4.1, the galaxies have similar (high) ratios to the and comparison samples. The galaxies have line ratios that are 0.5 dex higher than the general distribution of the low-redshift galaxies, although one of the green-pea galaxies has ratios as extreme as the galaxies. The similarity of these high-redshift galaxies to low-redshift (high-ionization) green-pea galaxies was also noted in other work (Katz et al., 2023; Rhoads et al., 2022). The ratios at are similar to, or perhaps 0.1-0.2 dex higher, than those of galaxies at . In the next subsection we describe how the high-redshift and line ratios are indicative of very high electron temperatures and low metallicities.
Figure 5 also compares the observations to the MAPPINGS V model line ratios (shown by the colored curves of ionization, metallicity, and pressure). The curve lies outside the range of the Figure (to the lower left) and is not shown. The and line ratios are largely insensitive to ISM pressure and so the three curves of different pressure () have very similar line ratios. As in the OHNO diagram in Figure 4, the observed line ratios in Figure 5 are consistent with the MAPPINGS models for a highly ionized and low-metallicity ISM, with and .
4.3 Electron Temperature and Metallicity
The ratio of the and the doublet can be used to measure the electron temperature of the ISM. These lines are all collisionally excited and the line de-excites from a higher energy orbital, such that higher emission relative to implies higher energy electrons responsible for the collisional excitation. The electron temperature can be used with the , , and Balmer lines for a “direct” metallicity estimate (e.g., Izotov et al., 2006; Pérez-Montero, 2017; Nicholls et al., 2020), although this requires good flux calibration between the widely separated [Oii] and [Oiii] lines. In this work we use empirical correlations that have been found between electron temperature and the “direct” metallicity (Amorín et al., 2015; Pérez-Montero et al., 2021) to measure “-based” metallicities.
We cannot directly compare our measured and line fluxes because of the uncertain absolute flux calibration of the NIRSpec spectra (see Section 2.2 for details). Instead, we rely on the reliable relative flux calibration and use the measured ratios of and , along with the intrinsic (relatively insensitive to temperature) Balmer ratio (Osterbrock, 1989). In other words, we measure the [Oiii] ratio as follows, abbreviating the [Oiii] lines by their wavelengths:
| (1) |
Note that this method also implicitly corrects the ratio for dust attenuation.
We use Equation 4 of Nicholls et al. (2020) to estimate and Equation 1 of Pérez-Montero et al. (2021) to estimate metallicity from the electron temperature555Nicholls et al. (2020) and Pérez-Montero et al. (2021) use different atomic datasets, Lennon & Burke (1994) and Storey et al. (2014), respectively, but the two datasets are very similar, with only minor differences that are much smaller than the observational uncertainties for the lines used in this work.. We use a -based metallicity because it can be calculated solely from near-pair line ratios (Equation 1), as opposed to the “direct” metallicity that additionally requires use of the [Oii] line and, by extension, robust absolute flux calibration. Uncertainties are calculated for both and metallicity using Monte Carlo resampling of the line ratios, including the calibration uncertainties for -based metallicity reported in Equation 1 of Pérez-Montero et al. (2021).
The inferred electron temperatures and -based metallicities, and their 1 uncertainties, are shown in Table 3. Electron temperature and metallicity cannot be calculated for ID 8140 () because its line ratio is unconstrained. Our electron temperature measurements agree very well with other studies of these galaxies (Schaerer et al., 2022; Curti et al., 2022; Arellano-Córdova et al., 2022; Katz et al., 2023; Taylor et al., 2022; Brinchmann, 2022), despite the independent approaches to flux calibration and spectral extraction used in each work. ID 4590 has an estimated electron temperature that exceeds the maximum value () used in the calibration of Pérez-Montero et al. (2021) and so its low metallicity represents a (modest) extrapolation of the relation. The sample of metal-poor galaxies compiled by Nakajima et al. (2022) similarly lacks analogs to the high (and high-ionization line ratios) measured for the galaxies.
| ID | Redshift | log(O/H)+12 | ||
|---|---|---|---|---|
| 4590 | 8.4957 | |||
| 5144 | 6.3792 | |||
| 6355 | 7.6651 | |||
| 10612 | 7.6597 |
It is important to note that the electron temperature measured in this fashion is associated with the portion of the ISM emitting the [Oiii] lines and may not be representative of the broader gas conditions. Significant gradients in density and/or ionization in the ISM may lead to a mix of high- and low-ionization regions and the [Oiii] electron temperature probes only the former. Our use of the Pérez-Montero et al. (2021) metallicity relationship also implicitly assumes that the high-redshift galaxies have the same relationship between metallicity and [Oiii] electron temperature as the calibration sample of high-ionization galaxies at low redshift. Nonetheless, the -based metallicity estimates presented in Table 3 have excellent agreement with the low metallicities implied from the comparison to the MAPPINGS models in Figures 4 and 5.
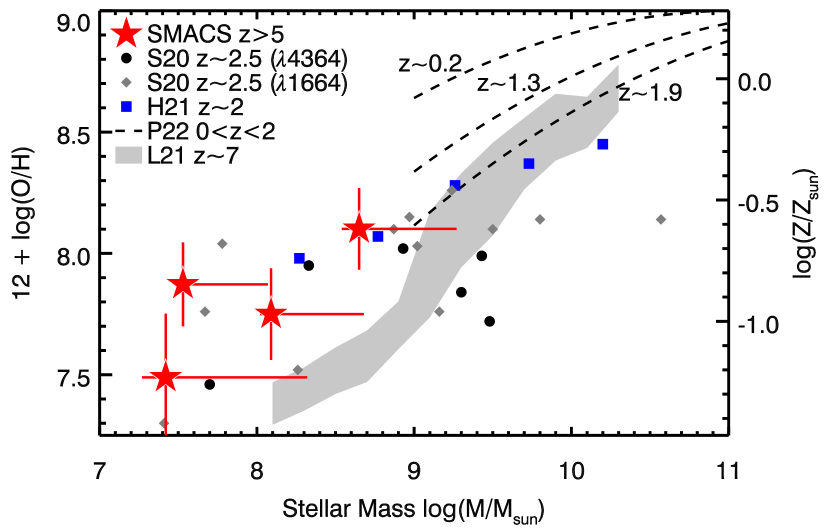
Figure 6 presents the mass-metallicity relation for the galaxies, using our -based metallicity estimates from Table 3. The stellar masses are from Carnall et al. (2022) and are estimated from spectral energy distribution with a Kroupa (2001) initial mass function, Bruzual & Charlot (2003) stellar population models, and nebular emission computed using CLOUDY (Ferland et al., 2017). Curti et al. (2022) and Schaerer et al. (2022) estimated significantly larger stellar masses for three of these galaxies. In order to reflect the potential systematic uncertainties, we add 0.5 dex upper error bars for the stellar masses in Figure 6.
We compare our mass-metallicity properties to a lower-redshift comparison sample of “direct” metallicity estimates from the Sanders et al. (2020) compilation of (black points) and (gray diamonds) galaxies at . The Figure also includes strong-line metallicities (using a Bayesian approach to R23) from stacked HST/WFC3 grism measurements of galaxies (blue squares) from Henry et al. (2021), as well as parametric mass-metallicity relations at , , (dashed lines) determined by Papovich et al. (2022). We additionally compare our galaxies with mass-metallicity predictions of galaxies at in the FLARES simulations (Lovell et al., 2021).
At fixed stellar mass, the metallicities of our galaxies are generally consistent with the metallicities of auroral-[Oiii]-selected galaxies of similar () stellar mass at . The galaxies are also consistent with the stacked strong-line metallicity measurements of Henry et al. (2021) and with a low-mass extrapolation of the mass-metallicity relationship of Papovich et al. (2022). However the large stellar mass uncertainties of our galaxies mean that they are also broadly consistent with slightly lower metallicities at fixed stellar mass compared to the lower-redshift samples.
The broad distribution of mass and metallicity among the sample is also notable. The galaxy with the highest metallicity ( for ID 6355) has very bright emission lines, implying a very high star formation rate. This galaxy also has a clumpy and extended morphology that is suggestive of a merger (Carnall et al., 2022). The other three galaxies all have lower metallicities and lower stellar masses, with ID 4590 at having the lowest metallicity and lowest stellar mass of the sample. It is interesting to measure such diversity in chemical enrichment and mass assembly in the early Universe among our limited sample of galaxies.
5 Conclusions
We use JWST/NIRSpec spectroscopy from the SMACS 0723 Early Release Observations to study the physical conditions of the interstellar medium in five galaxies at . We identify several caveats in the current (v1.8.2) reduction pipeline, including uncertain absolute flux calibration, too-wide spectral extractions, and underestimated uncertainties. We mitigate these issues using a custom spectral extraction, as described in detail in Section 2.2. We caution against uses of NIRSpec observations which require absolute spectrophotometry or accurate continuum detection, such as equivalent widths and comparisons of lines widely separated in wavelength, especially if using the standard (v1.8.2) pipeline products. However we find that the relative flux calibration is reliable, as determined by the stability of measured line ratios in different visits and by a measured for all galaxies.
We measure the ratios of rest-frame optical emission lines that are closely separated in wavelength, including , , and . Compared to lower-redshift () galaxies, the galaxies have similar , similar , and 0.5 dex higher . The emission-line ratios are generally well-described by MAPPING V photoionization models for an ISM that has very high ionization (), very high pressure (), and low metallicity ().
The and emission-line ratios indicate very high electron temperatures of in the four galaxies. We use these electron temperatures to estimate -based nebular metallicities of () in the 4 galaxies. Using stellar masses published in other work, we present a mass-metallicity diagram that compares the galaxies with lower-redshift samples and with theoretical simulations. The metallicities are broadly consistent with galaxies of similar stellar mass, although our interpretation is limited by highly uncertain stellar masses.
These measurements demonstrate the impressive capability of JWST spectroscopy for understanding the physical conditions of the gas in galaxies at cosmic dawn. We look forward to upcoming JWST observations of larger samples of galaxies that will further probe the assembly and chemical enrichment of the first galaxies in the Universe.
References
- Amarsi et al. (2019) Amarsi, A. M., Nissen, P. E., Asplund, M., Lind, K., & Barklem, P. S. 2019, A&A, 622, L4, doi: 10.1051/0004-6361/201834480
- Amorín et al. (2015) Amorín, R., Pérez-Montero, E., Contini, T., et al. 2015, A&A, 578, A105, doi: 10.1051/0004-6361/201322786
- Amorín et al. (2017) Amorín, R., Fontana, A., Pérez-Montero, E., et al. 2017, Nature Astronomy, 1, 0052, doi: 10.1038/s41550-017-0052
- Arellano-Córdova et al. (2022) Arellano-Córdova, K. Z., Berg, D. A., Chisholm, J., et al. 2022, arXiv e-prints, arXiv:2208.02562. https://arxiv.org/abs/2208.02562
- Backhaus et al. (2022) Backhaus, B. E., Trump, J. R., Cleri, N. J., et al. 2022, ApJ, 926, 161, doi: 10.3847/1538-4357/ac3919
- Baldwin et al. (1981) Baldwin, J. A., Phillips, M. M., & Terlevich, R. 1981, PASP, 93, 5, doi: 10.1086/130766
- Brinchmann (2022) Brinchmann, J. 2022, arXiv e-prints, arXiv:2208.07467. https://arxiv.org/abs/2208.07467
- Brinchmann et al. (2008) Brinchmann, J., Pettini, M., & Charlot, S. 2008, MNRAS, 385, 769, doi: 10.1111/j.1365-2966.2008.12914.x
- Brunker et al. (2020) Brunker, S. W., Salzer, J. J., Janowiecki, S., Finn, R. A., & Helou, G. 2020, ApJ, 898, 68, doi: 10.3847/1538-4357/ab9ec0
- Bruzual & Charlot (2003) Bruzual, G., & Charlot, S. 2003, MNRAS, 344, 1000, doi: 10.1046/j.1365-8711.2003.06897.x
- Buat et al. (2002) Buat, V., Boselli, A., Gavazzi, G., & Bonfanti, C. 2002, A&A, 383, 801, doi: 10.1051/0004-6361:20011832
- Carnall et al. (2022) Carnall, A. C., Begley, R., McLeod, D. J., et al. 2022, arXiv e-prints, arXiv:2207.08778. https://arxiv.org/abs/2207.08778
- Coil et al. (2015) Coil, A. L., Aird, J., Reddy, N., et al. 2015, ApJ, 801, 35, doi: 10.1088/0004-637X/801/1/35
- Cullen et al. (2021) Cullen, F., Shapley, A. E., McLure, R. J., et al. 2021, MNRAS, 505, 903, doi: 10.1093/mnras/stab1340
- Curti et al. (2022) Curti, M., D’Eugenio, F., Carniani, S., et al. 2022, MNRAS, doi: 10.1093/mnras/stac2737
- Davies et al. (2021) Davies, R. L., Förster Schreiber, N. M., Genzel, R., et al. 2021, ApJ, 909, 78, doi: 10.3847/1538-4357/abd551
- Del Zanna et al. (2015) Del Zanna, G., Dere, K. P., Young, P. R., Landi, E., & Mason, H. E. 2015, A&A, 582, A56, doi: 10.1051/0004-6361/201526827
- Dere et al. (1997) Dere, K. P., Landi, E., Mason, H. E., Monsignori Fossi, B. C., & Young, P. R. 1997, A&AS, 125, 149, doi: 10.1051/aas:1997368
- Dopita et al. (2000) Dopita, M. A., Kewley, L. J., Heisler, C. A., & Sutherland, R. S. 2000, ApJ, 542, 224, doi: 10.1086/309538
- Endsley et al. (2021) Endsley, R., Stark, D. P., Chevallard, J., & Charlot, S. 2021, MNRAS, 500, 5229, doi: 10.1093/mnras/staa3370
- Ferland et al. (2017) Ferland, G. J., Chatzikos, M., Guzmán, F., et al. 2017, Rev. Mexicana Astron. Astrofis., 53, 385. https://arxiv.org/abs/1705.10877
- Ferruit et al. (2022) Ferruit, P., Jakobsen, P., Giardino, G., et al. 2022, A&A, 661, A81, doi: 10.1051/0004-6361/202142673
- Flury et al. (2022) Flury, S. R., Jaskot, A. E., Ferguson, H. C., et al. 2022, ApJ, 930, 126, doi: 10.3847/1538-4357/ac61e4
- Gardner et al. (2006) Gardner, J. P., Mather, J. C., Clampin, M., et al. 2006, Space Sci. Rev., 123, 485, doi: 10.1007/s11214-006-8315-7
- González et al. (2012) González, V., Bouwens, R. J., Labbé, I., et al. 2012, ApJ, 755, 148, doi: 10.1088/0004-637X/755/2/148
- Groves et al. (2012) Groves, B., Brinchmann, J., & Walcher, C. J. 2012, MNRAS, 419, 1402, doi: 10.1111/j.1365-2966.2011.19796.x
- Henry et al. (2015) Henry, A., Scarlata, C., Martin, C. L., & Erb, D. 2015, ApJ, 809, 19, doi: 10.1088/0004-637X/809/1/19
- Henry et al. (2013) Henry, A., Scarlata, C., Domínguez, A., et al. 2013, ApJ, 776, L27, doi: 10.1088/2041-8205/776/2/L27
- Henry et al. (2021) Henry, A., Rafelski, M., Sunnquist, B., et al. 2021, ApJ, 919, 143, doi: 10.3847/1538-4357/ac1105
- Hutchison et al. (2019) Hutchison, T. A., Papovich, C., Finkelstein, S. L., et al. 2019, ApJ, 879, 70, doi: 10.3847/1538-4357/ab22a2
- Izotov et al. (2006) Izotov, Y. I., Stasińska, G., Meynet, G., Guseva, N. G., & Thuan, T. X. 2006, A&A, 448, 955, doi: 10.1051/0004-6361:20053763
- Jakobsen et al. (2022) Jakobsen, P., Ferruit, P., Alves de Oliveira, C., et al. 2022, A&A, 661, A80, doi: 10.1051/0004-6361/202142663
- Jeong et al. (2020) Jeong, M.-S., Shapley, A. E., Sanders, R. L., et al. 2020, ApJ, 902, L16, doi: 10.3847/2041-8213/abba7a
- Juneau et al. (2014) Juneau, S., Bournaud, F., Charlot, S., et al. 2014, ApJ, 788, 88, doi: 10.1088/0004-637X/788/1/88
- Katz et al. (2023) Katz, H., Saxena, A., Cameron, A. J., et al. 2023, MNRAS, 518, 592, doi: 10.1093/mnras/stac2657
- Kennicutt & Evans (2012) Kennicutt, R. C., & Evans, N. J. 2012, ARA&A, 50, 531, doi: 10.1146/annurev-astro-081811-125610
- Kewley et al. (2019a) Kewley, L. J., Nicholls, D. C., Sutherland, R., et al. 2019a, ApJ, 880, 16, doi: 10.3847/1538-4357/ab16ed
- Kewley et al. (2019b) Kewley, L. J., Nicholls, D. C., & Sutherland, R. S. 2019b, ARA&A, 57, 511, doi: 10.1146/annurev-astro-081817-051832
- Kewley et al. (2015) Kewley, L. J., Zahid, H. J., Geller, M. J., et al. 2015, ApJ, 812, L20, doi: 10.1088/2041-8205/812/2/L20
- Kroupa (2001) Kroupa, P. 2001, MNRAS, 322, 231, doi: 10.1046/j.1365-8711.2001.04022.x
- Leitherer et al. (1999) Leitherer, C., Schaerer, D., Goldader, J. D., et al. 1999, ApJS, 123, 3, doi: 10.1086/313233
- Lennon & Burke (1994) Lennon, D. J., & Burke, V. M. 1994, A&AS, 103, 273
- Lequeux et al. (1979) Lequeux, J., Peimbert, M., Rayo, J. F., Serrano, A., & Torres-Peimbert, S. 1979, A&A, 80, 155
- Liu et al. (2008) Liu, X., Shapley, A. E., Coil, A. L., Brinchmann, J., & Ma, C.-P. 2008, ApJ, 678, 758, doi: 10.1086/529030
- Lovell et al. (2021) Lovell, C. C., Vijayan, A. P., Thomas, P. A., et al. 2021, MNRAS, 500, 2127, doi: 10.1093/mnras/staa3360
- Madau & Dickinson (2014) Madau, P., & Dickinson, M. 2014, ARA&A, 52, 415, doi: 10.1146/annurev-astro-081811-125615
- Maiolino & Mannucci (2019) Maiolino, R., & Mannucci, F. 2019, A&A Rev., 27, 3, doi: 10.1007/s00159-018-0112-2
- Masters et al. (2014) Masters, D., McCarthy, P., Siana, B., et al. 2014, ApJ, 785, 153, doi: 10.1088/0004-637X/785/2/153
- Nakajima et al. (2022) Nakajima, K., Ouchi, M., Xu, Y., et al. 2022, arXiv e-prints, arXiv:2206.02824. https://arxiv.org/abs/2206.02824
- Nicholls et al. (2020) Nicholls, D. C., Kewley, L. J., & Sutherland, R. S. 2020, PASP, 132, 033001, doi: 10.1088/1538-3873/ab6818
- Nicholls et al. (2017) Nicholls, D. C., Sutherland, R. S., Dopita, M. A., Kewley, L. J., & Groves, B. A. 2017, MNRAS, 466, 4403, doi: 10.1093/mnras/stw3235
- Osterbrock (1989) Osterbrock, D. E. 1989, Astrophysics of gaseous nebulae and active galactic nuclei (University Science Books)
- Papovich et al. (2022) Papovich, C., Simons, R. C., Estrada-Carpenter, V., et al. 2022, arXiv e-prints, arXiv:2205.05090. https://arxiv.org/abs/2205.05090
- Pascale et al. (2022) Pascale, M., Frye, B., Diego, J., et al. 2022, arXiv e-prints, arXiv:2207.07102. https://arxiv.org/abs/2207.07102
- Pérez-Montero (2017) Pérez-Montero, E. 2017, PASP, 129, 043001, doi: 10.1088/1538-3873/aa5abb
- Pérez-Montero et al. (2021) Pérez-Montero, E., Amorín, R., Sánchez Almeida, J., et al. 2021, MNRAS, 504, 1237, doi: 10.1093/mnras/stab862
- Pontoppidan et al. (2022) Pontoppidan, K. M., Barrientes, J., Blome, C., et al. 2022, ApJ, 936, L14, doi: 10.3847/2041-8213/ac8a4e
- Rhoads et al. (2022) Rhoads, J. E., Wold, I. G. B., Harish, S., et al. 2022, arXiv e-prints, arXiv:2207.13020. https://arxiv.org/abs/2207.13020
- Rigby et al. (2022) Rigby, J., Perrin, M., McElwain, M., et al. 2022, arXiv e-prints, arXiv:2207.05632. https://arxiv.org/abs/2207.05632
- Salpeter (1955) Salpeter, E. E. 1955, ApJ, 121, 161, doi: 10.1086/145971
- Sanders et al. (2020) Sanders, R. L., Shapley, A. E., Reddy, N. A., et al. 2020, MNRAS, 491, 1427, doi: 10.1093/mnras/stz3032
- Sanders et al. (2021) Sanders, R. L., Shapley, A. E., Jones, T., et al. 2021, ApJ, 914, 19, doi: 10.3847/1538-4357/abf4c1
- Schaerer et al. (2022) Schaerer, D., Marques-Chaves, R., Oesch, P., et al. 2022, arXiv e-prints, arXiv:2207.10034. https://arxiv.org/abs/2207.10034
- Shapley et al. (2015) Shapley, A. E., Reddy, N. A., Kriek, M., et al. 2015, ApJ, 801, 88, doi: 10.1088/0004-637X/801/2/88
- Smit et al. (2014) Smit, R., Bouwens, R. J., Labbé, I., et al. 2014, ApJ, 784, 58, doi: 10.1088/0004-637X/784/1/58
- Stark et al. (2015) Stark, D. P., Richard, J., Charlot, S., et al. 2015, MNRAS, 450, 1846, doi: 10.1093/mnras/stv688
- Stark et al. (2017) Stark, D. P., Ellis, R. S., Charlot, S., et al. 2017, MNRAS, 464, 469, doi: 10.1093/mnras/stw2233
- Steidel et al. (2016) Steidel, C. C., Strom, A. L., Pettini, M., et al. 2016, ApJ, 826, 159, doi: 10.3847/0004-637X/826/2/159
- Steidel et al. (2014) Steidel, C. C., Rudie, G. C., Strom, A. L., et al. 2014, ApJ, 795, 165, doi: 10.1088/0004-637X/795/2/165
- Storey et al. (2014) Storey, P. J., Sochi, T., & Badnell, N. R. 2014, MNRAS, 441, 3028, doi: 10.1093/mnras/stu777
- Storey & Zeippen (2000) Storey, P. J., & Zeippen, C. J. 2000, MNRAS, 312, 813, doi: 10.1046/j.1365-8711.2000.03184.x
- Strom et al. (2018) Strom, A. L., Steidel, C. C., Rudie, G. C., Trainor, R. F., & Pettini, M. 2018, ApJ, 868, 117, doi: 10.3847/1538-4357/aae1a5
- Strom et al. (2017) Strom, A. L., Steidel, C. C., Rudie, G. C., et al. 2017, ApJ, 836, 164, doi: 10.3847/1538-4357/836/2/164
- Sutherland et al. (2018) Sutherland, R., Dopita, M., Binette, L., & Groves, B. 2018, MAPPINGS V: Astrophysical plasma modeling code. http://ascl.net/1807.005
- Taylor et al. (2022) Taylor, A. J., Barger, A. J., & Cowie, L. L. 2022, ApJ, 939, L3, doi: 10.3847/2041-8213/ac959d
- Topping et al. (2020) Topping, M. W., Shapley, A. E., Reddy, N. A., et al. 2020, MNRAS, 495, 4430, doi: 10.1093/mnras/staa1410
- Tremonti et al. (2004) Tremonti, C. A., Heckman, T. M., Kauffmann, G., et al. 2004, ApJ, 613, 898, doi: 10.1086/423264
- Trump et al. (2011) Trump, J. R., Weiner, B. J., Scarlata, C., et al. 2011, ApJ, 743, 144, doi: 10.1088/0004-637X/743/2/144
- van der Wel et al. (2011) van der Wel, A., Straughn, A. N., Rix, H. W., et al. 2011, ApJ, 742, 111, doi: 10.1088/0004-637X/742/2/111
- Veilleux & Osterbrock (1987) Veilleux, S., & Osterbrock, D. E. 1987, ApJS, 63, 295, doi: 10.1086/191166
- Xiao et al. (2018) Xiao, L., Stanway, E. R., & Eldridge, J. J. 2018, MNRAS, 477, 904, doi: 10.1093/mnras/sty646
- York et al. (2000) York, D. G., Adelman, J., Anderson, John E., J., et al. 2000, AJ, 120, 1579, doi: 10.1086/301513
- Zeimann et al. (2015) Zeimann, G. R., Ciardullo, R., Gebhardt, H., et al. 2015, ApJ, 798, 29, doi: 10.1088/0004-637X/798/1/29