[1] {NoHyper} \cortext[cor1]Corresponding author: khiem.lh@vinuni.edu.vn
LightX3ECG: A Lightweight and eXplainable Deep Learning System for 3-lead Electrocardiogram Classification
Abstract
Cardiovascular diseases (CVDs) are a group of heart and blood vessel disorders that is one of the most serious dangers to human health, and the number of such patients is still growing. Early and accurate detection plays a key role in successful treatment and intervention. Electrocardiogram (ECG) is the gold standard for identifying a variety of cardiovascular abnormalities. In clinical practices and most of the current research, standard 12-lead ECG is mainly used. However, using a lower number of leads can make ECG more prevalent as it can be conveniently recorded by portable or wearable devices. In this research, we develop a novel deep learning system to accurately identify multiple cardiovascular abnormalities by using only three ECG leads. Specifically, we use three separate One-dimensional Convolutional Neural Networks (1D-CNNs) as backbones to extract features from three input ECG leads separately. The architecture of 1D-CNNs is redesigned for high performance and low computational cost. A novel Lead-wise Attention module is then introduced to aggregate outputs from these three backbones, resulting in a more robust representation which is then passed through a Fully-Connected (FC) layer to perform classification. Moreover, to make the system’s prediction clinically explainable, the Grad-CAM technique is modified to produce a high meaningful lead-wise explanation. Finally, we employ a pruning technique to reduce system size, forcing it suitable for deployment on hardware-constrained platforms. The proposed lightweight, explainable system is named LightX3ECG. We got classification performance in terms of F1 scores of 0.9718 and 0.8004 on two large-scale ECG datasets, i.e., Chapman and CPSC-2018, respectively, which surpassed current state-of-the-art methods while achieving higher computational and storage efficiency. Visual examinations and a sanity check were also performed to demonstrate the strength of our system’s interpretability. To encourage further development, our source code is publicly available at https://github.com/lhkhiem28/LightX3ECG.
keywords:
Reduced-lead ECG Classification \sep1D-CNNs, Attention \sepExplainable AI (XAI) \sepModel Compression1 Introduction
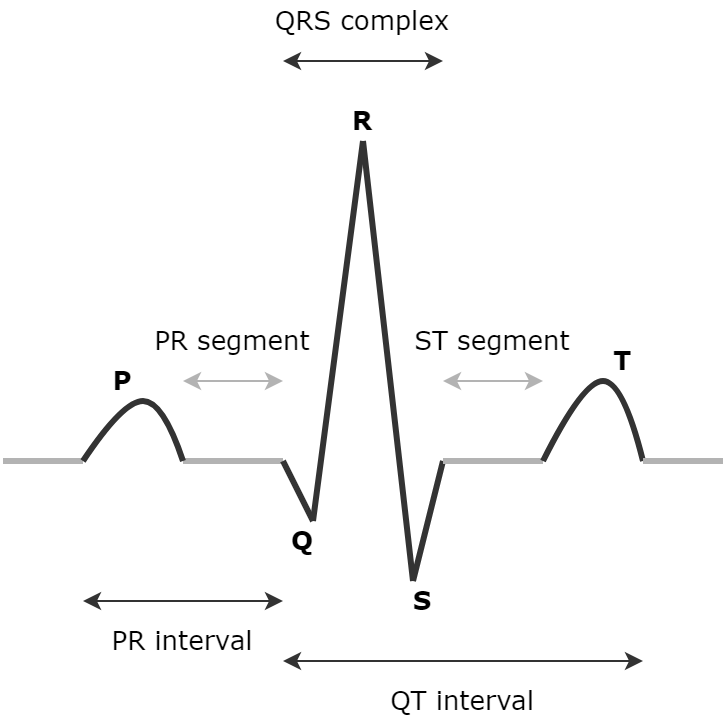
Cardiovascular diseases (CVDs) are one of the primary sources of death globally, accounting for 17.9 million deaths in 2019, representing 32% of all deaths worldwide. Also, three-quarters of these deaths take place in low- and middle-income countries, according to World Health Organization 111https://www.who.int/health-topics/cardiovascular-diseases. Therefore, it’s critical to detect these heart problems as soon as possible so that treatment may begin with counseling and medications. Electrocardiogram (ECG) is a waveform representation of the electrical activity of the heart obtained by placing electrodes on the body surface. The usual structure of an ECG signal [1], as illustrated in Figure 1.1, consists of three main components: P wave, which represents depolarization of atria; QRS complex, which represents depolarization of ventricles; and T wave, which represents repolarization of ventricles. Other parts of the signal include PR, QT intervals, or PR, ST segments. This electrical signal is a widely used, non-invasive tool for identifying cardiovascular abnormalities in patients. However, ECG analysis is a professional and time-consuming task, it requires cardiologists with a high degree of training to carefully examine and recognize pathological patterns in ECG recordings. This challenge, coupled with the rapid increase in ECG data, makes computer-aided, automatic ECG analysis more and more essential, especially in low- and middle-income countries, where high-quality and experienced cardiologists are extremely scarce.
The 12-lead ECG, which is standard for hospital and clinic usage, is typically recorded from electrodes placed on the patient’s limbs and on the surface of the chest. Thus, twelve ECG leads can be broken down into two main types: six limb leads (I, II, III, aVR, aVL, aVF) and six chest leads (V1, V2, V3, V4, V5, V6). Conventional 12-lead ECG has been also demonstrated to be effective for a variety of ECG analysis tasks by many previous efforts [2, 3, 4]. Acquiring 12-lead ECG, on the other hand, is redundant and heavily relied on clinical equipment with limited accessibility. Recently, breakthroughs in ECG technologies have led to the development of smaller, lower-cost, and easier-to-use ECG-enabled devices [5, 6, 7]. These advancements have paved the way for point-of-care screening and continuous monitoring using signals recorded by these devices [8, 9]. However, these types of devices only produce a subset of standard twelve leads, sometimes even just one lead. This raises the need for building ECG analysis methods that only rely on this subset of leads rather than the entire set. For that reason, in this study, we use a combination of only three ECG leads (I, II, and V1) as input for our system to strike a balance between high classification performance and the ease of signal acquisition. Leads I and II are used because they are easy to acquire and favored by cardiologists for quick review, as well as represent relatively enough information for six limb leads, according to some laws and equations [10]. Lead V1 is used to incorporate information about chest leads into the input.
Existing approaches for automatic ECG analysis can be divided into two categories: traditional methods and deep learning-based methods. In traditional methods, which are also known as two-stage methods, human experts hand-craft meaningful features from raw ECG signals such as statistical features (e.g., mean, standard deviation, variance, and percentile) or time- and frequency-domain features, referred to as expert features [11, 12]. Then, these features are concatenated and fed into some kinds of machine learning algorithms. The performance of these methods is significantly limited by the quality of expert features and the capability of machine learning algorithms applied. The second approach is to use end-to-end deep learning models that offer a high model capability without the need for domain knowledge and an explicit feature extraction stage [13]. These types of models have gained significant improvements compared to the former approach [4]. Deep learning models have dramatically improved the state-of-the-art in speech recognition, visual object recognition, object detection, and many other areas such as drug discovery and genomics [14]. Despite their superior performance, deep learning models are plagued by two well-known drawbacks: their black-box nature and increasingly large model size which limit their applicability in real-world scenarios. In this study, we aim to design an accurate ECG classification system that also overcomes these two issues.
In almost of previous works on deep learning-based 12-lead ECG classification, all twelve leads are standardized to the same length, then vertically stacked together to form a unified input and fed into a followed deep learning model [4, 3]. This strategy works well when dealing with 12-lead ECG. However, when dealing with a smaller number of leads, such as three, we propose to use three distinct models as separate backbones to handle three input ECG leads separately, which will be demonstrated in this study to give us better performance. This multi-input strategy is reasonable since these kinds of signals usually require separate treatment. In more detail, we employ three distinct redesigned One-dimensional Squeeze-and-Excitation Residual Networks (1D-SEResNets) [15], which are highly effective for dealing with ECG data, to extract features from three input signals. Then, inspired by the attention mechanism [16, 17], we design a novel Lead-wise Attention module as our aggregation technique to explore the most essential input lead and merge outputs of these backbones, resulting in a more robust representation that is then sent through an FC layer to perform classification.
Although deep learning models can achieve state-of-the-art performance in a range of predictive tasks, they are often viewed as black boxes. Due to high complexity, predictions made by these models are not traceable by humans. In many applications, especially in the medical domain, understanding the model’s behavior is as important as the accuracy of its predictions since it is difficult for cardiologists or pathologists to accept unexplainable decisions [18]. This makes Explainable AI (XAI) become a highly active research topic in the past few years [19]. In this study, we also construct an XAI framework for our 3-lead ECG classification task using class activation maps. Our XAI technique called Lead-wise Grad-CAM provides three different class activation maps for three input ECG leads, giving more clinical interpretability to our system. Another disadvantage of deep learning models, as previously discussed, is the expansion in model size. The majority of existing ECG classification research are primarily concerned with enhancing classification performance while paying little attention to model size, leading to memory-intensive models that are impractical for hardware-constrained platforms deployment [20]. To improve the proposed system’s suitability for point-of-care screening and remote monitoring deployment on these platforms, we apply a pruning technique to make the system lightweight and easy to distribute while just slightly sacrificing its performance.
To summarize, our main contributions are as follows:
-
•
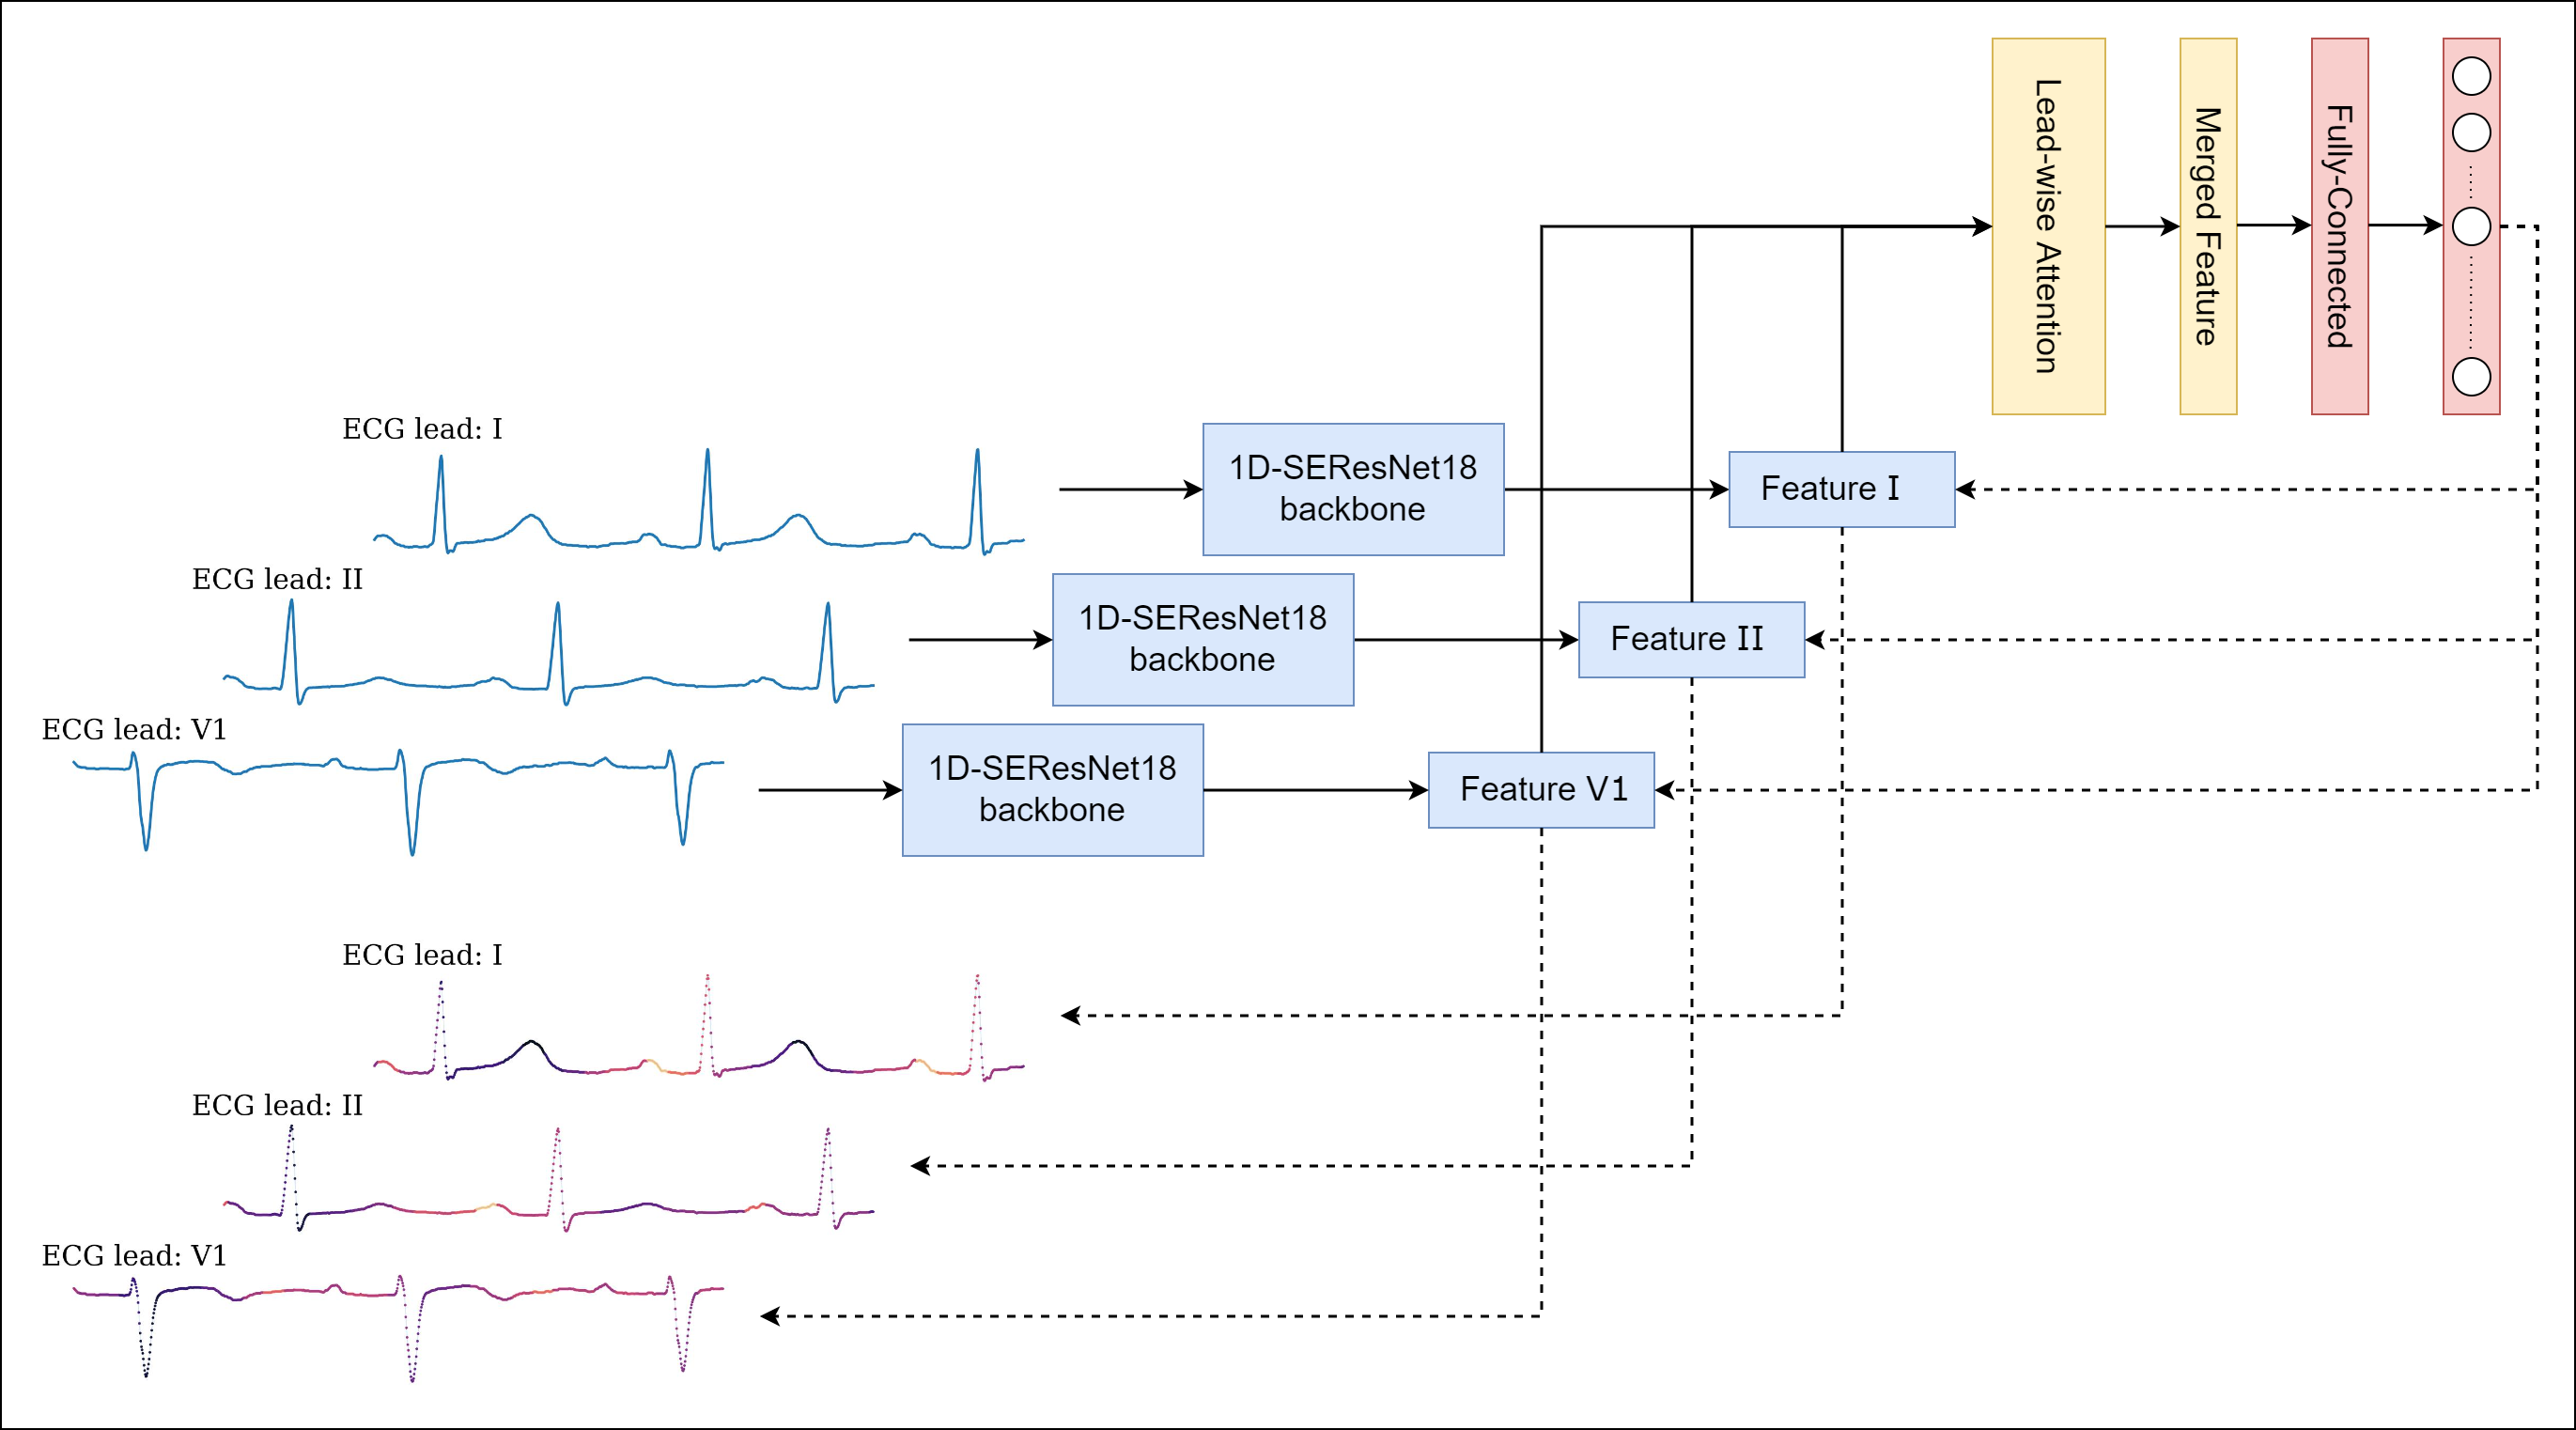
We propose an accurate deep learning system for 3-lead ECG classification which consists of three redesigned 1D-SEResNet backbones followed by a novel Lead-wise Attention module and an FC layer, as shown in Figure 1.2.
-
•
A novel XAI technique named Lead-wise Grad-CAM is introduced, which is adapted from the common Grad-CAM technique on the system’s architecture, giving a better explanation for the made prediction.
-
•
We further employ a pruning technique to reduce the system’s space on memory while mostly preserving its classification performance.
-
•
Extensive experiments were conducted on two large-scale multi-lead ECG datasets, i.e., Chapman and CPSC-2018 where our system showed superior performance in both multi-class and multi-label classification manners while enhancing compactness and clinical interpretability.
The rest of this article is organized as follows. Section 2 provides a survey of literature related to our work. In Section 3, we present components of the proposed system in detail. Section 4 describes the experimental setup and our results. An ablation study is performed in Section 5. Finally, we give further discussions and conclude this work in Section 6.
2 Related Work
In this section, we discuss some research directions and existing works that are highly related to our work, including deep learning-based ECG analysis, reduced-lead ECG classification, and explainable AI for ECG classification.
Deep learning-based ECG Analysis. Deep learning-based methods have been the preferred approach for ECG analysis over the last few years [13]. Specifically, 1D-CNNs have become popular when dealing with ECG data because of their one-dimension structure. Acharya et al. [21] early developed a 9-layer 1D-CNN to identify 5 different types of cardiovascular abnormalities. Recently, researchers have begun to use more sophisticated 1D-CNN architectures, particularly ones whose 2D version achieves high image classification accuracy. Zhang et al. [22] proposed using 1D-ResNet34, Zhu et al. [23] ensembled two 1D-SEResNet34s and one set of expert rules to identify more types of abnormalities. Furthermore, Yao et al. [24] constructed Time-Incremental ResNet18 (TI-ResNet18), a combination of a 1D-ResNet18 and an LSTM network in order to capture both spatial and temporal patterns in ECG signals. Other than CVD detection, deep learning models have been employed on ECG data for other variety of tasks. Li et al. [25] combined a sparse Autoencoder and Hidden Markov Model for diagnosing obstructive sleep apnea. Moreover, Santamaria-Granados et al. [26] focused on emotion, classifying the affective state of a person. Attia et al. [27] performed a proof of concept study on non-invasive drug assessment based on ECG signals. Rahman et al. [28, 29] tried to early diagnose COVID-19 using ECG trace images.
Reduced-lead ECG Classification. In recent years, some small, low-cost, and easy-to-use ECG-enable devices have been introduced in the market [5, 6, 7]. These devices are different from clinical equipment in that they only provide a subset of standard twelve ECG leads, sometimes just one. Thus, in most cases, newer methods are being developed to do ECG classification based on single- or reduced-lead data rather than standard 12-lead data. While single-lead ECG is currently limiting in performance, early studies have suggested that reduced-lead ECG may hold potential. Drew et al. [30] demonstrated that interpolated 12-lead ECG, which is derived from a reduced-lead set (limb leads plus V1 and V5), is comparable to standard 12-lead ECG for diagnosing wide-QRS-complex tachycardias and acute myocardial ischemia. Green et al. [31] also found that the leads III, aVL, and V2 together yielded a similar performance as the full 12-lead ECG for diagnosing acute coronary syndrome. Cho et al. [32] claimed that myocardial infarction could be detected not only with a conventional 12-lead ECG but also with a limb 6-lead ECG. Our work provides further support to demonstrate the ability of reduced-lead ECG for identifying a range of cardiovascular abnormalities, not just a few.
Explainable AI for ECG Classification. While the black-box nature of deep learning models may be ignorable in many contexts, it leads to a lack of responsibility and trust in decisions made in sensitive areas like medicine and healthcare. Hence, researchers have started to bring popular XAI techniques applied to image data into ECG data. Hughes et al. [33] proposed to use of Linear Interpretable Model-Agnostic Explanations (LIME). Zhang et al. [22], Anand et al. [34] applied SHapley Additive exPlanations (SHAP) analysis to test the interpretability of an ECG classification model. LIME and SHAP are both perturbation-based techniques that provide explanations based on the variation of output after applying perturbations to input. Some disadvantages of these techniques are combinatorial complexity explosion and producing explanations by very concrete class activation maps [35]. Due to inherent smoothing in provided explanations, some XAI techniques such as Grad-CAM and its variants are recently more preferred. Vijayarangan et al. [36], Raza et al. [37] employed Grad-CAM on 1D-CNN for single-lead ECG classification. Ganeshkumar et al. [38] further applied Grad-CAM on a multi-lead circumstance but generated the same class activation map for multiple input signals. In this work, we leverage the system’s architecture with the multi-input strategy and our Lead-wise Attention module to subtlely adapt Grad-CAM and provide one different informative class activation map for each of three input ECG leads.
3 Proposed System
In this section, we present the whole proposed system in detail. Firstly, the architecture of 1D-SEResNet backbones is described. Next, we sequentially introduce our novel Lead-wise Attention module and XAI technique, Lead-wise Grad-CAM. The pruning technique, which is used to establish LightX3ECG, is briefly discussed last. An overview of our LightX3ECG is shown in Figure 1.2.
3.1 1D-SEResNet Backbones
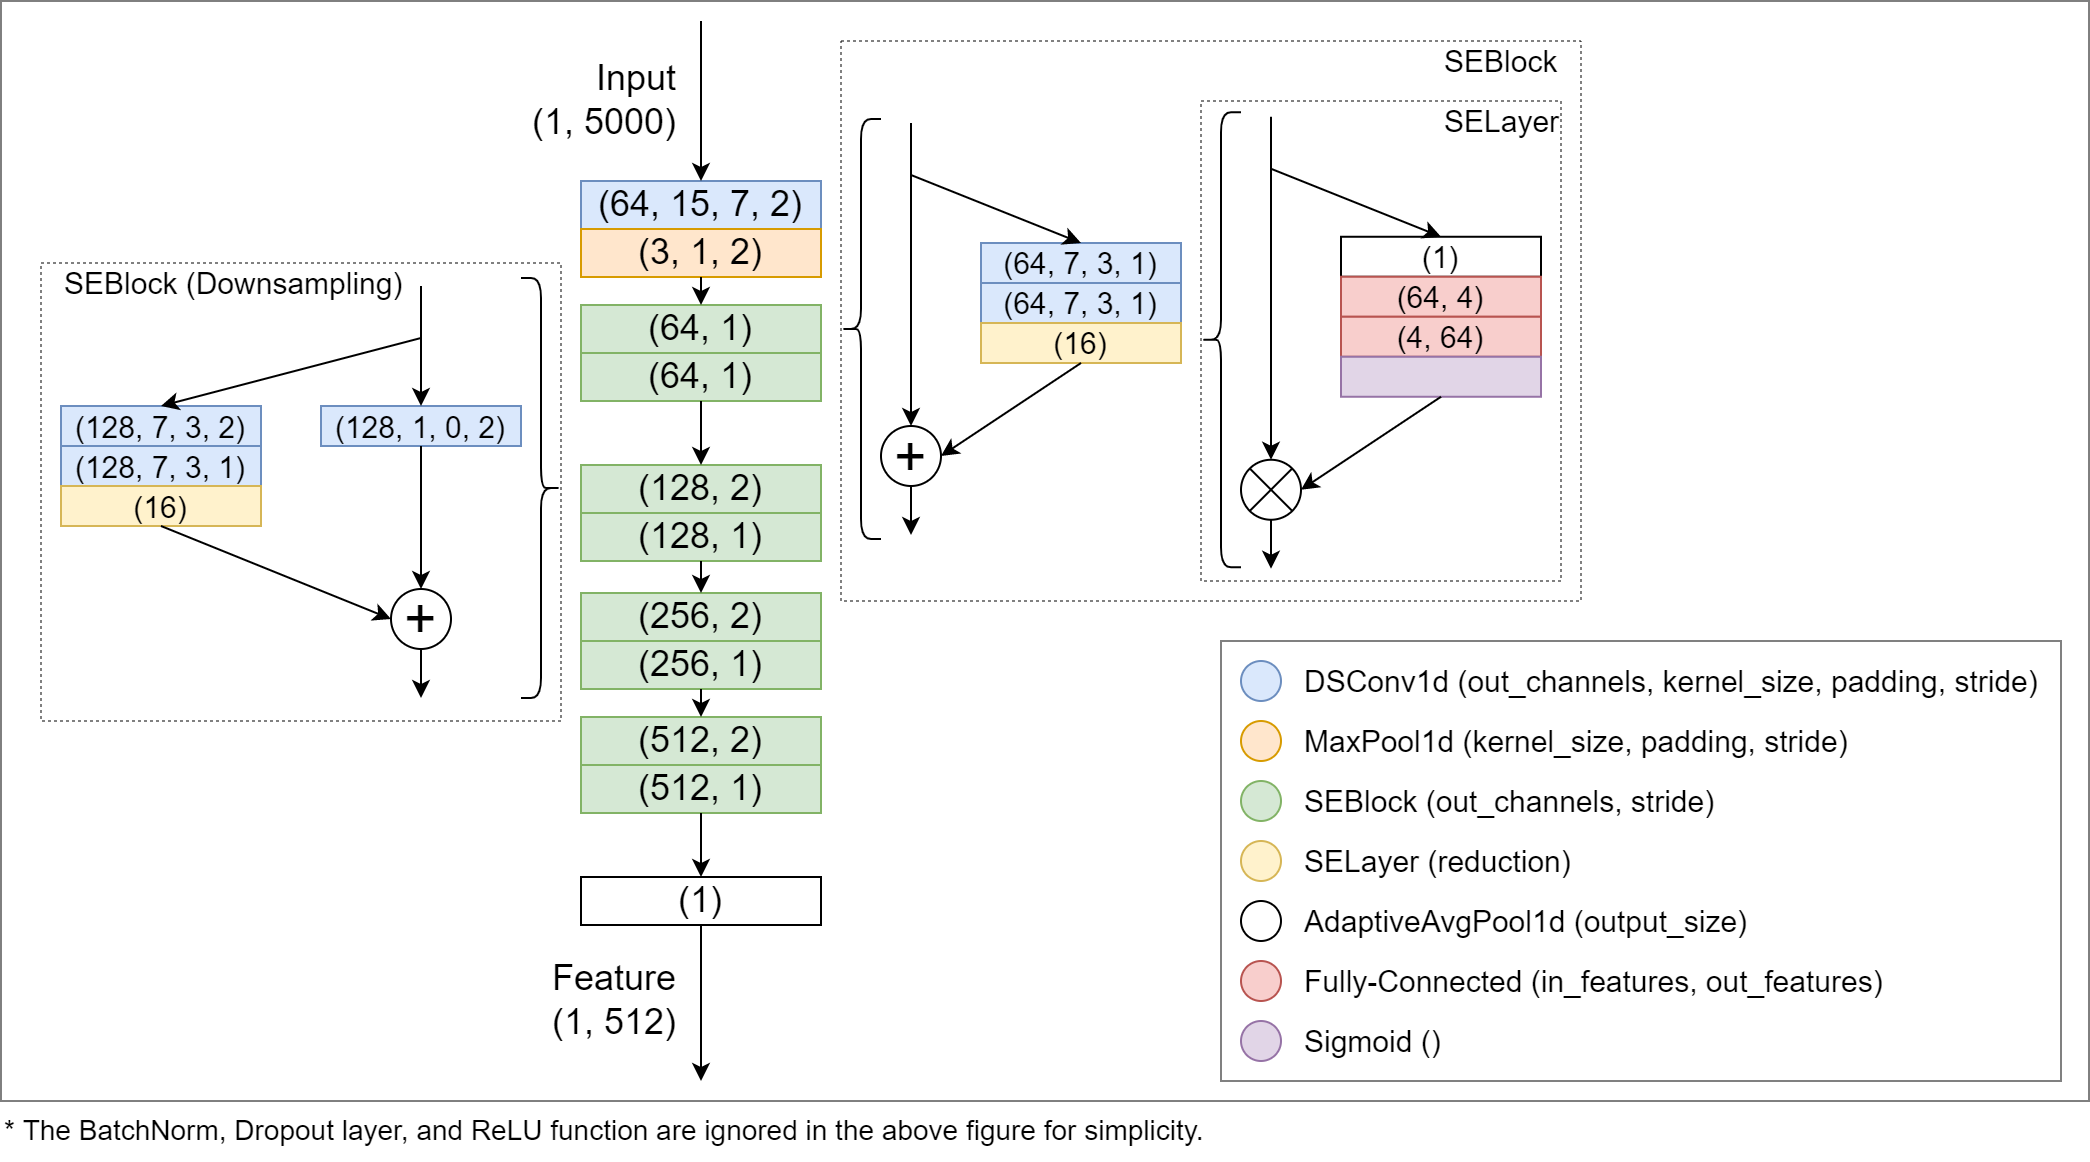
To achieve high performance and low computational cost backbones, we redesign 1D-SEResNet18 [15], which consists of 18 main layers, in two steps as follows.
First, Convolution (Conv) layers are modified with a much larger kernel size to expand those receptive fields in order to capture longer patterns in ECG signals. This strategy has been suggested more effective for ECG data in specific [39], and time-series data in general [40]. Second, we replace all of the standard Conv layers with Depth-wise Separable Conv (DSConv) layers for reducing the number of parameters of the model. Introduced in MobileNets [41, 42], DSConv splits computation of standard Conv into two parts. The first part is depth-wise, in which each filter only convolutes each input channel. Another part is point-wise, using a 1x1 filter to combine multi-channel outputs of depth-wise layers. This design reduces the total number of parameters of our system by 80%. This architecture is used for all three backbones and is illustrated in Figure 3.1.
3.2 Lead-wise Attention
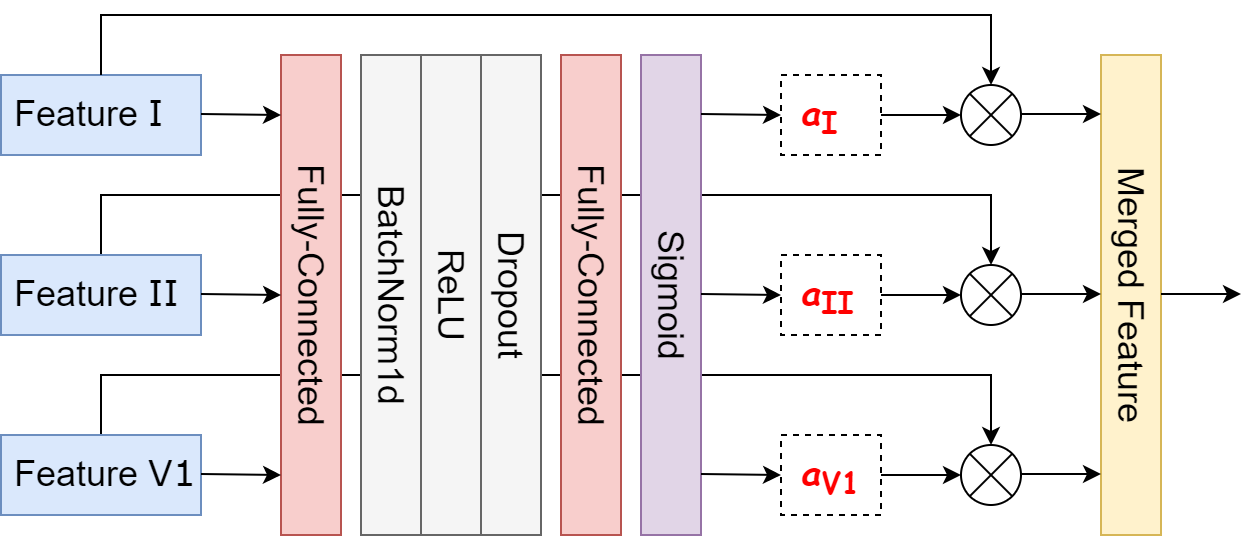
To achieve an end-to-end classification system, the outputs, also known as features or embeddings, extracted from backbones, must be combined. Typically, one can combine these features by simply applying a summation or concatenation operation to them, but this is usually ineffective due to their simplicity. Inspired by the success of the attention mechanism in many areas [17], we propose a Lead-wise Attention module to more effectively ensemble these features together and acquire a final robust feature which is then routed to the last FC layer, the classifier, to perform classification. Our Lead-wise Attention module is described in Figure 3.2.
Firstly, features from backbones are concatenated and sent through a sequential list of layers including an FC, a BatchNorm, a Dropout, followed by another FC layer and a Sigmoid function to determine the attention score, or importance score for each feature. Subsequently, the final feature is obtained by taking a weighted sum over these features by corresponding generated scores. This module can be formulated:
3.3 Lead-wise Grad-CAM
In the domain of imaging, Grad-CAM [43] is one of the most famous techniques to provide interpretability to 2D-CNNs which uses values of gradients flowing into the final Conv layer to produce a class activation map (CAM) [44, 45]. CAM is a heatmap that highlights class-specific regions of an image which the model looked at to classify that image. In this work, we adapt Grad-CAM to our system for the same aim, which we refer to as Lead-wise Grad-CAM, in the following steps.
First, similar to standard Grad-CAM, we employ values of gradients flowing into the final Conv layers of three backbones to gather three distinct CAMs corresponding to three input ECG leads. In addition to CAMs provided by Grad-CAM, the proposed system has an additional source of interpretability, the importance scores gathered from the Lead-wise Attention module that show the contribution of each backbone’s feature to the prediction of the system, therefore, show the contribution of each input signal. To take advantage of this insight from our Lead-wise Attention module, we multiply three CAMs by corresponding importance scores to get more informative heatmaps. Finally, for visualization, these heatmaps are normalized and overlaid on corresponding input ECG lead:
3.4 Pruning
A deep learning-based method often involves a large model and massive computation. Hence, when operating the proposed system on portable or wearable devices, issues such as insufficient memory or computational resources are noticeable. As a direct solution, we apply the weights pruning [46, 47] technique to compress the system and make it can be executed completely on these devices.
Weights pruning is a post-training model compression technique to make a trained model more sparse. This is accomplished by increasing the number of zero-valued elements present in the model’s weights. In this work, we prune 80% weights of the system with the lowest -norm in order to reduce the system’s space on memory 3 times while mostly maintaining its classification performance, and finally establishing LightX3ECG as a result. The idea is that weights with small -norm, or absolute value, contribute little to the prediction of the system, so they are less important and can be zeroed out.
4 Experiments and Results
In this section, we comprehensively describe our study design and all experimental results. Two datasets and implementation details are introduced first, then we report the performance of LightX3ECG and its interpretability.
4.1 Datasets
To benchmark the performance of the proposed system, we conducted experiments on two of the largest public real-world datasets for ECG classification, i.e., Chapman and CPSC-2018. Diagnosis class frequency and patient characteristics of these two datasets are shown in Table 1.
Chapman [48]. Chapman University and Shaoxing People’s Hospital collaborated to establish this large-scale multi-class ECG dataset which consisted of 10.646 12-lead ECG recordings collected from 10.646 patients. Each recording was taken over 10 seconds with a sampling rate of 500 Hz and labeled with 11 common diagnostic classes. The amplitude unit was microvolt. These 11 classes were grouped into 4 categories including AFIB, GSVT, SB, and SR. AFIB consists of atrial fibrillation and atrial flutter, GSVT contains supraventricular tachycardia, atrial tachycardia, atrioventricular node reentrant tachycardia, atrioventricular reentrant tachycardia, and sinus atrium to atrial wandering rhythm, SB only includes sinus bradycardia, and SR includes sinus rhythm and sinus irregularity.
CPSC-2018 [49]. In 2018, the first China Physiological Signal Challenge organized during the 7th International Conference on Biomedical Engineering and Biotechnology released a publicly available large-scale multi-label ECG dataset. This dataset contained 6.877 12-lead ECG recordings with a sampling rate of 500 Hz and durations ranging from 6 to 60 seconds. Millivolt was the amplitude unit. These ECG recordings were labeled with 9 diagnostic classes including SNR (normal sinus rhythm), AF (atrial fibrillation), IAVB (first-degree atrioventricular block), LBBB (left bundle branch block), RBBB (right bundle branch block), PAC (premature atrial contraction), PVC (premature ventricular contraction), STD (ST-segment depression), STE (ST-segment elevation).
Mean and standard deviation are reported for age.
| Chapman | |||
| Class | Frequency (%) | Male (%) | Age |
| AFIB | 2225 (20.90) | 1298 (58.34) | 72.90 11.68 |
| GSVT | 2307 (21.67) | 1152 (49.93) | 55.44 20.49 |
| SB | 3889 (36.53) | 2481 (63.80) | 58.34 13.95 |
| SR | 2225 (20.90) | 1025 (46.07) | 50.84 19.25 |
| CPSC-2018 | |||
| Class | Frequency (%) | Male (%) | Age |
| SRN | 918 (13.35) | 363 (39.54) | 41.56 18.45 |
| AF | 1221 (17.75) | 692 (56.67) | 71.47 12.53 |
| IAVB | 722 (10.50) | 490 (67.87) | 66.97 15.67 |
| LBBB | 236 (03.43) | 117 (49.58) | 70.48 12.55 |
| RBBB | 1857 (27.00) | 1203 (64.78) | 62.84 17.07 |
| PAC | 616 (08.96) | 328 (53.25) | 66.56 17.71 |
| PVC | 700 (10.18) | 357 (51.00) | 58.37 17.90 |
| STD | 869 (12.64) | 252 (29.00) | 54.61 17.49 |
| STE | 220 (03.20) | 180 (81.82) | 52.32 19.77 |
4.2 Implementation Details
To ensure the reproducibility of our results, the experimental setup including the data preprocessing step, training setting, and evaluation strategy, are all described.
Data Preprocessing: As a deep learning system requires inputs to be of the same length, all ECG recordings were fixed at 10 seconds in length in both datasets. This was done by truncating the part exceeding the first 10 seconds for longer recordings and padding shorter ones with zero. We took leads I, II, and V1 from each ECG recording to construct the input with the shape of 3x5000 and fed it into our system.
Data Augmentation: To reach a better generalization, we additionally propose the DropLead augmentation technique which randomly dropped one of three input signals with a probability of 50% during training. This was accomplished by masking the selected signal with all of zero. DropLead is not applied during the inference stage.
Training and Evaluation: For evaluation, we applied a 10-fold cross-validation strategy following some previous works [48, 22]. We stratify divided each of the two datasets into 10 folds and performed 10 rounds of training and evaluation. At each round, 8 folds; 1 fold; and 1 remaining fold were used as training, validation, and test set, respectively. In the multi-label classification manner, the optimal threshold of each class was searched in a range (0.05, 0.95) with a step of 0.05 to achieve the best F1 score on the validation set. We report the average performance of 10 rounds on the test set in terms of precision, recall, F1 score, and accuracy. For training, the proposed system was optimized by Adam optimizer [50] with an initial learning rate of 1e-3 and a weight decay of 5e-5 for 70 epochs. We used Cosine Annealing scheduler [51] in the first 40 epochs to reschedule the learning rate to 1e-4 and then kept it constant in the last 30 epochs. Cross-entropy and binary cross-entropy were utilized as loss functions in multi-class and multi-label manners, respectively. Finally, after weights pruning was applied, our system was fine-tuned for 5 epochs with the same setting except the learning rate was held constant at 1e-4. All experiments were run on a machine with an NVIDIA GeForce RTX 3090 TURBO 24G.
| Chapman | ||||
| Class | Precision | Recall | F1 score | Accuracy |
| AFIB | 0.9750 | 0.9662 | 0.9706 | 0.9878 |
| GSVT | 0.9510 | 0.9612 | 0.9561 | 0.9807 |
| SB | 0.9823 | 0.9987 | 0.9904 | 0.9930 |
| SR | 0.9860 | 0.9550 | 0.9703 | 0.9878 |
| Average | 0.9736 | 0.9703 | 0.9718 | 0.9873 |
| CPSC-2018 | ||||
| Class | Precision | Recall | F1 score | Accuracy |
| SRN | 0.6903 | 0.8342 | 0.7554 | 0.9266 |
| AF | 0.9344 | 0.9461 | 0.9402 | 0.9789 |
| IAVB | 0.9014 | 0.8828 | 0.8920 | 0.9775 |
| LBBB | 0.9038 | 0.8704 | 0.8868 | 0.9913 |
| RBBB | 0.9454 | 0.9428 | 0.9441 | 0.9702 |
| PAC | 0.6972 | 0.5758 | 0.6307 | 0.9353 |
| PVC | 0.8796 | 0.7197 | 0.7917 | 0.9637 |
| STD | 0.7870 | 0.7824 | 0.7847 | 0.9469 |
| STE | 0.6486 | 0.5217 | 0.5783 | 0.9746 |
| Average | 0.8209 | 0.7862 | 0.8004 | 0.9628 |
4.3 System Performance
| Method | F1 on Chapman | F1 on CPSC-2018 | No. Params (M) | No. FLOPs (B) | Size (MB) |
| 1D-ResNet34 [22] | 0.9624 | 0.7684 | 16.61 | 5.91 | 58.18 |
| 1D-SEResNet34 [23] | 0.9659 | 0.7845 | 16.76 | 5.91 | 58.75 |
| TI-ResNet18 [24] | 0.9647 | 0.7872 | 11.39 | 1.42 | 40.51 |
| InceptionTime [40] | 0.9417 | 0.7352 | 0.45 | 2.29 | 1.63 |
| LightX3ECG (Ours) | 0.9718 | 0.8004 | 5.31 | 1.34 | 6.52 |
| LightX3ECG (w/o pruning) | 0.9722 | 0.8010 | 5.31 | 1.34 | 19.28 |
We got F1 scores of 0.9718 and 0.8004 on two datasets, i.e., Chapman and CPSC-2018, respectively. Overall, accuracy for each class exceeded 0.92 and the average exceeded 0.96 in both. However, we also observed that F1 scores of PAC and STE classes were limited, which could be due to the insufficiency of these diagnosis classes in the CPSC-2018 dataset. Detailed performance is presented in Table 2.
For precisely benchmarking, we compared LightX3ECG with some popular ECG classification methods, which can be considered state-of-the-art including 1D-ResNet34 [22], 1D-SEResNet34 [23], InceptionTime [40], and TI-ResNet18 [24]. For fair comparisons, all of these methods were implemented and trained using 3-lead ECG as input and setting similar to our system. Comparisons of F1 scores, complexity, and compactness are shown in Table 3. LightX3ECG outperformed other methods in both datasets while achieving the lowest computational cost with FLOPs at 1.34B. In terms of storage efficiency, our system only took up 6.52MB on disk, which was much less than the other three methods. Additionally, the performance of the system without applying weights pruning showed that effectively using this technique helps reduce the system’s space significantly with a negligible side-effect.
4.4 System Interpretability
A comprehensive validation was conducted to demonstrate LightX3ECG’s interpretability, including a visual check and a methodical check.
4.4.1 Visual examinations
For visual check, we carefully reviewed the explanation from the system for a sample ECG recording belonging to each of the diagnosis classes in the CPSC-2018 dataset and compared it with some cardiological evidence collected from a variety of sources [52, 53, 54, 55, 56, 57], and LITFL ECG Library 222https://litfl.com/category/ecg-library.
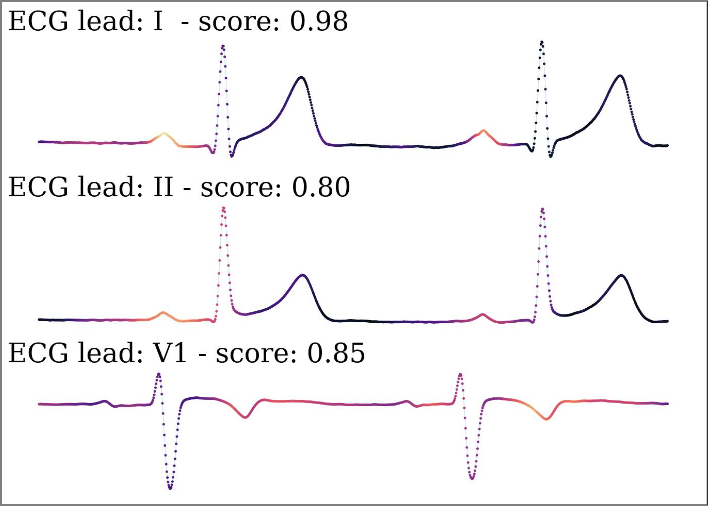
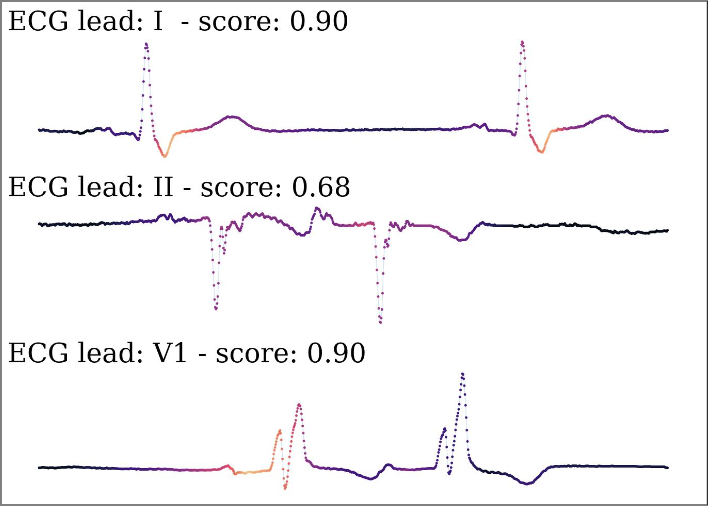
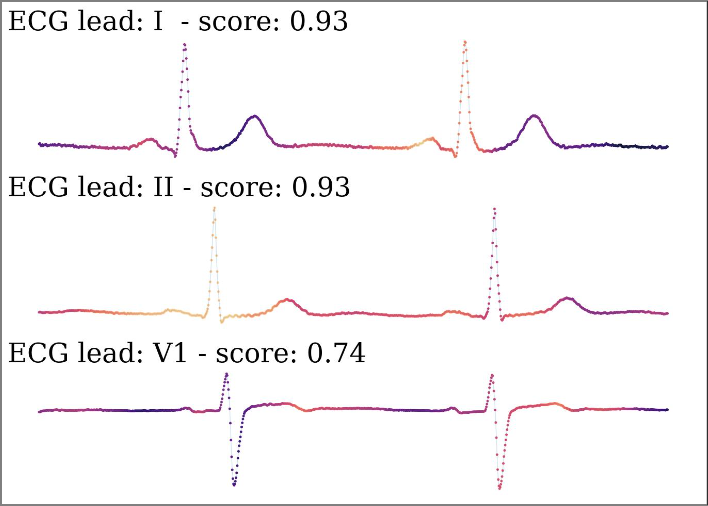
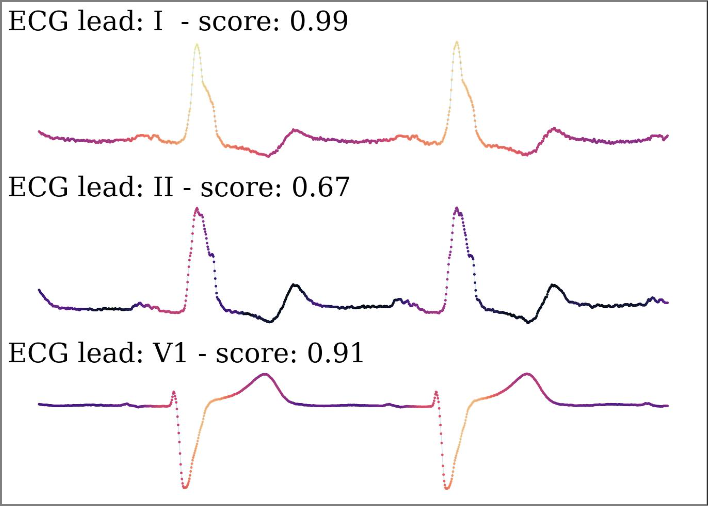
1) SNR (normal sinus rhythm). An SNR ECG recording has a normal P wave preceding each QRS complex, which is also standard, as seen in Figure 1.1. Also, P waves upright in leads I and II. From activation maps in Figure 4.1, we can see that system strongly focused on regions of P waves in leads I and II. Thus, the explanation is consistent with the diagnostic criteria of SNR. The importance scores indicated that lead I contributed more to the system’s prediction than others.
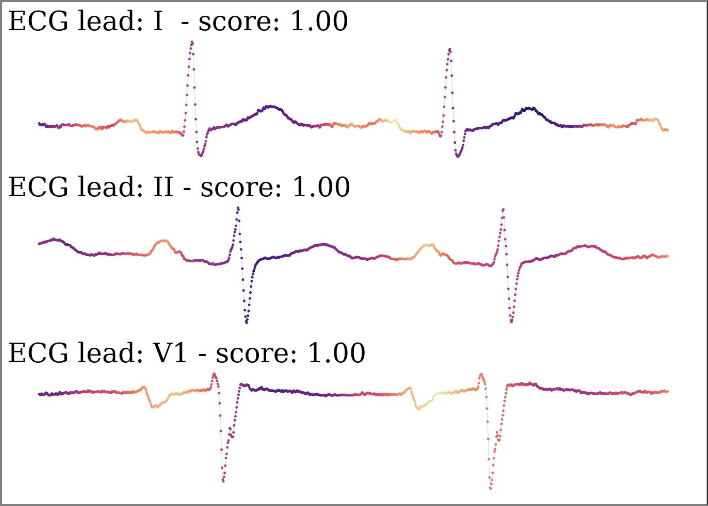
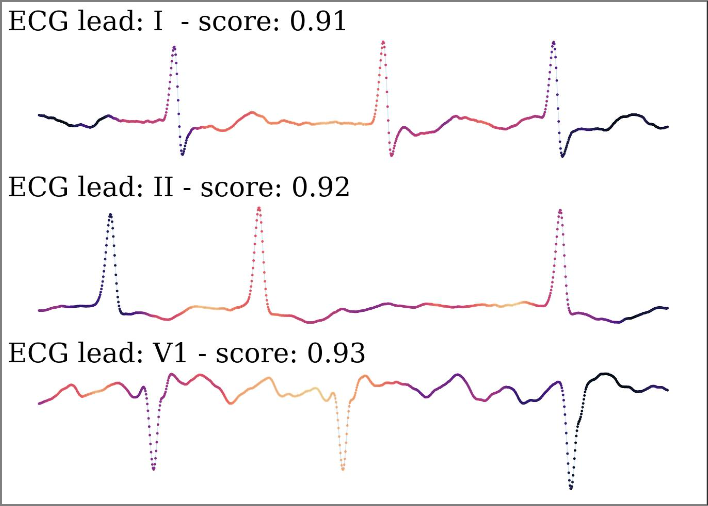
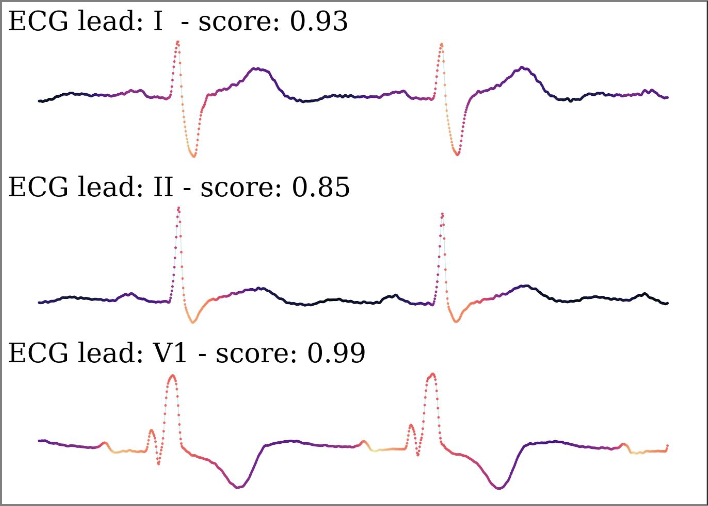
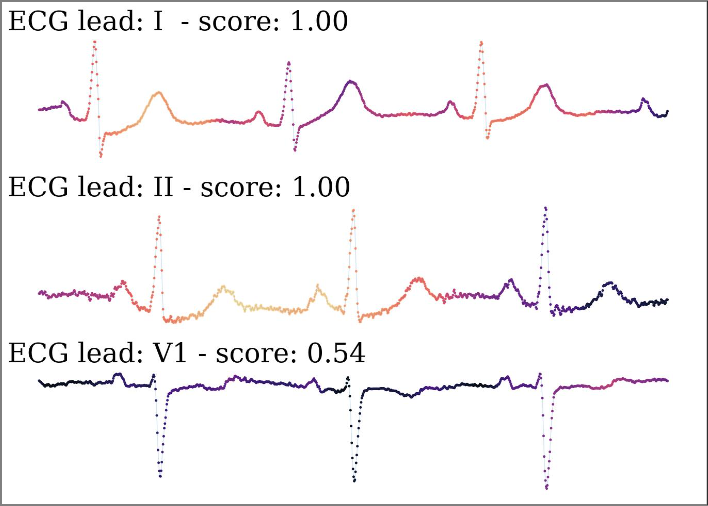
2) AF (atrial fibrillation). An AF ECG recording has irregular QRS complexes with the lack of P waves. Also, fibrillatory waves are usually visible in lead V1. From activation maps in Figure 4.2, we can see that system recognized the lack of P waves in leads I and II, and fibrillatory waves in lead V1. Thus, the explanation is consistent with the diagnostic criteria of AF. The importance scores indicated that three leads contributed roughly equally to the system’s prediction.

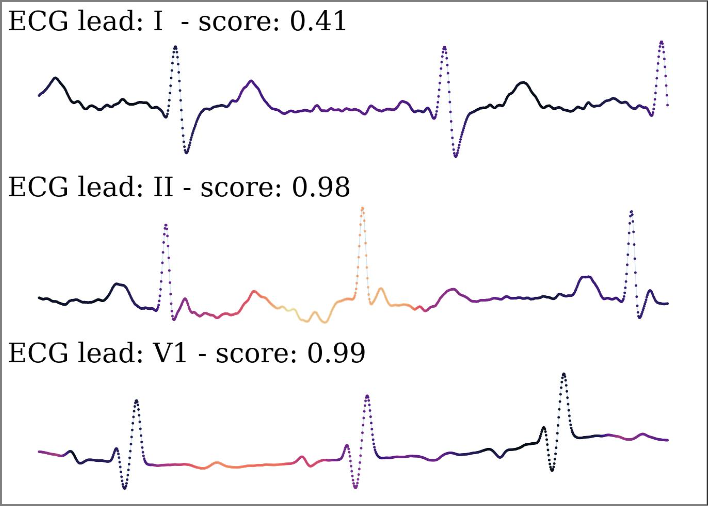
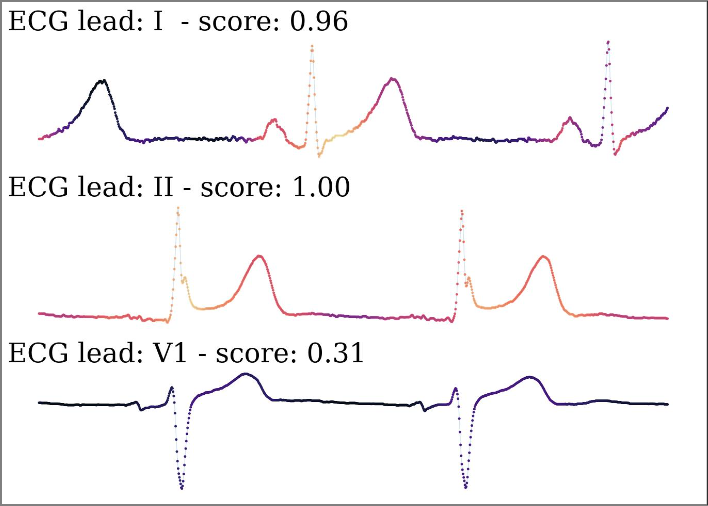
3) IAVB (first-degree atrioventricular block). An IAVB ECG recording has prolonged PR intervals. Also, P waves are buried in the preceding T wave. From activation maps in Figure 4.3, we can see that system recognized the prolonged PR intervals in leads I and II. Thus, the explanation is consistent with the diagnostic criteria of IAVB. The importance scores indicated that three leads contributed roughly equally to the system’s prediction.
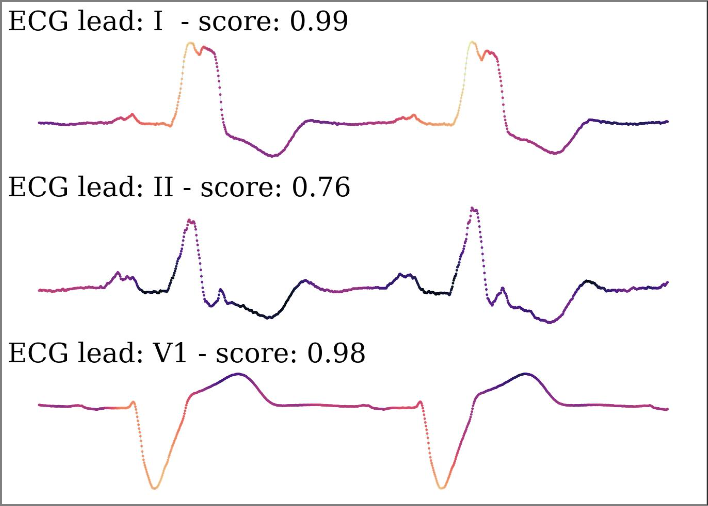
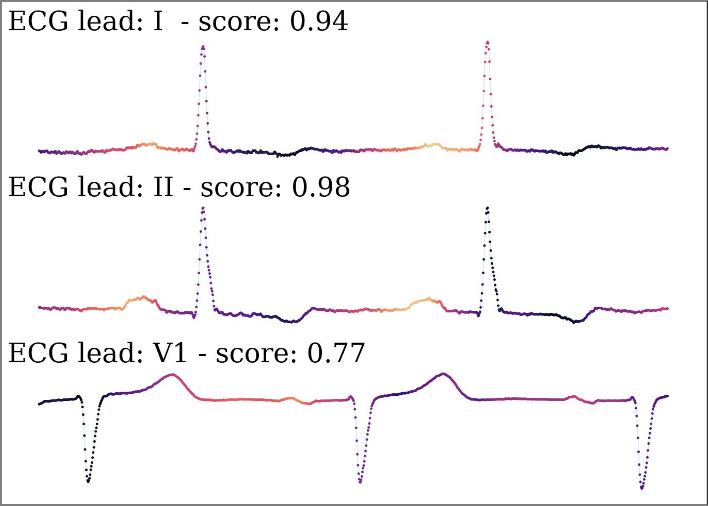
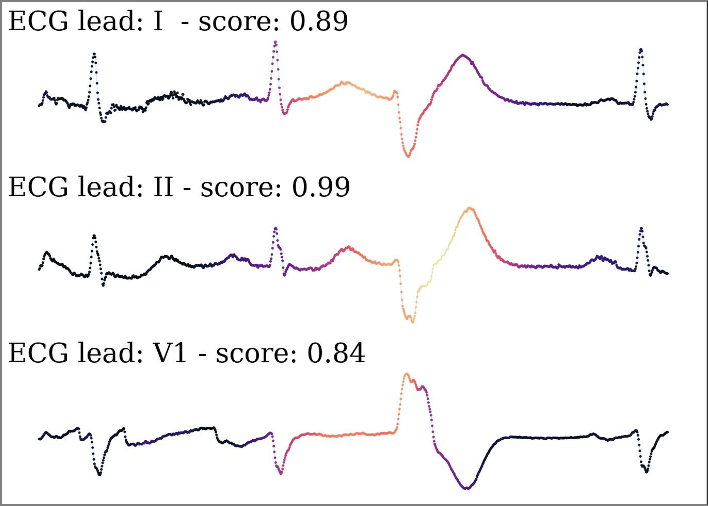
4) LBBB (left bundle branch block). An LBBB ECG recording has broad QRS complexes. Also, S waves are fairly deep in lead V1. From activation maps in Figure 4.4, we can see that system recognized broad QRS complexes in lead I, and deep S waves in lead V1. Thus, the explanation is consistent with the diagnostic criteria of LBBB. The importance scores indicated that leads I and V1 mostly contributed to the system’s prediction.
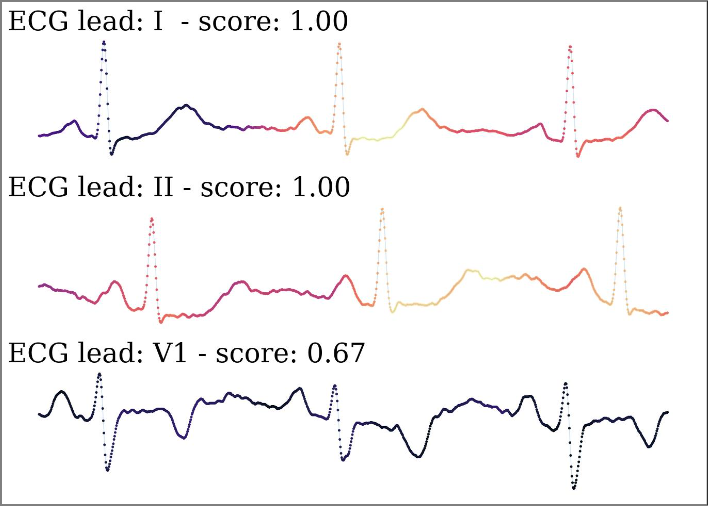
5) RBBB (right bundle branch block). An RBBB ECG recording has wide slur S waves in lead I. Also, “M-shaped” QRS complexes are visible in lead V1. From activation maps in Figure 4.5, we can see that system recognized wide slur S waves in lead I, and “M-shaped” QRS complexes in lead V1. Thus, the explanation is consistent with the diagnostic criteria of RBBB. The importance scores indicated that leads I and V1 mostly contributed to the system’s prediction.
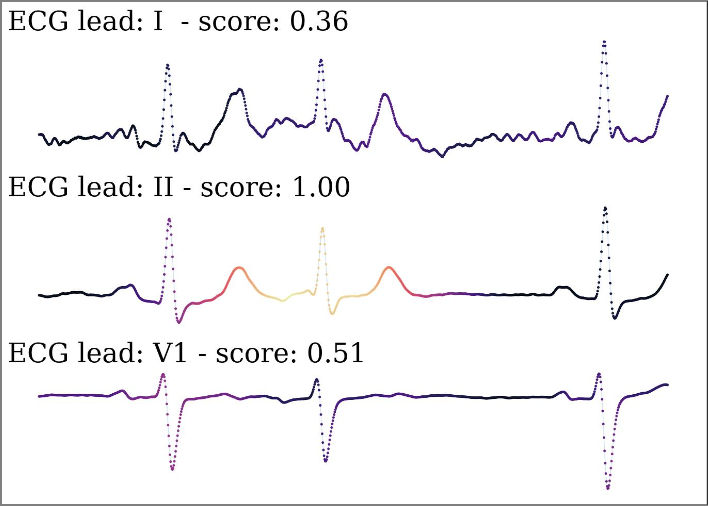
6) PAC (premature atrial contraction). A PAC ECG recording has abnormal (non-sinus) P waves followed by a normal QRS complex. Also, P waves are usually negative in lead II. From activation maps in Figure 4.6, we can see that system recognized non-sinus P waves in leads II and V1, specifically negative P waves in lead II. Thus, the explanation is consistent with the diagnostic criteria of PAC. The importance scores indicated that leads II and V1 mostly contributed to the system’s prediction.
7) PVC (premature ventricular contraction). A PVC ECG recording has some sporadic periods that are abnormal compared to surrounding periods. Also, QRS complexes in these periods are irregular too. From activation maps in Figure 4.7, we can see that system recognized abnormal periods compared to surrounding periods in lead II and irregular QRS complexes in these periods. Thus, the explanation is consistent with the diagnostic criteria of PVC. The importance scores indicated that lead II contributed more to the system’s prediction than others.

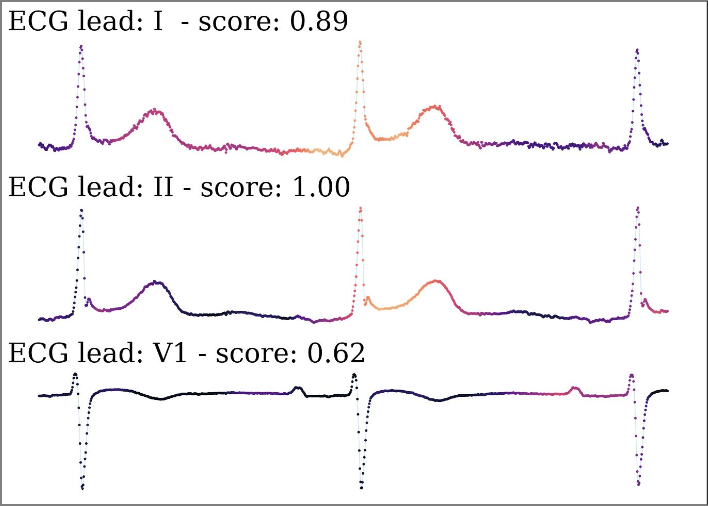
8) STD (ST-segment depression). As its name, an STD ECG recording has depressed ST segments. From activation maps in Figure 4.8, we can see that system recognized depressed ST segments in leads I and II. Thus, the explanation is consistent with the diagnostic criteria of STD. The importance scores indicated that leads I and II mostly contributed to the system’s prediction.
9) STE (ST-segment elevation). As its name, an STE ECG recording has elevated ST segments. From activation maps in Figure 4.9, we can see that system recognized elevated ST segments in leads I and II. Thus, the explanation is consistent with the diagnostic criteria of STE. The importance scores indicated that leads I and II mostly contributed to the system’s prediction.
4.4.2 Sanity check
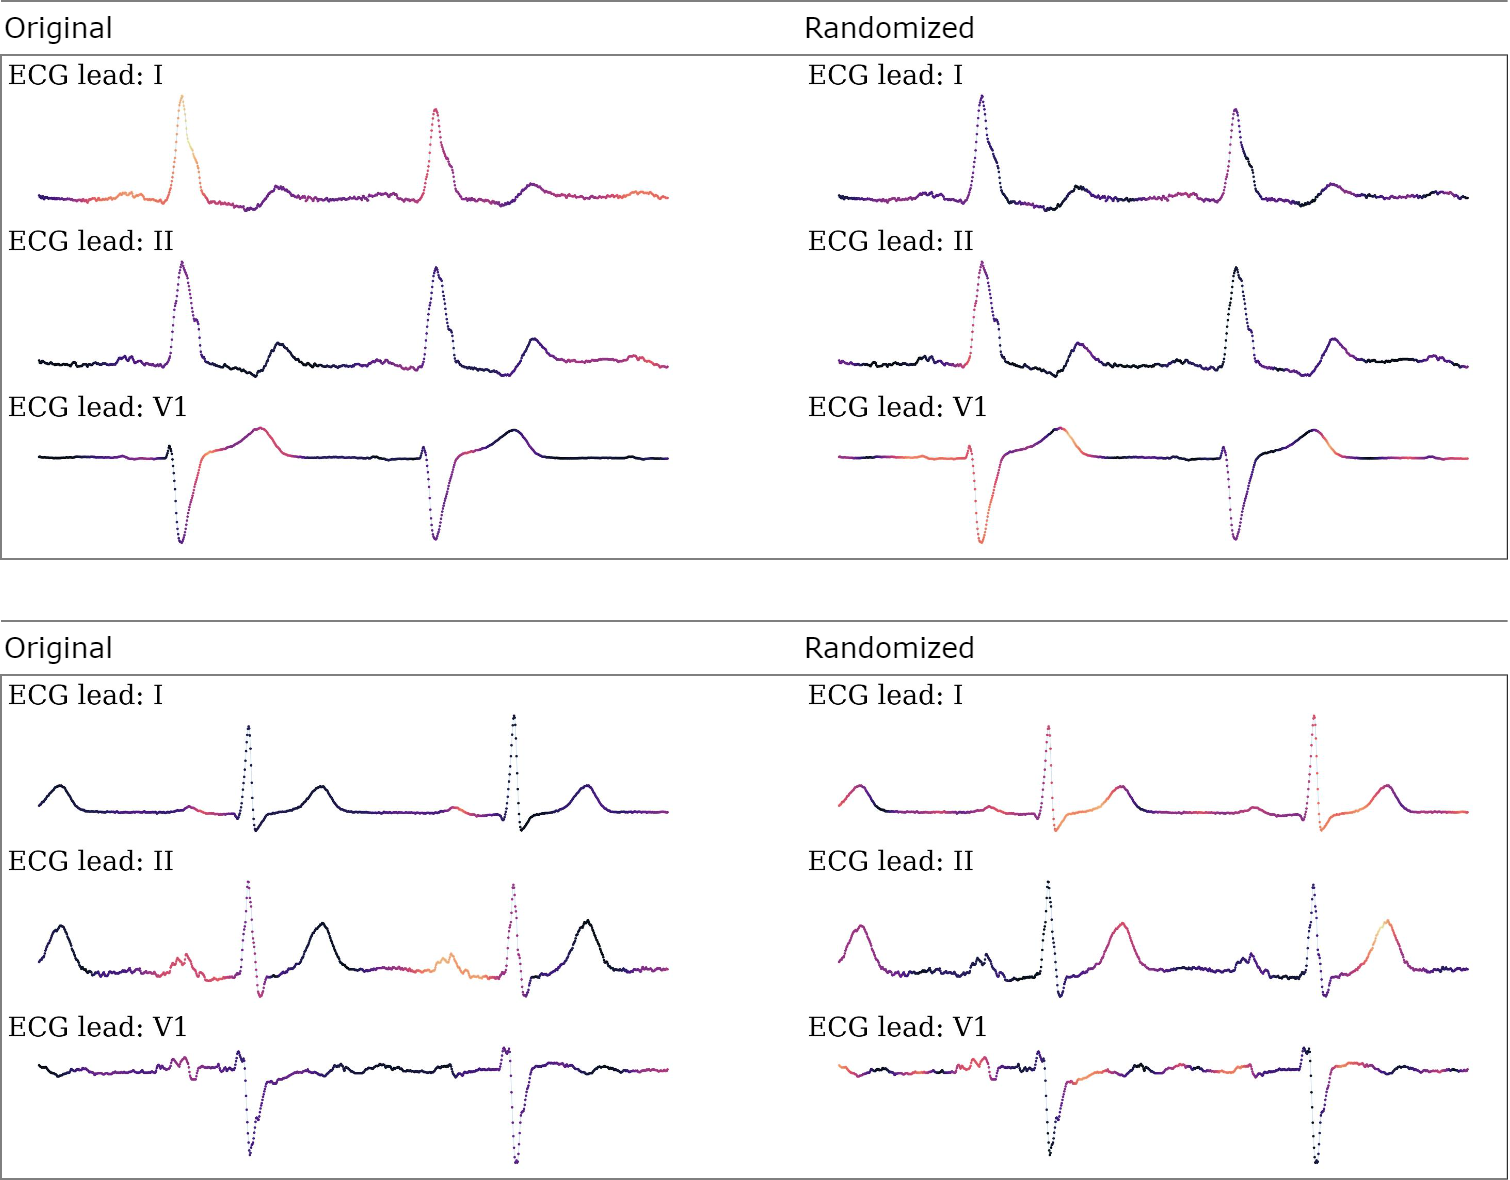
Recent works in the literature on XAI research have strongly emphasized the importance of implementing sanity checks [58] in order to assess the quality of XAI techniques methodically [59, 60]. These types of checks verify whether or not the provided explanation is related to the model’s parameters or the data used for training.
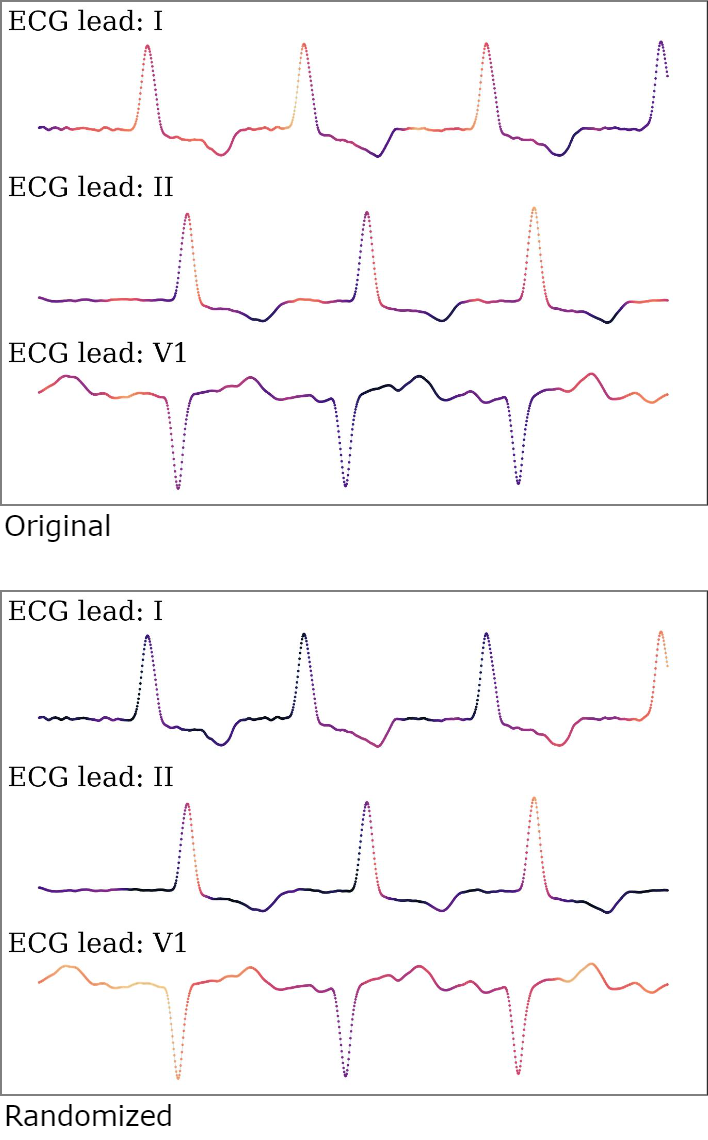
For this purpose, we performed a simple parameter randomization test, which is one of two forms of sanity checks, to assess our Lead-wise GradCAM technique. In particular, by using Lead-wise GradCAM, we compared explanations for a hundred ECG recordings from our trained system (original system) with those from the randomized system. the randomized system was accomplished by perturbing the final FC layer, classifier, of the original system. Figure 4.10 shows an example of this comparison, as we expect, explanations differ. We also report the average Spearman’s rank correlation of these explanations in Table 4. Lead-wise GradCAM and SHAP analysis [22] both passed this sanity check, but our technique gave a lower correlation score.
between the original system and randomized system.
| Method | Chapman | CPSC-2018 |
| SHAP [22] | 0.16 | 0.18 |
| Lead-wise Grad-CAM (Ours) | 0.10 | 0.11 |
5 Ablation Study
In this section, we conducted an ablation study to validate the effect of three selected input leads on the performance of LightX3ECG. In particular, we fixed leads I and II as our limb leads while substituting lead V1 with another chest lead to create a new combination of three leads that we used as input for the system. Table 5 shows that the performance was fairly consistent among combinations and the combination of leads (I, II, and V1) produced the best performance in both datasets by a slight margin.
| Dataset | (I, II, and V1) | (I, II, and V2) | (I, II, and V3) | (I, II, and V4) | (I, II, and V5) | (I, II, and V6) |
| Chapman | 0.9718 | 0.9702 | 0.9705 | 0.9702 | 0.9714 | 0.9711 |
| CPSC-2018 | 0.8004 | 0.8002 | 0.7997 | 0.7959 | 0.8001 | 0.7992 |
6 Discussions & Conclusion
In this article, we introduced an efficient and accurate deep learning system that uses a combination of three 10-second ECG leads (I, II, and V1) to identify cardiovascular abnormalities. We posed a new state-of-the-art for the 3-lead ECG classification task, where the proposed system outperformed most of the existing methods available for ECG classification in terms of F1 scores, complexity, and compactness. Additionally, we focused heavily on the XAI framework, which can give a more meaningful and clinical explanation for the system’s prediction, making it more valuable in medical contexts. Our system was also compressed to be ready for the production stage. However, the multi-input architecture of LightX3ECG is not suitable for small datasets and leads to difficulty in training on large-scale datasets, as well as a high storage cost which needs a practical technique like weights pruning to overcome. In the future, LightX3ECG will be improved to identify wider varieties of cardiovascular abnormalities, as well as be generalized on different sources of data. Demographic data such as age and gender will be incorporated to boost current performance. And a novel XAI framework for this multi-modal input will be also developed.
References
- [1] Wikipedia. Electrocardiography. https://en.wikipedia.org/wiki/Electrocardiography, 2020.
- [2] Erick A Perez Alday, Annie Gu, Amit J Shah, Chad Robichaux, An-Kwok Ian Wong, Chengyu Liu, Feifei Liu, Ali Bahrami Rad, Andoni Elola, Salman Seyedi, Qiao Li, Ashish Sharma, Gari D Clifford, and Matthew A Reyna. Classification of 12-lead ECGs: the PhysioNet/computing in cardiology challenge 2020. Physiological Measurement, 41(12):124003, dec 2020.
- [3] Junsang Park, Junho An, Jinkook Kim, Sunghoon Jung, Yeongjoon Gil, Yoojin Jang, Kwanglo Lee, and Il young Oh. Study on the use of standard 12-lead ecg data for rhythm-type ecg classification problems. Computer Methods and Programs in Biomedicine, 214:106521, 2022.
- [4] Shenda Hong, Yuxi Zhou, Junyuan Shang, Cao Xiao, and Jimeng Sun. Opportunities and challenges of deep learning methods for electrocardiogram data: A systematic review. Computers in Biology and Medicine, 122:103801, 2020.
- [5] Mintu P. Turakhia, Donald D. Hoang, Peter J Zimetbaum, Jared D. Miller, Victor F. Froelicher, Uday N. Kumar, Xiangyan Xu, Felix Yang, and Paul A. Heidenreich. Diagnostic utility of a novel leadless arrhythmia monitoring device. The American journal of cardiology, 112 4:520–4, 2013.
- [6] John Chorba, Avi Shapiro, Le An, John Maidens, John Prince, Steve Pham, Mia Kanzawa, Daniel Barbosa, Caroline Currie, Catherine Brooks, Brent White, Anna Huskin, Jason Paek, Jack Geocaris, Dinatu Elnathan, Ria Ronquillo, Roy Kim, Zenith Alam, Vaikom Mahadevan, and James Thomas. Deep learning algorithm for automated cardiac murmur detection via a digital stethoscope platform. Journal of the American Heart Association, 10:e019905, 04 2021.
- [7] Gregory Marcus. The apple watch can detect atrial fibrillation: so what now? Nature Reviews Cardiology, 17:1–2, 12 2019.
- [8] Patrik Bachtiger, Camille Petri, Francesca Scott, Se Park, Mihir Kelshiker, Harpreet Sahemey, Bianca Dumea, Regine Alquero, Pritpal Padam, Isobel Hatrick, Alfa Ali, Maria Ribeiro, Wing-See Cheung, Nina Bual, Bushra Rana, Matthew Shun-Shin, Daniel Kramer, Alex Fragoyannis, Dan Keene, and Nicholas Peters. Point-of-care screening for heart failure with reduced ejection fraction using artificial intelligence during ecg-enabled stethoscope examination in london, uk: a prospective, observational, multicentre study. The Lancet Digital Health, 4, 01 2022.
- [9] Shu-Li Guo, Li-Na Han, Hong-Wei Liu, Quan-Jin Si, De-Feng Kong, and Fu-Su Guo. The future of remote ecg monitoring systems. Journal of geriatric cardiology : JGC, 13:528–30, 09 2016.
- [10] John G. Webster, editor. The Physiological Measurement Handbook, chapter chapter3. CRC Press, 2014.
- [11] Karpagachelvi S, Muthusamy Arthanari, and Sivakumar M. Ecg feature extraction techniques - a survey approach. International Journal of Computer Science and Information Security, 8, 05 2010.
- [12] Juie D. Peshave and Rajveer Shastri. Feature extraction of ecg signal. In 2014 International Conference on Communication and Signal Processing, pages 1864–1868, 2014.
- [13] Sulaiman Somani, Adam J Russak, Felix Richter, Shan Zhao, Akhil Vaid, Fayzan Chaudhry, Jessica K De Freitas, Nidhi Naik, Riccardo Miotto, Girish N Nadkarni, Jagat Narula, Edgar Argulian, and Benjamin S Glicksberg. Deep learning and the electrocardiogram: review of the current state-of-the-art. EP Europace, 23:1179–1191, 2021.
- [14] Yann LeCun, Y. Bengio, and Geoffrey Hinton. Deep learning. Nature, 521:436–44, 05 2015.
- [15] Jie Hu, Li Shen, and Gang Sun. Squeeze-and-excitation networks. In 2018 IEEE/CVF Conference on Computer Vision and Pattern Recognition, pages 7132–7141, 2018.
- [16] Thang Luong, Hieu Pham, and Christopher D. Manning. Effective approaches to attention-based neural machine translation. In Proceedings of the 2015 Conference on Empirical Methods in Natural Language Processing, pages 1412–1421, Lisbon, Portugal, September 2015. Association for Computational Linguistics.
- [17] Sneha Chaudhari, Varun Mithal, Gungor Polatkan, and Rohan Ramanath. An attentive survey of attention models. ACM Trans. Intell. Syst. Technol., 12(5), oct 2021.
- [18] Shinjini Kundu. Ai in medicine must be explainable. Nature Medicine, 27:1–1, 07 2021.
- [19] Filip Karlo Došilović, Mario Brčić, and Nikica Hlupić. Explainable artificial intelligence: A survey. In 2018 41st International Convention on Information and Communication Technology, Electronics and Microelectronics (MIPRO), pages 0210–0215, 2018.
- [20] Yingchun Wang, Jingyi Wang, Weizhan Zhang, Yufeng Zhan, Song Guo, Qinghua Zheng, and Xuanyu Wang. A survey on deploying mobile deep learning applications: A systemic and technical perspective. Digital Communications and Networks, 8, 06 2021.
- [21] U Rajendra Acharya, Shu Lih Oh, Yuki Hagiwara, Jen Hong Tan, Muhammad Adam, Arkadiusz Gertych, and Ru San Tan. A deep convolutional neural network model to classify heartbeats. Computers in Biology and Medicine, 89, 08 2017.
- [22] Dongdong Zhang, Samuel Yang, Xiaohui Yuan, and Ping Zhang. Interpretable deep learning for automatic diagnosis of 12-lead electrocardiogram. iScience, 24(4):102373, 2021.
- [23] Zhaowei Zhu, Xiang Lan, Tingting Zhao, Yangming Guo, Pipin Kojodjojo, Zhuoyang Xu, Zhuo Liu, Siqi Liu, Han Wang, Xingzhi Sun, and Mengling Feng. Identification of 27 abnormalities from multi-lead ecg signals: an ensembled se-resnet framework with sign loss function. Physiological Measurement, 42, 06 2021.
- [24] Qihang Yao, Xiaomao Fan, Yunpeng Cai, Ruxin Wang, Liyan Yin, and Ye Li. Time-incremental convolutional neural network for arrhythmia detection in varied-length electrocardiogram. In 2018 IEEE 16th Intl Conf on Dependable, Autonomic and Secure Computing, 16th Intl Conf on Pervasive Intelligence and Computing, 4th Intl Conf on Big Data Intelligence and Computing and Cyber Science and Technology Congress(DASC/PiCom/DataCom/CyberSciTech), pages 754–761, 2018.
- [25] Kunyang Li, Pan Weifeng, Qing Jiang, and Guan-Zheng Liu. A method to detect sleep apnea based on deep neural network and hidden markov model using single-lead ecg signal. Neurocomputing, 294, 03 2018.
- [26] Luz Santamaria-Granados, Mario Munoz-Organero, Gustavo Ramirez-González, Enas Abdulhay, and N. Arunkumar. Using deep convolutional neural network for emotion detection on a physiological signals dataset (amigos). IEEE Access, 7:57–67, 2019.
- [27] Zachi Attia, Alan Sugrue, Samuel Asirvatham, Michael Ackerman, Suraj Kapa, Paul Friedman, and Peter Noseworthy. Noninvasive assessment of dofetilide plasma concentration using a deep learning (neural network) analysis of the surface electrocardiogram: A proof of concept study. PLOS ONE, 13:e0201059, 08 2018.
- [28] Tawsifur Rahman, Alex Akinbi, Muhammad Chowdhury, Tarik Rashid, Abdulkadir Sengur, Amith Khandakar, Khandaker Islam, and aras masood. Cov-ecgnet: Covid-19 detection using ecg trace images with deep convolutional neural network. Health Information Science and Systems, 10, 01 2022.
- [29] Mehmet Özdemir, Gizem Özdemir, and Onan Güren. Classification of covid-19 electrocardiograms by using hexaxial feature mapping and deep learning. BMC Medical Informatics and Decision Making, 21, 05 2021.
- [30] Barbara Drew, Michele Pelter, Donald Brodnick, Viapn Yadav, Debbie Dempel, and Mary Carey. Comparison of a new reduced lead set ecg with the standard ecg for diagnosing cardiac arrhythmias and myocardial ischemia. Journal of electrocardiology, 35 Suppl:13–21, 10 2002.
- [31] Michael Green, Mattias Ohlsson, Jakob Forberg, Jonas Björk, Lars Edenbrandt, and Ulf Ekelund. Best leads in the standard electrocardiogram for the emergency detection of acute coronary syndrome. Journal of electrocardiology, 40:251–6, 08 2007.
- [32] Younghoon Cho, Joon-Myoung Kwon, Kyung-Hee Kim, Jose Medina-Inojosa, KI-Hyun Jeon, Soohyun Cho, Soo Lee, Jinsik Park, and Byung-Hee Oh. Artificial intelligence algorithm for detecting myocardial infarction using six-lead electrocardiography. Scientific Reports, 10, 11 2020.
- [33] J. Hughes, Jeffrey Olgin, Robert Avram, Sean Abreau, Taylor Sittler, Kaahan Radia, Henry Hsia, Tomos Walters, Byron Lee, Joseph Gonzalez, and Geoffrey Tison. Performance of a convolutional neural network and explainability technique for 12-lead electrocardiogram interpretation. JAMA Cardiology, 6, 08 2021.
- [34] Atul Anand, Tushar Kadian, Manu Shetty, and Anubha Gupta. Explainable ai decision model for ecg data of cardiac disorders. Biomedical Signal Processing and Control, 75:103584, 05 2022.
- [35] Maksims Ivanovs, Roberts Kadiķis, and Kaspars Ozols. Perturbation-based methods for explaining deep neural networks: A survey. Pattern Recognition Letters, 150:228–234, 10 2021.
- [36] Sricharan Vijayarangan, Balamurali Murugesan, Vignesh R, Preejith Sp, Jayaraj Joseph, and Mohansankar Sivaprakasam. Interpreting deep neural networks for single-lead ecg arrhythmia classification. In International Engineering in Medicine and Biology Conference, 04 2020.
- [37] Ali Raza, Kim Phuc TRAN, Ludovic Koehl, and Shujun Li. Designing ecg monitoring healthcare system with federated transfer learning and explainable ai. Knowledge-Based Systems Journal, 236:107763, 11 2021.
- [38] Ganeshkumar M., Vinayakumar Ravi, Sowmya V, Gopalakrishnan E.A, and Soman K.P. Explainable deep learning-based approach for multilabel classification of electrocardiogram. IEEE Transactions on Engineering Management, pages 1–13, 2021.
- [39] Jinyong Cheng, Qingxu Zou, and Yunxiang Zhao. Ecg signal classification based on deep cnn and bilstm. BMC Medical Informatics and Decision Making, 21, 12 2021.
- [40] Hassan Ismail Fawaz, Benjamin Lucas, Germain Forestier, Charlotte Pelletier, Daniel F. Schmidt, Jonathan Weber, Geoffrey I. Webb, Lhassane Idoumghar, Pierre-Alain Muller, and François Petitjean. Inceptiontime: Finding alexnet for time series classification. Data Min. Knowl. Discov., 34(6):1936–1962, nov 2020.
- [41] Mark Sandler, Andrew Howard, Menglong Zhu, Andrey Zhmoginov, and Liang-Chieh Chen. Mobilenetv2: Inverted residuals and linear bottlenecks. In Conference on Computer Vision and Pattern Recognition, pages 4510–4520, 2018.
- [42] Andrew G. Howard, Mark Sandler, Grace Chu, Liang-Chieh Chen, Bo Chen, Mingxing Tan, Weijun Wang, Yukun Zhu, Ruoming Pang, Vijay Vasudevan, Quoc V. Le, and Hartwig Adam. Searching for mobilenetv3. In International Conference on Computer Vision, pages 1314–1324, 2019.
- [43] Ramprasaath R. Selvaraju, Michael Cogswell, Abhishek Das, Ramakrishna Vedantam, Devi Parikh, and Dhruv Batra. Grad-cam: Visual explanations from deep networks via gradient-based localization. In 2017 IEEE International Conference on Computer Vision (ICCV), pages 618–626, 2017.
- [44] Harsh Panwar, Pradeep Gupta, Mohammad Khubeb Siddiqui, Ruben Morales-Menendez, Prakhar Bhardwaj, and Vaishnavi Singh. A deep learning and grad-cam based color visualization approach for fast detection of covid-19 cases using chest x-ray and ct-scan images. Chaos Solitons & Fractals, 110190:110190, 08 2020.
- [45] Sivaramakrishnan Rajaraman, Kamolrat Silamut, Md A Hossain, I Ersoy, Richard J Maude, Stefan Jaeger, George R Thoma, and Sameer K Antani. Understanding the learned behavior of customized convolutional neural networks toward malaria parasite detection in thin blood smear images. J Med Imaging (Bellingham), 5(3):034501, July 2018.
- [46] Miguel A. Carreira-Perpinan and Yerlan Idelbayev. "learning-compression" algorithms for neural net pruning. In 2018 IEEE/CVF Conference on Computer Vision and Pattern Recognition, pages 8532–8541, 2018.
- [47] Song Han, Jeff Pool, John Tran, and William J. Dally. Learning both weights and connections for efficient neural networks. In Proceedings of the 28th International Conference on Neural Information Processing Systems - Volume 1, NIPS’15, page 1135–1143, Cambridge, MA, USA, 2015. MIT Press.
- [48] Jianwei Zheng, Jianming Zhang, Sidy Danioko, Hai Yao, Hangyuan Guo, and Cyril Rakovski. A 12-lead electrocardiogram database for arrhythmia research covering more than 10,000 patients. Scientific Data, 7, 02 2020.
- [49] Feifei Liu, Chengyu Liu, Lina Zhao, Xiangyu Zhang, Xiaoling Wu, Xiaoyan Xu, Yulin Liu, Caiyun Ma, Shoushui Wei, Zhiqiang He, Jianqing Li, and Eddie Ng. An open access database for evaluating the algorithms of electrocardiogram rhythm and morphology abnormality detection. Journal of Medical Imaging and Health Informatics, 8:1368–1373, 09 2018.
- [50] Diederik Kingma and Jimmy Ba. Adam: A method for stochastic optimization. In International Conference on Learning Representations, volume abs/1412.6980, 2014.
- [51] Ilya Loshchilov and Frank Hutter. SGDR: stochastic gradient descent with warm restarts. In International Conference on Learning Representations, volume abs/1608.03983, 2017.
- [52] Cecilia Gutierrez and Daniel G. Blanchard. Atrial fibrillation: diagnosis and treatment. American family physician, 83 1:61–8, 2011.
- [53] Borys Surawicz and Timothy K. Knilans, editors. Chou’s Electrocardiography in Clinical Practice: Adult and Pediatric. W.B. Saunders, Philadelphia, sixth edition edition, 2008.
- [54] S Serge Barold, Arzu Ilercil, Fabio Leonelli, and Bengt Herweg. First-degree atrioventricular block. clinical manifestations, indications for pacing, pacemaker management & consequences during cardiac resynchronization. J Interv Card Electrophysiol, 17(2):139–152, March 2007.
- [55] Ary L. Goldberger, Zachary D. Goldberger, and Alexei Shvilkin, editors. Goldberger’s Clinical Electrocardiography. Elsevier, ninth edition edition, 2018.
- [56] M. Alventosa-Zaidin, L. Font, Mència Camps, Carme Roca, G. Pera, M. Sas, Rosa Forés, Oriol Rebagliato-Nadal, Antoni Dalfó-Baqué, and J. Terradellas. Right bundle branch block: Prevalence, incidence, and cardiovascular morbidity and mortality in the general population. European Journal of General Practice, 25:1–7, 07 2019.
- [57] Borys Surawicz, Rory Childers, Barbara J Deal, Leonard S Gettes, James J Bailey, Anton Gorgels, E William Hancock, Mark Josephson, Paul Kligfield, Jan A Kors, Peter Macfarlane, Jay W Mason, David M Mirvis, Peter Okin, Olle Pahlm, Pentti M Rautaharju, Gerard van Herpen, Galen S Wagner, Hein Wellens, American Heart Association Electrocardiography and Arrhythmias Committee, Council on Clinical Cardiology, American College of Cardiology Foundation, and Heart Rhythm Society. AHA/ACCF/HRS recommendations for the standardization and interpretation of the electrocardiogram: part III: intraventricular conduction disturbances: a scientific statement from the american heart association electrocardiography and arrhythmias committee, council on clinical cardiology; the american college of cardiology foundation; and the heart rhythm society. endorsed by the international society for computerized electrocardiology. J Am Coll Cardiol, 53(11):976–981, March 2009.
- [58] Julius Adebayo, Justin Gilmer, Michael Muelly, Ian Goodfellow, Moritz Hardt, and Been Kim. Sanity checks for saliency maps. In Proceedings of the 32nd International Conference on Neural Information Processing Systems, NIPS’18, page 9525–9536, Red Hook, NY, USA, 2018. Curran Associates Inc.
- [59] Finale Doshi-Velez and Been Kim. Towards a rigorous science of interpretable machine learning. arXiv: Machine Learning, 2017.
- [60] Chih-Kuan Yeh, Cheng-Yu Hsieh, Arun Sai Suggala, David I. Inouye, and Pradeep Ravikumar. On the (in)fidelity and sensitivity of explanations. In International Conference on Neural Information Processing Systems, 2019.
Appendix A Appendix
In this section, we provide supplementary figures for Subsection 4.4, including more examples for visual examinations, related to Figures 4. 1-9, and more examples for the sanity check, related to Figure 4.10.
A.1 Visual examinations
1) SNR (normal sinus rhythm)
2) AF (atrial fibrillation)
3) IAVB (first-degree atrioventricular block)
4) LBBB (left bundle branch block)
5) RBBB (right bundle branch block)
6) PAC (premature atrial contraction)
7) PVC (premature ventricular contraction)
8) STD (ST-segment depression)
9) STE (ST-segment elevation)
A.2 Sanity check