Dynamics of (mis)information flow and engaging power of narratives
The debate around misinformation and its potentially detrimental effects on public opinion is complex and multifaceted, to the extent that even the relevant academic research has not found unanimity on the prevalence and consumption of misinformation compared with mainstream content. The methodological framework presented here emphasises the importance of considering data representative of the complexity of the phenomenon and metrics that control for possible scale effects. By combining statistical, econometric and machine learning models, we shed light on the real impact of misinformation about a subject of general interest and social relevance, such as vaccines, on both the information available to citizens and their news diet. Our results show the prominent role achieved by misinformation sources in the news ecosystem, but also - and above all - the inability of mainstream media to drive the public debate over time on issues that are particularly sensitive and emotional. Taking properly account for the temporal dynamics of public debate seems crucial to prevent the latter from moving into uncontrolled spaces where false narratives are more easily conveyed and entrenched.
Introduction
The public sphere is “a realm of our social life in which something approaching public opinion can be formed. Access is guaranteed to all citizens. A portion of the public sphere comes in to being in every conversation in which private individual assemble to form a public body […] Citizens behave as a public body when they confer in an unrestricted fashion about matters of general interest. In a large public body this kind of communication requires specific means for transmitting information and influencing those who receive it. Today [in 1964] newspapers and magazines, radio and televisions are the media of the public sphere”[1].
Nowadays, social media embed a growing part of the public sphere[2, 3], becoming the medium for assembling citizens, who can confer (almost) unrestrictedly, and transmitting them information. The dynamics of the formation of the public opinion, although embedded in closed contexts, remain complex [4], and social equilibria are increasingly influenced by the presence of news media of different quality, some of them reliable, other questionable - i.e, sources that have a reputation for misinformation.
Misinformation is a very complex phenomenon which has been analysed from different perspectives (economic[5, 6], philosophical[7, 8], psychological [9, 10], sociological[11, 12]) and through multiple methodologies (both qualitative and quantitative), and for which scholars agree that a multidisciplinary approach is essential in an attempt to reduce its negative effects on society [13, 14, 15]. Although the extraordinary increase in concern about misinformation generated since the 2016 US presidential election, some research has recently pointed out the limited prevalence and consumption of “fake news” compared with mainstream content [16, 17, 18, 19, 20, 21]. The causes of these apparent contradictions lie mainly in the fact that research on misinformation and its effects is often based on datasets that are idiosyncratic, one-off, time-limited and small in scale, thus not properly representative of the phenomenon to be investigated [22]. In addition, different ways of measuring media consumption make it even more difficult to compare different studies.
The aim of the article is to shed light on the real diffusion and consumption of misinformation content on social media by defining a methodological framework that tries to account for the whole complexity of the public sphere, i.e., by considering a space of investigation that includes the majority of citizens who form the public body through their conversations on a subject of general interest, as well as the totality of news media that produce and transmit (mis)information about that subject, and a suitable time frame to probe the conditions for reaching sharing views. Moreover, regarding the specific subject of our research, we build a machine learning model capable to accurately infer stance conveyed and topic discussed in the related news content. Hence, aside from quantitatively comparing the engagement generated by misinformation and non-misinformation sources, respectively, we also investigate the different narrative structures promoted by the two sourcesets and their engaging power.
Without any claim to exhaustiveness, below we outline the main shortcomings in existing data and research practices addressed in the article, highlighting its most relevant contributions to the extant literature.
Space of investigation
The concept of misinformation is fuzzy, context-dependent (what social scientists term “Ballung concept”[23]), and open to various interpretations[24]. Thus, a first obstacle in analysing misinformation concerns the definition of the phenomenon itself and how to distinguish it from other types of content [25]. Since we are interested in the role played by news media of different quality within the public discussion rather than the individual news content [26], in line with a stream of literature [27, 28, 29, 30, 31, 32], to identify misinformation we rely on the factualness classification - i.e., whether the source has a reputation of regularly spreading misinformation or not - performed by independent third-party organisations (e.g., NewsGuard, Facta, Pagella Politica) that follow journalistic standards designed by the International Fact-Checking Network and whose activity is recognised by supervisory authorities, e.g., Agcom in Italy and Ofcom in the UK11endnote: 1The same source classification has been employed institutionally for monitoring disinformation (AGCOM, News vs. Fake in the Information System, 2018; AGCOM, Reports on online disinformation, 2019-2020) and the methodology used has been validated at international level (OECD, Approached to big data and disinformation strategies in Italy: Case study on the Telecommunications Regulator (AGCOM); Ofcom, Understanding online false information in the UK, 2021; Poynter, A guide to anti-misinformation actions around the world, last update August 2019)..
Subject to investigate
A second issue concerns the identification of the subject(s) on which to focus the analysis on misinformation. As said, for the analysis to have any relevance this should concern a subject of general interest, on which there is a (heated) debate because of its social significance. The literature on misinformation has shown how health-related subjects fulfil these requirements since they are at the core of public debate [33] very often with contrasting views[34], and related false narratives have particularly severe consequences regarding people’s quality of life[35, 36, 37, 38]. Among them, vaccines have always been a subject on which misinformation is active and relevant[39, 40, 41, 42, 43, 44, 45, 46] with historical roots going back to the first vaccines (the smallpox of the cow in the late 1700s[47]). For instance, exposure to information questioning the safety and effectiveness of vaccination may worsen people’s attitudes toward vaccines and be difficult to refute [48, 49, 50, 51]. Vaccination hesitancy has been an important public health issue even before Covid-19 [52, 53, 54], to the point of being named one of the top ten threats to global health in 2019 by the World Health Organization [55]. However, the proliferation of anti-vaccination misinformation through social media has recently given it new urgency due to the unprecedented scale of Covid-19 pandemic22endnote: 2WHO itself coined the term “infodemic” for describing a situation (i.e., the overabundance of information - some accurate and some not) that makes it hard for people to find trustworthy sources and reliable guidance when they need it [116, 117]. and the resulting need for rapid administration of the approved vaccines [56, 57, 58, 59].
In this work, we focus on the vaccine debate in Italy to analyse the role of misinformation in the news ecosystem and its impact on the formation of opinions and the orientation of individual behaviour. The choice of Italy as a case study is first motivated by the fact that since 2016 it was affected by a heated discussion on the design, approval and enforcement of the legislative framework on mandatory paediatric vaccinations [60]. Second, Italy was the first European country to be hit by Covid-19 in the early 2020, and even the first where the dramatic developments of the disease were accompanied by a rigorous discussion around vaccination, both about its urgency and its possible negative effects [61].
Sample size and time span to analyse
A next issue concerns the methodological framing of the analysis of misinformation, for which two main dimensions need to be taken into account: the sample size and the time span. About the first dimension, the sample size of misinformation sources can range from a few specific cases to larger samples. While the use of large samples makes the study broader, it also faces an inherent limitation in the analysis of the phenomenon. In fact, questionable sources are often unprofessional and unstructured, so they tend to have a high turnover rate (entry and exit from the market) with the resulting challenge of keeping up-to-date lists upon which to carry out a dynamic analysis (i.e., the “reference universe” is missing). Assessing the representativeness of the sample in relation to the reference universe is therefore both crucial (as in any statistical study) and, in this case, also very challenging. With respect to the size of the control sample, i.e., that of reliable sources, since these latter are normally professional and structured, the definition of the target universe is much less demanding (in Italy, for example, professional sources must be registered with the courts or with the supervisory authority).
We monitor all the sources that have received the factualness classification (questionable or reliable) by the aforementioned independent fact-checking organizations during the reference period. This ensures comprehensive coverage of the phenomenon, especially with reference to the online sources that are most successful among citizens33endnote: 3Note that NewsGuard alone claims to monitor domains covering the great majority (95%) of online engagement with news sites [118].. In addition, we rely on the audience data from the most prominent media measurement systems to extend the source list to other Italian mainstream news media (newspapers, magazines, radio and televisions). In sum, the present analysis covers the universe of (mis)information about vaccines diffused in Italy throughout the reference period, by both generalist news outlets and sources specializing in science - and specifically on the subject under investigation.
As to the time dimension, some considerations are in order. Due to the presence of cognitive meta-structures [62], recursive patterns may hinder the formation of sharing views [63] and foster the persistence of false narratives [64], so that shifts in the public opinion can be slow even during a period of heated public debate [65]. This is particularly the case with health topics such as vaccines, about which there are enduring myths [66], especially on matters such as vaccine safety [67]. In this context, catastrophic events could break these inertial patterns and lead to a paradigm shift [68]. Based on these considerations, misinformation analysis should not be confined to limited periods of time. Hence, we span our analysis over a 6-year horizon (i.e., 2016-2021) that includes, as mentioned, a heated discussion on mandatory vaccinations in childhood and the Covid-19 outbreak with the potential to shift the public debate.
Outline of the research
Aside from addressing all the aforementioned issues inherent in the analysis of misinformation, the present work takes steps in two of the main directions investigated by the extant literature:
-
•
the impact of misinformation on the information available to citizens;
-
•
the capacity of misinformation sources to gain engagement in comparison to non-misinformation sources.
Despite the plethora of research on the prevalence of misinformation in the media landscape, and a near-unanimous consensus that misinformation makes up a relatively small but not insignificant part of all news supply [69], the magnitude of this problem is still unknown and additional research is needed to capture this complex social phenomenon [70]. With this respect, some recent papers have shown how the lack of reliable coverage on topics of public interest may leave room for the production and dissemination of fake content[31, 71]. In other words, misinformation appears to fill some of the information gaps left uncovered by professional news production.
To the best of our knowledge, the extant literature has never examined a direct causal relationship between information and misinformation, probably assuming that the former informationally dominates the latter. Actually, when the subject discussed has a long history of misinformation campaigns (such as vaccines), questionable sources may have achieved a certain level of autonomy and misinformation not merely represent the denial of news from reliable sources44endnote: 4Scholarly research converges in defining fake news as a form of falsehood intended to primarily deceive people by mimicking the look and feel of real news [119].. Hence, in addition to compare the coverage of vaccine subject from reliable and questionable sourcesets, respectively, we adopt the Transfer Entropy approach to estimate the strength and direction of information flow between the corresponding daily time series.
On the consumption side, the most studies on the spread of misinformation among citizens concerns the communicative sphere provided or supported by online or social media - from websites to social network sites, weblogs and micro-blogs - where participation is open and freely available to everybody who is interested, where matters of common concern can be discussed, and where proceedings are visible to all [72]. Nevertheless, the extant research often refers to particular domains [73, 74], leaving open issues regarding the sample selection bias and thus the generalisability of the results obtained [75]. In this article, we use data from a comprehensive number of social networks (the four most popular platforms in Italy: Facebook, Instagram, Twitter, and YouTube) covering almost all citizens who use social networks to get informed and engage in conversation on issues of general interest. If, on the supply side, the sampling problems were addressed by employing a rather census-like approach to the news media sources and their content, on the consumption side the same issue was tackled by summing all the citizens’ interactions with the news content published by the aforementioned sources through their social media accounts.
Regarding the latter aspect, although falsehood is frequently asserted to follow more viral patterns than “truth” [76, 77, 78, 79, 80, 81, 82], a handful of papers have recently pointed out the limited reach of misinformation [16, 17, 18, 19, 20, 21], and a similar engagement gained by both news providers with a reputation of spreading misinformation and non-misinformation sources [29]. In addition to the possible unrepresentativeness of the samples analysed with respect to one or more of the issues addressed in the previous sections, we argue that such discrepancies could be due to a lack of consensus on how engagement should be measured. If, on the one hand, the ecosystem-wide engagement of a sourceset is correctly computed by summing the number of interactions of all posts across all publisher pages in , on the other hand, possible scaling effects due to a different audience size should be addressed when different sourcesets are compared [83]. Hence, we opt for the normalization by followers to measure how user engagement relates with the factualness of the news sources (reliable or questionable).
In addition, regarding the specific focus of our research, we study the different engaging power of the narrative structures (defined in terms of stance conveyed and topic discussed in the news content) promoted by one and the other sourceset, respectively. To this aim, based on the state-of-the-art literature on content detection and classification, we build a machine learning model capable to accurately infer whether a vaccine-related content conveys anti-vax, neutral or pro-vax stance, and whether it is about administration of vaccines, vaccine business, effectiveness of vaccination, legal issues, safety concerns, or other. While on the one hand it is to be expected to find misinformation biased towards anti-vax narratives and particularly sensitive topics [84, 85, 86], such as legal issues or safety concerns, on the other hand it is interesting to observe whether and to what extent even reliable sources are inclined to convey opinions (both anti- and pro-vax) rather than merely describe facts. The interplay between the factualness of the news source (reliable or questionable), the structure of the narrative promoted (stance conveyed and topic discussed) and the engagement generated is also modelled through econometric panel data estimations.
Results
Parasite or commensal? The role of misinformation in the news ecosystem
Over the past years, the evolution of the vaccine debate has undergone a few phases that emerge clearly from the data. Figure 1 shows the daily time series of the percentage of vaccine-related content from Questionable (Q) and Reliable (R) sources, respectively. To bring out trends more clearly, we display a 30-days simple moving average [87], i.e. the data-point at time is given by the mean over the last 30 datapoints (see Table S3 and Figure S1 in Supplementary Materials for descriptive statistics of both the two time series and their corresponding first difference; see Table S4 for stationarity tests).
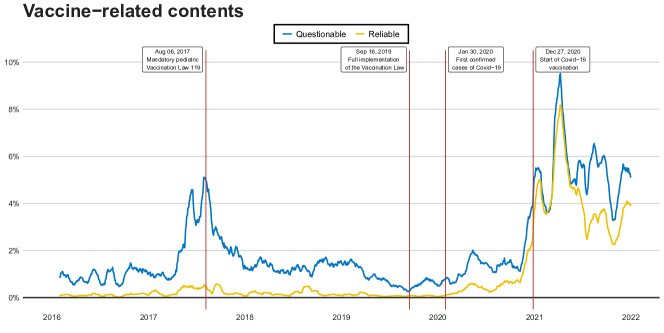
As expected, the two time series show an evident degree of correlation. Indeed, few major vaccine-related events have driven the media coverage throughout the time span analysed, regardless of the type of news source.
During the first phase, the debate was particularly vibrant in 2017 when by law (Law n.119 of July 31, anticipated by the Decree Law n.73 of June 7, hereafter Vaccination Act) the Italian Government extended from four to ten the mandatory vaccinations for children (0-16 years old)55endnote: 5These are: anti-polio; anti-diphtheria; anti-tetanus; anti-hepatitis B; anti-pertussis; anti-Haemophilus influenzae type b; anti-morbillus; anti-rubella; anti-parotitis; and anti-varicella., and introduced fines and admission bans for unvaccinated children at school. In this regard, it should be noted that full implementation of the Vaccination Act did not occur until September 2019 due to exemptions and extensions (see Law n.108/2018).
During the last phase, the vaccine debate has been almost completely monopolised by the pandemic outbreak: first by the Covid-19 vaccine race and roll out, later by the administration of authorized vaccines and the resulting safety concerns, especially regarding the AstraZeneca vaccine (March66endnote: 6As of March 15, 2021, the Italian Medicines Agency (AIFA) suspended the administration of the vaccine nationwide to shed light on potential serious side effects on blood coagulation reported in the previous days in Italy and in several other European countries within a short time of inoculations. The vaccination campaign with the AstraZeneca vaccine resumed in Italy from the afternoon of March 19, 2021, following clarifications provided by the European Medicines Agency (EMA). and June77endnote: 7On June 3, 2021, AIFA (Italian Medicines Agency) publishes an update information note on the risk of thrombosis occurrence in combination with thrombocytopenia. On June 8, 2021, the Liguria healthcare company Alisa suspends a batch of AstraZeneca’s vaccine following a report of a suspected adverse reaction. 2021) leading to vaccination hesitancy [88].
Figure 1 also suggests that the role of Covid-19 pandemic in the vaccine debate was twofold. On the one hand, regardless of the source type, it has raised media attention on vaccines to levels never reached in previous years. On the other hand, it has clearly influenced the dynamics of the cross-correlation between the two time series. A more pronounced trend of Q than R is indeed evident before the Covid-19 outbreak, when public debate appears to have been heated almost exclusively among page communities that were sceptical about the introduction of mandatory vaccination. On the contrary, the two variables proceed with comparable intensity and very similar monotonicity during the pandemic (see Table S3 in Supplementary Materials).
Hence, aside from performing an overall analysis of the vaccine debate in Italy throughout the time span under investigation, we identified the date of the first confirmed cases of Covid-19 in Italy (30 January 2020) as a watershed event between pre-pandemic and pandemic periods, and we also analysed these two sub-periods separately88endnote: 8Note that, although the start of vaccinations dates back to 27 December 2020 when Italy received 9,750 doses of the Pfizer–BioNTech vaccine, the vaccine debate has been almost totally dominated by the Covid-19 vaccines since the early stages of the pandemic..
Table 1 shows the cross-correlation function (CCF) score, i.e., the ratio of covariance to root-mean variance, between Q and R time series with respect to any of the aforementioned periods.
| Overall | Pre-pandemic | Pandemic | |
| CCF | 0.840 | 0.457 | 0.905 |
Consistent with what inferred graphically, these scores confirm that during the pandemic the degree of correlation between the two time series is roughly double that of the pre-pandemic period (See Figure S2 in Supplementary Materials for the lag analysis of CCF).
The different cross-correlation scores observed between the two sub-periods naturally raise questions about the drivers of the public debate on vaccines. To address these issues, we study the direct causal relationship between the two time series by evaluating the Transfer Entropy (TE) [89] of one to the other for the overall period and both the pre-pandemic and pandemic sub-periods. TE is an information-based measure based on the Shannon’s formula [90] that can appropriately detect the information flows between time series and identify its sources. Since a straightforward implementation of TE could lead to biased estimates under conditions that may be peculiar to the observed phenomenon, we relied on the bias correction provided by the concept of Effective Transfer Entropy (ETE) [91]. The ETE estimates are reported in Table 2, together with the corresponding net information flow (NIF) from reliable to questionable, meaning that when this quantity is positive, the reliable sourceset informationally dominates the questionable one, whereas when it is negative, the opposite applies [92].
| Period | SE | SE | NIF | ||
|---|---|---|---|---|---|
| Overall | |||||
| Pre-pandemic | |||||
| Pandemic | |||||
| ; ; | |||||
As far as the overall period is concerned, there is a significant bi-directional information flow between questionable and reliable sourcesets (1% and 5% significance level for the direction RQ and QR, respectively), whereas the NIF shows a larger information transmission from the latter to the former. Hence, the results suggest that the production of vaccine news from reliable media dominates that from questionable sources.
However, the breakdown of the time span into sub-periods returns misinformation not as a parasite of the news ecosystem that merely changes the object and narrative of mainstream media. Indeed, although the interactions between the two sourcesets are significant in both directions (1% and 5% significance level for the direction QR and RQ, respectively), the information flow from R to Q undergoes a net downsizing, while it remains constant in the opposite direction, when time is limited to before the Covid-19 outbreak. Therefore, the NIF returns a slight dominance of questionable sources on reliable news media. With this respect, the very different coverage of the two sourcesets to the paediatric vaccination obligation, from entry into force of the Vaccination Act to its full implementation (see Figure 1 for the relative percentages and Table 4 for their numerical values), certainly played a role in determining the questionable sources as the driver of the system.
On the contrary, the Covid-19 outbreak marked a drastic increase in vaccine coverage from reliable news media, to the point of decreeing their transition from dependent to independent variable in the Transfer Entropy model describing its causal relationship with the questionable counterpart. Suffice it to say that the ratio of reliable to questionable content jumped from 2 to 1 in the pre-pandemic period to 9 to 1 in the pandemic period. Moreover, although the duration of the pandemic period is roughly half that of the pre-pandemic period, questionable and reliable sources increase their overall news production on vaccines by about 500% and 1700%, respectively (See Table 4). In this new environment, the situation is practically reversed: the information flow in the direction QR (0.000) is not found to be statistically significant, whereas the communication from reliable sources gains its driving role in the information ecosystem and the NIF reaches its maximum (0.047), with 1% significance level for the direction RQ.
How engagement relates with the factualness of news sources
The pattern of news content production on vaccines is mirrored in the evolution of citizens’ reactions. Namely, the significant increase in content during pandemic is matched by a proportional increase in user interactions (see Table 4 and Figure S3 in Supplementary Materials).
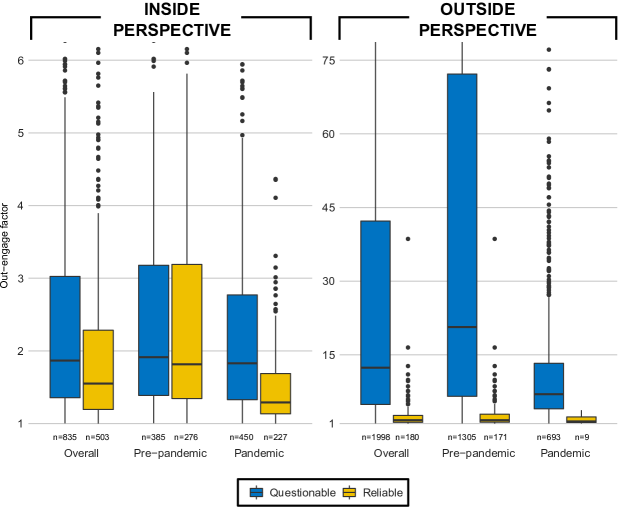
To understand which sourceset, between questionable and reliable, generates the most citizen engagement, we study the out-engage factor defined by (5). Denoted with the vaccine subject and with the totality of other subjects covered during day , left panel of Figure 2 shows the distribution of the out-engage factor () for the days when it is in favour of the vaccine subject compared to the rest of subjects discussed within the R (Q) sourceset. Right panel shows instead the distribution of the out-engage factor on vaccine subject for the days when it is in favour of one sourceset to the other99endnote: 9Some outliers up to 6 concerning the inside perspective and up to 75 concerning the outside perspective are not shown.. Distributions are broken down by period analysed and indicates the corresponding number of days.
Namely, on a daily basis, we compare citizen engagement with the vaccine-related content of the two sourcesets from two different points of view:
-
•
the inside perspective, that is the ratio between the per-content interactions, where content is binary divided into vaccine-related and any other subject discussed within the same sourceset;
-
•
the outside perspective, that is the ratio between the per-content interactions normalized by followers1010endnote: 10While normalization by followers does non affect the out-engage factor formula from the inside perspective (it contributes twice equally but inversely), it has a huge impact on the same formula from the outside perspective, either by reducing the contribution of news content from sources with a large follower base, or by amplifying the contribution of news content from sources with a small follower base. This approach prevents us from the risk of confusing scale effects with the real user engagement (i.e., mainstream news media have more audience than questionable sources and therefore trigger more user interactions, all things being equal). of one sourceset to the other, where content is exclusively vaccine-related.
The vaccine subject appears to be slightly more engaging among the questionable sources rather than reliable news media, when compared to the totality of the other subjects covered. Such an overall gap (Q: median 1.866, mean 2.633; R: median 1.549, mean 2.210) is achieved almost exclusively during the pandemic period (Q: median 1.829, mean 2.499; R: median 1.291, mean 1.546), whereas the pre-pandemic distributions are practically overlapping (Q: median 1.913, mean 2.791; R: median 1.815, mean 2.757). Thus, while questionable sources kept their followers’ attention on the vaccine subject somehow constant with respect to other subjects, both before and after the pandemic, reliable sources gained significantly less engagement with the Covid-19 outbreak. What appears to be an apparent contradiction, shows instead how pandemic-related topics other than vaccines (e.g., daily bulletins on the number of infections and deaths, institution information about restrictive provisions adopted in an attempt to slow down the contagion) have been highly engaging for the audience of reliable sources, and practically ignored by questionable sources.
The differences in how citizens engage with vaccine news from questionable and reliable sources are definitely more evident when we investigate the outside perspectives, namely when we compare the per-content engagement normalized by followers of one sourceset to the other. The audience engagement distribution for questionable sources clearly dominates that for reliable sources during the overall period (Q: median 12.385, mean 110.217, R: median 1.647, mean 3.107). This is essentially due to the enormous gap observed during the pre-pandemic period, when questionable sources reached as a whole a median out-engage factor of (mean 163.814) compared to (mean 3.229) for reliable media1111endnote: 11Naturally, because of outliers, averages are considerably higher than the medians.. Overall, evidence shows that before the sudden shock related to the pandemic event, both information production and conversations between citizens were dominated by narratives from misinformation sources. The low engagement gained by reliable sources is clearly the result of the low level of coverage given to the vaccine issue prior to the Covid-19 outbreak and outlined in the previous section. This could also point to the unreadiness of the mainstream media to address a communication crisis such as that which has accompanied the pandemic since its early stages. Ambiguous communication about the disease origin, transmission and treatment, disjointed narratives and mixed messages about the side effects and clots caused by the AstraZeneca vaccine - just to name a few - have fostered confusion and distrust in some communities, and also added to the skepticism in the entire vaccination system [93]. As a matter of fact, only nine days of the pandemic see vaccine news from reliable media overperforming the same subject from questionable sources. Nevertheless, contrary to the inside perspective, while the out-engage factor from the outside perspective remains almost constant for the reliable sourceset (median 1.433, mean 1.862), questionable sources lose part of the engagement advantage (median 6.971, mean 14.933) achieved during the pre-pandemic period (See Table S7 in Supplementary Materials for more statistical details). Hence, although the news narratives of reliable media on vaccines were never particularly successful throughout the period analysed, the Covid-19 outbreak had a great effect in weakening citizens’ sharing of misinformation narratives.
How engagement relates with the narrative structure of news content
To investigate the key features of the social media communication dynamics on vaccines, we study the stances and the topics covered by both reliable sources and questionable sources. To this aim, a state-of-the-art neural model is trained to distinguish between three different positions on vaccines (anti-vax, neutral, pro-vax) and six different topics (administration of vaccines, vaccine business, effectiveness of vaccination, legal issues, safety concerns, other), respectively. Both models are trained on a manually annotated set of contents, representing of the total dataset, and reach 0.88 as accuracy score on the evaluation set (see Materials and Methods for details).
Figure 3 (left panel) shows a substantial time-invariance of the distribution of vaccine-related content from reliable sources among the three stance classes. As expected, the neutral perspective is dominant, exceeding 65% in both the pre-pandemic and pandemic sub-periods, followed by pro-vax opinion and a more marginal percentage of content conveying anti-vax views, which however exceeds 10% during Covid-19 outbreak1212endnote: 12As a proof of the extent to which mainstream media are involved in the dissemination of anti-vax content, this account for times those from questionable sources (30,622 versus 18,994 news items). Of course, this is partly due to lowest number of questionable sources (161) compared to the reliable ones (521).. Differently, the Covid-19 outbreak seems to have had a significant impact on the communication strategy of the misinformation counterpart. The anti-vax perspective, which was clearly dominant throughout the pre-pandemic period, loses about 25% in favour of uplifting views during the pandemic and drops from 65% to 40% (See Figure S4 in Supplementary Materials for the percentage of vaccine coverage by each news source analysed with respect to the different stance classes).
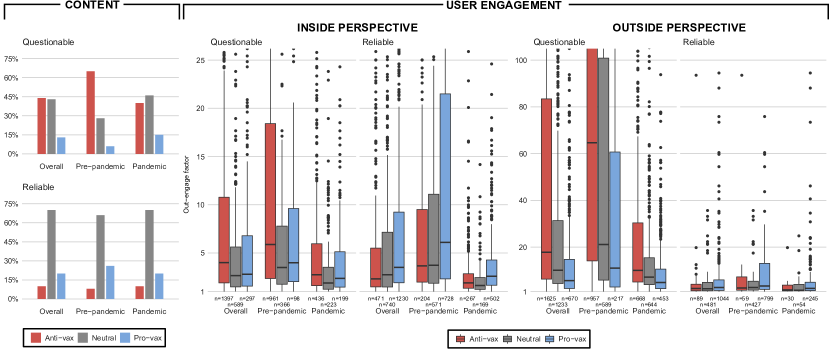
In order to investigate the engagement dynamics corresponding to different narrative structures, we study the distribution of the out-engage factor (5) from both the inside and outside perspectives. With respect to the former perspective, denoted with the vaccine-related content conveying the stance , in () will indicate the remaining vaccine-related content, i.e., those conveying any stance other than .
Figure 3 (right panel) shows a clear degree of symmetry with respect to the axis identified by the neutral distribution between questionable and reliable sourcesets from the inside perspective, regardless of the period considered. Namely, if the most engaging content among those produced by questionable sources convey an anti-vax stance (Overall: median 4.000, mean 16.798; Pre-pandemic: median 5.875, mean 22.316; Pandemic: median 2.744, mean 10.164), then the high-engagement content from reliable sources correspond to pro-vax stance (Overall: median 3.502, mean 23.289; Pre-pandemic: median 6.094, mean 38.584; Pandemic: median 2.587, mean 4.307). On the contrary, pro-vax stance from questionable sources (Overall: median 2.800, mean 7.406; Pre-pandemic: median 3.984, mean 12.943; Pandemic: median 2.370, mean 4.901) and anti-vax stance from reliable ones (Overall: median 2.319, mean 27.114; Pre-pandemic: median 3.668, mean 59.409; Pandemic: median 1.904, mean 3.165) perform worse on average or in the median, both roughly comparable to the neutral position.
Even from the outside perspective, sorting the three stance classes according to their out-engage factor results in opposite rankings for the two sourcesets, regardless of the period considered. Moreover, when comparing the same stance from one sourceset and the other, respectively, the greater engaging power of misinformation sources over non-misinformation sources is much more evident, especially concerning those content conveying anti-vax stance (Overall: Q median 17.800, mean 940.100; R median 2.309, mean 5.586). Nevertheless, as observed without dividing the content according to the stance conveyed (see Figure 2), while the out-engage factor from the outside perspective remains somehow constant for any stance conveyed by the reliable sourceset (median value drops from 2.497 in the pre-pandemic period to 1.717 in the pandemic period for anti-vax stance, and from 3.383 to 2.349 for pro-vax stance), the shock effect of the Covid-19 outbreak has significantly reduced the engaging power of questionable sources (median value drops from 64.600 to 10.050 for anti-vax stance, and from 11.026 to 4.860 for pro-vax stance). See Tables S8 and S9 in Supplementary Materials for more statistical details.
To better understand why citizen engagement follows different dynamics depending on whether the content is produced by misinformation sources or not, it is essential to analyse the nature of the vaccine debate, and thus the different topic coverage over time. Figure 4 shows, for both the sourcesets, the coverage distribution among the six topic categories identified. The inner bar refers to the percentage of content conveying anti-vax stance (red) for questionable sourceset and pro-vax stance (azure) for reliable sources, these being the most engaging views, respectively, both from the inside and outside perspectives.
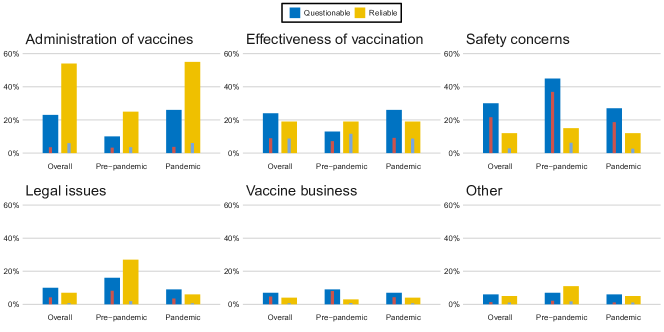
Regarding questionable sources, while two-thirds of the vaccine news produced during the pre-pandemic period is about safety concerns, legal issues and vaccine business, most of them () conveying anti-vax stance, the same topics is covered by “only” two-fifths of the vaccine-related content during the pandemic, and “only” 60% of the time with an anti-vax stance. As a consequence, questionable sources have lost much of the engaging power with the Covid-19 outbreak, also because the drastic reduction in coverage of the most emotional arguments was balanced by the increase in content on administration of vaccines and effectiveness of vaccination. For these, it has been much more difficult to impose a strictly anti-vax perspective.
Regarding reliable news media, while most topics receive constant attention throughout the period analysed, even with respect to the percentage of pro-vax stance conveyed, administration of vaccines and legal issues have opposite trends both among themselves and in relation to the sub-period analysed.
Moreover, comparing the levels of pro-vax coverage by reliable sources and anti-vax coverage by questionable sources on the most sensitive topics, it is evident that, except for effectiveness of vaccination, reliable sources have never adequately countered the anti-vax narrative of misinformation, especially in the pre-pandemic period.
Modeling the interplay between narratives and engagement
To analyse the relationship between factualness of news source (reliable or questionable), narrative structure promoted (stance conveyed and topic discussed) and engagement generated, we rely on some econometric models. Given the nature of the problem (analysis of differences between information of different quality) and the data available (unbalance panel), we focus on the following models:
| (1) |
where is the index of news source, is time (days since January 1th, 2016), is the user engagement on vaccine-related content from source on day , is a vector of time-independent source-related variables (e.g., the factualness classification: reliable or questionable), are time-dependent factors (e.g., number, type and topic of news content), and are the error terms (with the auto-correlated component). Random effects regressions with AR(1) disturbance have been estimated1313endnote: 13Random effects regressions are required to estimate between-source effects in the case of time-independent factors such as source reliability. In addition, the unbalanced nature of the panel and the fact that is greater than led to choose a model with autocorrelated disturbances. In any case, random effects regressions with robust estimator of variance were also estimated and the results presented in the paper are confirmed. as reported in Table 3 [94, 95].
| Model | Stance | Stance | Topic | Topic | ||||
|---|---|---|---|---|---|---|---|---|
| Variable | (I) | (II) | (III) | (IV) | ||||
| Source’s factualness | ||||||||
| Questionable (D) | ||||||||
| Content | ||||||||
| Anti-vax (ln) | ||||||||
| QuestAnti-vax (Dln) | ||||||||
| Pro-vax (ln) | ||||||||
| QuestPro-vax (Dln) | ||||||||
| Topic | ||||||||
| Administration (ln) | ||||||||
| QuestAdministration (Dln) | ||||||||
| Business (ln) | ||||||||
| QuestBusiness (Dln) | ||||||||
| Legal (ln) | ||||||||
| QuestLegal (Dln) | ||||||||
| Effectiveness (ln) | ||||||||
| QuestEffectiveness (Dln) | ||||||||
| Safety (ln) | ||||||||
| QuestSafety (Dln) | ||||||||
| Constant | ||||||||
| Controls | ||||||||
| Time (weekday, month, year) | YES | YES | YES | YES | ||||
| Summary stats | ||||||||
| Observations | 1,378,129 | 1,378,129 | 1,378,129 | 1,378,129 | ||||
| Number of sources | 680 | 680 | 680 | 680 | ||||
| Chi-squared (dof) | 1961.98 (26)*** | 4609.65 (28)*** | 1218.21 (29)*** | 4035.04 (34)*** | ||||
| R2 between | .1135 | .2079 | .0787 | .2141 | ||||
| The estimates refer to random effects models with AR(1) disturbance. The baselines of the estimates are ”neutral” for models on stance (I and II), and ”other” (e.g., events, related news) for models on topics (III and IV). The dependent variable is the natural logarithm of the engagement. For each variable, the coefficient, the standard error (in parentheses), and the level of significance (∗∗∗ 1%; ∗∗ 5%; ∗ 10%) are reported. | ||||||||
First, questionable sources significantly increase vaccine news engagement in all estimates. This result seems to highlight the greater emotional reaction to the vaccine subject from the anti-vax community. In fact, news content conveying anti-vax stance increases engagement while pro-vax content decreases it (Model I). The elasticity of the former is positive and significant (equal to 0.05%), while the elasticity of the latter is negative (-0.03%), and increases significantly when anti-vax content is proposed by questionable sources (1.34%, Model II, coefficient of the interactive variable). Conversely, when questionable sources convey pro-vax stance, engagement drops by 0.03%. In essence, the polarisation highlighted above about the news narratives on vaccines of the two types of sources (pro-vax for those reliable, and anti-vax for questionable) is reflected on the reactions of the corresponding communities of citizens. If we focus on the vaccination topics (Models III and IV), those that elicit the greatest reactions are business and legal issues, as well as those related to safety concerns (with an elasticity of 0.4%). Again, if we distinguish topics by the factualness of news sources, a clear polarisation emerges. Questionable sources arouse strong reactions in the case of narratives linked to business and legal aspects of vaccinations, as well as to the safety of vaccines (with an elasticity that reaches it maximum at 1.3%). Engagement drops instead for administration of vaccines and effectiveness of vaccination.
Discussion
Communication plays a pivotal role in the representation of reality and thus in the formation of opinions and the orientation of individual behaviour, especially on the web. Internet and social media, while providing a great capacity for the citizens to interact, may also represent important vectors for the spread of potentially erroneous or intentionally false information. However, the debate around misinformation and its potentially detrimental effects on public opinion is complex and multifaceted, to the extent that even the relevant academic research has not found unanimity on the prevalence and consumption of misinformation compared with mainstream content. Namely, the growing concern about misinformation is countered by some recent papers that point out the limited reach of fake news, and a comparable engagement gained by both news providers with a reputation for spreading misinformation and non-misinformation sources.
In this work we addressed the main shortcomings that may affect a study of misinformation. Through a comprehensive analysis of the social media news content produced by a nationally representative sample of TV, radio, print and online-only news outlets over a 6-year time span, we shed light on the real impact of misinformation about a subject of great social significance, such as vaccines, on both the information available to citizens and their news diet.
Our results highlight a complex picture that needs to be illustrated in all its facets. Although we find misinformation making up a relatively small but not insignificant (12.6%) part of all the news content supplied during the period 2016-2021, the information dynamics change over time and the percentage of misinformation almost triples (31.7%) when we reduce to before Covid-19 outbreak. This increased prevalence of misinformation also coincides with a more significant information flow from questionable to reliable sources than in the opposite direction, framing misinformation as driver of the public debate on vaccines. Striking results also concern the citizen engagement with vaccine-related content produced by misinformation and non-misinformation sources, for which a normalization by followers is very necessary to control for possible scaling effects. Our analysis returns a median engagement 12 times higher for misinformation than non-misinformation during the overall period (92% of days), which rises to 20 when time is limited to before Covid-19 outbreak (88% of days).
While these results show the prominent role achieved by misinformation sources in the news ecosystem, the pandemic shock confirms the detrimental effects of the convulsive dynamics of the public agenda on public debates. The issue-attention cycle [96] and the consequent need to continuously emphasise trending topics1414endnote: 14The pre-pandemic period analysed includes the 2016 US presidential election, the 2016 Italian constitutional referendum, the succession of two legislatures (XVII and XVII) and four governments (Renzi, Gentiloni, Conte I, Conte II), and important news events, such as the murder of Giulio Regeni, the 2016-2017 Central Italy earthquakes, the Morandi Bridge collapse, and many others. shorten the amount of time available to discuss each matter - especially those that may have a negative impact on societies - and prevent online audiences from engaging in a thoughtful public debate [97]. The Covid-19 pandemic has represented an unprecedented event not only from an epidemiological point of view, but also for the entire information ecosystem. Since the beginning of 2020 and for more than two years, news about the virus (including possible vaccines) has in fact affected almost the entire media production like no other event in recent history. As a consequence, questionable sources have lost their driving role in the public debate on vaccines and also part of the engagement advantage (median dropped from 20 to 7) achieved during the pre-pandemic period.
Despite the exceptional nature of the Covid-19 event, and aware that news media cannot get rid of the issue-attention logic (especially on social networks), we argue that the spread ease of false narratives is only partially attributable to the presence of misinformation sources, and more likely due to the inability of mainstream media to drive the public debate over time on issues that are particularly sensitive and emotional. In other words, to properly account for the temporal dynamics of public debate is crucial to prevent the latter from moving into uncontrolled spaces where unreliable information is more easily conveyed.
This statement is also confirmed by analysing the narrative structures (stance conveyed and topic discussed) promoted by misinformation and non-misinformation sources. As expected, the engaging power of narratives is revealed almost exclusively through news content conveying extreme opinions (anti-vax for misinformation sources, pro-vax for non-misinformation sources) and concerning the most sensitive topics (effectiveness of vaccination, safety concerns, legal issues and vaccine business). With this respect, our results confirm the efficacy of assiduously proposing a convincing counter-narrative to misinformation spread [98, 99]. Indeed, except for effectiveness of vaccination, reliable sources have never adequately countered the anti-vax narrative, especially in the pre-pandemic period, thus contributing to exacerbate and entrench science denial and belief in conspiracy theories. At the same time, within the questionable sourceset, effectiveness of vaccination turns out to be the least engaging of the above topics during the pandemic period.
The approach presented here, far from pretending to resolve the aforementioned disagreements on the prevalence of misinformation and its potentially detrimental effects on public opinion, emphasises the importance of considering data representative of the complexity of the phenomenon to be analysed and metrics that control for possible scale effects.
With respect to the specific focus of the research, our findings and models can be a valuable asset for improving our understanding of the phenomenology of misinformation on vaccines. For instance, through the establishment of a national observatory to monitor the information flow between questionable and reliable news sources, and to compare the production and consumption of their content. This could allow for early warnings on the prevalence and consumption of misinformation, especially in those periods when these subjects are less discussed by mainstream media and thus more vulnerable to the entrenchment of false narratives.
Materials and methods
Data collection
We collected about 350K vaccine-related contents published on Facebook, Instagram, Twitter and YouTube by almost all Italian news sources in the 6-year period that goes from 01/01/2016 to 31/12/2021. Data from Facebook and Instagram were collected through Facebook’s CrowdTangle API, whereas data from Twitter and YouTube were gathered by means of their official APIs.
With the only exception of the instant messaging services Whatsapp and Facebook Messenger, the four analysed platforms represent the most used social media in Italy during 2021: YouTube was used by 85.3% of Internet users aged 16 to 64, Facebook 80.4%, Instagram 67%, and Twitter 32.8% (source: GWI).
The news sources were gathered by merging the lists from independent fact-checking organizations (i.e., bufale.net, butac.it, facta.news, newsguardtech.com, and pagellapolitica.it) and labelled, according to the factualness classification they received, as questionable ((whether the source has a reputation of regularly spreading misinformation) or reliable.
In addition, to ensure the most representative picture of both traditional and new media, we rely on the audience data from the most prominent media measurement systems to extend the source list to other Italian mainstream news media (newspapers, magazines, radio and televisions) active in Italy during the aforementioned period. Namely, we selected:
-
•
96 out of the 121 major Italian newspapers that in 2021 reached 30 million Italians, i.e., of the population aged more than 18 (source: GfK Mediamonitor);
-
•
462 online-only news outlets that in 2021 monthly reached 40 million Italians, i.e., of the total internet audience (source: ComScore);
-
•
89 TV channels, including all RAI newscasts (3 national and 20 regional), that in 2021 monthly reached 8 million Italians, i.e., of the TV audience (source: Auditel);
-
•
35 radio channels that in 2021 daily reached 26 million Italians, i.e. of radio listeners (source: RadioTER - Tavolo Editori Radio).
Then, limited to the 682 selected sources (see Table S1 in Supplementary Materials for the list), we performed a keyword search for content that matched an exhaustive list of vaccine-related keywords, including general terms (e.g. vaccine, vaccination) and vaccine brands/names, both mandatory (e.g. Hexyon, Menjugate), recommended (e.g. Bnt162b2, Gardasil, Janssen, Twinrix) and others available (e.g. Vaxchora, Ervebo). See Table S2 in Supplementary Materials for the complete list of keywords. Hence, the data collected can reasonably be considered as the whole vaccine-related information provided to Italian citizens during the reference period.
Table 4 shows a breakdown of the dataset. Data are divided by sourceset and period analysed (Pre-pandemic 01/01/2016 - 29/01/2020, Pandemic 30/01/2020 - 31/12/2021, Overall 01/01/2016 - 31/12/2021), and concern the number of sources, contents and corresponding user interactions (understood as the algebraic sum of all possible actions/reactions performed on the four platforms analysed).
| CATEGORY | SOURCES | CONTENTS | INTERACTIONS | ||||||||||
|---|---|---|---|---|---|---|---|---|---|---|---|---|---|
| Pre-pandemic | Pandemic | Overall | Pre-pandemic | Pandemic | Overall | ||||||||
| Questionable | 161 | 7,567 | (17.0%) | 36,980 | (83.0%) | 44,547 | (100%) | 1,801,436 | (16.5%) | 9,097,338 | (83.5%) | 10,898,774 | (100%) |
| (23.6%) | (31.7%) | (11.2%) | (12.6%) | (33.6%) | (10.1%) | (11.4%) | |||||||
| Reliable | 521 | 16,293 | (5.3%) | 292,690 | (94.7%) | 308,983 | (100%) | 3,565,238 | (4.2%) | 80,766,899 | (95.8%) | 84,332,137 | (100%) |
| (76.4%) | (68.3%) | (88.8%) | (87.4%) | (66.4%) | (89.9%) | (88.6%) | |||||||
| Total | 682 | 23,860 | (6.7%) | 329,670 | (93.3%) | 353,530 | (100%) | 5,366,674 | (100%) | 89,864,237 | (100%) | 95,230,911 | (100%) |
| (100%) | (100%) | (100%) | (100%) | (100%) | (100%) | (100%) | |||||||
Time series and causality analysis
The correlation functions for testing and measuring causality (e.g. Granger causality [100]) have been applied in a number of fields, including social media [101, 102]. Despite the widespread, their use is limited to linear relations, although linear models can not accurately represent real-world interactions. Further, while all they determine whether two time series have correlated movement, no directional information about cause and effect can be inferred. On the contrary, information-theoretic approaches understand causality as a phenomenon that can be not only detected or measured but also quantified. In addition, they are sensitive to nonlinear signal properties, as they do not rely on linear regression models.
In the analysis, we relied on the concept of Transfer Entropy (TE) to estimate the strength and direction of information transfer between the daily time series of the percentage of vaccine-related content from Questionable and Reliable sources, respectively.
TE [89] is the model-free measure of a (Shannonian) information transfer defined by means of Kullback–Leibler divergence [103] on conditional transition probabilities of two Markov processes and of orders and , respectively, as
| (2) |
where and . The estimate of the information transfer from to is derived analogously. For independent processes, TE is equal to zero.
Since a straightforward implementation of (2) could lead to biased estimates when the expected effect is rather small or the sample size is limited [104], we also calculated the Effective Transfer Entropy (ETE) [91] defined as
| (3) |
where indicates the average transfer entropy over independently shuffled .
To assess the statistical significance of (2), we applied a bootstrap procedure of the Markov process underlying that destroys the statistical dependencies between and but, conversely from only shuffling, retains the dependencies within [105]. ETE is calculated by using 100 shuffles and 300 bootstrap replications to obtain the distribution of the estimates under the null hypothesis of no information flow [106].
Common choices of the Markov block length in and are and , and the last is usually preferred [89]. Thus, the analysis in the current study is conducted by setting [92]. In other words, we measure the capacity of one time series to predict the immediate future of the another, i.e. just one symbol ahead [101, 107].
TE estimates are based on discrete data. Hence we transformed our series into symbol sequences by partitioning the data into bins. Suitable values of have been empirically proven to be in the range [108]. Moreover, since in most cases does not imply a better projection of the data in the symbol space, we consider [101]. In our case study, the highest daily percentage of vaccine-related content from both Questionable and Reliable sourcesets is , hence we rely on powers of two for identifying the five bins (see Table S5 in Supplementary Materials for the bin-quantile correspondence).
User engagement and overperforming content
In this work, the news items collected were processed regardless of the social media where they were published. In other words, the contents published by a news source during the time span refer to the totality of its Facebook posts, Instagram media, Twitter tweets and YouTube videos. Analogously, the user interactions include the totality of actions taken on throughout : comments, shares, likes and other reactions (angry, haha, love, sad, wow) on Facebook posts; comments and likes on Instagram media; replies, retweets and likes on Twitter tweets; comments, likes and dislikes on YouTube videos.
Let be a universe of new sources and . We denote by and the number of contents published by the whole in the time span and the corresponding number of user interactions, respectively. Let now be a universe of pairwise disjoint features and . We write and for denoting that the aforementioned quantities concern the set of features .
We compute the total user engagement with the -related content published by during as the real number
| (4) |
where represents the average number of followers of the social media accounts of which were active during . In other words, if did not publish any content on any of the analysed platforms throughout , its contribution to is 0. If was only active on Facebook during , then counts only the average number of its fans on Facebook during .
To assess the importance of the -related content published by throughout in terms of user engagement, we investigate two different points of view: the out-engage factor of to , that is the complement of in (inside perspective); the out-engage factor of in to itself in , that is the complement of in (outside perspective). Namely, we refer to the factor of proportionality of to in the former case, and to the factor of proportionality of to in the latter case. To these aims, we consider the function with codomain defined by
| (5) |
where is another set of sources, another set of subjects, and stands for the sign function of the difference :
| (6) |
It is straightforward to notice that if and only if the user engagement on -related content from during equals the user engagement on -related content from during the same time span. Otherwise, if then the user engagement on -related content from is higher than the user engagement on -related content from , and we say that is overperforming in with respect to in during . Conversely, if we say that is overperforming in with respect to in during .
For and the absolute value returned by (5) responds to the inside perspective, and we also write . For and it responds to the outside perspective, and we also write .
In the analysis, we consider the partition of the selected sourceset into Questionable and Reliable subsets, and we study the distribution of the daily out-engage factor of the vaccine subject from both the perspectives. Limited to vaccine-related content, we also investigate both the perspectives in the universe of possible stances conveyed: anti-vax, neutral, pro-vax.
Modeling stance conveyed and topic discussed in vaccine-related content
One of the goal of this study is to build a deep learning model capable of predicting whether the text of social media content conveys anti-vax, neutral or pro-vax stance. We first manually annotated of the content gathered. Despite the sample was intentionally selected to contain as much extreme positions as possible, approximately half of the annotated data concerns neutral stance. To make the model more balanced between stance classes and more confident with the local space around extreme positions, we applied text data augmentation techniques to content annotated as conveying anti- or pro-vax stance. The augmented dataset was then split into two parts to produce a dataset for training and a dataset for evaluating the model. We then apply the model to all the collected data and study the relationship between the factualness of the news sources (questionable or reliable) and the stance conveyed through vaccine-related content (anti-vax, neutral or pro-vax).
The annotation process also concerned the identification of the topic discussed: one of administration of vaccines, vaccine business, effectiveness of vaccination, legal issues, safety concerns, other. Then we used the same training and test datasets also to build a deep learning model capable of predicting the topic discussed in vaccine-related content.
Deep learning models based on Transformer architecture outperform other approaches to most automated natural language processing tasks, especially when data comes from social media [109, 110]. Hence, we followed the Google’s pre-trained language model [111], which represents the state-of-the-art for semantic text representation in most languages [112], to train our Italian models.
Data selection, annotation and augmentation.
The content to be annotated were sampled from the collected data. To get a training set as rich as possible with both anti-vax and pro-vax stance, we intentionally annotated about three-quarters (9,071) of content published by those news sources that mainly cover topics concerning medicine, science and technology, both questionable (the more likely to convey anti-vax stance) and reliable (the more likely to convey pro-vax stance). Other 25,232 contents to be annotated were randomly selected from the data produced by the remaining sources. The data to annotate was split among the authors. The splitting procedure was optimised to get overlap between the authors. This allowed us to compare the annotator agreement results with the model performance (see Classification). The total annotated data consist of 34,303 contents, divided according to the stance conveyed in 9,902 anti-vax, 17,258 neutral, and 7,143 pro-vax.
Since anti-vax and pro-vax stances are only conveyed by about half of the annotated contents, we applied a text data augmentation technique to make the model more balanced between stance classes and more familiar with the local space around non-neutral positions. Namely, we relied on the nlpaug Python library [113] to get 11,712 augmented contents. Augmented contents were obtained by inserting words in a selection of data annotated as anti-vax or pro-vax through the contextual word embedding of BERT, i.e., the pre-trained language model then fine tuned to the annotated data. The data to be augmented were chosen randomly but preserving the topic distribution of the whole annotated dataset.
The augmented dataset was then split into two parts to produce a dataset for training () and a dataset for evaluating () the model, by ensuring on both sets the same class distribution with respect to both stances and topics. To assure proper model evaluation, neither the annotated content used as a basis for the augmentation nor the augmented content were included in the evaluation set.
The annotation results with respect to opinion and topic for the training and evaluation sets are summarised in Table 5.
| Adm | Bus | Eff | Leg | Oth | Saf | |||
|---|---|---|---|---|---|---|---|---|
| A | 941 | 1,019 | 1,895 | 929 | 238 | 6,664 | 11,686 | (31%) |
| N | 6,733 | 311 | 1,816 | 1,379 | 1,121 | 2,351 | 13,711 | (38%) |
| P | 1,734 | 320 | 5,664 | 491 | 435 | 2,681 | 11,325 | (31%) |
| 9,408 | 1,650 | 9,375 | 2,799 | 1,794 | 11,696 | 36,722 | (100%) | |
| (26%) | (4%) | (25%) | (8%) | (5%) | (32%) | (100%) | ||
| Adm | Bus | Eff | Leg | Oth | Saf | |||
| A | 235 | 254 | 474 | 232 | 59 | 1,666 | 2,920 | (31%) |
| N | 1,808 | 78 | 454 | 344 | 280 | 587 | 3,551 | (38%) |
| P | 433 | 80 | 1,415 | 122 | 108 | 670 | 2,828 | (31%) |
| 2,476 | 412 | 2,343 | 698 | 447 | 2,923 | 9,299 | (100%) | |
| (26%) | (4%) | (25%) | (8%) | (5%) | (32%) | (100%) | ||
Classification.
A state-of-the-art neural model based on Transformer language models was trained to distinguish between the three stance classes. We used the pre-trained BERT multilingual cased model [111] consisting of 12 stacked Transformer blocks with 12 attention heads each. We attached a linear layer with a softmax activation function at the output of these layers to serve as the classification layer. As input to the classifier, we take the representation of the special [CLS] token from the last layer of the language model. The whole model is jointly trained on the downstream task of three-class stance identification. According to the BERT reference paper, fine-tuning of the neural models was performed end-to-end. We used the Adam optimizer with the learning rate of and weight decay set to 0.01 for regularization [114]. The model was trained for 4 epochs with batch size 64 through the HuggingFace Transformers library [115].
The same pre-trained architecture and hyperparameters were also used to train a model for distinguish between the six topics.
Table 6 reports the performance of the trained models compared with the inter-annotator agreement by using the same measure: accuracy (Acc) and the F1 score for individual classes, on both the training and the evaluation datasets. The confusion matrices for the evaluation set, used to compute all the scores of the annotator agreements and the model performance, are reported in Tables S11 and S12 of the Supplementary Materials.
| Performance and agreement | Overall | A | N | P |
|---|---|---|---|---|
| Acc | F1 | F1 | F1 | |
| Model | ||||
| Training | 0.93 | 0.93 | 0.91 | 0.94 |
| Evaluation | 0.88 | 0.88 | 0.86 | 0.90 |
| Inter-annotator | ||||
| Training | 0.89 | 0.90 | 0.86 | 0.89 |
| Evaluation | 0.89 | 0.90 | 0.87 | 0.89 |
| Performance and agreement | Overall | Adm | Bus | Eff | Leg | Saf | Oth |
|---|---|---|---|---|---|---|---|
| Acc | F1 | F1 | F1 | F1 | F1 | F1 | |
| Model | |||||||
| Training | 0.94 | 0.94 | 0.85 | 0.94 | 0.88 | 0.95 | 0.79 |
| Evaluation | 0.88 | 0.88 | 0.83 | 0.89 | 0.80 | 0.92 | 0.73 |
| Inter-annotator | |||||||
| Training | 0.91 | 0.89 | 0.83 | 0.92 | 0.81 | 0.95 | 0.78 |
| Evaluation | 0.87 | 0.86 | 0.78 | 0.89 | 0.78 | 0.92 | 0.70 |
Acknowledgments
Author contributions: All authors contributed equally to this work. Competing interests: The authors declare that they have no competing interests. Data and materials availability: All data needed to evaluate the conclusions in the paper are present in the paper and in the Supplementary Materials. The machine learning models built for predicting stance conveyed and topic discussed in vaccine-related content are available from https://huggingface.co/brema76/vaccine_opinion_it and https://huggingface.co/brema76/vaccine_topic_it, respectively. Additional data related to this paper may be requested from the authors.
References
- [1] J. Habermas, S. Lennox, F. Lennox, New German Critique pp. 49–55 (1974).
- [2] S. Edgerly, et al., Association of Internet Researchers Conference (2009).
- [3] C. Fuchs, Culture and Economy in the Age of Social Media (1st ed.) (Routledge, 2015), pp. 315–372.
- [4] J. B. Bak-Coleman, et al., Proceedings of the National Academy of Sciences 118, e2025764118 (2021).
- [5] E. L. Glaeser, G. Ujhelyi, Journal of Public Economics 94, 247 (2010).
- [6] N. Kshetri, J. Voas, IT Professional 19, 8 (2017).
- [7] A. Goldman, C. O’Connor, The Stanford Encyclopedia of Philosophy, E. N. Zalta, ed. (Metaphysics Research Lab, Stanford University, 2021), Winter 2021 edn.
- [8] L. Floridi, Philosophy and Phenomenological Research 70, 351 (2005).
- [9] M. Delmastro, M. Paciello, Scientific reports 12, 16408 (2022).
- [10] G. Pennycook, D. G. Rand, Trends in Cognitive Sciences 25, 388 (2021).
- [11] S. Loomba, A. de Figueiredo, S. J. Piatek, K. de Graaf, H. J. Larson, Scientific reports 5, 337 (2021).
- [12] B. G. Southwell, E. A. Thorson, L. Sheble, Misinformation and mass audiences (University of Texas Press, 2018).
- [13] J. B. Bak-Coleman, et al., Nature Human Behaviour (2022).
- [14] R. Calo, C. Coward, E. S. Spiro, K. Starbird, J. D. West, Science Advances 7, eabn0481 (2021).
- [15] D. M. J. Lazer, et al., Science 359, 1094 (2018).
- [16] H. Allcott, M. Gentzkow, Journal of Economic Perspectives 31, 211 (2017).
- [17] J. Allen, B. Howland, M. Mobius, D. Rothschild, D. J. Watts, Science Advances 6, eaay3539 (2020).
- [18] M. Cinelli, S. Cresci, A. Galeazzi, W. Quattrociocchi, M. Tesconi, PLOS ONE 15, 1 (2020).
- [19] R. Fletcher, A. Cornia, L. Graves, R. K. Nielsen, Measuring the reach of “fake news” and online disinformation in europe. Available from https://reutersinstitute.politics.ox.ac.uk/sites/default/files/2018-02/MeasuringthereachoffakenewsandonlinedistributioninEuropeCORRECTFLAG.pdf (accessed Sep 10, 2022).
- [20] N. Grinberg, K. Joseph, L. Friedland, B. Swire-Thompson, D. Lazer, Science 363, 374 (2019).
- [21] A. Guess, J. Nagler, J. Tucker, Science Advances 5, eaau4586 (2019).
- [22] D. J. Watts, D. M. Rothschild, M. Mobius, Proceedings of the National Academy of Sciences 118, e1912443118 (2021).
- [23] N. Cartwright, E. Montuschi, Philosophy of social science: A new introduction (Oxford University Press, 2014).
- [24] E. K. Vraga, L. Bode, Political Communication 37, 136 (2020).
- [25] E. C. Tandoc Jr., Z. W. Lim, R. Ling, Digital Journalism 6, 137 (2018).
- [26] F. Torabi Asr, M. Taboada, Big Data & Society 6, 2053951719843310 (2019).
- [27] M. Cinelli, et al., Scientific Reports 10, 16598 (2020).
- [28] M. Cinelli, G. De Francisci Morales, A. Galeazzi, W. Quattrociocchi, M. Starnini, Proceedings of the National Academy of Sciences 118, e2023301118 (2021).
- [29] M. Del Vicario, et al., Proceedings of the National Academy of Sciences 113, 554 (2016).
- [30] M. Delmastro, On the measurement of social phenomena: A methodological approach, SpringerBriefs in Political Science (Springer, 2021).
- [31] P. Gravino, G. Prevedello, M. Galletti, V. Loreto, Nature Human Behaviour (2021).
- [32] G. Pennycook, D. G. Rand, Proceedings of the National Academy of Sciences 116, 2521 (2019).
- [33] W.-Y. S. Chou, A. Oh, W. M. P. Klein, JAMA 320, 2417 (2018).
- [34] J. Green, J. Edgerton, D. Naftel, K. Shoub, S. J. Cranmer, Science advances 6, eabc2717 (2020).
- [35] Cancer Treatment Centers of America, The dangers of fake medical news (2017). Available from https://www.cancercenter.com/community/blog/2017/04/the-dangers-of-fake-medical-news (accessed Jul 10, 2022).
- [36] L. Kim, S. M. Fast, N. Markuzon, PLOS ONE 14, 1 (2019).
- [37] A. Krishna, T. L. Thompson, American Behavioral Scientist 65, 316 (2021).
- [38] B. Swire-Thompson, D. Lazer, Annual Review of Public Health 41, 433 (2020).
- [39] C. Betsch, F. Renkewitz, T. Betsch, C. Ulshöfer, Journal of Health Psychology 15, 446 (2010).
- [40] F. Germani, N. Biller-Andorno, PLOS ONE 16, 1 (2021).
- [41] N. Gozzi, et al., J Med Internet Res 22, e21597 (2020).
- [42] W. Jennings, et al., Vaccines 9 (2021).
- [43] N. F. Johnson, et al., Nature 582, 230 (2020).
- [44] A. Kata, Vaccine 28, 1709 (2010).
- [45] H. Piedrahita-Valdés, et al., Vaccines 9 (2021).
- [46] S. L. Wilson, C. Wiysonge, BMJ Global Health 5 (2020).
- [47] R. Brotherton, Suspicious minds: Why we believe conspiracy theories (Bloomsbury Publishing, 2015).
- [48] M. Dredze, D. A. Broniatowski, K. M. Hilyard, Vaccine 34, 3441 (2016).
- [49] U. K. H. Ecker, et al., Nature Reviews Psychology 1, 13 (2022).
- [50] A. M. Guess, B. Nyhan, Z. O’Keeffe, J. Reifler, Vaccine 38, 7799 (2020).
- [51] M. J. Hornsey, M. Finlayson, G. Chatwood, C. T. Begeny, Journal of Experimental Social Psychology 88, 103947 (2020).
- [52] D. A. Broniatowski, et al., American Journal of Public Health 108, 1378 (2018).
- [53] L. Buccoliero, et al., 2021 AMA Marketing and Public Policy Conference (AMA, 2021), pp. 399–409.
- [54] H. J. Larson, L. Z. Cooper, J. Eskola, S. L. Katz, S. Ratzan, The Lancet 378, 526 (2011).
- [55] R. Akbar, Ten threats to global health in 2019 (2019). Available from https://www.who.int/news-room/spotlight/ten-threats-to-global-health-in-2019 (accessed Jun 12, 2022).
- [56] S. Chirumbolo, Journal of Medical Virology 93, 4049 (2021).
- [57] A. Fridman, R. Gershon, A. Gneezy, PLOS ONE 16, 1 (2021).
- [58] D. M. Herszenhorn, Von der leyen sees ’pandemic of the unvaccinated’ (2021). Available from https://www.politico.eu/article/von-der-leyen-pandemicvaccine-unvaccinated-coronavirus-fourth-wave/ (accessed May 30, 2022).
- [59] I. Kottasová, They have all the vaccines they need, but these eu nations are still miles behind their neighbors (2021). Available from https://edition.cnn.com/2021/10/01/europe/eastern-europevaccine-takeup-bulgaria-romania-intl-cmd/index.html (accessed May 30, 2022).
- [60] A. L. Schmidt, F. Zollo, A. Scala, C. Betsch, W. Quattrociocchi, Vaccine 36, 3606 (2018).
- [61] G. Crupi, Y. Mejova, M. Tizzani, D. Paolotti, A. Panisson, Proceedings of the International AAAI Conference on Web and Social Media 16, 102 (2022).
- [62] D. Allchin, Science Education 87, 329 (2003).
- [63] E. Brugnoli, M. Cinelli, W. Quattrociocchi, A. Scala, Scientific Reports 9, 1 (2019).
- [64] E. Thorson, Political Communication 33, 460 (2016).
- [65] R. L. Claassen, B. Highton, The Journal of Politics 68, 410 (2006).
- [66] S. Pluviano, C. Watt, S. Della Sala, PLOS ONE 12, 1 (2017).
- [67] S. Geoghegan, K. P. O’Callaghan, P. A. Offit, Frontiers in Microbiology 11 (2020).
- [68] V. A. Chanley, Political Psychology 23, 469 (2002).
- [69] T. de Jongh, B. Rofagha, L. Petrosova, Countering online vaccine misinformation in the EU/EEA, Tech. rep., European Centre for Disease Prevention and Control (2021).
- [70] V. Suarez-Lledo, J. Alvarez-Galvez, Journal of Medical Internet Research 23 (2021).
- [71] H. J. Larson, Nature 580 (2020).
- [72] M. S. Schäfer, Digital public sphere (John Wiley & Sons, Ltd, 2016), pp. 1–7.
- [73] H. Hosseinmardi, et al., Proceedings of the National Academy of Sciences 118, e2101967118 (2021).
- [74] Y. Wang, M. McKee, A. Torbica, D. Stuckler, Social Science & Medicine 240, 112552 (2019).
- [75] Z. W. Almquist, S. Arya, L. Zeng, E. Spiro, Field Methods 31, 23 (2019).
- [76] S. Aral, D. Eckles, Science 365, 858 (2019).
- [77] J. Jasser, Companion Proceedings of The 2019 World Wide Web Conference, WWW ’19 (Association for Computing Machinery, New York, NY, USA, 2019), p. 33–36.
- [78] H. K. Kim, E. C. Tandoc, Frontiers in Psychology 13 (2022).
- [79] N. Rabb, L. Cowen, J. P. de Ruiter, M. Scheutz, PLOS ONE 17, 1 (2022).
- [80] J. Roozenbeek, S. van der Linden, Journal of Risk Research 22, 570 (2019).
- [81] S. Vosoughi, D. Roy, S. Aral, Science 359, 1146 (2018).
- [82] Z. Zhao, et al., EPJ Data Science 9 (2020).
- [83] L. Edelson, et al., Proceedings of the 21st ACM Internet Measurement Conference, IMC ’21 (Association for Computing Machinery, New York, NY, USA, 2021), p. 444–463.
- [84] S. Galam, R. R. W. Brooks, Phys. Rev. E 105, 044112 (2022).
- [85] A. Goldenberg, J. J. Gross, Trends in Cognitive Sciences 24, 316 (2020).
- [86] S. K. Yeo, M. McKasy, Proceedings of the National Academy of Sciences 118, e2002484118 (2021).
- [87] G. R. Arce, Nonlinear Signal Processing: A Statistical Approach (Wiley, New York, NY, USA, 2004).
- [88] S. Barello, L. Palamenghi, G. Graffigna, Vaccines 10 (2022).
- [89] T. Schreiber, Phys. Rev. Lett. 85, 461 (2000).
- [90] C. E. Shannon, The Bell System Technical Journal 27, 379 (1948).
- [91] R. Marschinski, H. Kantz, The European Physical Journal B - Condensed Matter and Complex Systems 30, 275 (2002).
- [92] N. A. Caserini, P. Pagnottoni, Statistical Methods & Applications (2021).
- [93] E. Pertwee, C. Simas, H. J. Larson, Nature Medicine 28, 456 (2022).
- [94] B. H. Baltagi, Q. Li, Journal of Econometrics 48, 385 (1991).
- [95] B. H. Baltagi, L. Liu, International Journal of Forecasting 29, 100 (2013).
- [96] A. Downs, The Public Interest 28, 38 (1972).
- [97] M. Castaldo, T. Venturini, P. Frasca, F. Gargiulo, New Media & Society 24, 2027 (2022).
- [98] Z. Horne, D. Powell, J. E. Hummel, K. J. Holyoak, Proceedings of the National Academy of Sciences 112, 10321 (2015).
- [99] A. Whiting, Tone as important as truth to counter vaccine fake news (2022). Available from https://ec.europa.eu/research-and-innovation/en/horizon-magazine/tone-important-truth-counter-vaccine-fake-news (accessed Sep 10, 2022).
- [100] C. W. J. Granger, Econometrica 37, 424 (1969).
- [101] J. Borge-Holthoefer, et al., Science Advances 2, e1501158 (2016).
- [102] G. Ver Steeg, A. Galstyan, 21st International Conference on World Wide Web WWW ’12 (ACM, New York, NY, USA, 2012), pp. 509–518.
- [103] S. Kullback, R. A. Leibler, The Annals of Mathematical Statistics 22, 79 (1951).
- [104] S. Panzeri, R. Senatore, M. A. Montemurro, R. S. Petersen, Journal of Neurophysiology 98, 1064 (2007).
- [105] T. Dimpfl, F. J. Peter, Studies in Nonlinear Dynamics and Econometrics 17, 85 (2013).
- [106] S. Behrendt, T. Dimpfl, F. J. Peter, D. J. Zimmermann, SoftwareX 10, 100265 (2019).
- [107] M. Staniek, K. Lehnertz, Phys. Rev. Lett. 100, 158101 (2008).
- [108] C. Bandt, B. Pompe, Phys. Rev. Lett. 88, 174102 (2002).
- [109] S. Tabinda Kokab, S. Asghar, S. Naz, Array 14, 100157 (2022).
- [110] A. Vaswani, et al., Advances in Neural Information Processing Systems, I. Guyon, et al., eds. (Curran Associates, Inc., 2017), vol. 30, pp. 6000–6010.
- [111] J. Devlin, M. Chang, K. Lee, K. Toutanova, ArXiv abs/1810.04805 (2018).
- [112] A. R. Abas, I. El-Henawy, H. Mohamed, A. Abdellatif, IEEE Access 8, 128845 (2020).
- [113] E. Ma, Nlp augmentation, https://github.com/makcedward/nlpaug (2019).
- [114] M. Cinelli, et al., Scientific Reports 11, 22083 (2021).
- [115] T. Wolf, et al., ArXiv abs/1910.03771 (2019).
- [116] J. Zarocostas, The Lancet 395, 676 (2020).
- [117] WHO, Novel coronavirus(2019-ncov). situation report - 13 (2020). Available from https://www.who.int/docs/default-source/coronaviruse/situation-reports/20200202-sitrep-13-ncov-v3.pdf (accessed Jun 12, 2022).
- [118] NewsguardTech.com, Social impact report 2021 (2022). Available from https://www.newsguardtech.com/wp-content/uploads/2022/01/NewsGuard-Social-Impact-Report-1.21.22.pdf (accessed Aug 27, 2022).
- [119] E. C. Tandoc Jr., Sociology Compass 13, e12724 (2019).
- [120] R. M. Wolfe, L. K. Sharp, Journal of health communication 10, 537 (2005).