Microfluidic jet impact: spreading, splashing, soft substrate deformation and injection.
Abstract
Injecting with needles causes fear, pain and contamination risks. Billions of injections every year also cause environmental burden in terms of material consumption and waste. Controlled microfluidic-jet injection systems offer a needle-free alternative. However, understanding the relation between jet parameters and resulting injection depth are needed to enable targeting specific skin layers, and enhance the pharmacokinetics of various therapeutic compounds. The complexity of skin, its opacity and non-linear mechanical properties, pose a technological challenge. Hence the use of surrogates is instrumental to understand how to inject without needles. In particular, reducing undesired splashing upon jet impact and liquid squeeze-out after injection are needed to minimize infection risks and ensure accurate dosage. Therefore, in this paper we explore how microfluidic jet characteristics influence the impact outcome on a range of materials as skin surrogate. Jets with velocities between 7 - 77 m/s and diameters 35 - 130 m were directed at substrates with shear moduli between 0.2 kPa and 26 GPa. We found seven different regimes depending on jet inertia and substrate shear modulus. Furthermore, three distinct transition regions were identified as the thresholds between regimes: i) spreading/splashing threshold, ii) dimple formation threshold, and iii) plastic/elastic deformation threshold. These thresholds allow predicting the required jet velocity and diameter to inject substrates with known shear modulus. We found that jet velocity is a better predictor for the injection depth compared to the Weber number, as the jet diameter does not influence the injection depth. Our findings are relevant for advancing needle-free injection research, because the shear modulus of skin depends on multiple factors, such as ethnicity, body part and environmental conditions.
I Introduction
Solid needle injections have inherent drawbacks despite their wide use and effectiveness in medical and cosmetic procedures. Worldwide, 16 billion needles are disposed yearly[1], with an additional 12 billion due to the COVID-19 vaccinations[2], creating an environmental burden in terms of material usage and waste[3, 4]. Needles pose infection risks upon sticking incidents[5] and re-use, the latter being estimated to cause over 500 million deaths yearly[6]. Additionally, injections cause pain, and fear is experienced by 22 of the adult population[7]. This fear may result in avoidance of treatment[8, 9], decreasing the effectiveness of vaccination programs[10]. To address these issues, alternatives to conventional injections are being developed, such as liquid jet injections. Liquid jets can be made by accelerating fluids with various mechanisms[11, 12, 13]. Most commercialized injectors can only perform injections at a minimum depth of 1 mm, and are associated with pain and bruising, limiting their appeal in replacing needles[14, 15]. Controlled jet injections into shallow depths in the epidermis may result in reduced tissue damage, causing less bruising and pain compared to the current alternatives[16, 17, 18, 19]. Moreover, control over injection depth could improve the pharmacokinetics of various therapeutics. For example, vaccines delivered within the epidermis require five to ten times less dosing due to the abundance of specialized immune cells[20, 21]. Also, dermal insulin injections are reported to be more efficient compared to traditional subcutaneous delivery[22]. The relation between jet characteristics and injection depth in the skin must be understood to enable controlled injections. Correlating input parameters with the injection depth can be challenging as skin is a highly complex, multilayered tissue[23]. The mechanical response of skin is dependent on measurement type, leading to reported skin stiffness values ranging from 1 MPa – 1 GPa[24, 25]. Additionally, skin’s poro-viscoelastic behavior causes a portion of the injected liquid to be ejected during, or after, injection, due to the elastic recovery of the material (squeeze-out)[26, 27, 28, 29]. Multiple papers show how jet parameters relate to injection depth[15, 26, 30, 31], dispersion[26, 31, 32, 33], and delivery efficiency[17, 26, 31]. However, a detailed study of the impact behavior, especially the breakup of a jet upon impact (splashing) and squeeze-out at the microscale is lacking. Splashing and squeeze-out must be minimized as both reduce the delivery efficiency, and pose infection risks in extreme cases[34, 35]. Minimizing splashing requires knowledge about microjet impact behavior and how this relates to jet break-up. Droplet splashing has been extensively characterized[36, 37, 38, 39, 40, 41, 42, 43, 44, 45], and it has been shown to depend on the substrate, liquid characteristics, and ambient pressure[36, 37, 46, 47]. Furthermore, it is known that microscale droplets show different impact behavior compared to macroscale droplets as the rim of liquid formed after the impact becomes comparable to the mean free path of air molecules [48, 49, 50]. In contrast to droplet splashing, studies on jet impact and splashing are limited, and reported values for the splashing threshold vary widely[51, 52]. Furthermore, few studies have explored the splashing dynamics for substrates with different storage moduli[53, 28, 54], and it remains unknown how microscale jet behavior compares to macroscale jets. Therefore, in this paper, we study microfluidic-jet impact and injection behavior onto a range of substrate stiffness to gain fundamental knowledge on fluid dynamics and soft matter response. This knowledge can assist in optimizing controlled needle-free injections by controlling injection depth and reducing splashing and squeeze-out.
II Materials and Methodology
II.1 Methodology
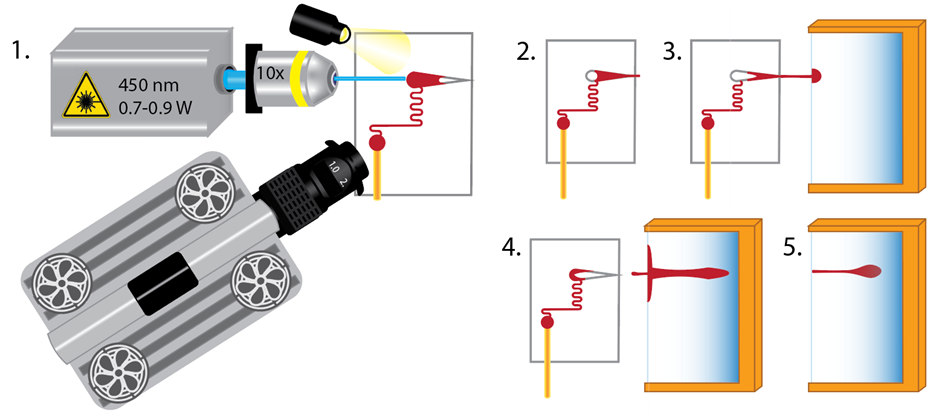
A continuous wave (CW) laser setup was employed to perform controlled injections with microfluidic jets using thermocavitation. A vapor bubble is created upon CW laser beam exposure at the glass-liquid interface due to the conversion of laser energy to heat[55, 56]. The bubble expands and pushes the liquid out of the chip as a liquid jet. By changing the channel design, the channel filling level, the input laser power, laser pulse duration and distance from the laser focal point to the base of the chip, jets with varying characteristics can be obtained[18, 57]. The used chips, some of their details, and the resulting jet ranges are shown in Table 1. Figure 1 shows an illustration of a microfluidic chip and a jetting event.
| Chip | Channel length | Filling levels | Taper angle | Orifice width | Channel wall | |||
|---|---|---|---|---|---|---|---|---|
| 1 | 1.9 mm | 0.4-1.9 mm | 7.5 | 50 m | Flat | 45-130 m | 7-37 m/s | 70-2500 |
| 2 | 1.9 mm | 0.9-1.9 mm | 7.5 | 50 m | Flat | 40-110 m | 17-67 m/s | 1200-4000 |
| 3 | 2.1 mm | 0.7-1.9 mm | x | 500 m | Curved | 45-100 m | 71-77 m/s | 1600-4000 |
II.2 Experimental setup
The experimental setup consists of a glass microfluidic chip filled with a water-dye solution and a CW laser diode ( = 450 nm) focused on the glass-liquid interface using a 10x objective (Olympus) (see figure 1). An Arduino controller sets the laser pulse duration (10-30 ms)[18]. The chips were designed and fabricated from MEMPax Borofloat glass wafers (Schott) under cleanroom conditions[57]. The chips are aligned with the test substrates at a stand-off distance = 2 mm. A red dye (Direct Red 81, Sigma, CAS: 2610-119) was dissolved at 0.5 wt in deionized water () to maximize the laser energy absorption of the liquid. The solution had a density, = 1000 ; viscosity, = 0.91 mPaS; and surface tension, = 47 mN/m, as determined at 22°C and described elsewhere[18].
Nucleation, jetting, impact and injection events are imaged using a high-speed camera (Photron FASTCAM SA-X2) with a mounted Navitar (12x Ultra Zoom) at 2x magnification captured at 1.8×10⁵ or 1.2×10⁵ frames per second (fps), and backlight illuminated using a SCHOTT light source (CV-LS series) with flexible light guide. The field of view was either 640x128 or 768×64 pixels with a pixel size of 10 m. A mounted long pass 495 nm filter (Thorlabs, FGL495M) was used to avoid over saturation from the laser light.
II.3 Jet impact substrates
II.3.1 Glass slides
Glass slides (MEMPax Borofloat, 30×15×0.5mm) were used to test the impact on stiff substrates. The slide was attached to a XYZ-stage at level surface. The glass surface was cleaned with acetone before and after jet impact using a Kim-wipe. The liquid contact angle was determined by placing a 5 L droplet on the glass surface and captured with the Photron camera. The contact angle was calculated by taking half the reflection angle (processed using ImageJ) which resulted in 23° for water and 15° for the dye solution. The glass Young’s modulus (E) is 62.6 GPa, with a Poisson’s ratio () of 0.196[58]. As substrate E was known, the Poisson’s ratio was used to calculate G, using:
| (1) |
Where E is the elastic modulus, G is the shear modulus and v is the Poisson’s ratio. This resulted in a shear modulus (G) of 26 GPa (see Table 2).
II.3.2 Agarose gel preparation and casting
Agarose (Sigma, CAS: 9012-36-6) was weighed on a microbalance (VWR) and mixed with . Five concentrations were prepared (0.125, 0.25, 0.5, 1 and 2 wt) and the flask containing the solution was closed using a Precision seal rubber septa (Merck) to minimize evaporation, and was pierced with an injection needle to prevent pressure build-up. The agarose was dissolved using a magnetic stirrer/heater plate (IKA-CMAG), stirred and gently boiled until the solution was completely transparent. The solution was pipetted into a 3D printed mold (3.4×1.8×0.9 cm, 1.7 mL) until a convex gel surface was obtained. The mold has glass slides on either side to create visual access. After cooling down the solution solidified into a transparent and homogeneous gel which were cut with a surgical grade scalpel to create a flat gel surface.
II.3.3 Agarose gel characterization
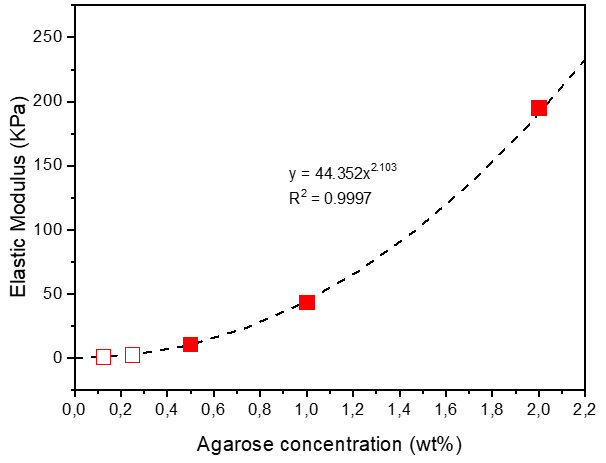
Nanoindentation tests were performed on 0.5, 1 and 2 wt agarose using a Nanovea PB1000 Mechanical tester equipped with a 400 mN Nano module (Nanovea, Irvine, CA, USA), actuated with a piezo driver and equipped with direct load and depth sensors. The high-resolution Nano module allows the application of low target loads (100-200 N) using a 200 m radius 90° sphero-conical indenter to evaluate elastic moduli of the samples. The system monitors the applied load with an independent load-cell and records the indenter position within the material using an independent capacitive depth sensor. A high-speed multichannel 24-bit acquisition card drives both the actuator and the sensors. E was determined to be 195.09 ± 23.29, 43.31 ± 1.42, 10.57 ± 0.79 kPa for 2, 1 and 0.5 respectively. As 0.25 and 0.125 were too soft to obtain a reliable measurement, E was calculated based on the trend of 0.5-2 (), giving 2.4 and 0.6 kPa. See Appendix A for more information. With equation (1), for the listed E, using v= 0.5[59], G was calculated. All values are listed in Table 2.
| Substrate | E | G | |
|---|---|---|---|
| Glass | 62.6 GPa | 0.196 | 2.6 GPa |
| 2 agarose | 195.1 kPa | 0.5 | 65 kPa |
| 1 agarose | 43.3 kPa | 0.5 | 14 kPa |
| 0.5 agarose | 10.6 kPa | 0.5 | 3.5 kPa |
| 0.25 agarose | 2.4 kPa | 0.5 | 0.8 kPa |
| 0.125 agarose | 0.6 kPa | 0.5 | 0.2 kPa |
III Results and discussion
The large range of jets showed distinct impacting behavior depending on jet and substrate characteristics. We observed seven regimes, and characterized them in terms of the Weber number of the impacting jet () and substrate G. As the describes the relative contribution of the fluid’s inertia compared to the surface tension, it is often used to determine splashing thresholds of impacting liquids[36, 37, 38, 51].
For these studies is defined as:
| (2) |
where is the fluid density, is the jet velocity, is the jet diameter, and is the surface tension. In these experiments, both and are constant, so is a function of and .
First, the seven regimes will be reviewed in detail, using illustrations and snapshots. Movies of all described regimes can be found in the online supplemental information. Next, all regimes are combined into a regime map, and the the relation between and substrate G is discussed. Finally, we review how relates to injection depth.
Regime 1: Jet spreading
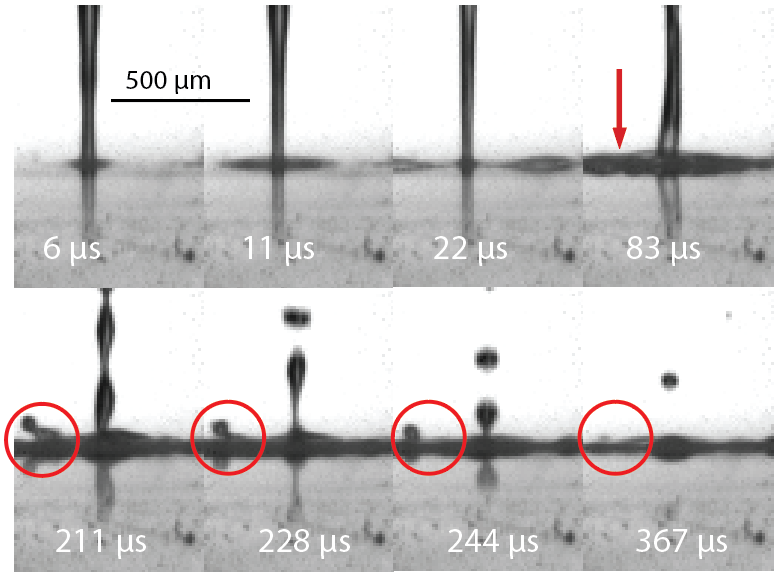
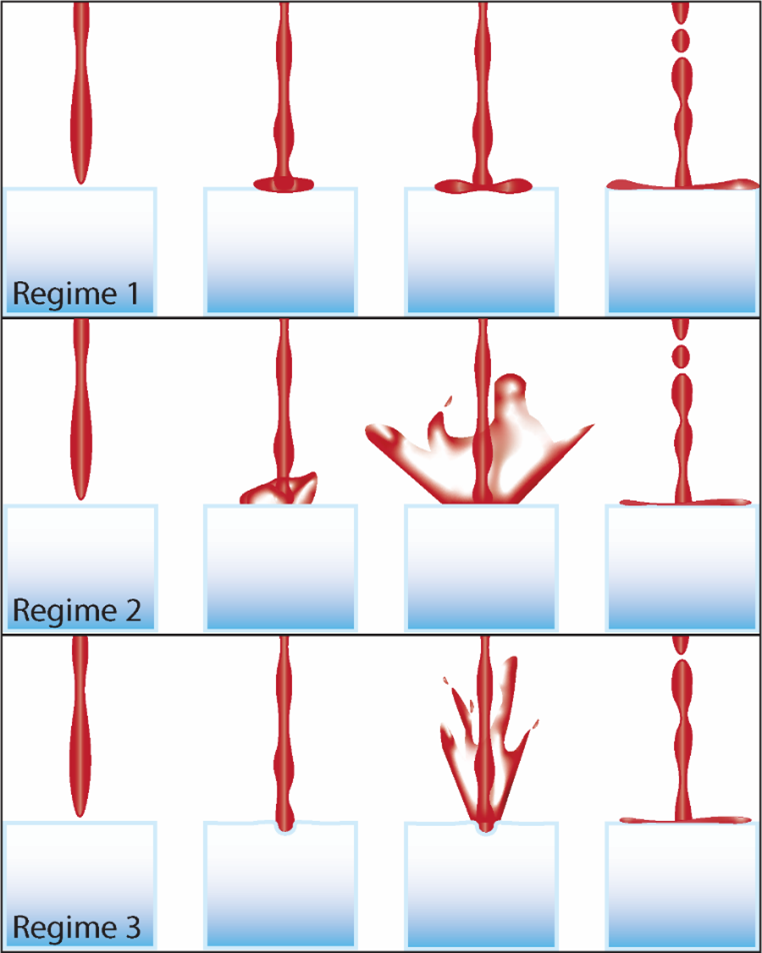
For impact on glass (G = 26 GPa, ) and 2 agarose (G = 65 kPa, 1290), we did not observe material deformation or jet splashing (Figure 2 and Figure 3, top). Impact duration depends on ejected volume, and , and lasts for 500 s on average. The jet spreads on the surface upon impact (Figure 2, t = 6 s), creating a smooth film that spreads radially over the surface and flows with wave formation (t = 11-22 s). This is comparable to the deposition behavior described for droplets and macroscale jets impacting solids[51, 60]. As impact progresses (t = 83 s), the amplitude of the waves increases and lamella formation is seen (Figure 2, red arrow), sometimes to the point where asymmetric fingering edge formation can be seen, but no secondary droplets detach from the expanding liquid sheet (Figure 2, red circles). This fingering behavior shows similarities to the fingering and subsequent droplet break-up reported for skating thin films on solid surfaces[61]. At the end of impact (t = 367 s) the film flow shows a decrease in frequency and amplitude of waves.
Regime 2: Jet splashing
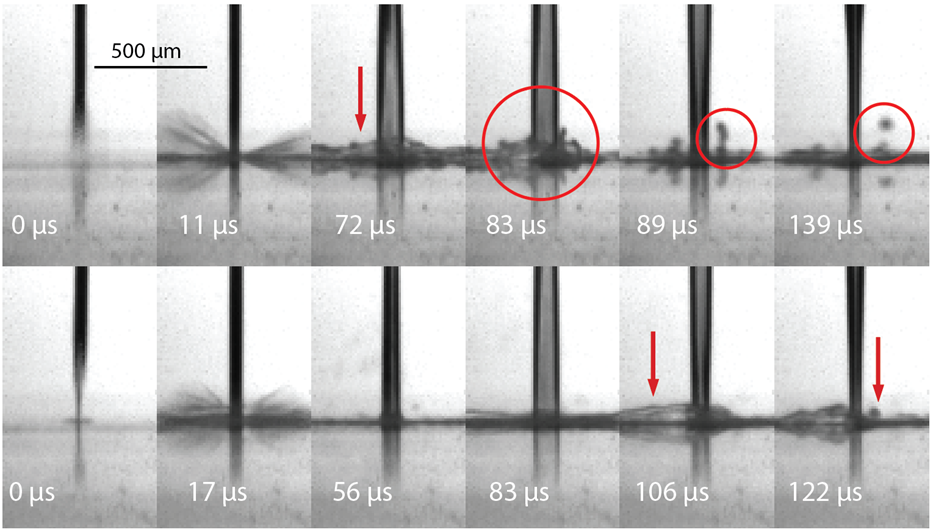
For impact on glass (G = 26 GPa, 1340) and 2 agarose (G = 65 kPa, 1390) splashing was observed in the absence of visible dimple formation, as illustrated in Figure 3. Almost directly upon impact (Figure 4, top, t = 11 s), outward splashing is seen (150-750 m). At 3500, liquid-film expansion occurs similarly to what has been described for Regime 1 (Figure 4, bottom), whereas at 3500 fingering (Figure 4, top, t = 89 s) and subsequent droplet release is seen (t = 139 s). This indicates that for 3500 the jet-tail has sufficient inertia to create secondary splashing within the liquid pool formed by the jet after impact, while jets impacting at 3500 lack inertia, causing only outward splashing upon impact. In accordance with the findings of Howland et al., outward splashing occurred at lower for impact on glass as compared to agarose [38]. Splashing, the lamella formation and subsequent fingering can be described as follows. As the spreading front of the liquid rim advances, a lubrication force from the surrounding gas pushes the lamella upwards. If the lubrication force is larger than the surface tension the lamella will break up into secondary droplets[62]. Therefore the mean free path of the gas molecules (), the lamella thickness and speed determine the splashing phenomena.
If the rim diameter of the lamella increases faster than the lamella lifts from the substrate, the droplet will not splash[50]. Likewise, for microdroplet impacts the lamella thickness is in the order of magnitude of , making the airlift force negligible[48]. The threshold for inhibiting splashing was reported to be , where m is the mean free path of the air at atmospheric pressure[48].
Qian et al. reported a jet splashing regime at = 617 ( = 6 mm)[51], almost twice as low compared to our findings ( = 1340). In contrast, Trainer et al. saw splashing of jets ( = 3 mm) above = 1500[63], closer to our findings. Therefore, we interpret that the low splashing threshold found by Qian et al. is due to the disturbances observed in the jets that lead to break-up[51].
Regime 3: Surface defeat
This Regime is seen for impact on 2 agarose (G = 65 kPa, 3335), 1 agarose (G = 14 kPa, = 400-1970), 0.5 agarose (G = 3.5 kPa, 1060) and 0.25 agarose (G = 0.8 kPa, 170) and illustrated in Figure 3. The jet splashes upon impact (t = 0 s), as seen in Regime 2, and subsequently creates a dimple in the substrate, followed by a secondary splash reaching heights 750 m. Uth et al. reported a similar situation for macro-jet ( = 2 mm) impact on ceramics and gels[64], where the secondary splash is caused by backflow. Indeed, upon impact, the jet creates a dimple with a depth 0.5 , and flows back as it lacks force to further deform the surface. Additionally, the dimple geometry defines the backflow angle, as reported earlier[64], However, due to lack of resolution it is out of scope for these studies to give an exact relation. Finally, as impact progresses (t 400 s), the dimple shrinks and disappears, while the final part of the jet impacts without splashing or injection.
Regime 4: Splash, injection and squeeze-out
This Regime was found for 1 agarose (G = 14 kPa, 2145), 0.5 agarose (G = 3.5 kPa, = 1240-3050) and 0.25 agarose (G = 14 kPa, 2145) and is depicted in Figure 5. First, an initial dimple forms, followed by splashing that reaches heights of 750 m), with an angle determined by the geometry of the dimple. As jet impact continues (t 200 s), the dimple deepens and the substrate surface yields, causing the jet to penetrate further into the substrate while the splashing ceases. Uth et al. also found a decrease in splashing along the injection duration[64].
Towards the end of the jet impact the injection depth no longer increases (t 400 s). Liquid jets have a non-uniform velocity throughout the jet due to air resistance. This causes the jet tail to have a lower speed compared to its front, and consequently the impact pressure of the jet decreases over time. Moreover, agarose is a viscoelastic material[65], and its viscous response suppresses the elastic component temporarily during impact, allowing jet penetration. Once the elastic recovery occurs, as the jet impact force stagnates towards the end of the injection (t 400 s), the gel returns to its original position, thereby squeezing out the liquid that penetrated the gel[66].

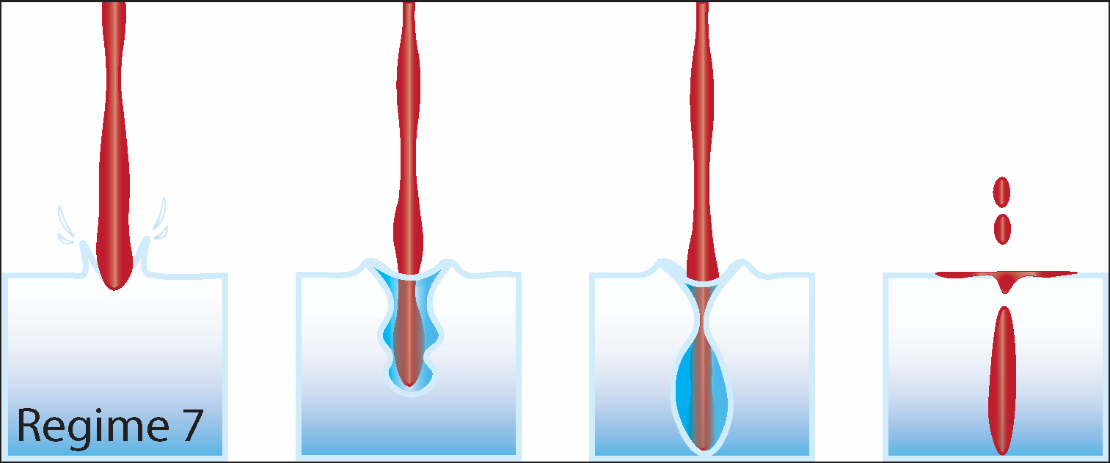
Regime 5: Splash and injection
This Regime, as depicted in Figure 5, was found for impact on 0.5 agarose (G = 35 kPa, 3375) and 0.25 agarose (G = 0.8 kPa, = 655-1240). A dimple is formed with minor splashing (500 – 100 m), followed by substrate penetration. For agarose concentrations lower than 0.25 injection is seen at lower velocities (30 m/s) as compared to the agarose concentrations ( 0.25) 55 m/s. Since intermolecular forces are larger for higher agarose concentrations[59, 65, 66], jet impact deforms the substrate instead of producing a splashing sheet. Towards the end of impact (t 400 s), the injected area may compress or recede, but no squeeze-out is seen in contrast to Regime 4.
Thus, in this Regime we expect to reach the plastic deformation of the material, i.e., jet inertia overcomes the elasticity of the material beyond the recovery point. Additionally, while the jet penetrates (t 400-600 s), the dimple in the surface flattens and widens, eventually pinching off from the injection cavity, sealing the injectate within the gel.
We can compare our results by looking at studies where high-speed projectiles were impacted on various concentrations of gelatin gels, and cavity regimes were defined based on projectile elastic Froude number () as function of substrate G[67]. Within the reported cavity types our observations can be best compared to the shallow seal regime, which we found for G = 3.5 kPa and 3500, 1200; G = 0.8 kPa and 650, 1000; G = 0.2 kPa and = 125-215, 700-1300. Our results are in agreement with Kiyama et al., where they found shallow seals starting from 200 – 400 and transitioning to surface seal at [67]. We did not observe a transition to a surface seal as for our experiments .
Regime 6: Clean injection
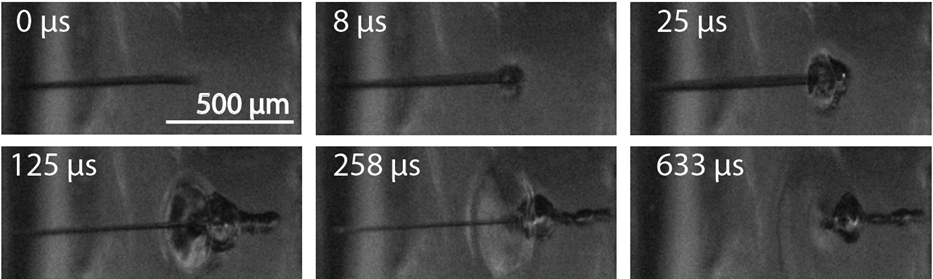
This Regime is the optimal scenario for injections and it was observed for impacts at 0.25 agarose (G = 0.8 kPa, 3375) and 0.125 agarose (G = 0.2 kPa, 270). Like Regime 5, no splashing is seen because the jet-impact pressure only deforms the substrate (see Figure 5). Compared to Regime 5, the dimple expands faster and wider (200 s, 20-40 times for Regime 6 versus 400 s, 1.5-2 times for Regime 5).
Observing at an angle, different phases in the cavity dynamics can be highlighted (see Figure 6). First, the jet front forms a shallow dimple (t = 8 s) which expands into a bell-shaped cavity at t = 25-125 s. The formation of cavities wider than is caused by pressure build-up of the impacting jet at the interface via momentum transfer from the jet, causing the pressure to move radially outwards and entraining the surrounding air[67]. Subsequently (t = 258 s), the trailing part of the jet penetrates the gel surface forming a narrow secondary cavity, which finally seals the jet within the gel (t = 633 s). For 0.25 agarose, the cavity-diameter is approxiamtely 20 times , whereas in 0.125 the cavity-diameter is around 40 times (t = 258 s).
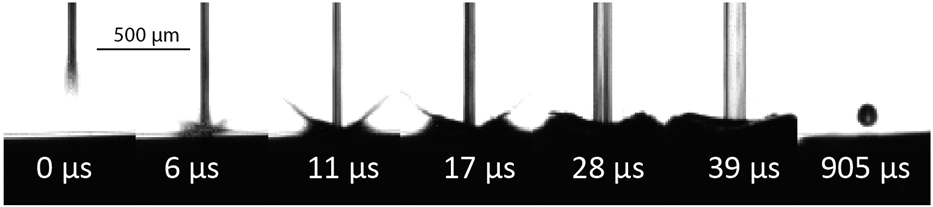
Regime 7: Splashing substrate (no jet splashing)
This Regime corresponds to the softest substrate, 0.125 agarose (G = 0.2 kPa, 290), see Figure 7. In this regime, the substrate splashes upon jet-impact, similarly to water entry experiments, i.e., secondary droplets detach from the substrate, while no jet-splashing is seen. For water entry experiments this regime has been observed at 180-230[57, 58].
As the jet starts penetrating the gel, the gel surface bulges (Figure 8, t = 6 s), and we observe a crown formation of the agarose sheet from where droplets detach (t = 11-17 s). This crown formation resembles water entry experiments. However, higher is required to obtain crown formation in agarose gels as compared to water. This was expected as viscous dissipation is larger in agarose gels than in water, and viscous dissipation stabilizes the crown rim[39, 68]. Furthermore, agarose has a larger effective surface tension than water, and may contribute to the higher crown formation threshold[68]. As jet-impact progresses, the substrate-splashing ceases while the bulge remains and widens (t = 28-39 s). At the end of the impact (t = 900 s), the surface recovers to its original position. The bulging substrate-surface results from pressure build-up and momentum transfer from the impacting jet. Besides the substrate splashing upon jet-impact and the bulging surface, the injection and cavity dynamics are very similar to Regime 6.
Regime map
In Figure 9 we show a regime map by plotting , in terms of the substrate shear modulus on a log-log scale. The blurred symbols represent the experimental data, and the larger symbols show the first transition value to a new regime. Both the transition from spreading to splashing and the transitions to different regimes show linear trends and we have derived three thresholds, defined as: spreading/splashing threshold: ; dimple formation threshold: ; and plastic/elastic deformation threshold: .
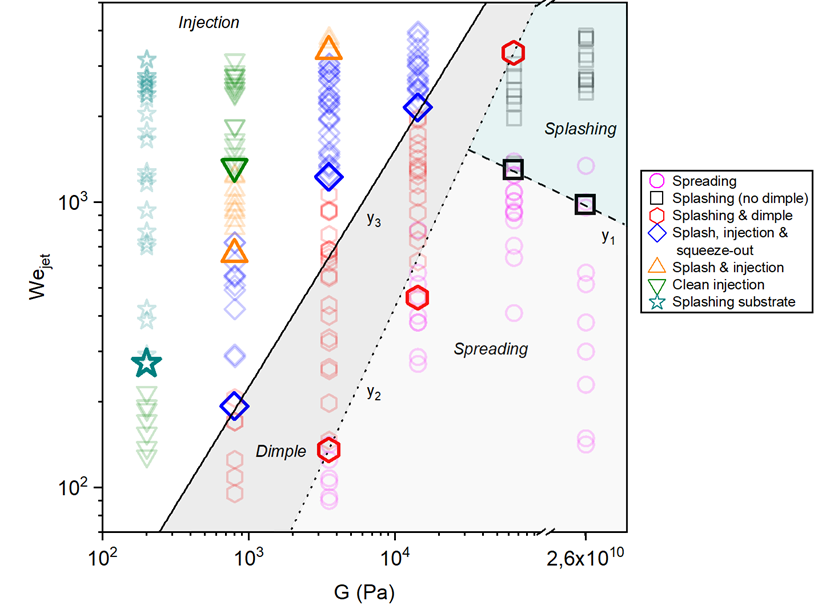
Applying y1 on the various substrates, indicates an increased splashing threshold for lower substrate stiffness, which was expected and reported by Howland et al[38]. Furthermore, y2 allows calculating the required for dimple formation in substrates with known G. Doing so for G = 0.2 kPa, we find: = 6, indicating that all the generated jets within our experimental conditions would cause dimple formation on such substrates. Finally, y3 allows estimating the required to cause plastic deformation in materials with varying G. For a 40 m jet diameter to create plastic deformation and inject into substrates of G = 65 kPa (2 agarose), should 92 m/s. Furthermore, to create elastic deformation for G = 0.2 kPa (0.125 agarose) this corresponds to 60, which would give = 8.3 m/s for = 40 m. Unfortunately, verifying this experimentally would involve exploring new chip designs, able of generating lower velocity jets, which is out of scope for this paper.
Baxter et al., studied jet delivery efficiency in skin samples with different stiffness, which can be used to compare our findings[31]. For = 53000 and G = 500 kPa they report 6 delivery efficiency, indicating a high rate of elastic material response and little deformation, i.e. close to the threshold of elastic/plastic deformation. Applying y3 for G = 0.5 MPa, gives = 39100 as a threshold value for plastic deformation, which is 25 lower than 53000. Furthermore, for = 53000 the storage modulus at the threshold is G = 0.72 MPa, which in the same order of magnitude of the stiffest skin sample they injected (G = 0.96 MPa). Thus, our model matches Baxter et al. observations on the skin, validating our findings for a larger range of materials.
Injection depth dependency
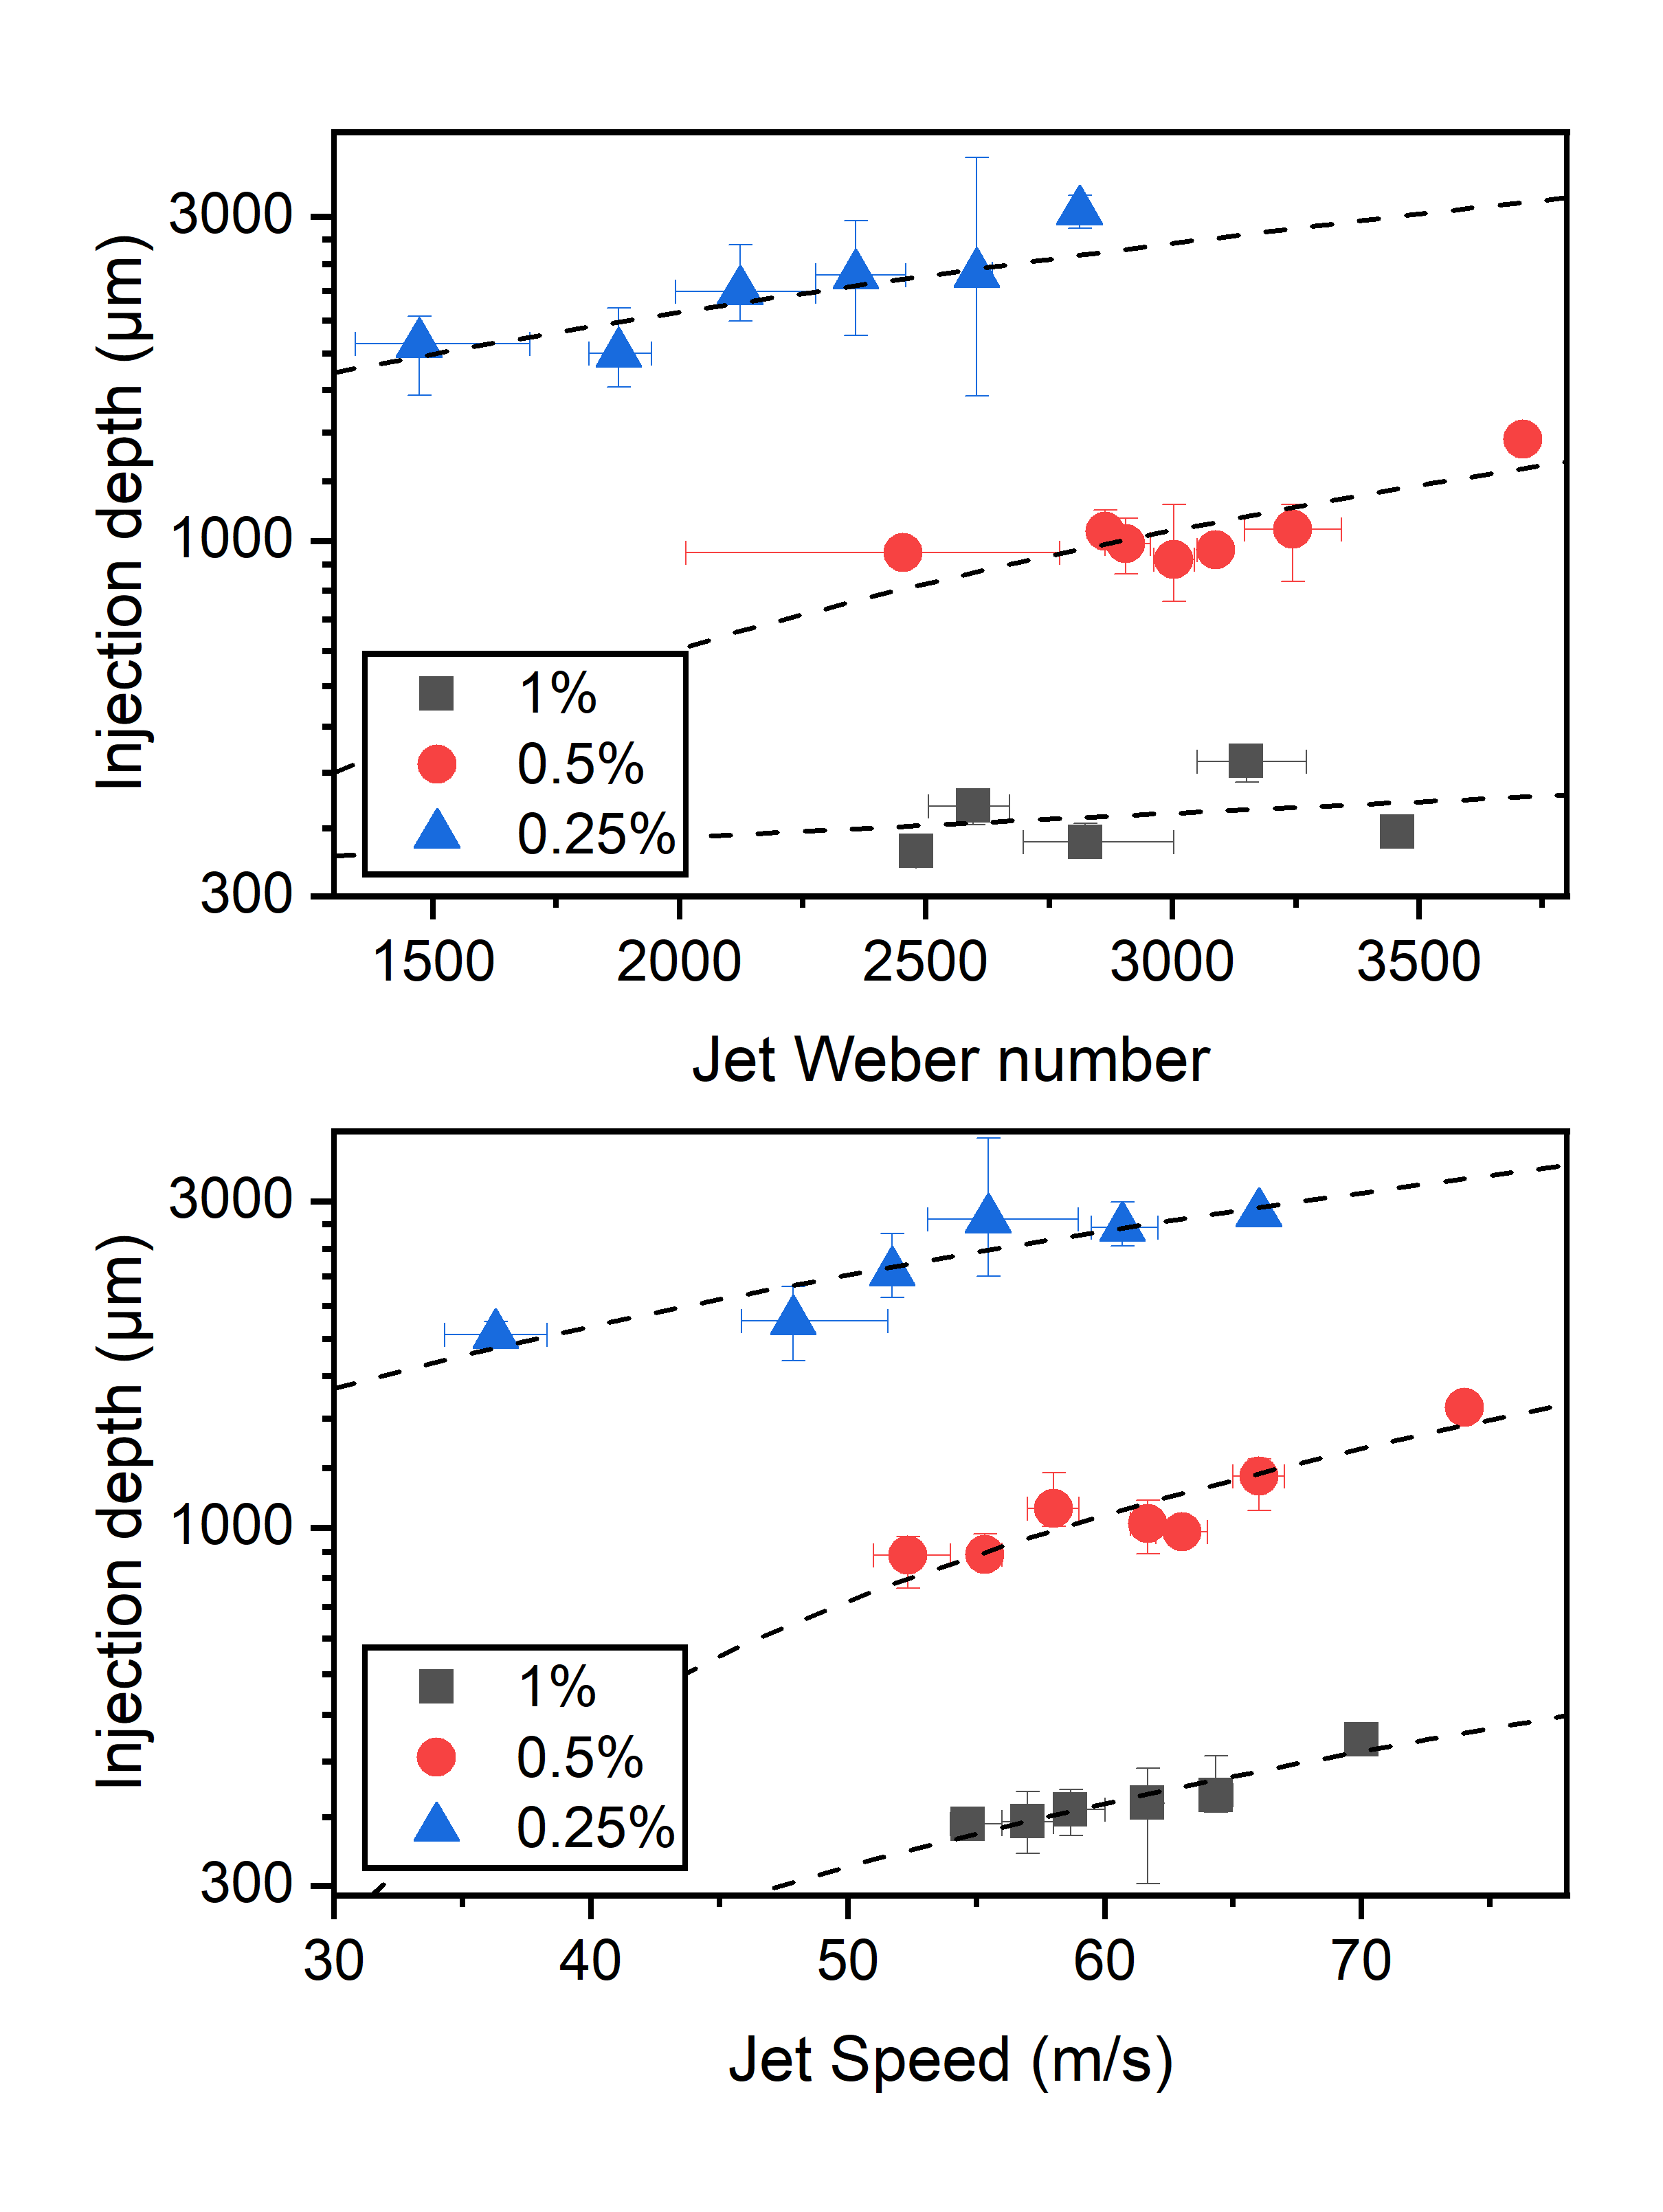
The Regimes we introduced in the previous section can assist in performing microfluidic jet injections where splash-back and partial ejection of the fluid is undesired. However, to further optimize our system, a reliable dependence of jet characteristics on injection depth ( ) and the dispersion in skin is needed. In Figure 10 we show in terms of (top) and (bottom). We note that is a better predictor for compared to , as it shows a higher correlation to a linear fit, especially for 1 agarose (R² = 0.8819 versus R² = 0.1015) and 0.5 agarose (R² = 0.8349 versus R² = 0.6453). A linear relationship between and was previously reported[15, 30, 31]. In contrast, for and , there is no reported linear relationship. The poor correlation coefficient of with is because depends on both and . Therefore, the same can result in jets with different . For example, a jet with four times larger than another jet, their velocity would be different by a factor of two.
To inject in substrates with G 3.5 kPa, jets with high ( 2500), caused by high and low , are required to deform the surface. Such jets have a higher impact pressure due to their low surface area compared to high , resulting from average , yet high . Our observations align with previous studies of liquid jets impacting on liquid pools, where did not influence the final cavity depth, but the jet momentum did[69]. Therefore, we conclude that better predicts as compared to .
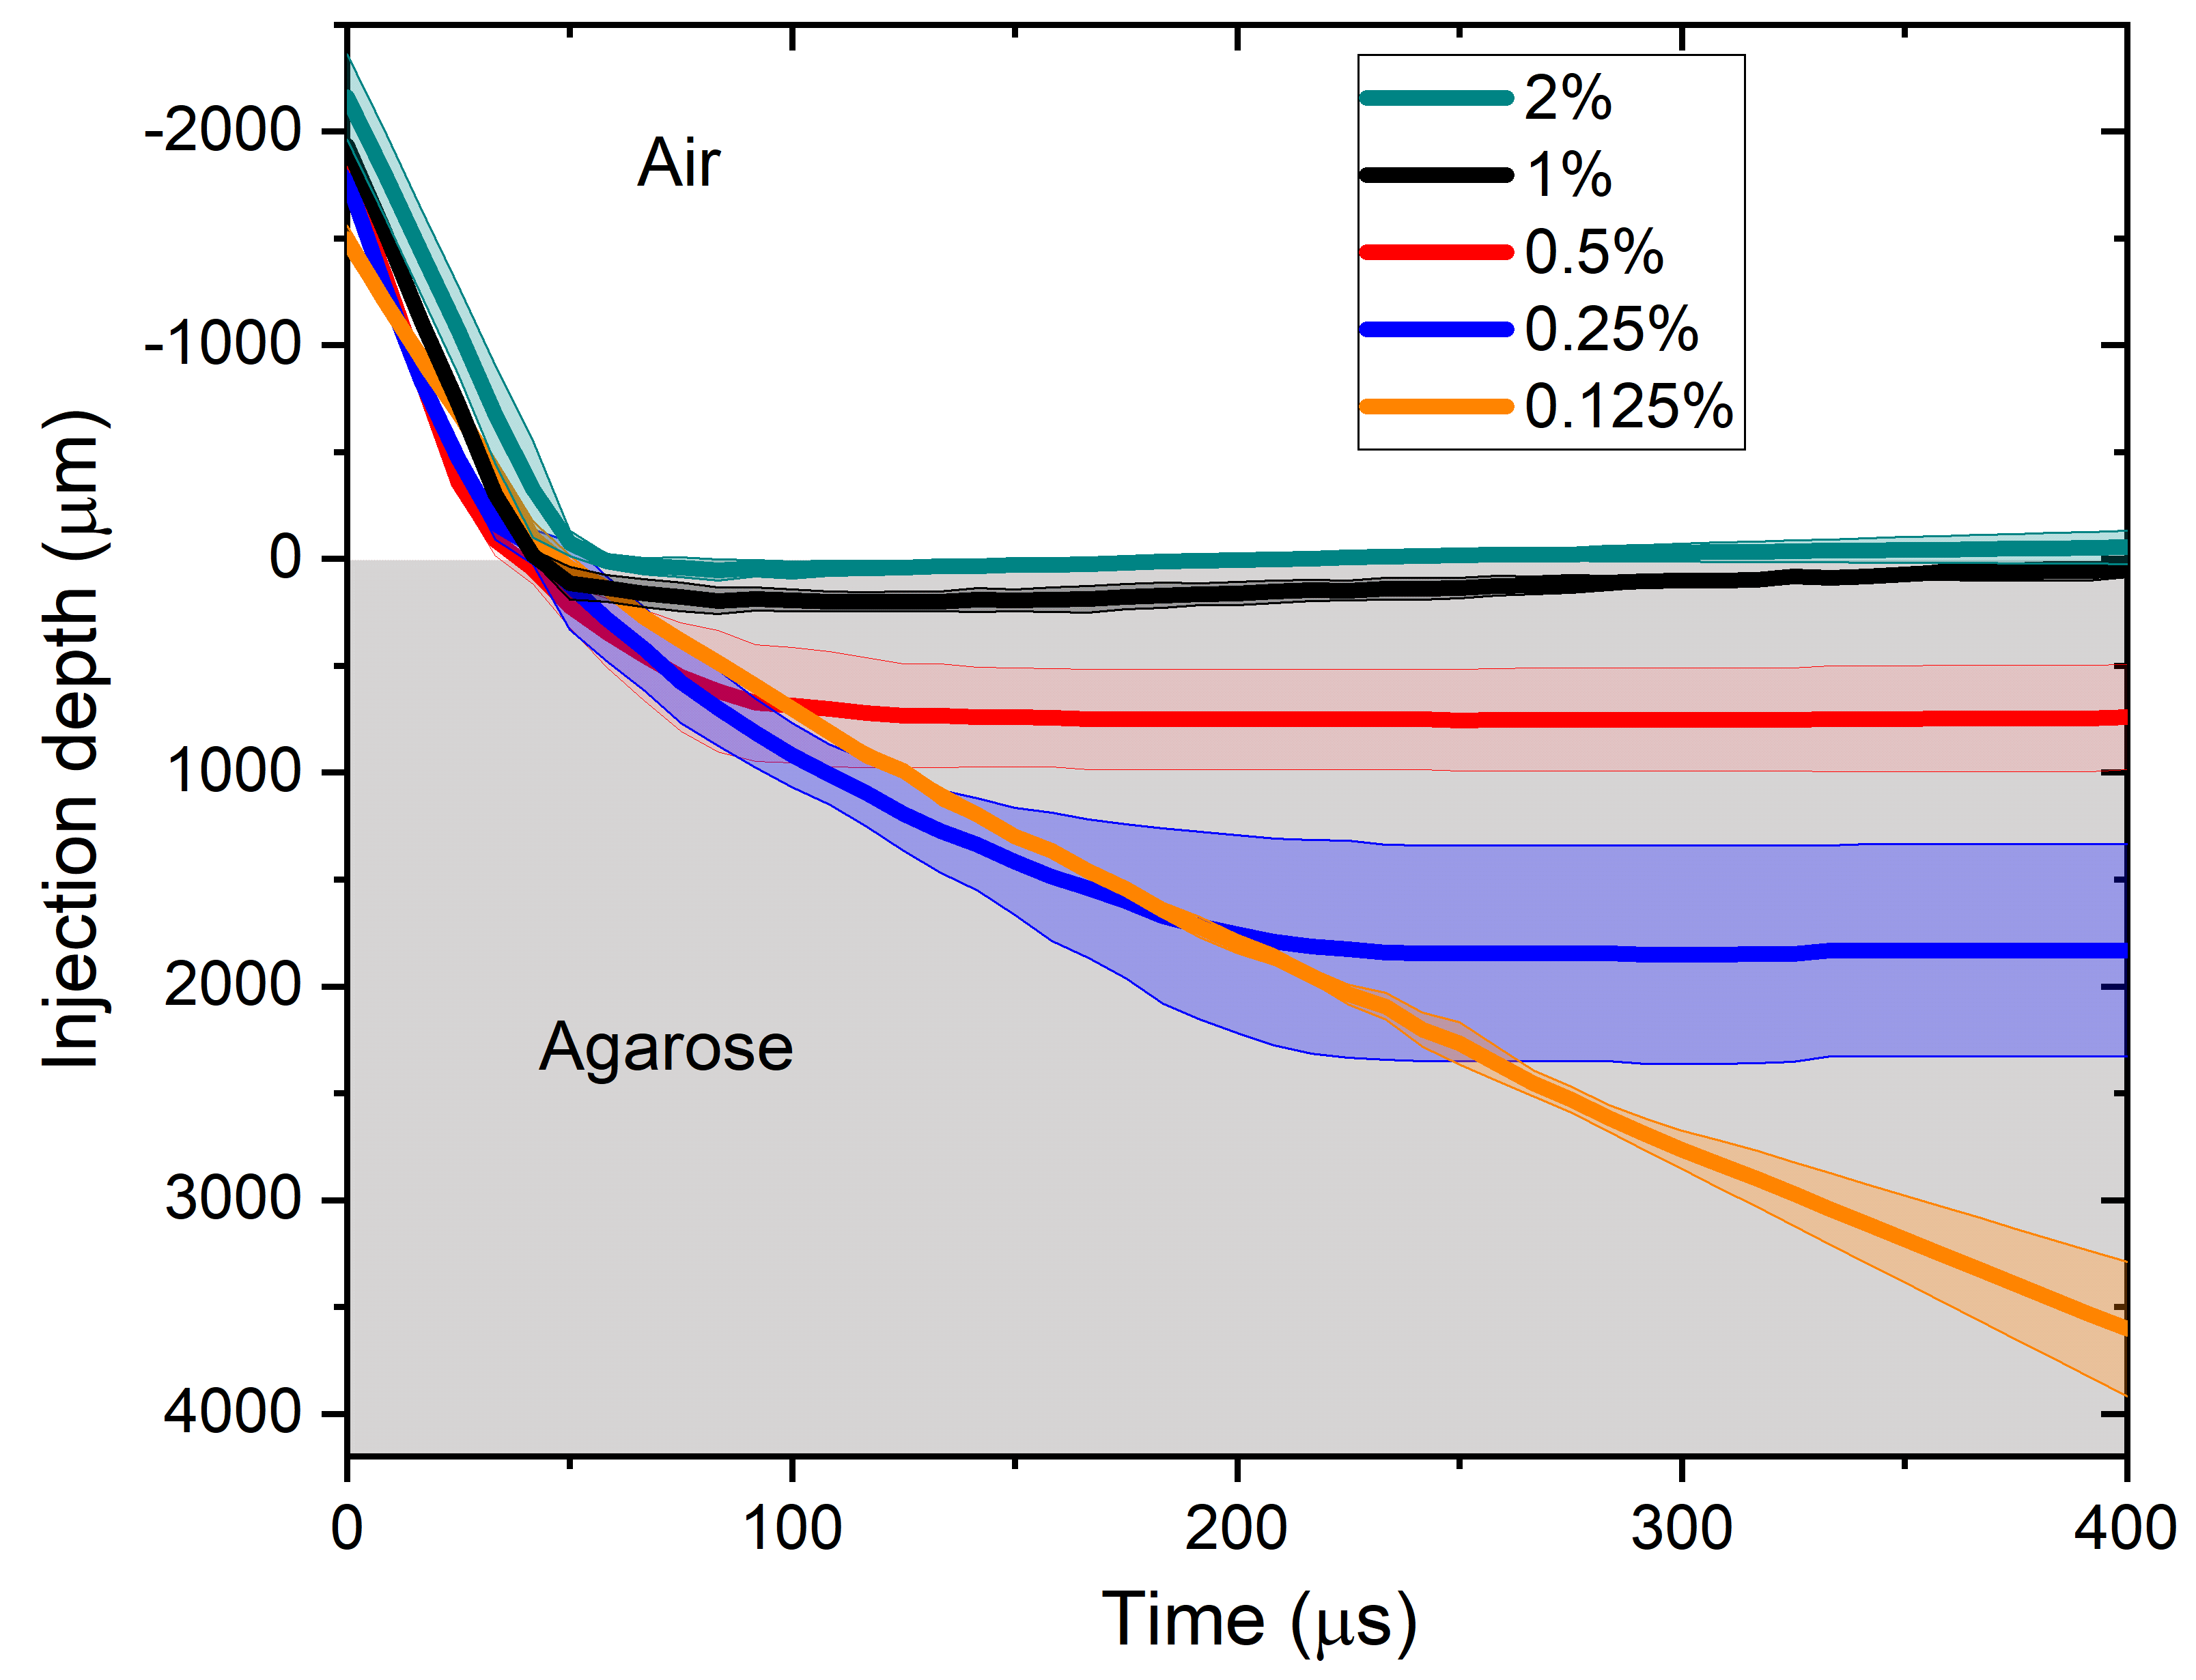
Figure 11 shows the evolution of the injection depth in time for different agarose concentrations. Prior to impact, 58 ± 11 m/s for all the experiments. The jet decelerates after impact onto the agarose gel surface. This deceleration increases with the concentration of agarose. For example, in agarose 2 the jet velocity in its traveling direction is 0 m/s as soon as it contacts the gel at t 60 s. In contrast, for agarose 0.125, the velocity of the jet in the cavity is 1/2 remains almost constant until t 400 s.
IV Conclusions
We studied the impact of liquid microjets with a wide range of diameters (35 - 120 m) and speeds (7 - 70 m/s), on substrates with a shear modulus between 0.2 kPa - 26 GPa. Seven distinct regimes were identified based on the jet Weber number (70 - 4000) and substrate stiffness: 1) Jet spreading, 2) Jet splashing, 3) Surface defeat, 4) Splash, injection and squeeze-out, 5) Splashing and injection, 6) Clean injection without splashing, and 7) splashing substrate (no jet splashing).
These findings allowed us to calculate the thresholds between spreading and splashing, the threshold for dimple formation and the threshold between elastic and plastic material deformation. These thresholds can be used to predict the Weber number necessary to make a jet injection into a substrate of a known storage modulus. This result is especially relevant for needle-free injections as skin storage modulus differs between people or regions of the body. Additionally, understanding how jet Weber number relates to splashing and squeeze-out can help optimize liquid jet injections by reducing both phenomena.
We found that jet velocity is a better predictor for the injection depth compared to the Weber number, especially for the higher agarose percentages, as the Weber number depends on both jet velocity and diameter. To deform substrates with G 3.5 kPa, high impact pressure is required that is only provided by jets with high velocity and small diameter.
Although agarose gels cover the same shear modulus range as skin, they lack the complex elements of skin that cause the complex mechanical behaviour, and therefore it should be verified how the witnessed phenomenon in agarose and glass relate to skin. Future work could also be aimed at increasing the range of jet velocities to expand the regime map, and verify to what extent our calculated thresholds have predictive value over skin samples with varying shear moduli.
Competing interest
D.F.R. is co-founder of FlowBeams at the University of Twente, a spin-off company working on needle-free injections. D.M. is Nanovea regional Europe manager. Nanovea is a company that designs and manufactures instruments for materials testing.
Declaration of Competing interest
The authors declare that they have no known competing financial interests or personal relationships that could have appeared to influence the work reported in this paper.
Acknowledgements.
The authors acknowledge the funding from the European Research Council (ERC) under the European Union’s Horizon 2020 Research and Innovation Programme (Grant Agreement No. 851630), and NWO Take-off phase 1 program funded by the Ministry of Education, Culture and Science of the Government of the Netherlands (No. 18844). The authors would like to thank J.J. Schoppink for both the contact angle measurements and discussions. The authors are thankful for the insightful discussions with K. Mohan and S. Schlautmann.Appendix A Agarose Young’s modulus determination
The Youngs’ modulus of the lower agarose concentrations (0.125 and 0.25%) was calculated using the trend of the first tree samples, as depicted in Figure 12. For 0.5, 1 and 2% the stiffness was 195.09 ± 23.29, 43.31 ± 1.42 and 10.57 ± 0.79 KPa, measured using indentations as described in the experimental section. The relation between stiffness and agarose concentration was determined to be: using an exponential fit, which was used to calculate the stiffness of 0.125 and 0.25%, being 0.6 and 2.4 KPa respectively.
References
- [1] W. H. Organization, Safety of injections: Global facts and figures, https://www.who.int/teams/integrated-health-services/infection-prevention-control, accessed 15-04-2022.
- [2] Bloomberg, The bloomberg covid-19 vaccine tracker, https://github.com/BloombergGraphics/covid-vaccine-tracker-data, accessed 12-06-2022.
- Padmanabhan and Barik [2019] K. Padmanabhan and D. Barik, Energy from Toxic Organic Waste for Heat and Power Generation, edited by D. Barik, Woodhead Publishing Series in Energy (Woodhead Publishing, 2019) pp. 99–118.
- Alvim-Ferraz and Afonso [2003] M. C. M. Alvim-Ferraz and S. A. V. Afonso, Incineration of different types of medical wastes: Emission factors for particulate matter and heavy metals, Environmental Science Technology 37, 3152 (2003).
- Alifariki et al. [2020] L. O. Alifariki, A. Kusnan, Asriati, I. M. C. Binekada, S. Susanty, Sukurni, W. S. Hajri, I. M. Afrini, and Y. Syam, Safe injection practices and the incident of needle stick injuries (nsis), Enfermería Clínica 30, 73 (2020).
- Hauri et al. [2004] A. M. Hauri, G. L. Armstrong, and Y. J. Hutin, The global burden of disease attributable to contaminated injections given in health care settings, Int J STD AIDS 15, 7 (2004).
- Wright et al. [2009] S. Wright, M. Yelland, K. Heathcote, S. K. Ng, and G. Wright, Fear of needles-nature and prevalence in general practice, Aust Fam Physician 38, 172 (2009).
- Orenius et al. [2018] T. Orenius, LicPsych, H. Säilä, K. Mikola, and L. Ristolainen, Fear of injections and needle phobia among children and adolescents: An overview of psychological, behavioral, and contextual factors, SAGE Open Nurs 4, 2377960818759442 (2018).
- McLenon and Rogers [2019] J. McLenon and M. A. Rogers, The fear of needles: A systematic review and meta-analysis, Journal of Advanced Nursing 75, 30 (2019).
- Love and Love [2021] A. S. Love and R. J. Love, Considering needle phobia among adult patients during mass covid-19 vaccinations, Journal of Primary Care and Community Health 12, 21501327211007393 (2021).
- Schoppink and Fernandez Rivas [2022] J. Schoppink and D. Fernandez Rivas, Jet injectors: Perspectives for small volume delivery with lasers, Advanced Drug Delivery Reviews 182, 114109 (2022).
- Mitragotri [2006] S. Mitragotri, Current status and future prospects of needle-free liquid jet injectors, Nat Rev Drug Discov 5, 543 (2006).
- Baxter and Mitragotri [2006] J. Baxter and S. Mitragotri, Needle-free liquid jet injections: mechanisms and applications, Expert Review of Medical Devices 3, 565 (2006).
- Schramm-Baxter and Mitragotri [2004] J. R. Schramm-Baxter and S. Mitragotri, Investigations of needle-free jet injections, Conf Proc IEEE Eng Med Biol Soc 2004, 3543 (2004).
- Krizek et al. [2020] J. Krizek, P. Delrot, and C. Moser, Repetitive regime of highly focused liquid microjets for needle-free injection, Scientific Reports 10, 5067 (2020).
- Arora et al. [2007] A. Arora, I. Hakim, J. Baxter, R. Rathnasingham, R. Srinivasan, D. A. Fletcher, and S. Mitragotri, Needle-free delivery of macromolecules across the skin by nanoliter-volume pulsed microjets, Proceedings of the National Academy of Sciences 104, 4255 (2007).
- Römgens et al. [2016] A. M. Römgens, D. Rem-Bronneberg, R. Kassies, M. Hijlkema, D. L. Bader, C. W. J. Oomens, and M. P. B. van Bruggen, Penetration and delivery characteristics of repetitive microjet injection into the skin, Journal of Controlled Release 234, 98 (2016).
- Gálvez et al. [2020] L. O. Gálvez, A. Fraters, H. L. Offerhaus, M. Versluis, I. W. Hunter, and D. F. Rivas, Microfluidics control the ballistic energy of thermocavitation liquid jets for needle-free injections, Journal of Applied Physics 127, 104901 (2020).
- Gupta et al. [2011] J. Gupta, S. S. Park, B. Bondy, E. I. Felner, and M. R. Prausnitz, Infusion pressure and pain during microneedle injection into skin of human subjects, Biomaterials 32, 6823 (2011).
- Glenn and Kenney [2006] G. M. Glenn and R. T. Kenney, Mass vaccination: solutions in the skin, Curr Top Microbiol Immunol 304, 247 (2006).
- Prausnitz and Langer [2008] M. R. Prausnitz and R. Langer, Transdermal drug delivery, Nature Biotechnology 26, 1261 (2008).
- Zhang et al. [2019] Y. Zhang, J. Yu, A. R. Kahkoska, J. Wang, J. B. Buse, and Z. Gu, Advances in transdermal insulin delivery, Advanced Drug Delivery Reviews 139, 51 (2019).
- Mercuri and Fernandez Rivas [2021] M. Mercuri and D. Fernandez Rivas, Challenges and opportunities for small volumes delivery into the skin, Biomicrofluidics 15, 011301 (2021).
- Graham et al. [2019] H. K. Graham, J. C. McConnell, G. Limbert, and M. J. Sherratt, How stiff is skin?, Experimental Dermatology 28, 4 (2019).
- van Kuilenburg et al. [2012] J. van Kuilenburg, M. A. Masen, and E. van der Heide, Contact modelling of human skin: What value to use for the modulus of elasticity?, Proceedings of the Institution of Mechanical Engineers, Part J: Journal of Engineering Tribology 227, 349 (2012).
- Rohilla et al. [2020] P. Rohilla, I. Lawal, A. Le Blanc, V. O’Brien, C. Weeks, W. Tran, Y. Rane, E. Khusnatdinov, and J. Marston, Loading effects on the performance of needle-free jet injections in different skin models, Journal of Drug Delivery Science and Technology 60, 102043 (2020).
- Crichton et al. [2013] M. L. Crichton, X. Chen, H. Huang, and M. A. F. Kendall, Elastic modulus and viscoelastic properties of full thickness skin characterised at micro scales, Biomaterials 34, 2087 (2013).
- Joodaki and Panzer [2018] H. Joodaki and M. Panzer, Skin mechanical properties and modeling: A review, Proceedings of the Institution of Mechanical Engineers, Part H: Journal of Engineering in Medicine 232, 095441191875980 (2018).
- Pan et al. [2019] S. Pan, D. Malhotra, and N. Germann, Nonlinear viscoelastic properties of native male human skin and in vitro 3d reconstructed skin models under laos stress, Journal of the Mechanical Behavior of Biomedical Materials 96, 310 (2019).
- Tagawa et al. [2013] Y. Tagawa, N. Oudalov, A. E. Ghalbzouri, C. Sun, and D. Lohse, Needle-free injection into skin and soft matter with highly focused microjets, Lab on a Chip 13, 1357 (2013).
- Baxter and Mitragotri [2005] J. Baxter and S. Mitragotri, Jet-induced skin puncture and its impact on needle-free jet injections: Experimental studies and a predictive model, Journal of Controlled Release 106, 361 (2005).
- Schramm-Baxter et al. [2004] J. Schramm-Baxter, J. Katrencik, and S. Mitragotri, Jet injection into polyacrylamide gels: investigation of jet injection mechanics, J Biomech 37, 1181 (2004).
- Simmons et al. [2019] J. A. Simmons, J. Davis, J. Thomas, J. Lopez, A. Le Blanc, H. Allison, H. Slook, P. Lewis, J. Holtz, P. Fisher, K. E. Broderick, and J. O. Marston, Characterization of skin blebs from intradermal jet injection: Ex-vivo studies, Journal of Controlled Release 307, 200 (2019).
- Gilet and Bourouiba [2015] T. Gilet and L. Bourouiba, Fluid fragmentation shapes rain-induced foliar disease transmission, Journal of The Royal Society Interface 12, 20141092 (2015).
- Gregory et al. [1959] P. H. Gregory, E. J. Guthrie, and M. E. Bunce, Experiments on splash dispersal of fungus spores, Microbiology 20, 328 (1959).
- Yarin [2006] A. Yarin, Drop impact dynamics: Splashing, spreading, receding, bouncing…, Annual Review of Fluid Mechanics 38, 159 (2006).
- Josserand and Thoroddsen [2016] C. Josserand and S. Thoroddsen, Drop impact on a solid surface, Annual Review of Fluid Mechanics 48, 365 (2016).
- Howland et al. [2016] C. J. Howland, A. Antkowiak, J. R. Castrejón-Pita, S. D. Howison, J. M. Oliver, R. W. Style, and A. A. Castrejón-Pita, It’s harder to splash on soft solids, Physical Review Letters 117, 184502 (2016).
- Mohammad Karim [2020] A. Mohammad Karim, Experimental dynamics of newtonian and non-newtonian droplets impacting liquid surface with different rheology, Physics of Fluids 32, 043102 (2020).
- Vega and Castrejón-Pita [2017] E. J. Vega and A. A. Castrejón-Pita, Suppressing prompt splash with polymer additives, Experiments in Fluids 58, 57 (2017).
- López-Herrera et al. [2019] J. M. López-Herrera, S. Popinet, and A. A. Castrejón-Pita, An adaptive solver for viscoelastic incompressible two-phase problems applied to the study of the splashing of weakly viscoelastic droplets, Journal of Non-Newtonian Fluid Mechanics 264, 144 (2019).
- Quetzeri-Santiago et al. [2019a] M. A. Quetzeri-Santiago, A. A. Castrejón-Pita, and J. R. Castrejón-Pita, The effect of surface roughness on the contact line and splashing dynamics of impacting droplets, Scientific Reports 9, 15030 (2019a).
- Aboud and Kietzig [2015] D. G. K. Aboud and A.-M. Kietzig, Splashing threshold of oblique droplet impacts on surfaces of various wettability, Langmuir 31, 10100 (2015).
- Quetzeri-Santiago et al. [2019b] M. Quetzeri-Santiago, K. Yokoi, A. Castrejón-Pita, and R. Castrejon-Pita, Role of the dynamic contact angle on splashing, Physical Review Letters 122, 10.1103/PhysRevLett.122.228001 (2019b).
- Hao [2017] J. Hao, Effect of surface roughness on droplet splashing, Physics of Fluids 29, 122105 (2017).
- Mandre and Brenner [2012] S. Mandre and M. P. Brenner, The mechanism of a splash on a dry solid surface, Journal of Fluid Mechanics 690, 148 (2012).
- Sykes et al. [2022] T. C. Sykes, B. D. Fudge, M. A. Quetzeri-Santiago, J. R. Castrejón-Pita, and A. A. Castrejón-Pita, Droplet splashing on curved substrates, Journal of Colloid and Interface Science 615, 227 (2022).
- Usawa et al. [2021] M. Usawa, Y. Fujita, Y. Tagawa, G. Riboux, and J. M. Gordillo, Large impact velocities suppress the splashing of micron-sized droplets, Physical Review Fluids 6, 023605 (2021).
- Visser et al. [2012] C. W. Visser, Y. Tagawa, C. Sun, and D. Lohse, Microdroplet impact at very high velocity, Soft Matter 8, 10732 (2012).
- Visser et al. [2015] C. W. Visser, P. E. Frommhold, S. Wildeman, R. Mettin, D. Lohse, and C. Sun, Dynamics of high-speed micro-drop impact: numerical simulations and experiments at frame-to-frame times below 100 ns, Soft Matter 11, 1708 (2015).
- Qian et al. [2022] S. Qian, D. Z. Zhu, and H. Xu, Splashing generation by water jet impinging on a horizontal plate, Experimental Thermal and Fluid Science 130, 110518 (2022).
- Speirs et al. [2018] N. B. Speirs, Z. Pan, J. Belden, and T. T. Truscott, The water entry of multi-droplet streams and jets, Journal of Fluid Mechanics 844, 1084 (2018).
- Kittel et al. [2018] H. M. Kittel, E. Alam, I. V. Roisman, C. Tropea, and T. Gambaryan-Roisman, Splashing of a newtonian drop impacted onto a solid substrate coated by a thin soft layer, Colloids and Surfaces A: Physicochemical and Engineering Aspects 553, 89 (2018).
- Basso and Bostwick [2020] B. C. Basso and J. B. Bostwick, Splashing on soft elastic substrates, Langmuir 36, 15010 (2020).
- Rastopov and Sukhodolsky [1991] S. F. Rastopov and A. T. Sukhodolsky, Optical Radiation Interaction with Matter (SPIE???, 1991).
- Padilla-Martinez et al. [2014] J. P. Padilla-Martinez, C. Berrospe-Rodriguez, G. Aguilar, J. C. Ramirez-San-Juan, and R. Ramos-Garcia, Optic cavitation with cw lasers: A review, Physics of Fluids 26, 122007 (2014).
- Berrospe-Rodriguez et al. [2017] C. Berrospe-Rodriguez, C. W. Visser, S. Schlautmann, D. F. Rivas, and R. Ramos-Garcia, Toward jet injection by continuous-wave laser cavitation, J Biomed Opt 22, 1 (2017).
- [58] Schott, Technical details of mempax borosilicate glass, https://www.schott.com/en-my/products/mempax-p1000322/technical-details, accessed 15-04-2022.
- Normand et al. [2000] V. Normand, D. L. Lootens, E. Amici, K. P. Plucknett, and P. Aymard, New insight into agarose gel mechanical properties, Biomacromolecules 1, 730 (2000).
- Rioboo et al. [2001] R. Rioboo, M. Marengo, and C. Tropea, Outcomes from a drop impact on solid surfaces, ATOMIZATION AND SPRAYS 11, 155 (2001).
- Driscoll and Nagel [2011] M. M. Driscoll and S. R. Nagel, Ultrafast interference imaging of air in splashing dynamics, Physical Review Letters 107, 154502 (2011).
- Riboux and Gordillo [2014] G. Riboux and J. M. Gordillo, Experiments of drops impacting a smooth solid surface: A model of the critical impact speed for drop splashing, Physical Review Letters 113, 024507 (2014).
- Trainer [2016] D. Trainer, Breakup length and liquid splatter characteristics of air-assisted water jets, International Journal of Multiphase Flow 81, 10.1016/j.ijmultiphaseflow.2016.02.005 (2016).
- Uth and Deshpande [2013] T. Uth and V. S. Deshpande, Unsteady penetration of a target by a liquid jet, Proceedings of the National Academy of Sciences 110, 20028 (2013).
- Ed-Daoui et al. [2019] A. Ed-Daoui, M. Benelmostafa, and M. Dahmani, Study of the viscoelastic properties of the agarose gel, Materials Today: Proceedings 13, 746 (2019).
- Salerno et al. [2010] M. Salerno, S. Dante, N. Patra, and A. Diaspro, Afm measurement of the stiffness of layers of agarose gel patterned with polylysine, Microscopy Research and Technique 73, 982 (2010).
- Kiyama et al. [2019] A. Kiyama, M. M. Mansoor, N. B. Speirs, Y. Tagawa, and T. T. Truscott, Gelatine cavity dynamics of high-speed sphere impact, Journal of Fluid Mechanics 880, 707 (2019).
- Shao et al. [2020] X. Shao, S. A. Fredericks, J. R. Saylor, and J. B. Bostwick, A method for determining surface tension, viscosity, and elasticity of gels via ultrasonic levitation of gel drops, The Journal of the Acoustical Society of America 147, 2488 (2020).
- Kroeze [2022] T. Kroeze, Direct numerical simulations of microfluidic jets, Master Thesis, University of Twente, The Netherlands (2022).