The DarkSide Collaboration
Search for low-mass dark matter WIMPs with 12 ton-day exposure of DarkSide-50
Abstract
We report on the search for dark matter WIMPs in the mass range below 10 GeV/c2, from the analysis of the entire dataset acquired with a low-radioactivity argon target by the DarkSide-50 experiment at LNGS. The new analysis benefits from more accurate calibration of the detector response, improved background model, and better determination of systematic uncertainties, allowing us to accurately model the background rate and spectra down to 0.06 keVer. A 90% C.L. exclusion limit for the spin-independent cross section of 3 GeV/c2 mass WIMP on nucleons is set at 610-43 cm2, about a factor 10 better than the previous DarkSide-50 limit. This analysis extends the exclusion region for spin-independent dark matter interactions below the current experimental constraints in the GeV/c2 WIMP mass range.
I Introduction
In the last decade, the noble-liquid dual-phase time projection chamber (TPC) has emerged as leading detection technology in the search for Weakly Interacting Massive Particles (WIMPs) [1, 2, 3, 4], among the best-motivated dark matter candidates [5], with mass above 10 GeV/c2. The strengths of this approach are the intrinsic radiopurity and scalability of the target, and the accurate topological reconstruction of interacting particles by detection of both scintillation and ionization signals.
Such detectors also exhibit world class sensitivity in the search for light dark matter candidates, such as GeV/c2 mass scale WIMPs [6, 7, 8, 9, 10] and Axion-Like Particles (ALPs) [11, 12, 13] when exploiting the ionization signal alone to reach detection thresholds in the keV range. Although the scintillation signal is no longer observable in this regime, dual-phase TPCs drift and extract single ionization electrons in gas with near 100% efficiency [14]. Electron signal is then amplified in gas by a factor up to 20 [6] exploiting electroluminescence, generated in the transit of charged particles in the gas phase under a strong electric field. This amplification guarantees the possibility to trigger on single electron signals and centimeter level resolution in the reconstruction of the interaction position on the plane orthogonal to the electric field. Finally, multi-site signals corresponding to multiple scattering particles, not compatible with those induced by dark matter, are efficiently rejected [15, 8, 6].
Liquid argon (LAr) and xenon detectors have fairly similar performance in terms of ionization yield. However, because of the lower atomic mass, low-mass WIMP scattering off argon produces more energetic recoils, with a higher probability of being detected above the threshold. This compensates for the lower cross section in argon compared to xenon and makes DarkSide-50 the most sensitive experiment to date to WIMP interactions in the [1.8, 3.0] GeV/c2 mass range, with a fiducial LAr target of only 20 kg [6].
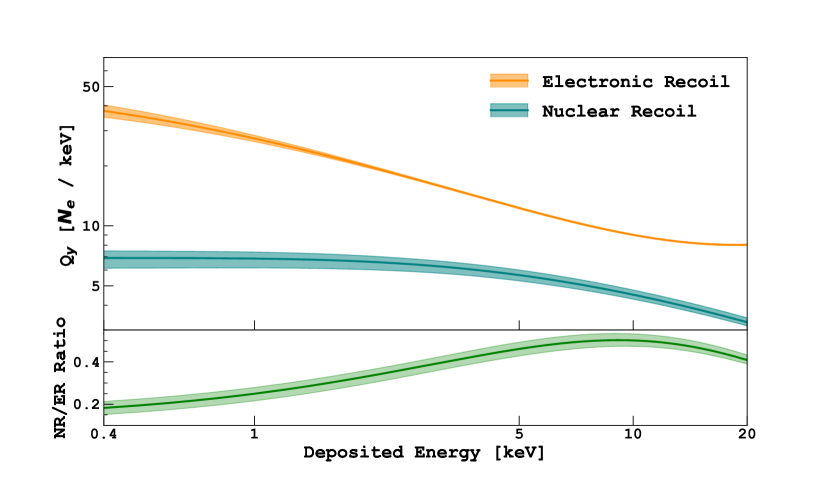
Recently, the DarkSide-50 Collaboration re-analyzed data from calibration campaigns with radioactive sources and measured, with high-accuracy, the LAr ionization response (Qy), shown in Fig. 1, to electron (ER) and nuclear (NR) recoils down to a few hundred electron-volts [16]. This measurement represents the first step of a comprehensive re-analysis of the entire DarkSide-50 data-set to provide improved constraints on low-mass WIMP-nucleon interactions. In this work, we present an improved data selection that, together with a more accurate background model, greatly impact the experimental constraints on low-mass WIMP from the DarkSide-50 experiment. Other elements of the re-analysis are an improved detector response model and a refined treatment of systematics into the statistical analysis, discussed in detail in the next sections.
II Detector
The DarkSide-50 experiment operated between 2013 and 2019 in the Hall C of the Gran Sasso National Laboratory (LNGS) in Italy. The first data-taking campaign ran from November 2013 to April 2015 with an atmospheric argon (AAr) target, then replaced with low-radioactivity argon extracted from deep underground (from now on named underground argon), with reduced activity of cosmogenic isotopes [19]. The TPC active mass is 46.40.7 kg. The uncertainty on the active mass is primarily due to the thermal contraction of the polytetrafluoroethylene (PTFE), which defines the TPC cylindrical volume. The PTFE sidewalls are surrounded by field shaping copper rings. These provide a uniform 200 V/cm electric field in the liquid bulk. Two arrays of 19 3” diameter photomultiplier tubes (PMTs), installed at both ends of the TPC behind transparent anode and cathode windows, observe light from scintillation in the liquid (S1) and from the electroluminescence in the gas (S2). Electroluminescence occurs when ionization electrons, after being drifted across the liquid bulk, are extracted with a 2.8 kV/cm electric field in the gas phase, and here drifted thanks to a 4.2 kV/cm electric field. All the inner surfaces of the TPC are coated with tetraphenyl butadiene (TPB), a wavelength shifter that absorbs 128 nm photons from argon de-excitation and re-emits photons, whose wavelengths are peaked at 420 nm. More details about the TPC are reported in ref. [20, 19].
The TPC is hosted inside a 120 l double-wall cryostat and is shielded by a liquid scintillator and a water Cherenkov detector against neutrons and cosmic muons, respectively. All three detectors are read out upon a trigger from the TPC that requires at least two PMTs above a threshold of 0.6 photoelectrons in coincidence within 100 ns [21].
III Data selection
The dataset reported in this paper consists of 653.1 live-days of underground argon data, taken from December 12, 2015, to February 24, 2018, with an average trigger rate of 1.54 Hz.
WIMPs may eventually scatter only once in the LAr target because of the extremely low cross section. Since each particle interaction is associated with an S2 pulse, only events with a single S2 pulse are considered for this analysis. Given the low-energy regime and the low detection efficiency of S1 photons (0.160.01 [22]), not all of these events have an associated S1 pulse. Therefore, selected events are divided into two categories, depending on whether they have one (S2-only) or two pulses (S1 and S2). The only exception is made in the presence of “echoes”, i.e. electrons extracted by S1 or S2 128 nm photons from the cathode, via photoelectric effect [23]. Events with echoes are efficiently identified by looking at the time coincidence between the echo and the pulse that induced it, equals to the maximum drift time (376 s) [23].
The DarkSide-50 position reconstruction algorithm on the plane orthogonal to the electric field is inefficient at the keV scale, the region of interest for this analysis. For this reason, the event position is here defined as the position of the top-array PMT observing the largest fraction of S2 photons. Based on this definition, events selected by the outermost ring of PMTs are discarded as they fall in the volume most exposed to external radioactive contamination. The signal acceptance111From now on, the term acceptance will be referred to as signal acceptance. of this cut corresponds to 41.9% of the entire volume, and was probed to be independent on the size of the S2 pulse with Monte Carlo simulations [22]. More details on this volume fiducialization can be found in ref. [16].
The measured S2 yield, defined as the mean number of photoelectrons per ionization electron extracted in the gas pocket, is 231 pe/e-, for events localized beneath the central PMT [6]. The radial dependence of the S2 yield, already discussed in ref. [22], is here corrected to the value at the center of the TPC, using a correction map extracted from 83mKr calibration data [16]. The energy observable used in this analysis is the number of detected electrons, , defined as the corrected number of S2 photoelectrons divided by the S2 yield222In case of ERs, the number of electrons is the sum of primary and ionization electrons.. The energy range of interest for this analysis is defined from 4 to 170 , corresponding to [0.06, 21] keVer ([0.6, 288] keVnr) in the ER (NR) energy scale. The upper limit is defined up to where the energy scale calibrations have been validated. The trigger efficiency is estimated at 100% in the full range of interest [6]. The lower bound of the region of interest is chosen in order to avoid contamination from spurious ionization electrons trapped by trace impurities and then released, as discussed later.
The data selection relies on two classes of cuts: quality cuts, defined to reject pulse pile-ups, and selection cuts, to remove spurious electrons, alpha-induced events, and events with an anomalous start time. Cut efficiencies and acceptances are estimated either via Monte Carlo or on the AAr sample. The latter is dominated by 39Ar, whose activity is three orders of magnitude higher than the underground argon (UAr) campaign event rate. AAr is an optimal calibration sample since 39Ar -decays are detected as single-sited interactions, like the signature expected from dark matter interactions.
III.1 Quality cuts
S1 and S2 pulses are identified with a fixed threshold on the overall waveform obtained by summing all individual waveform as described in ref. [20]. S2 pulses are distinguished from S1 ones by requiring , the fraction of light observed in the first 90 ns, to be less than 0.1. This cut has been checked on Monte Carlo simulation to be full efficiency already for signals equivalent to 4 .
The S2 sample selected by 0.1 may however contain a fraction of events where the signal is actually composed by several pulses overlapping in time. A series of “quality” cuts, based on the time profile and topological distribution of S2 photons, were then implemented to reject such contamination.
The first quality cut requires that the identified S2 pulse is contained in 100 s. Signals longer than 100 s are associated to events with overlapping pulses, which are not resolved by the pulse finder algorithm.
Other events with unresolved overlapping pulses are rejected by looking at the S2 pulse peak time, the time when the pulse reaches its maximum amplitude relative to the pulse start time. Electron diffusion in LAr along the drift increases the longitudinal size of the drifting ionization cloud. This induces longer S2 signals for events near the cathode, with a higher probability that two distinct but nearby energy deposits are merged in the reconstruction. When this happens, the superposition of signals produces an S2 pulse with a peak time that is delayed compared with single scattering events. Requiring the S2 peak time to be less than 6 s reduces this background component.
Pile-up of S1 and S2 pulses are due to the pulse finder algorithm being unable to separate two pulses closer than 2 s. This condition occurs approximately within 2 mm from the grid, about 0.5% of the entire volume. These events are rejected if the peak time of the S2 pulse is less than 200 ns or if the FWHM is less than 100 ns. The acceptance is estimated at 99.750.25%.
In the LAr volume below 2 mm from the grid, the combined acceptance of the S2 peak time, S2 FWHM, and S2 gate cuts is estimated via Monte Carlo at 95 at 4 and 100 at equal to or larger than 15 .
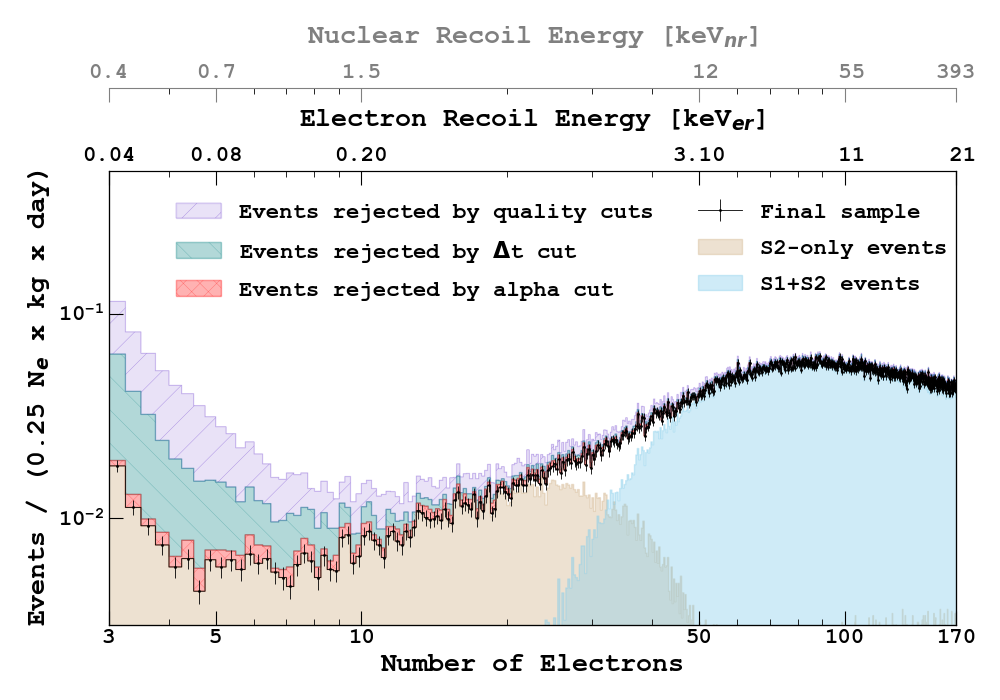
The impact of the quality cuts on the ionization electron spectrum is shown in Fig. 2.
Some of the S2-only pulses are observed with an anomalous pulse start time, preceding the trigger time by several microseconds. The probability that the photons from the tail of a S2 pulse trigger the detector is estimated by means of electronics simulation [22] and event reconstruction and decreases as decreases. At 3 e-, at the low threshold of the region of interest, the probability that S2 pulses trigger the detector after 1 s (1.8 s) from the start time of the pulse itself is less than 1% (0.1%), while we observe events with start time by up to 7 s, preceding the trigger time. A selection on S2 pulse start time was designed on the simulated sample to reject such events from the S2-only sample, while keeping 99% acceptance constant as a function of .
III.2 Selection cuts
The sample resulting from the quality cuts is contaminated by two classes of background events, appropriately rejected by the optimized selection cuts. The first category corresponds to spurious ionization electrons trapped along their drift by trace impurities or at the liquid surface and released with delays of up to hundreds of milliseconds. These produce signals equivalent to up to a few electrons, as discussed in ref. [6].
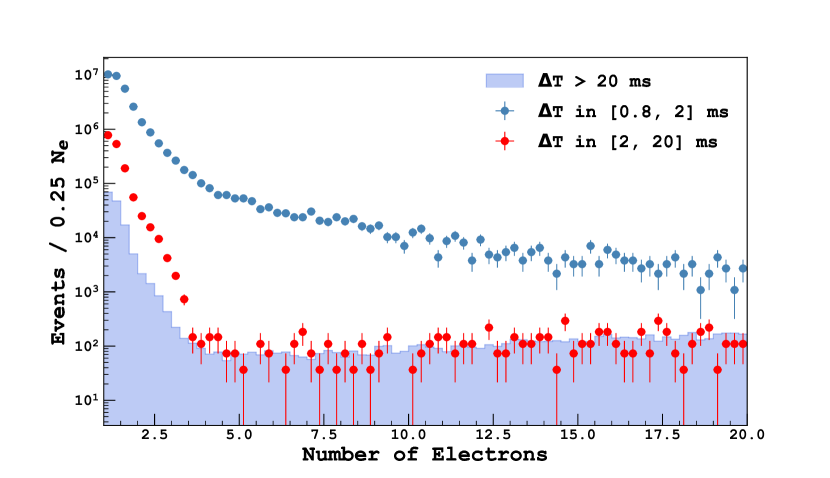
A veto of 20 ms from after each event triggering the DAQ is implemented to suppress such contribution, exploiting the time correlation with the preceding event. This cut extends the one of 2 ms used in the 2018 analysis [6], introduces a deadtime of 3%, evaluated from the rate of uncorrelated events, fitted from the distribution of the event time differences.
Figure 3 shows a comparison of spectra of the event rejected by the veto cut and the remaining events normalized to livetime. A significant suppression of low events is obtained after veto. Remaining background is from spurious electron with longer time delay (T) and from a component of this background without a clear time correlation with previous events. The spectra for samples selected with T in [2, 20] ms and 20 ms are in agreement above 4 , indicating that the contribution of spurious electrons is negligible in the analysis range. In addition, the probability of a single-scatter event being misidentified as multiple-scatters one due to the fast re-emission of a spurious electron was estimated to be negligible.
A second class of backgrounds is associated to events characterized by a large S1, paired with an anomalously low S2 pulse. Their origin has been traced to particles generated inside the TPC walls, at shallow depth near the interface with the LAr bulk. The induced ionization electrons are absorbed by the walls themselves but scintillation photons may extract additional electrons from the cathode by photoelectric effect. To reject these events, we developed a specific cut affecting the S1+S2 sub-sample only, tuned on calibration data. The cut is built by fitting with a normal distribution log10(S2/S1), for each slice of log10(S1), and removing events below and above 2.58 from the mean, corresponding to 99% acceptance.
The overall acceptance from both the quality and the selection cuts, almost flat with respect to the recoil energy, varies from 38% at 4 e- to 40% at 15 e-. The selection uncertainties estimated through Monte Carlo are negligible compared to that on fiducial volume, discussed later in Section V.
The final sample is shown in Fig. 2. The S2-only sample is distributed in the energy region where most of the signal is expected, while the S1+S2 sample, distributed at the higher energies because of the S1 detection threshold, is key in constraining the background model discussed in the next section. The combined sample contains about 350,000 events and corresponds to a fiducial volume exposure, including the spurious electron veto, of 12306 kg d. The current dataset livetime is about 80% larger than the one used in the 2018 analyses, which included data up to April 2017 [6]
IV Background model
The event rate in the energy range of interest for light dark matter search is dominated by 39Ar and 85Kr decays, originated in the LAr bulk, and by s and X-rays from radioactive isotopes in the detector components surrounding the active target. The rate of NRs from radiogenic and cosmogenic neutrons and from interactions of solar and atmospheric neutrinos, via coherent scattering off nucleus, is negligible with respect to the ER one, and therefore not considered in this analysis.
IV.0.1 Internal background
39Ar and 85Kr specific activities in underground argon were estimated in the first 70-days DarkSide-50 dataset at 0.730.11 mBq/kg and 2.050.13 mBq/kg, respectively, by fitting S1 spectra [19]. The 85Kr specific activity was then corrected by its decay time (10.8 yr) to 1.840.12 mBq/kg, averaged over the lifetime of the dataset used in this analysis.
85Kr activity is also assessed by identifying - fast coincidences from the 0.43% decay branch to 85mRb with 1.46 s mean lifetime. This resulted in an activity of 1.820.15 mBq/kg, in excellent agreement with the one obtained from the spectral fit. A third independent approach, based on the fit of the 85Kr decay time in the [50, 200] range, resulted in a specific activity of 1.730.23 mBq/kg, compatible with the other two. The weighted mean of the three measurements is 1.820.09 mBq/kg.
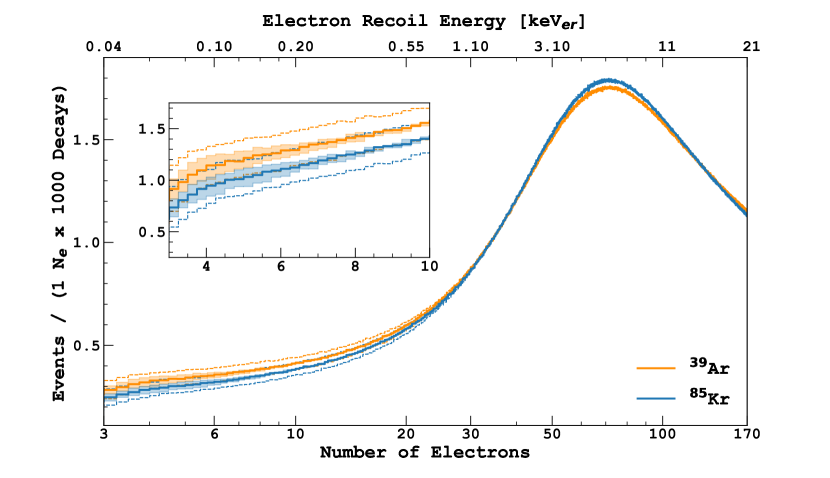
The 39Ar and 85Kr ground-state to ground-state beta decays are first forbidden unique. The spectral shapes used in this analysis take into account recent calculations of atomic exchange and screening effects that have been extended to this transition nature [24, 25], validated on measured 63Ni and 241Pu spectra with a 200 eV threshold. Below this value, we assume a linear uncertainty on such corrections from 25% at 0 eV up to 0% at 200 eV.
Further systematics on the spectral shape originate from the uncertainty on the Q-value (1% for 39Ar and 0.4% for 85Kr), and from the detector response. The main uncertainty on the latter, as described in detail in ref. [16], arises from the uncertainty on the ionization response, shown in Fig. 1.
The 39Ar and 85Kr -spectra, generated including detector response effects, are shown in Fig. 4 together with the associated uncertainties.
IV.0.2 External background
| Location | Activity | Single-scatter events in the RoI | ||
| and source | [Bq] | Event rate [Hz] | Total rate [Hz] | |
| LAr | 39Ar | 0.034 | ||
| 85Kr | 0.084 | |||
| PMT Stems | 232Th | |||
| 238U up | ||||
| 238U low | ||||
| 235U | ||||
| 40K | ||||
| 54Mn | ||||
| Ceramic | 232Th | |||
| 238U up | ||||
| 238U low | ||||
| 235U | ||||
| 40K | ||||
| Body | 60Co | |||
| Cryostat | 232Th | |||
| 238U up | ||||
| 238U low | ||||
| 235U | ||||
| 60Co | ||||
| 40K | ||||
This analysis is based on extensive simulation of each external background component as measured in the material screening campaign, unlike the 2018 analyses where the external background model was extrapolated from high-energy fits.
The main sources of external X-ray and background are the radioactive contaminants in PMTs and in the stainless-steel cryostat, both characterized with an extensive materials assay campaign. These measurements and their associated errors, once corrected for decreased activity due to elapsed time at the dataset date, are the inputs for the external background model.
The PMT components, which dominate in terms of radioactivity, are the stems in the back of the PMT, the ceramic around the dynodes chain, and the PMT body made of kovar. In contrast, the cryostat is composed only of stainless steel, where contamination is uniformly distributed.
The radioactive isotopes measured in the screening campaign are quoted in Table 1. The secular equilibrium of 238U is broken at the level of 222Rn, because different activities were observed between the top and bottom of the chain. Each isotope is simulated uniformly distributed in the component material, and decaying particles are tracked over all the DarkSide-50 geometry with G4DS. The detector response to each deposit is simulated with the Monte Carlo strategy, which includes, among others, electron captures by impurities along the drift and the dependence of the S2 response on the event radial position [16]. Energy dependent inefficiencies from the quality cuts are applied to the Monte Carlo sample on an event-by-event basis.
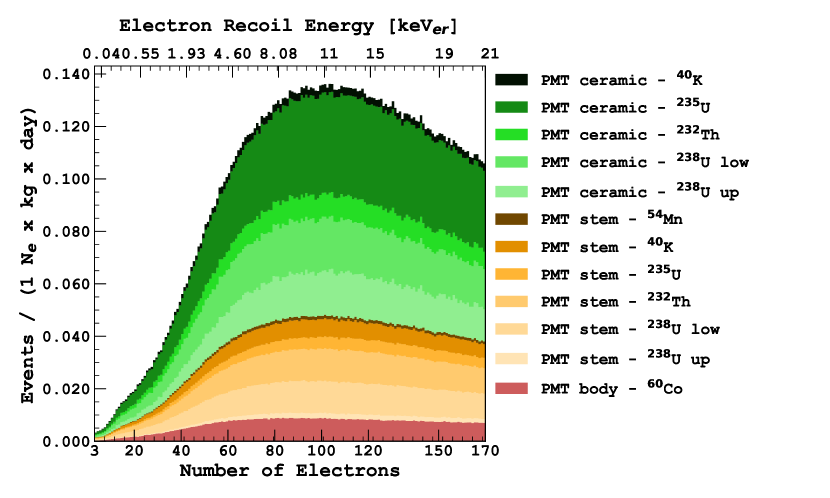
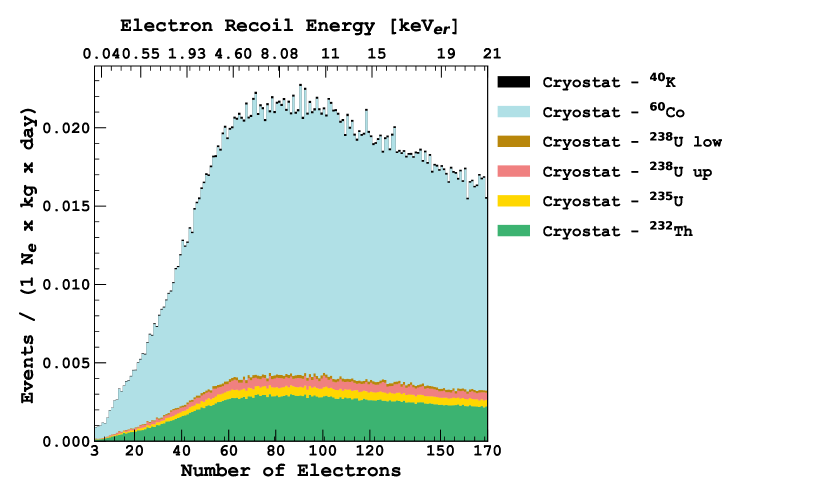
Table 1 reports activities and errors from the material screening, and the event rate of single scatter events, within the fiducial volume and in the energy region of interest, for each contribution. The resulting predicted event rates for PMTs and cryostat components are Hz and Hz, respectively. The difference in the source location has a large impact on the induced event rate, due to the distance of the component from the active volume. Therefore, an additional 10% systematic error, derived from Monte Carlo simulations, is accounted for the PMTs contribution due to the uncertainty on the contamination partitioning between stems and body. The resulting energy spectra with the breakdown of the radioactive contributions for both PMTs and cryostat are shown in Fig. 5. The cryostat component is largely dominated by 60Co, and the PMTs one by the contamination from the ceramic.
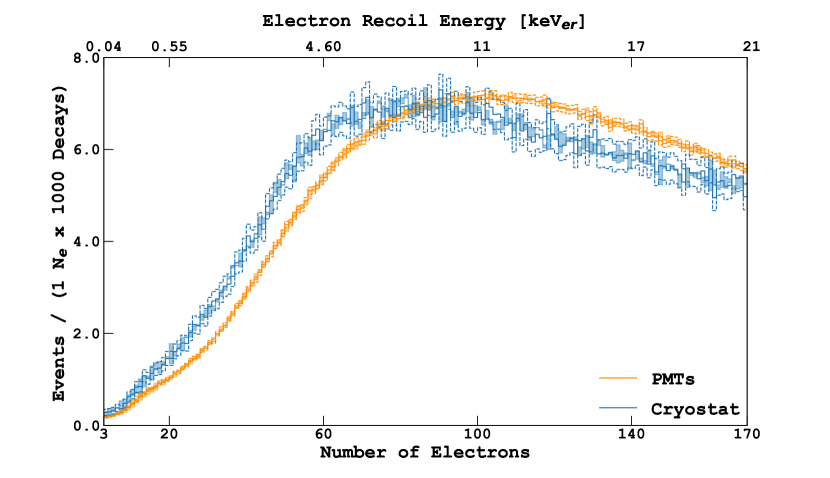
It is worth noting that the spectra from individual contributions for each of the two components are nearly indistinguishable, thus reducing the impact of systematics related to their individual normalizations. We verified that the systematics related to possible spectral deformation is negligible by comparing the summed spectra while varying the amplitude of each component by 1-, as quoted in Table 1.
The final spectra are shown in Fig. 6, together with the systematic error from the detector response and the Monte Carlo statistical uncertainty.
V Background-only fit
The analysis is based on a binned profile likelihood, , implemented through the RooFit/HistFactory package [26],
| (1) | |||||
The first term represents the Poisson probability of observing events in the -bin with respect to the expected ones, , with the signal strength and the set of nuisance parameters. The second term includes the Gaussian penalty terms to account for the nuisance parameters ( and are the nominal central values and uncertainties, respectively), listed in Table 2, which may act on multiple components in a correlated way. The last term of eq. 1 accounts for the statistical uncertainties in each bin () of the simulated sample with respect to the nominal value, [26].
Nuisance parameters are classified as “amplitude” parameters, acting on the normalization of the background components, or as “shape” parameters, accounting for spectral distortions from the ionization response and from uncertainties on 39Ar and 85Kr -decays. Among the amplitude parameters, the uncertainty on fiducial volume due to thermal contraction of PTFE has a different impact on internal and external components. From one side, the relative uncertainty on the activities of 39Ar and 85Kr decays, uniformly distributed in the TPC, is equal to the fiducial volume one (1.5%). On the other hand, the fraction of the external background falling inside the fiducial volume depends on the positions of the PMTs, which are installed on a PTFE holder and thus subjected to thermal contraction. This uncertainty has been propagated with Monte Carlo simulations and results equal to 1.1% for both the cryostat and PMTs backgrounds.
As for the shape systematics, these are implemented through a template morphing based on a vertical bin interpolation between histograms distorted by systematics. This approach also allows for accounting for asymmetric errors [27].
| Name | Source | Affected components | |
| Amplitude | AFV | uncertainty on the fiducial volume | WIMP, 39Ar, 85Kr, PMTs, Cryostat |
| AAr | 14.0% uncertainty on 39Ar activity | 39Ar | |
| AKr | 4.7% uncertainty on 85Kr activity | 85Kr | |
| Apmt | 11.5% uncertainty on activity from PMTs | PMT | |
| Acryo | 6.6% uncertainty on activity from the cryostat | Cryostat | |
| Shape | QKr | 0.4% uncertainty on the 85Kr-decay Q-value | 85Kr |
| QAr | 1% uncertainty on the 39Ar-decay Q-value | 39Ar | |
| SKr | spectral shape uncertainty on atomic exchange and screening effects | 85Kr | |
| SAr | spectral shape uncertainty on atomic exchange and screening effects | 39Ar | |
| spectral shape systematics from ER ionization response uncertainty | 39Ar, 85Kr, PMTs, Cryostat | ||
| spectral shape systematics from NR ionization response uncertainty | WIMP |
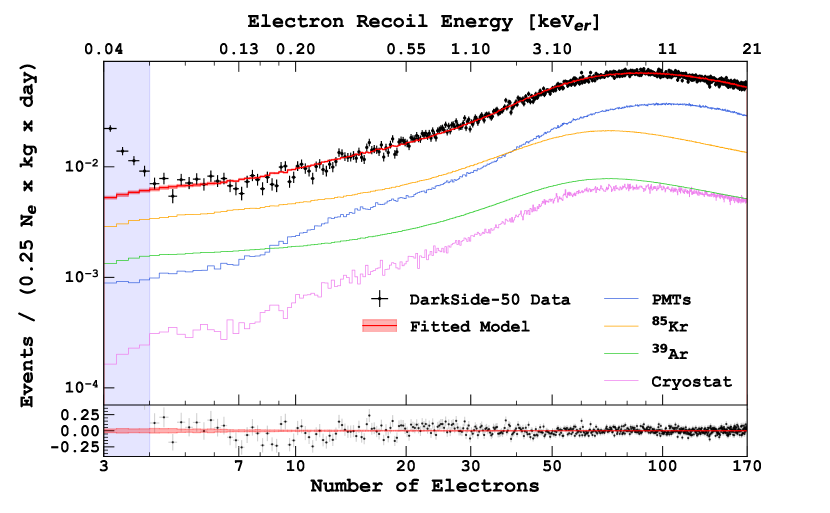
Fitting the data with background only components, by removing the signal component from eq. 1 (see Fig. 7), allows for model diagnostics. An excess of events was observed between 4 and 7 in the 2018 analyses [6, 7]. In the current analysis, the fit from 4 is compatible with data, confirming the suppression of the event excess. There are multiple reasons for this improvement: the more efficient background rejection of quality cuts, the better modelling of 39Ar and 85Kr -spectra, including atomic exchange and screening effects, particularly important at low energies, and a more accurate treatment of systematics.
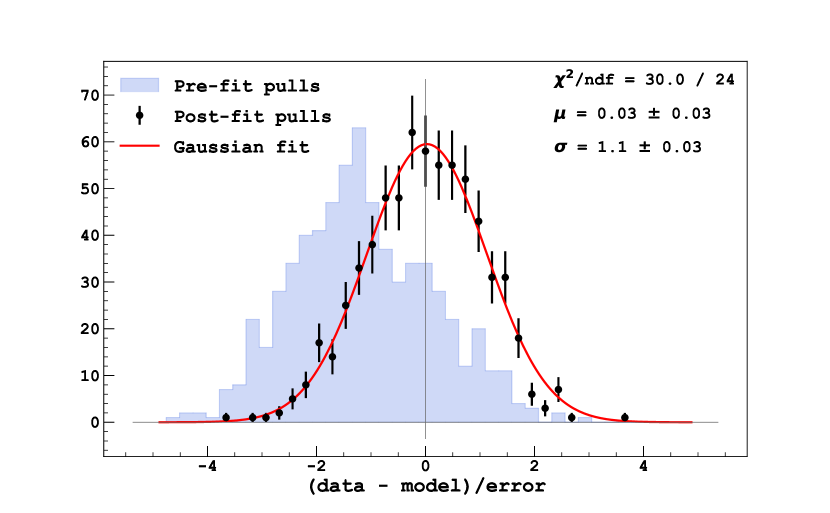
The data pulls from the fit in the full [4, 170] range are normally distributed, as shown in Fig. 8, demonstrating the quality of the background model. Post-fit values of nuisance parameters are in good agreement with the nominal ones, as reported in Fig 9. Improvement between nominal and post-fit errors are observed for two parameters: the amplitude of the PMT component and the ionization response to ERs. The former is subject to a large uncertainty from the position of the contaminant within the PMT itself, as discussed in Sec. IV, and the latter relies on a few calibration points, especially at low energies [16]. In both cases, the fitted dataset provides additional information to improve their uncertainty, as also observed from the fit of an Asimov sample derived from the background model [28].
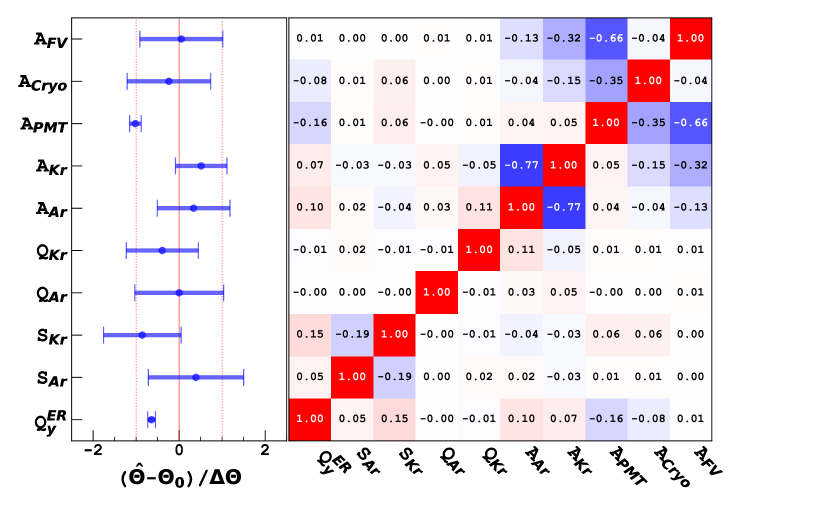
As shown in Fig 9, the similarity in spectra between various components, as for 39Ar and 85Kr or PMTs and cryostat backgrounds, is at the origin of their anti-correlation. The impact of fiducial volume uncertainty, which equally acts on all normalization factors, is larger when relative uncertainties on component amplitudes are higher.
Finally, we tested the hypothesis of tritium contamination from cosmogenic activation during the LAr transportation, which was estimated of the order of a few 0.1 mBq/kg. However, hydrogen is chemically removed by the hot getter present in the DarkSide-50 gaseous purification loop, hence we expect a negligible tritium contamination in our target. Notice that tritium is also one of the hypotheses to explain the excess of events observed by Xenon1T [29]. We probed its presence in DarkSide-50 by adding an unconstrained component in the likelihood. The tritium activity in DarkSide-50 was found to be compatible with zero, with an upper limit of 1.110-3 mBq/kg at 90% C.L. (2 Hz in the fiducial volume and in the RoI), and thus not included in the analysis.
VI Sensitivity to WIMP-nucleon interactions
The signal from spin-independent WIMP-nucleon scattering is derived assuming the standard isothermal WIMP halo model, with = 544 km/s, = 238 km/s, = 232 km/s, and = 0.3 GeV/c2/cm3 [30, 31].
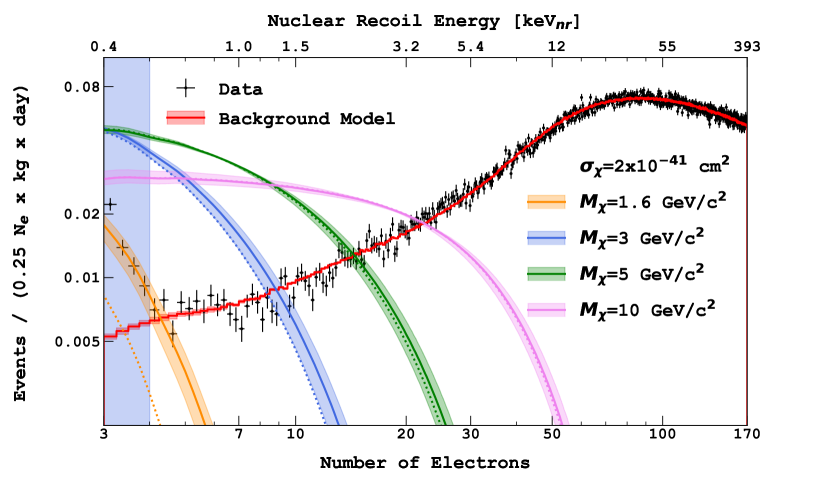
Recoils from WIMPs, via elastic scattering off nucleons, are modeled with a Monte Carlo approach, as done for the background components (see Sec. IV) and including the ionization response to NRs shown in Fig 1. The main unknown in such response is the fluctuation from the ionization quenching effect, an issue already raised in the 2018 analysis [6] and still unresolved. Quenching fluctuations, in addition to fluctuations resulting from the partitioning between excitons and ionization electrons and from ion-electron recombinations, play a key role because, at very low energies, they increase the probability of observing events above the analysis threshold. The suppression of quenching fluctuations, though not physical, represents the most conservative modelling with respect to the WIMP search. An alternative model, also considered in this analysis, relies on binomial quenching fluctuations, i.e., between detectable (ionization electrons and excitons) and undetectable quanta (e.g. phonons). The choice of binomial fluctuations ensures that the number of produced quanta does not exceed the maximum one, equivalent to the ratio between the deposited energy and the average work function (19.5 eV [32]) in LAr [16]. The comparison between expected WIMP signals, assuming quenching fluctuations, and background model and data, is shown in Fig 10.
The nuisance parameters considered in eq. 1, include those already discussed for the background-only fit (see Sec. V and Table 2), as well as those associated to the signal. The dominant one is the uncertainty on the NR ionization response, shown in Fig. 1, obtained from the simultaneous fit [16] of spectra from calibration neutron sources deployed in the DarkSide-50 veto, and external calibration datasets from SCENE [18] and ARIS [17] test beam experiments. The signal amplitude is also affected by the uncertainty on the fiducial volume, a systematic correlated with the background components.
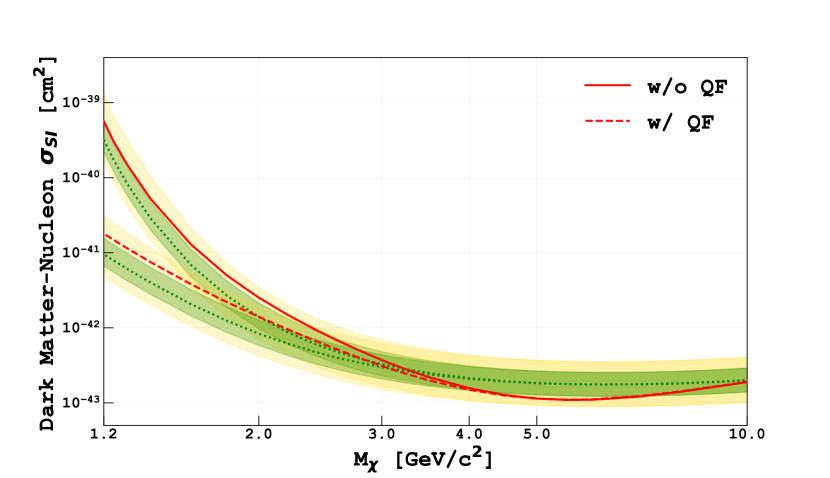
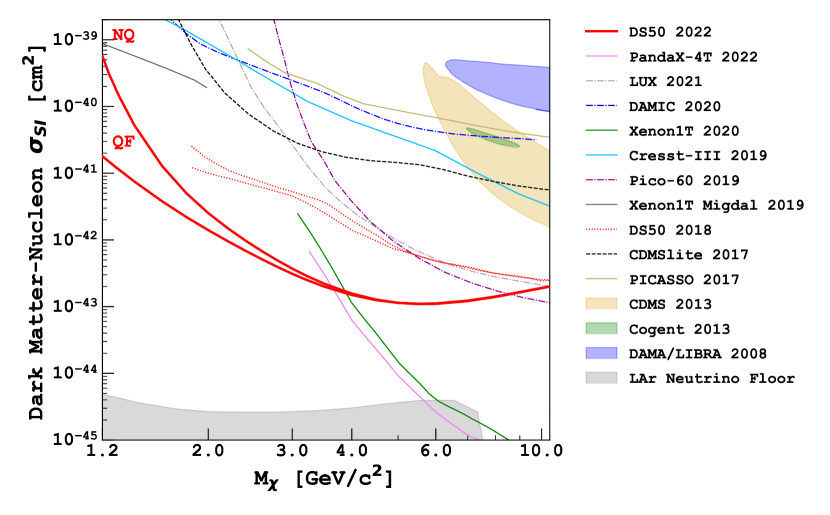
The observed upper limit of 90% C.L. computed with the CLs technique [33] for the two signal models, with (QF) and without (NQ) quenching fluctuations, are shown in Fig. 11, along with the expected limits. In both cases, observed limits are compatible within 2- with the expected ones, and coincide between them above 4 GeV/c2 WIMP mass, where the impact of quenching fluctuations is negligible.
Exclusion limits above 1.2 GeV/c2 are compared in Fig. 12 with the 90% C.L. exclusion limits and with regions of claimed discovery from Refs [4, 34, 35, 36, 9, 10, 3, 6, 37, 38, 1, 39, 40, 41]. Assuming non-quenching fluctuations, the most conservative model, DarkSide-50 establishes, with this work, the world’s best limits for WIMPs with masses in the range [1.2, 3.6] GeV/c2 and improves on the previous one by a factor of 10 at 3 GeV/c2. The dominant factors that enabled this improvement are the data selection, which suppressed the excess observed in 2018 over the background model in the region between 4 and 7 [6], and the inclusion of atomic corrections to the spectra of first unique forbidden 39Ar and 85Kr decays, which improve the agreement between data and model.
The DarkSide-50 limits described in this work are confirmed using an alternative Bayesian approach, where the analytical ER and NR calibration responses are made explicit in the likelihood. This approach allows to propagate systematic uncertainties in the final result without any intermediate Gaussian or linearity assumptions. In addition, the likelihood is marginalized, and not profiled with respect to the nuisance parameters, as done in this work. This yields a reliable estimate of uncertainties even when a multivariate normal distribution does not provide a good approximation of the likelihood function. The description of this approach and of associated DarkSide-50 results will be released soon in a dedicated publication.
VII Conclusions
In this work, we reanalyzed the DarkSide-50 dataset used in 2018 [6] to produce the exclusion limit in the region below 10 GeV/c2. Compared to the previous analysis, we improved the data selection, calibration of the detector response, background model, and determination of systematic errors. The good understanding of the background down to 0.6 keVnr, corresponding to 4 electrons, allows to improve the previous DarkSide-50 exclusion limit by a factor of about 10 at 3 GeV/c2. More generally, this analysis has produced the world’s best limit on the spin-independent WIMP-nucleon elastic scattering in the region between 1.2 and 3.6 GeV/c2, assuming the signal model without quenching fluctuations, i.e. the most conservative hypothesis. The same analysis approach was also applied to improve existing limits on spin-independent WIMP-nucleon interactions including the Migdal effect [47] and on dark matter particle interactions with electron final states [48]. These limits may be improved in the future by better constraining the LAr ionization response and the stochastic model underlying the NR quenching.
Acknowledgements.
The DarkSide Collaboration offers its profound gratitude to the LNGS and its staff for their invaluable technical and logistical support. We also thank the Fermilab Particle Physics, Scientific, and Core Computing Divisions. Construction and operation of the DarkSide-50 detector was supported by the U.S. National Science Foundation (NSF) (Grants No. PHY-0919363, No. PHY-1004072, No. PHY-1004054, No. PHY-1242585, No. PHY-1314483, No. PHY-1314501, No. PHY-1314507, No. PHY-1352795, No. PHY-1622415, and associated collaborative grants No. PHY-1211308 and No. PHY-1455351), the Italian Istituto Nazionale di Fisica Nucleare, the U.S. Department of Energy (Contracts No. DE-FG02-91ER40671, No. DEAC02-07CH11359, and No. DE-AC05-76RL01830), the Polish NCN (Grant No. UMO-2019/33/B/ST2/02884) and the Polish Ministry for Education and Science (Grant No. 6811/IA/SP/2018). We also acknowledge financial support from the French Institut National de Physique Nucléaire et de Physique des Particules (IN2P3), the IN2P3-COPIN consortium (Grant No. 20-152), and the UnivEarthS LabEx program (Grants No. ANR-10-LABX-0023 and No. ANR-18-IDEX-0001), from the São Paulo Research Foundation (FAPESP) (Grant No. 2016/09084-0), from the Interdisciplinary Scientific and Educational School of Moscow University “Fundamental and Applied Space Research”, from the Program of the Ministry of Education and Science of the Russian Federation for higher education establishments, project No. FZWG-2020-0032 (2019-1569), from IRAP AstroCeNT funded by FNP from ERDF, and from the Science and Technology Facilities Council, United Kingdom. I. Albuquerque is partially supported by the Brazilian Research Council (CNPq). The theoretical calculation of beta decays was performed as part of the EMPIR Project 20FUN04 PrimA-LTD. This project has received funding from the EMPIR program co-financed by the Participating States and from the European Union’s Horizon 2020 research and innovation program. Furthermore, this project has received funding from the European Union’s Horizon 2020 research and innovation program under grant agreement No 952480. Isotopes used in this research were supplied by the United States Department of Energy Office of Science by the Isotope Program in the Office of Nuclear Physics.References
- Akerib et al. [2017a] D. S. Akerib et al. (LUX), Phys. Rev. Lett. 118, 021303 (2017a), arXiv:1608.07648 [astro-ph.CO] .
- Agnes et al. [2018a] P. Agnes et al. (DarkSide), Phys. Rev. D 98, 102006 (2018a), arXiv:1802.07198 [astro-ph.CO] .
- Aprile et al. [2018] E. Aprile et al. (XENON), Phys. Rev. Lett. 121, 111302 (2018), arXiv:1805.12562 [astro-ph.CO] .
- Meng et al. [2021] Y. Meng et al. (PandaX-4T), Phys. Rev. Lett. 127, 261802 (2021), arXiv:2107.13438 [hep-ex] .
- Lee and Weinberg [1977] B. W. Lee and S. Weinberg, Phys. Rev. Lett. 39, 165 (1977).
- Agnes et al. [2018b] P. Agnes et al. (DarkSide), Phys. Rev. Lett. 121, 081307 (2018b), arXiv:1802.06994 [astro-ph.HE] .
- Agnes et al. [2018c] P. Agnes et al. (DarkSide), Phys. Rev. Lett. 121, 111303 (2018c), arXiv:1802.06998 [astro-ph.CO] .
- Akerib et al. [2019] D. S. Akerib et al. (LUX), Phys. Rev. Lett. 122, 131301 (2019), arXiv:1811.11241 [astro-ph.CO] .
- Aprile et al. [2019a] E. Aprile et al. (XENON), Phys. Rev. Lett. 123, 241803 (2019a), arXiv:1907.12771 [hep-ex] .
- Aprile et al. [2019b] E. Aprile et al. (XENON), Phys. Rev. Lett. 123, 251801 (2019b), arXiv:1907.11485 [hep-ex] .
- Aprile et al. [2014] E. Aprile et al. (XENON100), Phys. Rev. D 90, 062009 (2014), [Erratum: Phys.Rev.D 95, 029904 (2017)], arXiv:1404.1455 [astro-ph.CO] .
- Akerib et al. [2017b] D. S. Akerib et al. (LUX), Phys. Rev. Lett. 118, 261301 (2017b), arXiv:1704.02297 [astro-ph.CO] .
- Fu et al. [2017] C. Fu et al. (PandaX), Phys. Rev. Lett. 119, 181806 (2017), arXiv:1707.07921 [hep-ex] .
- Bondar et al. [2009] A. Bondar, A. Buzulutskov, A. Grebenuk, D. Pavlyuchenko, and Y. Tikhonov, JINST 4, P09013, arXiv:0908.2915 [physics.ins-det] .
- Aprile et al. [2016] E. Aprile et al. (XENON), Phys. Rev. D 94, 092001 (2016), [Erratum: Phys.Rev.D 95, 059901 (2017)], arXiv:1605.06262 [astro-ph.CO] .
- Agnes et al. [2021] P. Agnes et al. (DarkSide), Phys. Rev. D 104, 082005 (2021), arXiv:2107.08087 [physics.ins-det] .
- Agnes et al. [2018d] P. Agnes et al., Phys. Rev. D 97, 112005 (2018d), arXiv:1801.06653 [physics.ins-det] .
- Cao et al. [2015] H. Cao et al. (SCENE), Phys. Rev. D 91, 092007 (2015), arXiv:1406.4825 [physics.ins-det] .
- Agnes et al. [2016] P. Agnes et al. (DarkSide), Phys. Rev. D 93, 081101 (2016), [Addendum: Phys.Rev.D 95, 069901 (2017)], arXiv:1510.00702 [astro-ph.CO] .
- Agnes et al. [2015] P. Agnes et al. (DarkSide), Phys. Lett. B 743, 456 (2015), arXiv:1410.0653 [astro-ph.CO] .
- Agnes et al. [2017a] P. Agnes et al. (DarkSide), JINST 12 (12), P12011, arXiv:1707.09889 [physics.ins-det] .
- Agnes et al. [2017b] P. Agnes et al. (DarkSide), JINST 12 (10), P10015, arXiv:1707.05630 [physics.ins-det] .
- Agnes et al. [2022a] P. Agnes et al. (DarkSide-50), Astropart. Phys. 140, 102704 (2022a), arXiv:2107.08015 [physics.ins-det] .
- Mougeot and Bisch [2014] X. Mougeot and C. Bisch, Phys. Rev. A 90, 012501 (2014).
- Haselschwardt et al. [2020] S. J. Haselschwardt, J. Kostensalo, X. Mougeot, and J. Suhonen, Phys. Rev. C 102, 065501 (2020), arXiv:2007.13686 [hep-ex] .
- Cranmer et al. [2012] K. Cranmer, G. Lewis, L. Moneta, A. Shibata, and W. Verkerke (ROOT), HistFactory: A tool for creating statistical models for use with RooFit and RooStats, Tech. Rep. (New York U., New York, 2012).
- Barlow and Beeston [1993] R. J. Barlow and C. Beeston, Comput. Phys. Commun. 77, 219 (1993).
- Cowan et al. [2011] G. Cowan, K. Cranmer, E. Gross, and O. Vitells, Eur. Phys. J. C 71, 1554 (2011), [Erratum: Eur.Phys.J.C 73, 2501 (2013)], arXiv:1007.1727 [physics.data-an] .
- Aprile et al. [2020] E. Aprile et al. (XENON), Phys. Rev. D 102, 072004 (2020), arXiv:2006.09721 [hep-ex] .
- Smith et al. [2007] M. C. Smith et al., Mon. Not. Roy. Astron. Soc. 379, 755 (2007), arXiv:astro-ph/0611671 .
- Baxter et al. [2021] D. Baxter et al., Eur. Phys. J. C 81, 907 (2021), arXiv:2105.00599 [hep-ex] .
- Doke et al. [2002] T. Doke, A. Hitachi, J. Kikuchi, K. Masuda, H. Okada, and E. Shibamura, Jap. J. Appl. Phys. 41, 1538 (2002).
- Read [2002] A. L. Read, J. Phys. G 28, 2693 (2002).
- Traina et al. [2021] M. Traina et al. (DAMIC), PoS ICRC2021, 539 (2021), arXiv:2108.05983 [astro-ph.CO] .
- Abdelhameed et al. [2019] A. H. Abdelhameed et al. (CRESST), Phys. Rev. D 100, 102002 (2019), arXiv:1904.00498 [astro-ph.CO] .
- Amole et al. [2017] C. Amole et al. (PICO), Phys. Rev. Lett. 118, 251301 (2017), arXiv:1702.07666 [astro-ph.CO] .
- Agnese et al. [2018] R. Agnese et al. (SuperCDMS), Phys. Rev. D 97, 022002 (2018), arXiv:1707.01632 [astro-ph.CO] .
- Agnese et al. [2014] R. Agnese et al. (SuperCDMS), Phys. Rev. Lett. 112, 041302 (2014), arXiv:1309.3259 [physics.ins-det] .
- Behnke et al. [2017] E. Behnke et al., Astropart. Phys. 90, 85 (2017), arXiv:1611.01499 [hep-ex] .
- Aalseth et al. [2011] C. E. Aalseth et al. (CoGeNT), Phys. Rev. Lett. 106, 131301 (2011), arXiv:1002.4703 [astro-ph.CO] .
- Bernabei et al. [2013] R. Bernabei et al., Eur. Phys. J. C 73, 2648 (2013), arXiv:1308.5109 [astro-ph.GA] .
- Ma et al. [2022] W. Ma et al., (2022), arXiv:2207.04883 [hep-ex] .
- Angloher et al. [2012] G. Angloher et al., Eur. Phys. J. C 72, 1971 (2012), arXiv:1109.0702 [astro-ph.CO] .
- Aprile et al. [2021] E. Aprile et al. (XENON), Phys. Rev. Lett. 126, 091301 (2021), arXiv:2012.02846 [hep-ex] .
- Akerib et al. [2021] D. S. Akerib et al. (LUX), Phys. Rev. D 104, 012011 (2021), arXiv:2011.09602 [hep-ex] .
- Ruppin et al. [2014] F. Ruppin, J. Billard, E. Figueroa-Feliciano, and L. Strigari, Phys. Rev. D 90, 083510 (2014), arXiv:1408.3581 [hep-ph] .
- Agnes et al. [2022b] P. Agnes et al. (DarkSide), (2022b), arXiv:2207.11967 [hep-ex] .
- Agnes et al. [2022c] P. Agnes et al. (DarkSide-50), (2022c), arXiv:2207.11968 [hep-ex] .