Potential signature of Population III pair-instability supernova ejecta
in the BLR gas of the most distant quasar at 111At the
time of writing this paper, the highest redshift record has been updated
to , ULAS J0313-1806, as reported by Wang et al. (2021).
Abstract
The search for Population III (Pop III) stars has fascinated and eluded astrophysicists for decades. One promising place for capturing evidence of their presence must be high-redshift objects; signatures should be recorded in their characteristic chemical abundances. We deduce the Fe and Mg abundances of the broad-line region (BLR) from the intensities of ultraviolet Mg II and Fe II emission lines in the near-infrared spectrum of UKIDSS Large Area Survey (ULAS) J1342+0928 at , by advancing our novel flux-to-abundance conversion method developed for quasars. We find that the BLR of this quasar is extremely enriched, by a factor of 20 relative to the solar Fe abundance, together with a very low Mg/Fe abundance ratio: and , only 700 million years after the Big Bang. We conclude that such an unusual abundance feature cannot be explained by the standard view of chemical evolution that considers only the contributions from canonical supernovae. While there remains uncertainty in the high-mass end of the Pop III IMF, here we propose that the larger amount of iron in ULAS J1342+0928 was supplied by a pair-instability supernova (PISN) caused by the explosion of a massive Pop III star in the high-mass end of the possible range of . Chemical-evolution models based on initial PISN enrichment well explain the trend in [Fe/Mg]- all the way from to . We predict that stars with very low [Mg/Fe] at all metallicities are hidden in the Galaxy, and they will be efficiently discovered by ongoing new-generation photometric surveys.
1 Introduction
According to the Big Bang cosmology, nucleosynthesis does not produce heavy elements because of the rapid decrease in density and temperature as the universe expands (Wagoner et al. 1967). This has led to an immediate interpretation that the heavy elements observed in various objects in the universe are synthesized in the interior of massive stars and ejected by supernovae (SNe). Therefore, the first generation of stellar objects called Population III (hereafter, Pop III) should be massive stars born from the gas of pristine composition consisting almost exclusively of hydrogen and helium.
If the initial mass function (IMF) of the hypothetical Pop III stars extended to masses as low as (Silk 1977; Sabano & Yoshii 1977; Yoshii & Sabano 1980; Yoshii & Saio 1986; Nakamura & Umemura 1999, 2001; Omukai & Yoshii 2003; Susa et al. 2014; Ishiyama et al. 2016; Dutta et al. 2020), their lifetimes would be as long as the age of the Galaxy, and they would survive to be observed at the present day. Contrary to expectation, despite the great observational efforts made during the past four decades222Now including spectroscopic samples for hundreds of thousands, e.g., SDSS/SEGUE; see Yanny et al. (2009) and Rockosi et al. (2021), and APOGEE; see Majewski et al. (2017), to many millions of stars, e.g., LAMOST; see Luo et al. (2015)., no single star without detectable metals has been found anywhere in the Galaxy. Such a null result has been discussed from the perspective as to whether the low-mass Pop III stars were misclassified, due to surface pollution after their birth, as moderately metal-poor stars (Yoshii 1981; Iben 1983; Hattori et al. 2014; Kirihara et al. 2019), or if they did not actually form, as suggested by some theoretical arguments (e.g., Bromm & Larson 2004; Karlsson et al. 2013). In any case, the existence of low-mass Pop III stars will continue to remain a hypothesis unless a truly zero-metal star is discovered in the future.
On the other hand, while there remains significant uncertainty in our understanding of the high mass end of the Pop III IMF, massive Pop III stars with 10 that cause explosive nucleosynthesis are short-lived and should have already become SNe long before the Galaxy formed. However, the heavy-element abundance pattern of Pop III SN ejecta should be recorded in the abundance pattern of second-generation stars born from the surrounding gas mixed with Pop III SN ejecta. Based on this idea, together with explosive nucleosynthesis calculations of Pop III SN progenitors, such nucleosynthesis signatures of massive Pop III stars have been searched for in observations of heavy-element abundance patterns of extremely metal-poor Pop II stars that are thought to be second-generation stars nearly as old as Pop III stars (e.g., Frebel et al. 2005; Joggerst et al. 2010; Ishigaki et al. 2018). However, motivated by the idea that first stars form in small clusters, it has been suggested that second-generation stars may have formed from gas that was enriched by multiple Pop III SNe with different progenitor masses (Hartwig et al. 2018a, 2019). In this case, the inverse problem of finding the Pop III SN progenitor from the abundance pattern of a second-generation star does not necessarily guarantee the uniqueness of the solution, and the result is less constrained. In addition, there remains a problem of whether truly second-generation stars can be separated solely by their metallicity or age (Hartwig et al. 2018a; Ishigaki et al. 2021). Investigations along these lines are still ongoing, but the results obtained so far do not definitively constrain the properties of massive Pop III stars in the Galaxy.
It has long been known that if the hydrogen in intergalactic space were neutral, then no light emitted by quasars at wavelengths shorter than the wavelength of hydrogen Lyman-alpha (Ly) could be detected (Gunn & Peterson 1965; Yoshii & Peterson 1995). The first evidence that the universe is undergoing reionization was found in observations of the hydrogen Ly lines in quasar spectra. The number of lines decreases with decreasing redshift, indicating that the reionization is increasing as the universe expands (Peterson 1978, 1983). The formation of quasars and the first Pop III stars around triggered the transition of the universe from a neutral to fully ionized state (Fan et al. 2006; Bouwens et al. 2015b; Planck Collaboration et al. 2020).
In recent years, cosmological simulations have inspired attempts to predict the observability of massive Pop III stars and their properties during the epoch of cosmic reionization (Xu et al. 2016; Sarmento et al. 2018, 2019), and have produced a growing interest in detecting Pop III stars through spectroscopic observations of objects at high redshift that can be traced back in time to this epoch. In this context, the near-infrared (NIR) spectrum of the quasar ULAS J1342+0928 (hereafter, ULAS J1342) at , which was recently published by Onoue et al. (2020), has attracted a lot of attention. ULAS J1342 is the most distant quasar, and is in the transition period of cosmic reionization, where quasar contribution to the reionization is still controversial (e.g., Madau & Haardt 2015; Mitra et al. 2018; Zeltyn & Trakhtenbrot 2022).
This is the first time that a detailed NIR spectrum of the most distant quasar has been obtained. The spectrum contains a number of heavy-element emission lines emitted in the UV-visible wavelength range of the broad-line region (BLR) in the rest frame. These lines are thought to originate from heavy elements supplied to the BLR gas by the explosive nucleosynthesis of massive stars formed before . According to theoretical calculations, the abundance ratio of -elements such as O, Ne, Mg, Si, and so on, relative to Fe is sensitive to various types of SN progenitors (e.g., Woosley et al. 2002; Nomoto et al. 2013). Therefore, it is possible to distinguish the SN progenitors from the [/Fe] measurements with high reliability. The [/Fe] abundance ratio for ULAS J1342 at is thus expected to provide new insights into the existence of Pop III stars.
To investigate the redshift evolution of the [/Fe] abundance ratio, the flux ratio of Fe II and Mg II emission lines in the quasar spectrum has recently been measured by many researchers, as summarized in Schindler et al. (2020). However, no clear redshift evolution has been seen in these flux ratio measurements (e.g., De Rosa et al. 2011; Mazzucchelli et al. 2017; Shin et al. 2019; Onoue et al. 2020; Schindler et al. 2020). On the other hand, statistical studies of quasar spectra have shown that the Fe II/Mg II flux ratio depends not only on the abundance of heavy elements but also on non-abundance parameters (Dong et al. 2011; Sameshima et al. 2017). These results suggest that the conversion of the Fe II and Mg II emission-line fluxes to the [Mg/Fe] abundance ratio is essential to quantitatively investigate chemical evolution. We have recently developed such a conversion method, and found that the [Mg/Fe] abundance ratio of the BLR is almost constant at (Sameshima et al. 2017). The systematic errors of [Mg/Fe] and [Fe/H] arising from the conversion method itself are estimated from the fluctuation of their averages for each redshift bin, and are as small as 0.1 dex. Thus, with our method, we have opened a window for the study of the chemical evolution of the universe at high redshift using quasars.
The present paper is the first report to determine the abundance ratio of [Mg/Fe] from the NIR spectrum of ULAS J1342, and to identify the SN progenitor based on the flux-to-abundance conversion method. As a result, we deduce that the value of [Mg/Fe] for ULAS J1342 originates from a pair-instability supernova (PISN) by a Pop III star of several hundred solar masses. Based on this result, we show that the study of the Pop III era at is crucial for understanding the chemical evolution of the early universe, and we discuss the potential of high-redshift quasar surveys for various studies of Pop III stars in the future. Throughout this paper, we assume a CDM cosmology, with , , and .
2 Measurement and Analysis
2.1 Abundance Analysis of ULAS J1342+0928
The measurements of ULAS J1342 are taken directly from Onoue et al. (2020). Table 2.1 shows their values. Here we give only a brief summary of how these values were measured.
The spectrum of ULAS J1342 was taken with the Gemini Near-InfraRed Spectrograph (GNIRS) at the Gemini North telescope. The spectrum covers the observed wavelengths of with a spectral resolution of . The power-law plus Balmer continuum and the Fe II template were iteratively fitted to the observed spectrum, which is a common technique used in this research area (e.g., De Rosa et al. 2011; Mazzucchelli et al. 2017; Sameshima et al. 2017). In Onoue et al. (2020), there are results from two different Fe II templates, one by Vestergaard & Wilkes (2001) and one by Tsuzuki et al. (2006). In this paper, we adopt the result for the case where the Fe II template of Tsuzuki et al. (2006) was used, because Sameshima et al. (2017, 2020), who proposed the flux-to-abundance conversion method, also used the same Fe II template. The fitted Fe II template was integrated over Å and then divided by the continuum flux at Å to derive the rest-frame equivalent width (EW). After subtracting the continuum components, Mg II was fitted with a single Gaussian and the rest-frame EW and the full width of the line at half maximum (FWHM) were measured. The black hole mass, , was estimated from the measured monochromatic luminosity at 3000 Å () and FWHM(Mg II) based on the single-epoch mass estimator given by Vestergaard & Osmer (2009). The bolometric luminosity was measured by applying a bolometric correction of (Richards et al. 2006). The Eddington ratio was obtained by dividing by the Eddington luminosity, , which is the classical definition for a completely ionized pure hydrogen gas.
| Parameter | Value |
|---|---|
| Observation settings | |
| Observed wavelength (µm) | 0.9–2.5 |
| Spectral resolution () | 760 |
| Measurement | |
| Redshift | 7.54 |
| () | |
| EW(Mg II) (Å) | |
| EW(Fe II) (Å) | |
| FWHM(Mg II) () | |
| Estimate | |
References. — Onoue et al. (2020), where the adopted values of the cosmological parameters are the same as in this paper.

In Sameshima et al. (2020), we demonstrated that the measured EWs need to be corrected for the Eddington ratio dependence and Baldwin effect by the following equation before comparing with the photoionization model:
| (1) |
Here, and are the fiducial values of the Eddington ratio and monochromatic luminosity at 3000 Å, respectively. Because the dependence of the Eddington ratio on redshift is only slight, the median value of the quasar sample at retrieved from the Sloan Digital Sky Survey (SDSS) Data Release 7, , was used as the fiducial value independent of redshift. On the other hand, since the quasar luminosity evolves significantly with redshift, we adopted the characteristic luminosity () of the quasar luminosity function (QLF) obtained from the SDSS-III Data Release 9 (Ross et al. 2013) as the fiducial value to estimate [Mg/Fe] and [Fe/H] of quasars at . However, because the QLF of Ross et al. (2013) covers only up to , it would be inappropriate to extrapolate and apply it to ULAS J1342. Recently, Shen et al. (2020) compiled observed quasar data at various wavelengths which were obtained over the past decades and are available up to . The redshift evolution of in their “Global fit A” model is written as:
| (2) |
where , and . Figure 1 compares the form of this redshift evolution of with of ULAS J1342 and our previously analyzed low-redshift quasars (Sameshima et al. 2017, 2020). In the figure, we have kept the form of the “Global fit A” model, but scaled it to match of the SDSS sample at . In the current situation, where the luminosity evolution of quasars at is unclear, the most natural approach is to extrapolate and apply the “Global fit A” model to ULAS J1342. Thus, the fiducial luminosity in Equation (1) can be written as:
| (3) |
where and corresponds to the scaling factor. Note that at , the redshift evolution of is almost the same in both Ross et al. (2013) and Shen et al. (2020). Thus, adopting the latter does not affect the conclusion in Sameshima et al. (2020).
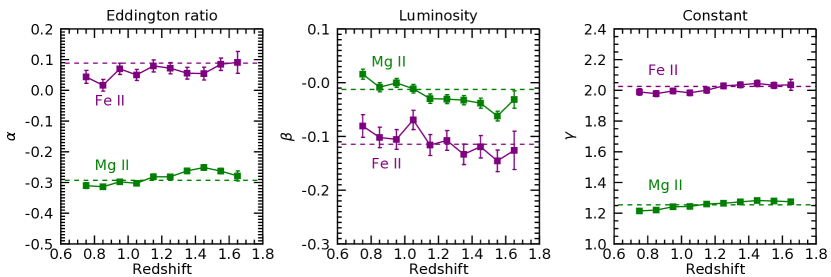
The exponents and in Equation (1) are obtained by fitting the SDSS data at as in Sameshima et al. (2020) with the following equation:
| (4) |
The fitting results are shown in Figure 2. Both exponents and exhibit no significant evolution with respect to redshift.333In Sameshima et al. (2020), we obtained fitting results that did not rule out the possibility of redshift evolution of at . However, after rechecking, we found that this was due to the fact that the least-squares fitting was heavily influenced by outliers. In this paper, we performed the fitting after excluding the obvious outliers. For the redshift evolution of (i.e., the Baldwin effect), it has been reported that there is no evolution up to in C IV (Xu et al. 2008 (SDSS Data Release 5); Bian et al. 2012 (SDSS Data Release 7)). Under these circumstances, it is natural to assume that and do not undergo redshift evolution. For the SDSS quasars in the range , we obtain values of for Mg II and for Fe II, which are shown as dashed lines in Figure 2. In the present study, these values are applied to all samples including ULAS J1342.
By applying the corrected EWs obtained from Equation (1) to the abundance diagnostic diagram (see Figure 9 in Sameshima et al. 2020), we obtained for ULAS J1342. The errors were estimated through Monte Carlo simulations by randomizing the observables of Onoue et al. (2020) based on their measurement errors. In addition to ULAS J1342, similarly measured abundances for the low-redshift quasars analyzed by Sameshima et al. (2017, 2020) are listed in Table 2.
2.2 Comparison with Previous Studies
| Sample | Redshift | [Mg/Fe] | [Fe/H] |
|---|---|---|---|
| SDSS | 0.60–0.75 | ||
| SDSS | 0.75–0.90 | ||
| SDSS | 0.90–1.05 | ||
| SDSS | 1.05–1.20 | ||
| SDSS | 1.20–1.35 | ||
| SDSS | 1.35–1.50 | ||
| SDSS | 1.50–1.75 | ||
| NTT | 2.7 | ||
| ULAS J1342 | 7.54 |
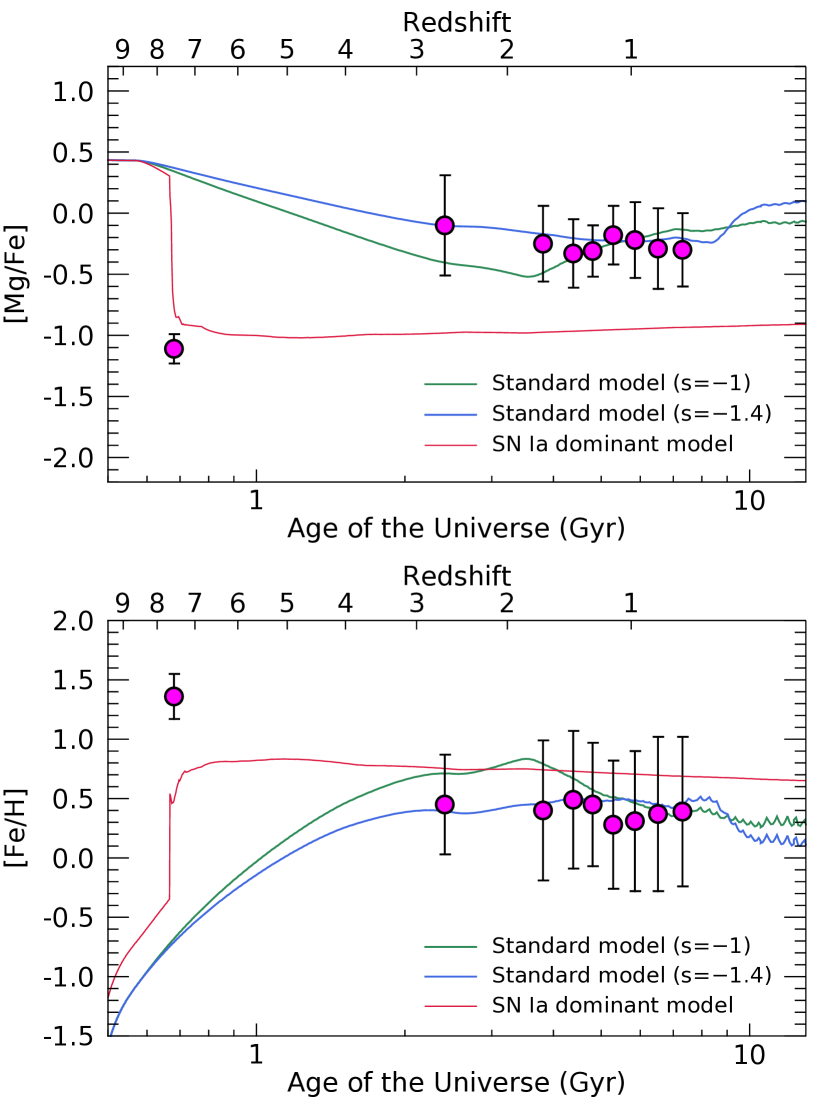
Figure 3 shows [Mg/Fe] and [Fe/H] as a function of the age of the universe, for predictions of chemical evolution models of elliptical galaxies, which are thought to host quasars, and measurements of quasars from Sameshima et al. (2017, 2020). The details of the chemical evolution models will be described in the next subsection (§2.3). In addition to ULAS J1342 at , quasar data at from Sameshima et al. (2017, 2020) are also plotted for comparison. Other high-redshift quasar data such as De Rosa et al. (2011, 2014) and Mazzucchelli et al. (2017) are not plotted in this figure because their results used the Fe II template of Vestergaard & Wilkes (2001) instead of Tsuzuki et al. (2006), and thus direct comparison would not be appropriate. Note that Onoue et al. (2020) reported that the Mg II flux of ULAS J1342 was enhanced by % when the Fe II template of Vestergaard & Wilkes (2001) was used instead of Tsuzuki et al. (2006). This is because the purely empirical approach taken by Vestergaard & Wilkes (2001), makes it difficult to accurately estimate the contribution of Fe II in the wavelength range blended with Mg II, and it significantly underestimates the Fe II flux around Mg II compared to the semi-empirical Fe II template of Tsuzuki et al. (2006) obtained through photoionization simulation.
Previously, based on the accumulation of Mg II/Fe II flux ratio measurements of quasars at various redshifts, many researchers (e.g., De Rosa et al. 2011; Mazzucchelli et al. 2017; Shin et al. 2019; Onoue et al. 2020; Schindler et al. 2020) claimed that, despite a large scatter in the measurements, there was apparently no redshift evolution in Mg II/Fe II over a wide range of . However, when the Mg II/Fe II flux ratios are converted to more physically meaningful [Mg/Fe] abundance ratios, we emphasize that there indeed appears a large difference in [Mg/Fe] between ULAS J1342 () and quasars at (the approximate range of extends from to ), and this difference exceeds the uncertainties associated with Mg II/Fe II measurements and their conversion to [Mg/Fe].
2.3 Standard Chemical Evolution for Host Elliptical Galaxies
In this section, we examine whether the heavy elements in the quasar BLR originate from chemical evolution in the host elliptical galaxy. For this purpose, it is not necessary to consider the possibility of heavy-element formation in the BLR, but rather decouple that region and consider chemical evolution only in the surrounding core region of the host elliptical galaxy. Since elliptical galaxies form early with a very large merging rate, star formation in the core region begins in a burst. However, the gravitational potential is so large that gas does not flow out of the core and will be used again in the next formation of stars therein.
In general, it has been widely accepted that the global trend of chemical evolution over galactic scales is well described in terms of spatially coarse averaging of heavy-element abundances as a function of time (e.g., see the reviews by Matteucci 2012, 2021). In the case of elliptical galaxies, such a so-called one-zone model applies over the core scale of a few kpc. However, if we look into chemical phenomena occurring on small scales without averaging, there is a large spatial inhomogeneity in [Fe/H] of the local gas due to the asymmetric explosion of SNe (e.g., Müller et al. 2019), associated later with mechanical and radiative feedbacks (e.g., Whalen et al. 2008; O’Shea & Whalen 2010) as well as inhomogeneous metal mixing and dilution (e.g., Chiaki et al. 2018), etc.444The possibility of deriving information about the global chemical evolution of galaxies from the correlation analysis of the chemical abundance dispersion of stars and the interstellar medium is described in Krumholz & Ting (2018).
In describing the chemical evolution of galaxies, the inhomogeneity effect is remarkable in low-density environments. However, in high-density environments considered in this section, the inhomogeneity effect is much more suppressed, so that coarse averaging of heavy-element abundances obtained over the core scale would trace the global trend of chemical evolution in the core. In the following, with the above limitations of spatial averaging in mind, we calculate the standard model of chemical evolution for elliptical galaxies hosting quasars.
The heavy elements observed in the host elliptical galaxy are thought to be the result of chemical evolution driven by repetitive cycles of active formation of stars and explosions of SN. The first stars are the Pop III stars. They form from metal-free gas by hydrogen cooling. The massive stars among them explode as SNe ejecting the first heavy elements into the interstellar medium (ISM). Next, the ultra metal-poor stars of Pop II form, initially by hydrogen cooling, from gas with almost no heavy elements. The massive stars among them explode as SNe, further increasing the amount of heavy elements in the ISM. When the heavy-element cooling supersedes the hydrogen cooling in the ISM, the formation of metal-poor Pop II stars is promoted. This changeover from the hydrogen cooling to heavy-element cooling occurs at (Silk 1977; Yoshii & Sabano 1980; Bromm et al. 2001).
The gas density at star-forming sites is – from the ambient medium to molecular clouds in galaxies, and the velocity dispersion of the gas is typically – (e.g., Snow & McCall 2006). The SN, wherever it explodes, sweeps out the surrounding gas to form a dense, expanding shell, and the heavy-element yields of SN ejecta are mixed into the shell (e.g., Cioffi et al. 1988; Shigeyama & Tsujimoto 1998). The expansion of the shell is halted by the turbulent pressure of the surrounding gas. Eventually, the shell breaks due to the Helmholtz-Kelvin instability on the shell surface or by encountering neighboring shells. Then, the high-density gas in the shell falls back, and the spherical volume surrounded by the shell is filled with diluted gas. In this way, heavy elements diffuse throughout space, gradually concentrating towards the galaxy center and being fed into the BLR gas illuminated by the central engine.
According to nucleosynthesis calculations, the -element and iron yields of the ejecta of a core-collapse supernova (CCSN) in the mass range of are largely independent of the original metallicity of its progenitor, even if it had zero metals (Umeda & Nomoto 2002; Tominaga et al. 2007; Heger & Woosley 2010). Furthermore, assuming the Salpeter IMF (), the IMF-weighted theoretical yields reproduce the observed value of for metal-poor Pop II stars in the solar neighborhood and in local galaxies (e.g., Tolstoy et al. 2009). However, we note that all stars in the 10–100 mass range that are CCSNe progenitors do not necessarily explode and contribute to chemical enrichment (Ishigaki et al. 2018). Stars that do not explode but become direct black holes are generally distributed discretely in the 15 mass range (e.g., O’Connor & Ott 2011; Pejcha & Thompson 2015; Kresse et al. 2021). In the case of exploding stars, the yield ratio does not depend much on the progenitor mass. Therefore, the IMF-averaged yield ratio remains almost unchanged even when non-exploding stars are taken into account, and does not affect the chemical evolution of galaxies.
Early in chemical evolution, a large amount of iron starts to be supplied by SNe Ia at (Tsujimoto et al. 1995; Yoshii et al. 1996), where is the age of the universe, is the age at which a galaxy was formed and Pop III stars were born, and is the lifetime of SN Ia which is much longer than CCSN. Since the significant iron enrichment is delayed by compared to -elements from CCSNe, a break occurs in [/Fe] at , and [/Fe] slowly decreases towards low redshift. Such a decreasing trend depends on the delay time distribution (DTD) for SN Ia. The DTD is usually expressed as a power-law function ( 0.1 Gyr), where the slope index is negative and has been reported as (Totani et al. 2008; Maoz et al. 2014) or (Strolger et al. 2020; Chen et al. 2021). The -model is constrained by SNe Ia which appeared in low-redshift galaxies below and is extrapolated to higher redshift in this paper. This extrapolation is not intended to assume that SN Ia progenitors at higher redshift are the same as those at lower redshift, but to remain consistent with the existence of a generally accepted cosmic clock, based on the result that the -model reproduces the break observed in various stellar systems with their expected rates of star formation (the Galactic bulge, the solar neighborhood, and local galaxies; e.g., Matteucci 2012, 2021).
Later in chemical evolution, at , where ( 1 Gyr) is the effective duration of early star formation, no SNe Ia occur anymore, and the mass loss from the intermediate-mass Pop II stars, which were born in large numbers early times, supplies a large amount of material to an ISM that has been already depleted by active star formation in the early stages of chemical evolution. Since this material has a subsolar metallicity, , and the Pop II abundance ratio of , [Fe/H] starts to decrease at and [/Fe] starts to increase. Thus, the chemical evolution model is characterized by three redshifts: , , and .
Figure 3 shows the evolution of [Mg/Fe] and [Fe/H] as a function of the age of the universe predicted by the standard chemical evolution models for the core region of an elliptical galaxy with for two DTD cases of (Gyrs), and (Gyrs). Other parameter values in common are taken from Yoshii et al. (1998), with some updates. Although the two standard models reproduce the lower-redshift quasar data reasonably well for both [Mg/Fe] and [Fe/H] at , it is clear that the standard models significantly overpredict [Mg/Fe] and underpredict [Fe/H] compared to the respective values for ULAS J1342 at . Therefore, the standard models fail to reproduce the higher-redshift quasar data at .
Here, we call attention to the fact that, during the CCSN-dominated early phase until the onset of SN Ia, the [/Fe] of the model is always given by the IMF-averaged CCSN [/Fe] and remains constant (CCSN plateau) at for the Salpeter IMF, regardless of which chemical evolution model is used among different star formation rates with or without merging/outflow. The only difference among such different models is the value of [Fe/H] at which the [/Fe] break occurs, and is irrelevant to examining whether for ULAS J1342 originates from the chemical evolution of host galaxies. Therefore, the failure of reproducing the quasar data at in this section based on elliptical galaxies has a generality that holds for all other types of galaxies.
It is still worth considering a variant model in which the SN Ia ejecta predominate in the early galaxy. This is the case where a galactic wind is generated at , and all the residual gas is expelled outside of the galaxy and the formation of new stars stops. However, the intermediate-mass stars formed earlier continue to release their iron-poor envelopes by mass loss, and SNe Ia eject the iron-rich yield into the galaxy. Accordingly, [Fe/H] rises and [Mg/Fe] drops, immediately after . We run this model with Gyr adjusted to more or less explain for ULAS J1342 at . We note that the galactic wind model described here is constructed only to show the maximum effect possible of SN Ia ejecta. As shown in Figure 3, not only does this extreme model underpredict [Fe/H] at , it cannot also reproduce any of the lower-redshift quasar data at all.555According to Timmes et al. (2003), there is a variation of % in the (Ni) produced by SN Ia. Even if (Ni) increases by 25% within this range, [Fe/H] and [Mg/Fe] change by only dex and dex, respectively. Therefore, the red curve in Figure 3 is almost unaffected.
In conclusion, as far as SNe Ia are considered as the main source that supplies a large amount of iron into the ISM, it is evident that, in the framework of chemical evolution of host elliptical galaxies, there exists no solution that can explain the higher-redshift quasar data at and the lower-redshift quasar data at simultaneously for both [Mg/Fe] and [Fe/H].
3 Alternative Scenario of Pop III Initiated Chemical Evolution
The currently successful paradigm of galactic chemical evolution is that the diversity of observed patterns of heavy-element abundances at various redshifts for a certain type of galaxy would always be reproduced by a properly selected redshift-dependent ratio of the numbers of SN Ia to CCSN that reflects the star formation history considered (Tsujimoto et al. 1995). In fact, the lower-redshift data of [Mg/Fe] and [Fe/H] for quasars at are well reproduced by the standard chemical evolution models of host elliptical galaxies. However, the value of [Mg/Fe] for ULAS J1342 at is far too low to be consistent with these models under this paradigm.
Such an unusually low value of [Mg/Fe] can only be explained by an SN that ejects a much larger iron yield than CCSN. Given that SN Ia was shown to be an unlikely candidate (see §2.3), the most promising candidate is the pair-instability supernova (PISN) caused by the explosion of massive Pop III stars in the mass range of (Umeda & Nomoto 2002; Heger & Woosley 2002). In particular, based on recent nucleosynthesis calculations (Takahashi et al. 2018), the abundance ratio of [Mg/Fe], as a function of the progenitor mass, is indicated by the color-coded rectangular region shown on the upper panel of Figure 4. The horizontal width of this region corresponds to the transition period of cosmic reionization reported to have effectively occurred at (e.g., Planck Collaboration et al. 2020). It is evident from this figure that [Mg/Fe] is the minimum value for the Pop III PISN ejecta, and is not achievable by any other PISNe except the one with 666The Pop III PISN ejecta of rotating progenitors are also calculated by Takahashi et al. (2018); given the mass of progenitor, the value of [Mg/Fe] for the case of rotation is smaller by about dex than that without rotation.. Accordingly, we deduce the PISN near the high-mass end as the iron source to the BLR gas of ULAS J1342 at .
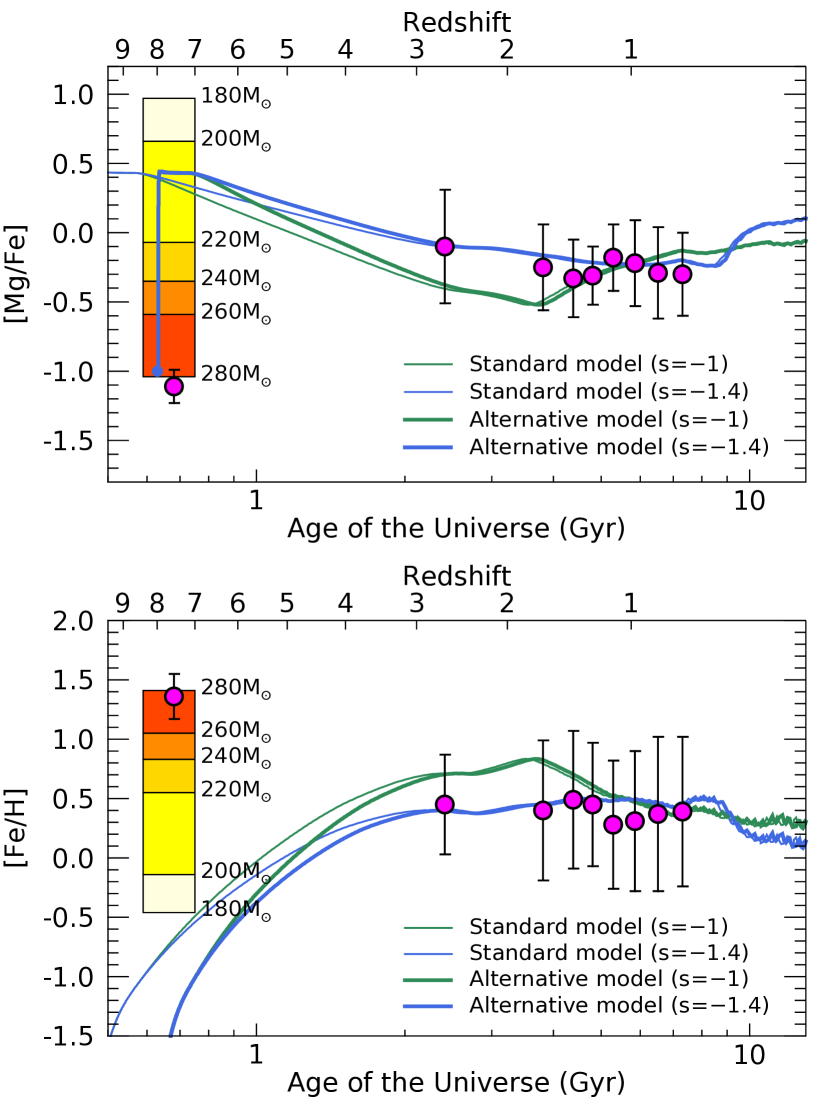
The iron abundance of ULAS J1342 has been estimated to be . On the other hand, the iron yield ejected by a Pop III PISN with is about , and the [Fe/H] of the SN ejecta is several hundred times greater than the solar value. When this super metal-rich ejecta is mixed into the metal-free BLR gas, the BLR mass required for ULAS J1342 to give is about . Then, assuming a BLR mass of , [Fe/H] in the BLR monotonically decreases as the PISN progenitor mass decreases below . This trend is indicated by the color-coded rectangular region shown on the lower panel of Figure 4.
The BLR mass has been estimated so far by several other methods (e.g., Osterbrock 1989; Peterson 1997; Krolik 1999). Their results are very different from each other, and the BLR mass is still a poorly understood quantity. In Baldwin et al. (2003), the BLR is considered to have multiple components, and its mass depends on the monochromatic luminosity at 1450 Å (). Inserting measured from the spectrum of ULAS J1342777Since Onoue et al. (2020) did not provide a value for , we roughly estimated from their spectrum in Figure 1 by eye. into their formula gives a BLR mass in the revised range of , consistent with our estimate of .
We note that the gas density and velocity dispersion of the BLR are (e.g., Ferland et al. 1992; Sameshima et al. 2017) and (e.g., Peterson 2006; Shen et al. 2011), respectively. These values are many orders of magnitude greater than those at the star-forming sites in galaxies, making it impossible for a new star to be born in the BLR. Instead, it is conceivable that a massive Pop III star, which eventually explodes as Pop III PISN, would be formed synchronously with the processes by which the broadly distributed metal-free gas accumulates to create a massive black hole (BH) at the very center of a protogalactic clump.
In this situation, the explosion of Pop III PISN in the extremely dense gas, which is later illuminated by the central engine to become a BLR, is the first and last Pop III event of the quasar to which this BLR belongs. Once it explodes, the heavy-element yields from this SN accumulate in the shocked gas around the SN (e.g., Terlevich et al. 1992; Jiménez et al. 2019), and are immediately mixed with the entire metal-free BLR gas, through the destruction of shock front due to hydrodynamical instabilities in the late phase of its expansion. Subsequently, it is expected that large-scale mixing of the metal-enriched BLR gas would collectively occur over a scale of protogalactic clumps that grow by gravitational aggregation. When the average value of the amount of heavy elements in such clumps is raised to , the heavy-element cooling supersedes the hydrogen cooling and starts to effectively form extremely metal-poor Pop II stars in sufficiently cool and quiescent regions. On the other hand, the abundance ratio of [Mg/Fe] in the BLR is preserved during the process of large-scale mixing, because this mixing would not be considered as proceeding differently among different heavy elements.
As a rough sketch of our alternative scenario leading to the chemical evolution in the inner core region of an elliptical galaxy, which is thought to host ULAS J1342, we assume that a massive Pop III star with 280Ms forms first in the central region of a protogalactic clump of dense gas, and explodes at the end of lifetime of 2 Myr as PISN (Schaerer 2002). Its heavy-element ejecta with (Takahashi et al. 2018) is mixed throughout the surrounding dense gas. Strong UV radiation from the central engine is then generated by the gas infall which grows the central BH through the accretion disk, and illuminates the surrounding dense gas which thereafter becomes a BLR. The mass decrease in the BLR by the infall is replenished by mass supply from the inner core that surrounds the BLR from outside. The cycle of mass decrease and supply keeps the central engine running as long as the infall continues.
At the same time, a part of the gas infall is reversed to drive the outflow from active galactic nucleus (AGN) (e.g., Sibasish et al. 2021). This outflow as well as others by large-scale mixing is contaminated in the reservoir of a host galaxy, and some fraction of the gas therein is expected to move inwards by angular momentum transport to the scale of inner core of a host galaxy (e.g., Inayoshi et al. 2020). Such a gas circulation increases the iron abundance in the core gas above to promote the efficient formation of Pop II stars.
After such a transition to Pop II star formation above , PISN events only rarely occur, if any at all, and numerous Pop II CCSNe dominate. Therefore, the core gas is enriched by CCSNe with , and the inflow of this gas into the BLR makes the nucleosynthetic signature of the Pop III PISN dissapear. In other words, the visibility time, such that the Pop III PISN signature with remains dominant since its explosion in the BLR of ULAS J1342, corresponds to at least the lifetime of the stars in the higher-mass portion of the IMF among all CCSN progenitors with , which is about 3 Myr for (Schaerer 2002). We will discuss the consequence of this visibility time in §4.
Based on the above consideration, Figure 4 shows the evolution of [Mg/Fe] and [Fe/H] as a function of the age of the universe, predicted by the alternative chemical evolution models for the core region of an elliptical galaxy for the two DTD cases of and , but for the initial conditions at set to as given and as measured for the BLR of ULAS J1342. For the purpose of comparison, the standard models in Figure 3 are also shown in this figure. Apparently, the alternative models begin with a sudden rise in [Mg/Fe], immediately reaching the Pop II CCSN plateau level of , and then slowly decline towards a low redshift. Moreover, when compared with the standard models with , the alternative models begin with a steeper rise in [Fe/H] starting from [Fe/H]=-4 at .
Alternative models beginning with different combinations of [Mg/Fe] and are also possible, following the Pop III PISN explosion of massive stars that form below at different redshifts in the transition period of cosmic reionization. Therefore, future observations of quasars at higher redshifts exceeding are expected to show that such quasars fill in the rectangular regions, as illustrated in the upper and lower panels of Figure 4.
4 Discussion
In this paper, we deduced the origin of in ULAS J1342 as a Pop III PISN with . According to recent nucleosynthesis calculations (Takahashi et al. 2018), the ejecta of this PISN has the lowest [Mg/Fe] value in the mass range of PISN progenitor stars. On the less massive side below , [Mg/Fe] increases monotonically as the mass of PISN progenitor stars decreases. On the more massive side above , [Mg/Fe] becomes much larger, beyond that of a PISN explosion due to the significantly smaller ejecta of iron from CCSN progenitor stars in this mass range. Therefore, in a sample of quasars around , the mass distribution of Pop III stars can be derived from the observed [Mg/Fe] distribution of quasars, using the relationship between [Mg/Fe] of the ejecta and progenitor mass of Pop III PISNe.
According to 3D cosmological simulations over by Hirano et al. (2015), the predicted mass distribution of Pop III stars formed predominately by cooling below has a peak around .888The mass distribution of Pop III stars born from the primordial gas also has a peak at mass , which is produced by HD cooling (Hirano et al. 2015; see also Chiaki et al. 2018). Pop III stars belonging to this peak are CCSN progenitors, and the ejecta is , thus for ULAS J1342 cannot be explained. The location of this peak is not very dependent on the range of redshift in which Pop III stars were formed, nor on whether the effect of external UV radiation during the formation of Pop III stars is taken into account in the simulations. Note that the mass distribution has a shape with an asymmetrical decline away from the peak; on the massive side, it declines more rapidly than on the less massive side. To compare future observations with cosmological simulations, we need to carefully examine various biases in assessing the rate of detecting high-redshift quasars and the rate of hosting Pop III stars in protogalactic clumps. However, if future quasar observations reveal a sign of the peaked mass distribution of Pop III stars, it will certainly impose constraints on the modeling of structure formation in the universe.
If the heavy elements in quasars at originated from Pop III PISNe, the quasars in the diagram are expected to be distributed in the vertical direction of the rectangular region from to , reflecting the mass range of the PISN progenitor stars. On the other hand, cosmological simulations show that not all primordial halos of accompany the formation of massive Pop III stars of (e.g., Hirano et al. 2015, Xu et al. 2016). Those halos without Pop III stars assemble into protogalactic clumps that undergo the chemical evolution driven by the cycles of formation of stars and explosion of CCSN and SN Ia. Then, the quasars, triggered to turn on in the central region of host elliptical galaxies, are distributed like a ridge along the standard chemical evolution models, from which the [Mg/Fe] break can be constrained (Sameshima et al. 2017, 2020).
It is interesting to note that, for a fairly large sample of quasars at , we expect to see a distinctive cross-shaped feature in the diagram where two different quasar distributions intersect with each other at right angles. The vertical and horizontal distributions correspond to quasars for which heavy elements originate from Pop III PISNe and host elliptical galaxies, respectively. If this is confirmed, the [Mg/Fe] break will be buried at the intersection of the two distributions, making it difficult to accurately determine the redshift of the [Mg/Fe] break without separating the quasars that belong to different distributions. This separation is a future issue, but it seems possible by measuring the abundance ratio of heavy elements other than [Mg/Fe].
The reliability of the idea that heavy elements in quasars originate from two sources of Pop III PISNe and host elliptical galaxies depends on whether a large-scale mixing of Pop III ejecta can increase the average heavy-element abundance of primordial gas to , which activates star formation and promotes chemical evolution in protogalactic clumps distributed over a scale of Mpc in the universe.
The comoving baryon density of the Big Bang cosmology can be expressed as , where is constrained from the Big Bang nucleosynthesis and given by from observations of light elements (Tytler et al. 2000) and the CMB (Planck Collaboration et al. 2020). On the other hand, if heavy elements in ULAS J1342 during cosmic reionization originate from a Pop III PISN with , the iron yield of its ejecta is about , which can raise the metallicity to when mixed with a primordial gas of . In other words, the number of such SNe required to make for a primordial gas of cube is only about 20, and the average separation between SNe is about 400 kpc. Note that the required number of PISNe is much larger if a Salpeter-like mass function is assumed and more weight is given on the smaller iron yield from PISNe below (e.g., Matteucci & Calura 2005).
The above argument assumes that a large-scale mixing of heavy elements over a scale of Mpc would operate to achieve a homogeneous metallicity distribution in the universe. However, this scale is not reached by conceivable processes such as a hydrodynamical mixing associated with gravitational aggregation into protogalactic clumps. Therefore, in reality, the metal enrichment beyond is localized in space, and the metallicity distribution in the universe becomes necessarily inhomogeneous. According to cosmological simulations, the degree of inhomogeneity is measured by the fraction of the volume in the universe occupied by gas of pristine composition. This fraction is estimated to exceed 80% at (Xu et al. 2016; see also the review by Norman et al. 2018), providing the possibility for the formation of Pop III stars in a significant range of redshifts around .
According to explosive nucleosynthesis calculations, the [Mg/Fe] ratio used to deduce a Pop III PISN with in this paper does depend on the progenitor mass. However, various other abundance ratios have been proposed that do not depend much on the progenitor mass. When measured by the flux-to-abundance conversion described in this paper, such other ratios in the BLR are expected to show a Pop III PISN-characteristic, such as a high ratio of [Si/Mg] for the large Si excess and a low ratio of [Al/Mg] for the odd-even effect (Takahashi et al. 2018). Furthermore, PISN models with the initial metallicity of show an -element abundance pattern similar to Pop III PISN, but with the significantly weaker odd-even effect (Kozyreva et al. 2014). The emission lines of Si IV and Al III are not far from the Mg II and the UV Fe II bump in . Therefore, all these lines are simultaneously observed in the near-infrared spectrum of quasars at , avoiding systematic errors due to the use of different instruments and telescopes, so that the [Si/Mg] and [Al/Mg] ratios for the BLR can be measured with high reliability and will hopefully agree with those theoretically predicted for Pop III PISNe. The above follow-up studies should strongly confirm the existence of a Pop III PISN not only with in particular, but also over the range of in general.
The PISN event rate (ER) is proportional to a product of visibility time and PISN occurrence rate density (e.g., Scannapieco et al. 2005). In §3, we estimate that the visibility time for the nucleosynthetic PISN signature in the BLR of ULAS J1342 is at least 3 Myr, which is about six orders of magnitude longer than the visibility time for the photometric PISN signature (about 1yr in the source frame), based on the theoretical light curve immediately after the explosion of PISN (Kasen et al. 2011; Whalen et al. 2014; Hartwig et al. 2018b). On the other hand, the PISN occurrence rate density for a population of quasars or galaxies that do not harbor a quasar at the galaxy center, is assumed to be proportional to the number density of each population if the survey area is common. Using the normalisation factor of the luminosity function (LF), we tentatively obtain (quasar)/(galaxy) at (quasar LF: Matsuoka et al. 2018; galaxy LF: Bouwens et al. 2015a), though this value is possibly underestimated, because the observation of quasar LF at is still ongoing. Thus, the PISN ER, for which the candidate sites of PISNe have already been targeted to quasars, is at least a few hundred times larger than that for the blind deep survey of galaxies. As a result, our finding in this paper of a Pop III PISN signature in a high-redshift quasar of ULAS J1342 is not unlikely.
The existence of a massive Pop III star at high redshift, if confirmed, may impact ongoing searches for signatures of massive Pop III stars imprinted on the heavy-element abundance patterns of second-generation stars in the Galaxy. Current search strategies encounter difficulties in how to identify true second-generation stars from a sample of very metal-poor (VMP; ) or EMP () stars. The correlation between the metallicity of a star and the age of the Galaxy at its birth is not considered to hold as the metallicity decreases below [Fe/H] (Shigeyama & Tsujimoto 1998). Since selecting EMP stars does not necessarily mean dating back in time to the second-generation stars, the nucleosynthetic features of massive Pop III stars may not be constrained from the heavy-element abundance patterns of the such stars. However, if true second-generation stars can indeed be selected, the type of Pop III SNe responsible for their observed abundance patterns can be specified. Then, the IMF of the Pop III progenitors can be derived from the variety of these patterns, which depend on the progenitor mass of Pop III SNe.
If the result of Pop III PISN in this paper is applicable to the Milky Way, the [Mg/Fe] abundance ratios of second-generation stars range over [Mg/Fe] , depending on the progenitor mass of PISNe in the range of (Takahashi et al. 2018). On the other hand, their [Fe/H] values would be distributed in some range, depending on how much the super metal-rich iron yield of PISN ejecta was diluted by being mixed with gas of pristine composition before a favorable environment for formation of second-generation stars was achieved. Their range of [Fe/H] can then be estimated from the VMP stars that have much smaller values of [Mg/Fe] than the observed average of [Mg/Fe] for the VMP stars. In this way, a sample of candidate second-generation stars may be obtained by selecting the stars in the estimated range of [Fe/H], and further separating them into the PISN or CCSN origin according to their theoretical heavy-element abundance patterns.
In a previous result along this line, Aoki et al. (2014) reported that the VMP star SDSS J0018-0939 has a very low [C/Fe], as well as significantly low [Mg/Fe] and [Co/Fe] ratios, and is best fit to the theoretical PISN abundance pattern. At present, this is the only one reported case of a star in the Galaxy showing signs of PISN, but this may be because there is no positive motivation to consider a star with an observationally low [Mg/Fe] as a second-generation star. New-generation photometric surveys, such as J-PLUS (Cenarro et al. 2019) and S-PLUS (Mendes de Oliveira et al. 2019; Whitten et al. 2021), which employ multiple narrow-band filters (including filters centered on C and Mg features) in combination with wider-band filters, are currently underway, and have the potential to efficiently identify stars with very low [Mg/Fe] at all metallicities. Eventual derivation of the Pop III IMF from the [Mg/Fe]-selected PISN sample of VMP/EMP stars discovered in these surveys will certainly be a future challenge for Galactic astronomy.
5 Caveats and Alternative Interpretations
5.1 Pop III CCSN with
In order to better constrain the origin of in ULAS J1342, it is worth considering other sources to account for significant iron ejection from Pop III SNe. The upper limit of the mass range for first stars is uncertain, but the possibility of has been pointed out by a number of authors. Explosions of the very massive stars in this range require a collapsar-powered engine. Assuming the jet energy injection from the accretion disk, and setting the jet parameters to cause the star to explode successfully, Ohkubo et al. (2006) performed explosive nucleosynthesis calculations of Pop III CCSNe with 500 and 1,000 . While the nucleosynthesis of such a collapsar model is highly uncertain, it is worth mentioning that their 1,000 model (A-1), among others, interestingly gives , which explains the of ULAS J1342. However, the BLR mass that can explain is about , which is even smaller than the progenitor mass, and far below the acceptable range by Baldwin et al. (2003), and therefore unlikely. In addition, the cosmological simulations by Hirano et al. (2015) identified the formation of 1540 primordial gas clouds, of which only two Pop III stars larger than were formed and associated with such clouds. It is unlikely that this extremely rare case occurred in ULAS J1342.
A more direct distinction between Pop III PISN with and Pop III CCSN with (A-1) can be made by measuring [Si/Fe] using Si emission lines. In practice, since Si IV , the strongest Si emission line in the UV wavelength of a quasar spectrum, is blended with [O IV] , only an upper limit of Si IV flux can be obtained. Therefore, it is more realistic to measure the blended line flux of Si IV+[O IV]. As shown in Table 5.1, even in this case, the difference in [(Si+O)/Fe] between Pop III PISNe with and Pop III CCSNe with based on nucleosynthesis calculations is large enough to be distinguished by observation. EW(Si IV+[O IV]) can be measured from the NIR spectrum of ULAS J1342, and [(Si+O)/Fe] can be derived by constructing the Si IV+[O IV] flux to the abundance conversion grid using our method (§2.1). It is important to emphasize that our result that the heavy elements in ULAS J1342 are of Pop III SN origin remains unchanged irrespective of either candidate.
5.2 A SNe Ia Cluster Model
In §2.3, we excluded SNe Ia, a recognized major source of iron, from the candidates explaining the observation of such an unusually low ratio of in the BLR of ULAS J1342 at . This exclusion was made because the iron in the BLR was assumed to originate from the early chemical evolution of an elliptical galaxy hosting ULAS J1342, and even the maximum possible iron contribution from CCSN + SN Ia was found unable to reproduce the observation of (see Fig.3). However, if the iron in the BLR did not originate from the host galaxy, but solely from SNe Ia in the BLR, it is still worth considering a SN Ia with theoretical ejecta of (Nomoto et al. 1997; Iwamoto et al. 1999).
In fact, it has long been pointed out that a white dwarf (WD) of near-Chandrasekhar mass is caused to explode as a SN Ia by the tidal disruption when passing close to a BH (Luminet & Pichon 1989; Wilson & Mathews 2004). Should this phenomenon actually occur near the massive BH at the center of a high-redshift galaxy, the BLR might be a unique site exhibiting the nucleosynthetic features solely from SNe Ia. On the other hand, the iron yield from one SN Ia is , which is only about one hundredth of the iron yield from one PISN with . Moreover, the BLR mass required by one SN Ia to explain the observation of by dilution is also only about one-hundredth of the BLR mass estimated in this paper (§3). Consequently, a cluster consisting of 100 SNe Ia in the BLR, though highly speculative, would lead to more or less the same result as one PISN with .
The problem of distinguishing such a SNe Ia cluster from a PISN can be solved by comparing their heavy-element abundance ratios (other than [Mg/Fe]), notably , which exhibits an odd-even effect. Nucleosynthesis calculations give for Pop III PISN with almost no dependence on progenitor mass (Takahashi et al. 2018), while for SNe Ia, with almost no dependence on the WD model (Iwamoto et al. 1999). It is therefore expected that this significant difference in could provide a clear distinction between SNe Ia and a PISN. In the near-infrared spectrum of ULAS J1342 at , the emission lines of Al III and Mg II are both visible, and their EWs can be measured. However, an idea of SNe Ia cluster remains speculative, as depends on it being reliably measured by converting the heavy-element EWs to their abundances by our method (§2.1).
5.3 A Single Stellar Population (SSP) Model
The formation and early evolution of galaxies have usually been discussed from various aspects, based on the so-called single stellar population (SSP) model (e.g., Schaerer 2002; Hartwig et al. 2018b). In this model, Pop III stars are assumed to form instantly on short timescales according to a log flat or Salpeter-like IMF, and Pop III stars end their life as SNe sequentially from massive to less-massive stars. When the IMF is extended to the mass range of PISN progenitor stars (), they all end their life at once because their lifetime is estimated as 2 Myr, independent of their progenitor mass (Schaerer 2002). In this case, different amounts of heavy-element yields from PISNe with different progenitor masses are all mixed together in the gas, so that the heavy-element abundance pattern characteristic of PISNe at the high-mass end cannot dominate, contrary to our interpretation of the observation of based on a Pop III PISN with .
Currently, there has been no confirmation that the SSP model is applicable to the BLR gas, nor, in the first place, that stars can actually form from the BLR gas having extreme density () and velocity dispersion (), which are completely different from normal star-forming sites in galaxies. On the other hand, it has been reported from cosmological simulations that the rapid gas infall towards the center of a primordial star-forming cloud and the accretion onto the central stellar core form one massive Pop III star per each star-forming cloud (Hirano et al. 2015). According to this study, the mass distribution for an ensemble of massive Pop III stars in the universe has a peak around the high-mass end of Pop III PISN, consistent with our interpretation of . If massive Pop III stars with form only via such specific processes, detection strategies so far for PISNe may necessarily be affected. Research along this line is required in the future.
6 Summary and Conclusion
Using the NIR spectrum of the quasar ULAS J1342 at , we have estimated the chemical abundance at BLR to be and . This paper is summarized as follows:
-
1.
Our abundance diagnostic method requires correction for the luminosity dependence of the EW, but there is still uncertainty as to how the fiducial luminosity should be set at . In this study, we extrapolated the results of Shen et al. (2020), which give characteristic luminosities up to , and applied them to ULAS J1342.
-
2.
The estimated value of for ULAS J1342 was found to be significantly different from , which exceeds the uncertainties associated with Mg II/Fe II measurements and their conversion to [Mg/Fe]. ULAS J1342 seems to be richer in iron than quasars at .
-
3.
The standard model in the core region of an elliptical galaxy hosting a quasar, which takes into account SN Ia and CCSN, cannot explain [Mg/Fe] and [Fe/H] of ULAS J1342. This conclusion based on elliptical galaxies has a generality, regardless of which chemical evolution model is used among different star formation rates with or without merging/outflow.
-
4.
By considering another source of iron supply by PISNe in Pop III stars, we have deduced that the origin of in ULAS J1342 is a Pop III PISN with . The mass of BLR required to reproduce is about , which is consistent with the range suggested by the detailed photoionization simulation of Baldwin et al. (2003).
-
5.
In the diagram, quasars of Pop III PISN origin are distributed vertically at high redshift, depending on the mass of the PISN progenitor, whereas quasars reflecting the chemical evolution of host elliptical galaxies are distributed horizontally. These distributions are expected to intersect at , and the previously considered [Mg/Fe] break may be buried in this intersection and difficult to identify.
-
6.
Another possible candidate for the iron supply to ULAS J1342 is the CCSN of a massive Pop III star with . In this case, however, the expected BLR mass would be , which is much smaller than suggested by other studies. In addition, cosmological simulations indicate that Pop III stars with 1000 are extremely rare and their signature is unlikely to be found by chance in ULAS J1342.
-
7.
The silicon to iron abundance ratio [Si/Fe] in the BLR of ULAS J1342, if evaluated, enables one to distinguish whether the heavy elements originated from a Pop III PISN or a Pop III CCSN. One candidate Si line to measure is Si IV , which is the strongest silicon emission line seen in the UV spectrum of quasars.
-
8.
Various abundance ratios in the BLR are expected to show a Pop III PISN-characteristic, such as a high ratio of [Si/Mg] for the large Si excess and a low ratio of [Al/Mg] for the odd-even effect. All these heavy-element emission lines are simultaneously observed in the near-infrared spectrum of QSOs at , so that the [Si/Mg] and [Al/Mg] ratios for the BLR should provide additional confirmation of the existence of the Pop III PISNe.
The existence of a massive Pop III star of PISN progenitor at high redshift, if confirmed, may also impact ongoing searches for signatures of massive Pop III stars in the Galaxy. The VMP stars with heavy-element abundance patterns of Pop III PISN origin are expected to have very low [Mg/Fe] compared to the observed average for VMP stars in the halo. Discovering such stars by new generation surveys may result in eventual derivation of the Pop III IMF in the Galaxy, complementing similar approaches based on future observational studies of quasars at high redshifts.
acknowledgments
We thank an anonymous referee for the careful and detailed review of our manuscript, which helped to clarify the presentation. H.S. is supported by the Japan Society for the Promotion of Science (JSPS) KAKENHI Grant Number 19K03917 and 22K03683. T.T. is supported by JSPS KAKENHI 18H01258 and 19H05811, and T.S. by 20H05639. T.C.B. acknowledges partial support from grant PHY 14-30152, Physics Frontier Center/JINA Center for the Evolution of the Elements (JINA-CEE), awarded by the US National Science Foundation, and the US National Science Foundation under Grant No. OISE-1927130 (IReNA).
Funding for the SDSS and SDSS-II has been provided by the Alfred P. Sloan Foundation, the Participating Institutions, the National Science Foundation, the U.S. Department of Energy, the National Aeronautics and Space Administration, the Japanese Monbukagakusho, the Max Planck Society, and the Higher Education Funding Council for England. The SDSS Web Site is http://www.sdss.org/.
The SDSS is managed by the Astrophysical Research Consortium for the Participating Institutions. The Participating Institutions are the American Museum of Natural History, Astrophysical Institute Potsdam, University of Basel, University of Cambridge, Case Western Reserve University, University of Chicago, Drexel University, Fermilab, the Institute for Advanced Study, the Japan Participation Group, Johns Hopkins University, the Joint Institute for Nuclear Astrophysics, the Kavli Institute for Particle Astrophysics and Cosmology, the Korean Scientist Group, the Chinese Academy of Sciences (LAMOST), Los Alamos National Laboratory, the Max-Planck-Institute for Astronomy (MPIA), the Max-Planck-Institute for Astrophysics (MPA), New Mexico State University, Ohio State University, University of Pittsburgh, University of Portsmouth, Princeton University, the United States Naval Observatory, and the University of Washington.
References
- Aoki et al. (2014) Aoki, W., Tominaga, N., Beers, T. C., Honda, S., & Lee, Y. S. 2014, Science, 345, 912
- Baldwin et al. (2003) Baldwin, J. A., Ferland, G. J., Korista, K. T., Hamann, F., & Dietrich, M. 2003, ApJ, 582, 590
- Bian et al. (2012) Bian, W.-H., Fang, L.-L., Huang, K.-L., & Wang, J.-M. 2012, MNRAS, 427, 2881
- Bouwens et al. (2015a) Bouwens, R. J., Illingworth, G. D., Oesch, P. A., et al. 2015, ApJ, 803, 34
- Bouwens et al. (2015b) Bouwens, R. J., Illingworth, G. D., Oesch, P. A., et al. 2015, ApJ, 811, 140
- Bromm et al. (2001) Bromm, V., Ferrara, A., Coppi, P. S., & Larson, R. B. 2001, MNRAS, 328, 969
- Bromm & Larson (2004) Bromm, V., & Larson, R. B. 2004, ARA&A, 42, 79
- Bromm et al. (2009) Bromm, V., Yoshida, N., Hernquist, L., & McKee, C. F. Nature, 459, 49
- Cenarro et al. (2019) Cenarro, A. J., Moles, M., Cristóbal-Hornillos, D., et al. 2019, A&A, 622, A176
- Chen et al. (2014) Chen, K.-J., Heger, A., Woosley, S., Almgren, A., & Whalen, D. J. 2014, ApJ, 792, 44
- Chen et al. (2021) Chen, X., Hu, L., & Wang, L. 2021, ApJ, 922, 15
- Chiaki et al. (2018) Chiaki, G., Susa, H., & Hirano, S. 2018, MNRAS, 475, 4378
- Cioffi et al. (1988) Cioffi, D. F., McKee, C. F., & Bertschinger, E. 1988, ApJ, 334, 252
- De Rosa et al. (2011) De Rosa, G., Decarli, R., Walter, F., et al. 2011, ApJ, 739, 56
- De Rosa et al. (2014) De Rosa, G., Venemans, B. P., Decarli, R., et al. 2014, ApJ, 790, 145
- Dong et al. (2011) Dong, X.-B., Wang, J.-G., Ho, L. C., et al. 2011, ApJ, 736, 86
- Dutta et al. (2020) Dutta, J., Sur, S., Stacy, A., & Bagla, J. S. 2020, ApJ, 901, 16
- Fan et al. (2006) Fan, X., Strauss, M. A., Becker, R. H., et al. 2006, AJ, 132, 117
- Ferland et al. (1992) Ferland, G. J., Peterson, B. M., Horne, K., Welsh, W. F., & Nahar, S. N. 1992, ApJ, 387, 95
- Frebel et al. (2005) Frebel, A., Aoki, W., Christlieb, N., et al. 2005, Nature, 434, 871
- Gunn & Peterson (1965) Gunn, J. E., & Peterson, B. A. 1965, ApJ, 142, 1633
- Hartwig et al. (2018a) Hartwig, T., Yoshida, N., Magg, M., et al. 2018a, MNRAS, 478, 1795
- Hartwig et al. (2018b) Hartwig, T., Bromm, V., & Leob, A. 2018b, MNRAS, 479, 2202
- Hartwig et al. (2019) Hartwig, T., Ishigaki, M. N., Klessen, R. S., & Yoshida, N. 2019, MNRAS, 482, 1204
- Hattori et al. (2014) Hattori, K., Yoshii, Y., Beers, T. C., Carollo, D., & Lee, Y. S. 2014, ApJ, 784, 153
- Heger & Woosley (2002) Heger, A., & Woosley, S. E. 2002, ApJ, 567, 532
- Heger & Woosley (2010) —. 2010, ApJ, 724, 341
- Hirano et al. (2015) Hirano, S., Hosokawa, T., Yoshida, N., Omukai, K., & Yorke, H. W. 2015, MNRAS, 448, 568
- Iben (1983) Iben, I., J. 1983, Mem. Soc. Astron. Italiana, 54, 321
- Inayoshi et al. (2020) Inayoshi, K., Visbal, E., & Haiman, Z. 2020, ARA&A, 58, 27
- Ishigaki et al. (2018) Ishigaki, M. N., Tominaga, N., Kobayashi, C., & Nomoto, K. 2018, ApJ, 857, 46
- Ishigaki et al. (2021) Ishigaki, M. N., Hartwig, T., Tarumi, Y., et al. 2021, MNRAS, 506, 5410
- Ishiyama et al. (2016) Ishiyama, T., Sudo, K., Yokoi, S., et al. 2016, ApJ, 826, 9
- Iwamoto et al. (1999) Iwamoto, K., Brachwitz, F., Nomoto, K., et al. 1999, ApJS, 125, 439
- Jiménez et al. (2019) Jiménez, S., Tenorio-Tagle, G., & Silich, S. 2019, MNRAS, 488, 978
- Joggerst et al. (2010) Joggerst, C. C., Almgren, A., Bell, J., et al. 2010, ApJ, 709, 11
- Johnson et al. (2007) Johnson, J. L., Greif, T. H., & Bromm, V. 2010, ApJ, 665, 85
- Karlsson et al. (2013) Karlsson, T., Bromm, V., & Bland-Hawthorn, J. 2013, Reviews of Modern Physics, 85, 809
- Kasen et al. (2011) Kasen, D., Woosley, S. E., & Heger, A. 2011, ApJ, 734, 102
- Kirihara et al. (2019) Kirihara, T., Tanikawa, A., & Ishiyama, T. 2019, MNRAS, 486, 5917
- Kozyreva et al. (2014) Kozyreva, A., Yoon, S.-C., & Langer, N. 2014, A&A, 566, A146
- Kresse et al. (2021) Kresse, D., Ertl, T., & Janka, H.-T. 2021, ApJ, 909, 169
- Krolik (1999) Krolik, J. H. 1999, Active galactic nuclei : from the central black hole to the galactic environment
- Krumholz & Ting (2018) Krumholz, M. R., & Ting, Y.-S. 2018, MNRAS, 475, 2236
- Luminet & Pichon (1989) Luminet, J.-P., & Pichon, B. 1989, Å, 209, 103
- Luo et al. (2015) Luo, A. L., Zhao, Y.-H., Zhao, G., et al. 2015, Research in Astronomy and Astrophysics, 15, 1095
- Madau & Haardt (2015) Madau, P., & Haardt, F. 2015, ApJ, 813, L8
- Majewski et al. (2017) Majewski, S. R., Schiavon, R. P., Frinchaboy, P. M., et al. 2017, AJ, 154, 94
- Maoz et al. (2014) Maoz, D., Mannucci, F., & Nelemans, G. 2014, ARA&A, 52, 107
- Matsuoka et al. (2018) Matsuoka, Y., Strauss, M. A., Kashikawa, N., Onoue, M., & et al. 2018, ApJ, 869, 150
- Matteucci (2012) Matteucci, F. 2012, Chemical Evolution of Galaxies, doi:10.1007/978-3-642-22491-1
- Matteucci (2021) —. 2021, A&A Rev., 29, 5
- Matteucci & Calura (2005) Matteucci, F., & Calura, F. 2005, MNRAS, 360, 447
- Mazzucchelli et al. (2017) Mazzucchelli, C., Bañados, E., Venemans, B. P., et al. 2017, ApJ, 849, 91
- Mendes de Oliveira et al. (2019) Mendes de Oliveira, C., Ribeiro, T., Schoenell, W., et al. 2019, MNRAS, 489, 241
- Mitra et al. (2018) Mitra, S., Choudhury, T. R., & Ferrara, A. 2018, MNRAS, 473, 1416
- Müller et al. (2019) Müller, B., Tauris, T. M., Heger, A., et al. 2019, MNRAS, 484, 3307
- Nakamura & Umemura (1999) Nakamura, F., & Umemura, M. 1999, ApJ, 515, 239
- Nakamura & Umemura (2001) —. 2001, ApJ, 548, 19
- Nomoto et al. (1997) Nomoto, K., Iwamoto, K., Nakasato, N., et al. 1997, Nuclear Physics A, 621, 467
- Nomoto et al. (2013) Nomoto, K., Kobayashi, C., & Tominaga, N. 2013, ARA&A, 51, 457
- Norman et al. (2018) Norman, M. L., Smith, B. D., & Bordner, J. 2018, Frontiers in Astronomy and Space Sciences, 5, 34
- O’Connor & Ott (2011) O’Connor, E., & Ott, C. D. 2011, ApJ, 730, 70
- Ohkubo et al. (2006) Ohkubo, T., Umeda, H., Maeda, K., et al. 2006, ApJ, 645, 1352
- Omukai & Yoshii (2003) Omukai, K., & Yoshii, Y. 2003, ApJ, 599, 746
- Onoue et al. (2020) Onoue, M., Bañados, E., Mazzucchelli, C., et al. 2020, ApJ, 898, 105
- O’Shea & Whalen (2010) O’Shea, B. W., & Whalen, D. J. 2010, in American Institute of Physics Conference Series, Vol. 1294, First Stars and Galaxies: Challenges for the Next Decade, ed. D. J. Whalen, V. Bromm, & N. Yoshida, 128–133
- Osterbrock (1989) Osterbrock, D. E. 1989, Astrophysics of gaseous nebulae and active galactic nuclei
- Pejcha & Thompson (2015) Pejcha, O., & Thompson, T. A. 2015, ApJ, 801, 90
- Peterson (1978) Peterson, B. A. 1978, in Large Scale Structures in the Universe, ed. M. S. Longair & J. Einasto, Vol. 79, 389
- Peterson (1983) Peterson, B. A. 1983, in Early Evolution of the Universe and its Present Structure, ed. G. O. Abell & G. Chincarini, Vol. 104, 349–355
- Peterson (1997) Peterson, B. M. 1997, An Introduction to Active Galactic Nuclei (New York Cambridge University Press)
- Peterson (2006) —. 2006, The Broad-Line Region in Active Galactic Nuclei, ed. D. Alloin, Vol. 693, 77
- Planck Collaboration et al. (2020) Planck Collaboration, Aghanim, N., Akrami, Y., Ashdown, M., et al. 2020, A&A, 641, A6
- Richards et al. (2006) Richards, G. T., Lacy, M., Storrie-Lombardi, L. J., et al. 2006, ApJS, 166, 470
- Rockosi et al. (2021) Rockosi, C. M., Lee, Y. S., Morrison, H. L., et al. 2021, submitted to ApJ
- Ross et al. (2013) Ross, N. P., McGreer, I. D., White, M., et al. 2013, ApJ, 773, 14
- Sabano & Yoshii (1977) Sabano, Y., & Yoshii, Y. 1977, PASJ, 29, 207
- Sameshima et al. (2017) Sameshima, H., Yoshii, Y., & Kawara, K. 2017, ApJ, 834, 203
- Sameshima et al. (2020) Sameshima, H., Yoshii, Y., Matsunaga, N., et al. 2020, ApJ, 904, 162
- Sarmento et al. (2018) Sarmento, R., Scannapieco, E., & Cohen, S. 2018, ApJ, 854, 75
- Sarmento et al. (2019) Sarmento, R., Scannapieco, E., & Côté, B. 2019, ApJ, 871, 206
- Schaerer (2002) Schaerer, D. 2002, A&A, 382, 28
- Scannapieco et al. (2005) Scannapieco, E., Madau, P., Woosley, S., et al. 2005, ApJ, 633, 1031
- Schindler et al. (2020) Schindler, J.-T., Farina, E. P., Bañados, E., et al. 2020, ApJ, 905, 51
- Shen et al. (2020) Shen, X., Hopkins, P. F., Faucher-Giguère, C.-A., et al. 2020, MNRAS, 495, 3252
- Shen et al. (2011) Shen, Y., Richards, G. T., Strauss, M. A., et al. 2011, ApJS, 194, 45
- Sibasish et al. (2021) Sibasish, L., Reynods, C. S., Reeves, J., et al. 2021, Nature Report, 5, 13
- Shigeyama & Tsujimoto (1998) Shigeyama, T., & Tsujimoto, T. 1998, ApJ, 507, L135
- Shin et al. (2019) Shin, J., Nagao, T., Woo, J.-H., & Le, H. A. N. 2019, ApJ, 874, 22
- Silk (1977) Silk, J. 1977, ApJ, 211, 638
- Snow & McCall (2006) Snow, T. P., & McCall, B. J. 2006, ARA&A, 44, 367
- Strolger et al. (2020) Strolger, L.-G., Rodney, S. A., Pacifici, C., Narayan, G., & Graur, O. 2020, ApJ, 890, 140
- Susa et al. (2014) Susa, H., Hasegawa, K., & Tominaga, N. 2014, ApJ, 792, 32
- Takahashi et al. (2018) Takahashi, K., Yoshida, T., & Umeda, H. 2018, ApJ, 857, 111
- Terlevich et al. (1992) Terlevich, R., Tenorio-Tagle, G., Fanco, J., & Melnick, J. 1992, MNRAS, 255, 713
- Timmes et al. (2003) Timmes, F. X., Brown, E. F., & Truran, J. W. 2003, ApJ, 590, L83
- Tolstoy et al. (2009) Tolstoy, E., Hill, V., & Tosi, M. 2009, ARA&A, 47, 371
- Tominaga et al. (2007) Tominaga, N., Umeda, H., & Nomoto, K. 2007, ApJ, 660, 516
- Totani et al. (2008) Totani, T., Morokuma, T., Oda, T., Doi, M., & Yasuda, N. 2008, PASJ, 60, 1327
- Tsujimoto et al. (1995) Tsujimoto, T., Nomoto, K., Yoshii, Y., et al. 1995, MNRAS, 277, 945
- Tsuzuki et al. (2006) Tsuzuki, Y., Kawara, K., Yoshii, Y., et al. 2006, ApJ, 650, 57
- Tytler et al. (2000) Tytler, D., O’Meara, J. M., Suzuki, N., et al. 2000, in The Light Elements and their Evolution, ed. L. da Silva, R. de Medeiros, & M. Spite, Vol. 198, 125
- Umeda & Nomoto (2002) Umeda, H., & Nomoto, K. 2002, ApJ, 565, 385
- Vestergaard & Osmer (2009) Vestergaard, M., & Osmer, P. S. 2009, ApJ, 699, 800
- Vestergaard & Wilkes (2001) Vestergaard, M., & Wilkes, B. J. 2001, ApJS, 134, 1
- Wagoner et al. (1967) Wagoner, R. V., Fowler, W. A., & Hoyle, F. 1967, ApJ, 148, 3
- Wang et al. (2018) Wang, F., Yang, J., Fan, X., et al. 2018, ApJ, 869, L9
- Wang et al. (2021) Wang, F., Yang, J., Fan, X., et al. 2021, ApJ, 907, L1
- Whalen et al. (2008) Whalen, D. J., O’Shea, B. W., Smidt, J., & Norman, M. L. 2008, ApJ, 679, 925
- Whalen et al. (2013) Whalen, D. J., Johnson, J. J., Smidt, J., Meiksin, A., Heger, A., Even, W., & Fryer, C. L. 2014, ApJ, 797, 9
- Whalen et al. (2014) Whalen, D. J., Smidt, J., Heger, A., et al. 2014, ApJ, 797, 9
- Whitten et al. (2021) Whitten, D. D., Placco, V. M., Beers, T. C., et al. 2021, ApJ, 912, 147
- Wilson & Mathews (2004) Wilson, J. R., & Mathews, G. J. 2004, ApJ, 610, 368
- Woosley et al. (2002) Woosley, S. E., Heger, A., & Weaver, T. A. 2002, Reviews of Modern Physics, 74, 1015
- Xu et al. (2016) Xu, H., Norman, M. L., O’Shea, B. W., & Wise, J. H. 2016, ApJ, 823, 140
- Xu et al. (2008) Xu, Y., Bian, W.-H., Yuan, Q.-R., & Huang, K.-L. 2008, MNRAS, 389, 1703
- Yanny et al. (2009) Yanny, B., Rockosi, C., Newberg, H. J., et al. 2009, AJ, 137, 4377
- Yoshii (1981) Yoshii, Y. 1981, A&A, 97, 280
- Yoshii & Peterson (1995) Yoshii, Y., & Peterson, B. A. 1995, ApJ, 444, 15
- Yoshii & Sabano (1980) Yoshii, Y., & Sabano, Y. 1980, PASJ, 32, 229
- Yoshii & Saio (1986) Yoshii, Y., & Saio, H. 1986, ApJ, 301, 587
- Yoshii et al. (1998) Yoshii, Y., Tsujimoto, T., & Kawara, K. 1998, ApJ, 507, L113
- Yoshii et al. (1996) Yoshii, Y., Tsujimoto, T., & Nomoto, K. 1996, ApJ, 462, 266
- Zeltyn & Trakhtenbrot (2022) Zeltyn, G., & Trakhtenbrot, B. 2022, ApJ, 929, 21