Early Results from GLASS-JWST. I: Confirmation of Lensed Lyman-Break Galaxies Behind the Abell 2744 Cluster With NIRISS
Abstract
We present the first search for , continuum-confirmed sources with NIRISS/WFS spectroscopy over the Abell 2744 Frontier Fields cluster, as part of the GLASS-JWST ERS survey. With hrs of pre-imaging and multi-angle grism exposures in the F115W, F150W, and F200W filters, we describe the general data handling (i.e., reduction, cleaning, modeling, and extraction processes) and analysis for the GLASS-JWST survey. We showcase the power of JWST to peer deep into reionization, when most intergalactic hydrogen is neutral, by confirming two galaxies at and by means of their Lyman breaks. Fainter continuum spectra are observed in both the F150W and F200W bands, indicative of blue ( and ) UV slopes and moderately-bright absolute magnitudes ( and mag). We do not detect strong Ly in either galaxy, but do observe tentative () He II1640 Å, O III]1661,1666 Å, and N III]1747,1749 Å line emission in one, suggestive of low metallicity, star-forming systems with possible non-thermal contributions. These novel observations provide a first look at the extraordinary potential of JWST/NIRISS for confirming representative samples of bright sources in the absence of strong emission lines, and gain unprecedented insight into their contributions towards cosmic reionization.
1 Introduction
The arrival of the James Webb Space Telescope (JWST) heralds a new era for the study of early galaxy evolution. The extension of imaging capabilities to higher angular resolution and into the infrared (IR) regime will allow for the identification of Lyman break galaxies (LBGs) well beyond the current redshift horizon of (e.g., Castellano et al., 2022), set by the Hubble Space Telescope (HST). Furthermore, JWST’s unprecedented spectroscopic capabilities at wavelengths of m will prove to be a game-changer for the characterization of their ionizing capabilities, underlying gas conditions, and stellar populations through emission line (e.g., Ly, C III]1907,1909 Å, He II1640 Å, H4861 Å, [O III]5007 Å, and H6563 Å) and direct continuum measurements (e.g., the 4000 Å Balmer Break and robust UV spectral slopes), respectively.
While HST and ground-based surveys have seen remarkable success in the identification of galaxy candidates (Castellano et al., 2010; Schmidt et al., 2014; Bouwens et al., 2015; Oesch et al., 2018; Morishita et al., 2018; Bowler et al., 2020; Strait et al., 2021; Finkelstein et al., 2022; Roberts-Borsani et al., 2022a) from deep fields (e.g., the HST Ultra Deep Field 2012, the Cosmic Assembly Near-Infrared Deep Extragalactic Legacy Survey, and UltraVISTA; Ellis et al. 2013; Grogin et al. 2011; McCracken et al. 2012, respectively), lensing clusters (e.g., the Cluster Lensing And Supernova survey with Hubble, the Frontier Fields, and the Reionization Lensing Cluster Survey; Postman et al. 2012; Lotz et al. 2017; Coe et al. 2019, respectively) and pure-parallel data sets (e.g., the Brightest of Reionizing Galaxies survey; Trenti et al. 2011; Morishita 2021), spectroscopic confirmation of those candidates - a prerequisite for accurate characterizations of their underlying properties - has remained elusive.
Confirmations via Ly (which is strongly affected by the surrounding intergalactic medium; Treu et al. 2013; Mason et al. 2019) and other rest-frame UV lines in the near-infrared (NIR) with e.g., Keck and the VLT has seen limited success and been found predominantly in the most luminous sources (e.g., Vanzella et al. 2011; Finkelstein et al. 2015; Oesch et al. 2015; Zitrin et al. 2015; Roberts-Borsani et al. 2016; Laporte et al. 2017a; Stark et al. 2017; Mainali et al. 2018; Mason et al. 2019; Hoag et al. 2019; Endsley et al. 2021; Laporte et al. 2021; Roberts-Borsani et al. 2022b). ALMA has provided an alternate avenue for spectroscopic confirmation and characterization in the far-infrared (FIR), with an increasing number of [O III] 88 m, [C II] 158 m, and/or dust continuum detections (e.g., Laporte et al., 2017b; Hashimoto et al., 2018; Tamura et al., 2019; Bouwens et al., 2021). However, in both cases high redshift observations are strongly affected by the intervening Earth atmosphere, highlighting the need for space-based observations.
Importantly, one major limitation of galaxy studies is the near exclusivity of redshift determinations through bright emission lines, i.e., Ly and [O III] 88 m. However, as one enters the reionization era, Ly becomes a biased tracer of exceptional systems and environments due to its attenuation by a neutral IGM. FIR lines, in contrast, have only been observed in the most luminous, dusty, and star-forming systems (e.g., Laporte et al., 2017b; Bouwens et al., 2021). As such, a large and key population of LBGs that generally do not show Ly emission (Giavalisco, 2002; Shapley, 2011) currently lack spectroscopic confirmations, potentially skewing our understanding of galaxy properties and our interpretation of the reionization process and its main drivers. Grism spectroscopy with HST has shown promise for high redshift studies (Watson et al., 2015; Schmidt et al., 2016; Treu et al., 2015; Oesch et al., 2016; Hoag et al., 2018), however HST’s instruments lack the sensitivity required for systematic confirmations of populations. JWST’s unrivaled sensitivity and spectroscopic capabilities thus offer an unprecedented opportunity to confirm redshifts for this missing sample through continuum measurements (independently of Ly), paving the way for subsequent characterization of ISM conditions, stellar population properties, and impact on the surrounding IGM for a representative population of galaxies.
Here we present the first search for continuum sources behind the Abell 2744 Frontier Field galaxy cluster as part of the GLASS-JWST program (ERS 1324, PI Treu; Treu et al., 2022), one of the very first and deepest extragalactic data sets of the Early Release Science (ERS) campaign. The search, combined with the lensing magnification afforded by the foreground cluster, showcases the potential of JWST to peer deep into the reionization era independently of Ly. The Letter is structured as follows. In Section 2 we describe our reduction of the data, contamination modeling, and modeling and extraction of grism spectra. In Section 3 we describe our target selection and showcase our results. We provide a summary and conclusions in Section 4. This Letter serves as a reference for the data reduction and general modeling procedures employed by all the NIRISS-based papers in this Focus Issue. Where relevant, we assume H70 km/s/Mpc, 0.3, and 0.7. All magnitudes are in the AB system (Oke & Gunn, 1983).
2 The JWST GLASS-ERS Data Set
2.1 Data Reduction
We focus on the GLASS-JWST-ERS NIRISS observations of the central regions of the Abell 2744 cluster, obtained on June 28-29 2022. The field was observed with hrs of wide field slitless spectroscopy (WFSS; Willott et al. 2022) at spectral resolution (at two orthogonal angles) and moderately deep ( AB at ; Treu et al. 2022) pre-imaging in three different filters (F115W, F150W, F200W). The wavelength range afforded by the three filters allows for the identification of a large variety of spectral features across a number of object types and redshifts, while the choice of two orthogonal grisms (GR150C and GR150R) facilitates the disentanglement of spectra in crowded environments (see Treu et al. 2022 for details on the observing strategy).
We reduce the entire data set using the latest set of available reference files (“jwst_0916.pmap”, which includes in-flight calibrations) and the latest version the Grism Redshift & Line (Grizli111https://github.com/gbrammer/grizli; Brammer & Matharu, 2021) analysis software, which incorporates the majority of Python routines from the STScI data reduction pipeline as well as custom routines for additional improvements (e.g., background subtraction, image alignment, and drizzling). Starting with the available count-rate files generated by the Detector1 STScI pipeline (which applies detector-level corrections such as the identification of bad pixels and cosmic rays, subtraction of dark current, and ramp fitting), we run Grizli’s preprocessing pipeline which performs WCS registration and astrometric alignment, flat-fielding, sky background subtraction, and pixel drizzling to provide fully reduced individual exposures and mosaics for both the pre-imaging and WFSS data sets. We align all our images to the LegacySurveys DR9 (Dey et al., 2019) astrometry, in order to match the astrometric reference frame used for the ALMA Lensing Cluster Survey’s data reduction of HST data (Kokorev et al., 2022). For image drizzling, we produce two mosaics at 30 milli-arcseconds (mas) and at 60 mas, of which the former can be used for resolved studies and the latter for higher S/N studies of point-like sources. We adopt the latter throughout this Letter. We calculate the 5 limiting magnitudes for each of the stacked (and drizzled) pre-images: we carefully place 10 circular, apertures at representative locations across the images - ensuring these remain free of signal or rare image artifacts - and measure the median standard deviation from those, before scaling and converting to the desired units. We find our stacked images reach depths of 28.2-28.5 AB (or 29.3 AB for a stacked IR image, see below), consistent with our estimates in Treu et al. (2022) adopting identically-sized apertures.
2.2 Removal of Contaminating Sources
One of the most significant challenges of slitless spectroscopy in clustered environments is to accurately remove overlapping spectra of nearby sources (e.g., Treu et al., 2015; Oesch et al., 2016; Schmidt et al., 2016), given the tendency for contamination to cause confusion in redshift estimations and physical interpretation of a source’s spectrum. Considering the large density of sources in our field, such challenges are especially relevant. To identify the position of sources in the field-of-view (FOV), we begin by constructing a flux-weighted IR stack from the pre-imaging mosaics, which is used to generate a catalog of sources and associated segmentation map. For each detected source brighter than 28, Grizli then fits and refines a 7th order polynomial to the associated spectrum in each individual grism exposure, thereby creating a map with which to identify contaminating pixels around or nearby objects of interest. For F115W spectra (where spatial offsets between the target position in direct imaging and the spectral trace are negligible), we find the contamination model is able to adequately subtract the majority of nearby contaminants, however this becomes more challenging as a function of wavelength where offsets of the spectral trace relative to the source become larger. Improvements and imminent updates to existing reference files will further improve wavelength calibrations, spectral trace offset measurements, and flux calibrations for more precise measurements. Considering the above, all pixels used for extraction and modeling purposes are therefore weighted by according to a combination of their contamination level and flux uncertainty (defined by the error array in the flux-calibrated count-rate images). We define the weights as , where is the contamination model flux, is a constant down-weighting factor set to 0.2, and is the flux noise for a pixel given by the error array.
2.3 Modeling & Extraction of Grism Spectra
For a specified target, all individual, “cleaned” (i.e., weighted according to the equation described above) 2D grism exposures provided to Grizli are modelled simultaneously, allowing for independent noise handling and the avoidance of additional complications resulting from stacking (e.g., morphological broadening and smearing of spectral traces from asymmetric pixel sizes, orthogonal dispersion directions, and varying trace offsets between grism setups), while retaining a collective S/N ratio equivalent to that of a stacked mosaic. Using constraints from the collective sample of exposures, a 2D galaxy model is generated via a linear combination of galaxy templates and dispersed onto the plane of the sky according to the location and morphological structure of the source as measured from the pre-imaging exposures. To generate the model, we make use of variety of galaxy templates (e.g., intermediate age SEDs with moderate 4000 Å breaks, older simple stellar population models to account for low-level absorption features, post-starburst galaxies from the UltraVISTA survey, and low-metallicity LBGs) incorporating continuum and emission line contributions, to be able to flexibly fit a large variety of spectra according to an allowed redshift range.
Given the common astrometric reference frame, in this study we also include for added constraints the full assortment of available HST photometry from the Frontier Fields, derived from the drizzled mosaics of Kokorev et al. (2022) that we resampled to 60 mas pixel size to match our NIRISS mosaics. Specifically, we include photometry from HST/WFC3-UVIS (F336W), HST/ACS (F435W, F606W, F814W) and HST/WFC3 (F105W, F125W, F140W, and F160W), which serve as valuable additional constraints to determine the location of the Lyman break. As an added check, for sources of interest, we also visually inspect each filter-grism stack and exclude combinations where we deem the spectra to be significantly impacted by lingering contamination (e.g., if they appear in only one grism orientation). Thus, we fit the resulting NIRISS grism exposures and HST photometry with models over a broad redshift range , to allow for both low- and high- solutions. The best-fit model is considered the one with the highest value. Associated 1D spectra are then optimally extracted from the data by Grizli, using the morphological model of the source as a reference for the position and extension (in the spatial direction) of the spectral trace.
3 Spectroscopic Confirmation of Galaxies With WFSS
3.1 Target Selection
Here we focus on the WFSS follow up of previously identified sources in the Abell 2744 cluster that (i) fall in the NIRISS FOV, and (ii) are sufficiently bright to be reliably detected via continuum measurements, with the aim of determining their spectroscopic redshifts. At , the filters adopted by GLASS-ERS allow for spectral coverage of the Lyman-break out to . Additionally, the filters also cover emission lines such as Ly and N V emission out to , C IV out to , He II and O III] out to , and C III] out to .
We select our targets from a comprehensive compilation of photometrically-selected sources from Zheng et al. (2014), Zitrin et al. (2014), Leung et al. (2018), Ishigaki et al. (2018), Bouwens et al. (2022), and the public Hubble Frontier Fields (HFF) catalogs of Shipley et al. (2018) and Castellano et al. (2016). Each of the compiled sources were originally selected as LBGs from NIR color cuts using HST ACS+WFC3 data and photo- constraints.
In this initial study, aimed at continuum detections, we limit our search to galaxies with a reported F160W magnitude (or F125W if F160W is not reported) of and quality flags indicating robust flux and/or photo- measurements. Such a choice is based on S/N predictions given by the ETC, indicating detections in F115W (per pixel, assuming a aperture) for sources with AB.
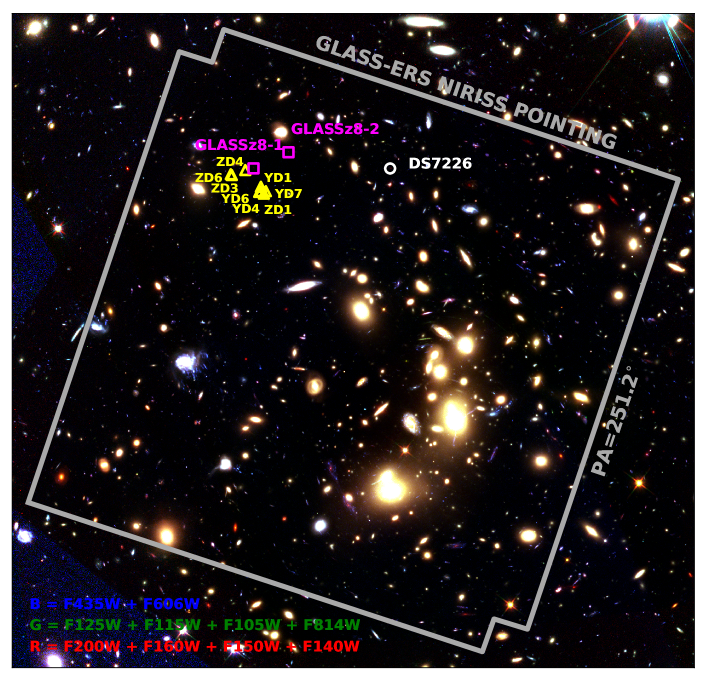
Accounting for overlap between studies, the compilation and cut comprises a total of 6 unique sources, 3 of which are sufficiently isolated from bright neighbours to be detected in our IR stack and segmentation map. The final sample of sources spans a range of observed F160W magnitudes AB and photometric redshifts of . The galaxies - referred to as GLASSz8-1, GLASSz8-2, and DS7226 - and their locations relative to the cluster center are shown in Figure 1, which displays an HST-NIRISS RGB image of the central cluster.
3.2 Identifying Lyman Break Features
Out of the 3 galaxy candidates compiled and identified here, we confirm 2 of them - GLASSz8-1 and GLASSz8-2 (formerly ZD2 and 2458 in Zheng et al. 2014 and Castellano et al. 2016, respectively) to lie at based on a clear drop in flux blueward of (rest-frame) 1216 Å indicating substantial absorption by intervening neutral hydrogen along the line of sight. Both galaxies are sufficiently isolated as to be clear of contamination from nearby objects.
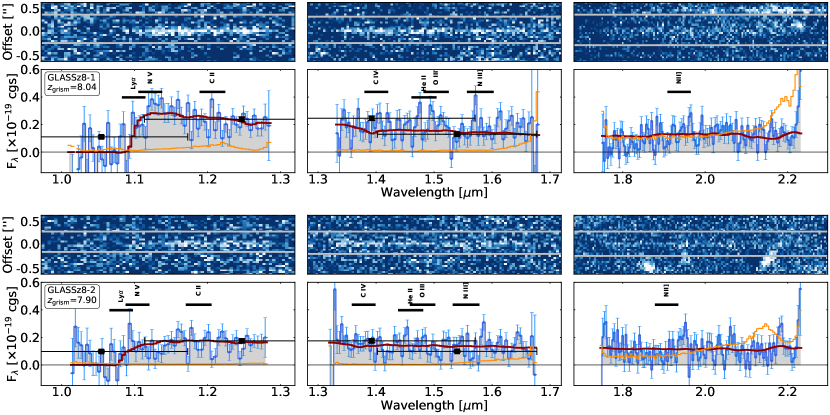
We show their 2D spectra and 1D extracted fluxes in Figure 2, along with the best-fit Grizli model which places them at redshifts of and , respectively. Redshift uncertainties are quoted as the standard deviation of the at their locus. Inspecting Figure 2, we find the break is clearly identified in the F115W filter, where significant flux is detected redward of the break and only noise is visible blueward of it. GLASSz8-2 displays some apparently rising flux at the bluest end of the F115W. However, this is very close to the edge of the filter’s sensitivity curve and the enlarged error bars make this consistent with noise from imperfect background subtraction. As expected for galaxies, the continuum is also detected (at reduced levels) across the entire wavelength ranges of the F150W and F200W filters, further supporting the confirmation. The reduced continuum levels at increasing wavelengths suggest blue UV slopes and absolute 1500 Å magnitudes of and mag (for GLASSz8-1 and GLASSz8-2, respectively), corrected for magnification effects (2, see below) using the model of Bergamini et al. 2022), indicative of young, star-forming systems.
In both cases, we observe some excess flux at the expected position of Ly, however, such an excess is marginal and would require deeper and higher-resolution spectroscopy (e.g., with NIRSpec) to confirm. Subtracting the best-fit continuum model from the flux, normalizing by the continuum model, and integrating over the apparent line profile points to equivalent width upper limits of Å (rest-frame Å). We tabulate the galaxies’ spectro-photometric properties in Table 1, where we show that both spectroscopic redshifts are consistent with previously estimated photo-’s. The remaining target displays a solution based on prominent emission line detections that classify it as a contaminant.
Both GLASSz8-1 and GLASSz8-2 are lensed by a factor of (Bergamini et al., 2022) and are among the brightest of the target sample, with reported magnitudes of and , respectively. We also find their positions on the plane of the sky place them within arcsec from the overdensity, possibly indicative of some association between themselves and the other galaxies.
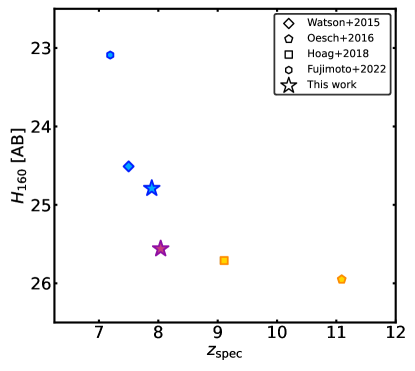
The results shown here highlight the extraordinary potential of grism spectroscopy to determine spectroscopic redshifts independently of the Ly emission seen in exceptional objects (e.g. Finkelstein et al., 2013; Oesch et al., 2015; Zitrin et al., 2015; Roberts-Borsani et al., 2016) and characterize unbiased samples of galaxies well into the Epoch of Reionization. To highlight this, in Figure 3 we show a compilation of spectroscopically-verified LBGs at with clear continuum breaks, irrespective of emission line detections. The number of galaxies unsurprisingly decreases as a function of redshift and remains exclusive to the apparently brighter sources – the galaxies presented here increase the number of confirmed continuum detections in the literature by a factor of 1.5, thus serving as a powerful illustration of JWST. Such samples will prove crucial to determine a representative picture of the sources that governed the reionization process and in this regard additional, pure-parallel grism observations over blank regions of the sky (e.g., GO 1571 PASSAGE, PI Malkan) will prove especially useful to obtain conclusions over the general galaxy population.
3.3 Rest-Frame UV Line Emission
In addition to the clear Lyman break, for GLASSz8-1 we also report tentative (i.e., ) detections of rest-frame UV lines at expected wavelengths. The clearest identified lines are He II1640 Å, the (unresolved) O III]1661,1666 Å doublet, and the (unresolved) N III]1747,1749 doublet in the F150W filter. To quantify their statistical significance, we subtract the modelled continuum from the spectrum and measure the peak S/N ratio of each line from the residual, using again the error array from the flux-calibrated count-rate image as the uncertainty. The He II, O III], and N III] lines have peak S/N ratios of 2.7, 2.8, and 3.8, respectively. After verifying the Gaussian nature of the noise distribution, we find only 3 other pixels in the full F150W 1D spectrum have S/N2.75. Although the lines are not especially strong, we note none of them appear close to any nearby residual contamination and their observed wavelengths and separations relative to each other are consistent with the interpretation. If confirmed at higher significance, the detections of O III] and N III] at such high redshift would prove a first.
The presence of rest-frame UV lines in galaxies is not unexpected, although have thus far been more prominently seen in strong Ly-emitters (e.g., Laporte et al., 2017a; Stark et al., 2017; Mainali et al., 2018). Placing the line detections into context, the presence of O III] and N III] can be explained by both star-forming sources with low metallicities () or non-thermal sources as they require moderate photon energies (35 eV) to become ionized (Feltre et al., 2016). He II, in contrast, requires significantly higher energies of eV from strong ionizing continuum photons suggestive of more extreme ionizing conditions (e.g., AGN or massive, low-metallicity stars). Low-metallicities systems are common among young, star-forming galaxies at (e.g., Strait et al., 2020; Roberts-Borsani et al., 2021), however only a handful of sources at display high-ionization lines similar to those reported here (e.g., Laporte et al., 2017a; Mainali et al., 2018). More detailed and higher S/N observations of such lines will be required to confirm their prevalence among the general galaxy population.
4 Summary & Conclusions
In this Letter we present a first look at the JWST NIRISS data from the GLASS-ERS survey taken over the Abell 2744 Frontier Fields cluster. We describe the procedures adopted by the survey to reduce, clean and model grism spectra. We showcase the power of JWST by studying a sample of 3 , AB galaxy candidates with the aim of confirming their spectroscopic redshifts without relying on Ly. Our findings can be summarized as follows:
-
•
We confirm the spectroscopic redshifts of two out of three bright ( AB) galaxies via the detection of strong Lyman breaks, placing them at redshifts of and . The galaxies are located arcsec from a protocluster, possibly indicative of some association between them. No strong and significant Ly emission is detected in either of the galaxies. The third galaxy is found to be a interloper.
-
•
In addition to the break, we find evidence for tentative () detections of He II, O III], and N III] line emission, suggestive of a low-metallicity and star-forming system with potential non-thermal contributions.
The confirmation of galaxies at via their continuum is an important breakthrough in the study of cosmic reionization. Bypassing Ly allows one to confirm and study galaxies in a way that is unbiased with respect to the ionization state of the surrounding cirgumgalactic and intergalactic hydrogen. Furthermore, and similarly to lower redshifts (Giavalisco, 2002; Shapley, 2011), we expect a large fraction of galaxies to not display strong emission lines. Those sources would have so far been missed and now become accessible with JWST.
| GLASS ID | RA | DEC | Reference | ||||||
|---|---|---|---|---|---|---|---|---|---|
| [deg] | [deg] | [AB] | [AB] | ||||||
| GLASSz8-1 | 3.60452 | -30.38047 | 25.56 | 2.00 | 8.040.15 | 7.90 | ZD2; Zheng et al. (2014) | ||
| GLASSz8-2 | 3.60135 | -30.37921 | 24.79 | 2.10 | 7.900.13 | 7.55 | 2458; Castellano et al. (2016) |
References
- Bergamini et al. (2022) Bergamini, P., Acebron, A., Grillo, C., et al. 2022, arXiv e-prints, arXiv:2207.09416. https://arxiv.org/abs/2207.09416
- Bouwens et al. (2022) Bouwens, R. J., Illingworth, G., Ellis, R. S., et al. 2022, ApJ, 931, 81, doi: 10.3847/1538-4357/ac618c
- Bouwens et al. (2015) Bouwens, R. J., Illingworth, G. D., Oesch, P. A., et al. 2015, ApJ, 803, 34, doi: 10.1088/0004-637X/803/1/34
- Bouwens et al. (2021) Bouwens, R. J., Smit, R., Schouws, S., et al. 2021, arXiv e-prints, arXiv:2106.13719. https://arxiv.org/abs/2106.13719
- Bowler et al. (2020) Bowler, R. A. A., Jarvis, M. J., Dunlop, J. S., et al. 2020, MNRAS, 493, 2059, doi: 10.1093/mnras/staa313
- Brammer & Matharu (2021) Brammer, G., & Matharu, J. 2021, gbrammer/grizli: Release 2021, 1.3.2, Zenodo, Zenodo, doi: 10.5281/zenodo.1146904
- Castellano et al. (2010) Castellano, M., Fontana, A., Paris, D., et al. 2010, A&A, 524, A28, doi: 10.1051/0004-6361/201015195
- Castellano et al. (2016) Castellano, M., Amorín, R., Merlin, E., et al. 2016, A&A, 590, A31, doi: 10.1051/0004-6361/201527514
- Castellano et al. (2022) Castellano, M., Fontana, A., Treu, T., et al. 2022, arXiv e-prints, arXiv:2207.09436. https://arxiv.org/abs/2207.09436
- Coe et al. (2019) Coe, D., Salmon, B., Bradač, M., et al. 2019, ApJ, 884, 85, doi: 10.3847/1538-4357/ab412b
- Dey et al. (2019) Dey, A., Schlegel, D. J., Lang, D., et al. 2019, AJ, 157, 168, doi: 10.3847/1538-3881/ab089d
- Ellis et al. (2013) Ellis, R. S., McLure, R. J., Dunlop, J. S., et al. 2013, ApJ, 763, L7, doi: 10.1088/2041-8205/763/1/L7
- Endsley et al. (2021) Endsley, R., Stark, D. P., Charlot, S., et al. 2021, MNRAS, 502, 6044, doi: 10.1093/mnras/stab432
- Feltre et al. (2016) Feltre, A., Charlot, S., & Gutkin, J. 2016, MNRAS, 456, 3354, doi: 10.1093/mnras/stv2794
- Finkelstein et al. (2013) Finkelstein, S. L., Papovich, C., Dickinson, M., et al. 2013, Nature, 502, 524, doi: 10.1038/nature12657
- Finkelstein et al. (2015) Finkelstein, S. L., Ryan, Russell E., J., Papovich, C., et al. 2015, ApJ, 810, 71, doi: 10.1088/0004-637X/810/1/71
- Finkelstein et al. (2022) Finkelstein, S. L., Bagley, M., Song, M., et al. 2022, ApJ, 928, 52, doi: 10.3847/1538-4357/ac3aed
- Fujimoto et al. (2022) Fujimoto, S., Brammer, G. B., Watson, D., et al. 2022, Nature, 604, 261, doi: 10.1038/s41586-022-04454-1
- Giavalisco (2002) Giavalisco, M. 2002, ARA&A, 40, 579, doi: 10.1146/annurev.astro.40.121301.111837
- Grogin et al. (2011) Grogin, N. A., Kocevski, D. D., Faber, S. M., et al. 2011, ApJS, 197, 35, doi: 10.1088/0067-0049/197/2/35
- Hashimoto et al. (2018) Hashimoto, T., Laporte, N., Mawatari, K., et al. 2018, Nature, 557, 392, doi: 10.1038/s41586-018-0117-z
- Hoag et al. (2018) Hoag, A., Bradač, M., Brammer, G., et al. 2018, ApJ, 854, 39, doi: 10.3847/1538-4357/aaa9c2
- Hoag et al. (2019) Hoag, A., Bradač, M., Huang, K., et al. 2019, ApJ, 878, 12, doi: 10.3847/1538-4357/ab1de7
- Ishigaki et al. (2018) Ishigaki, M., Kawamata, R., Ouchi, M., et al. 2018, ApJ, 854, 73, doi: 10.3847/1538-4357/aaa544
- Kokorev et al. (2022) Kokorev, V., Brammer, G., Fujimoto, S., et al. 2022, arXiv e-prints, arXiv:2207.07125. https://arxiv.org/abs/2207.07125
- Laporte et al. (2021) Laporte, N., Meyer, R. A., Ellis, R. S., et al. 2021, MNRAS, 505, 3336, doi: 10.1093/mnras/stab1239
- Laporte et al. (2017a) Laporte, N., Nakajima, K., Ellis, R. S., et al. 2017a, ApJ, 851, 40, doi: 10.3847/1538-4357/aa96a8
- Laporte et al. (2017b) Laporte, N., Ellis, R. S., Boone, F., et al. 2017b, ApJ, 837, L21, doi: 10.3847/2041-8213/aa62aa
- Leung et al. (2018) Leung, E., Broadhurst, T., Lim, J., et al. 2018, ApJ, 862, 156, doi: 10.3847/1538-4357/aacdad
- Lotz et al. (2017) Lotz, J. M., Koekemoer, A., Coe, D., et al. 2017, ApJ, 837, 97, doi: 10.3847/1538-4357/837/1/97
- Mainali et al. (2018) Mainali, R., Zitrin, A., Stark, D. P., et al. 2018, MNRAS, 479, 1180, doi: 10.1093/mnras/sty1640
- Mason et al. (2019) Mason, C. A., Fontana, A., Treu, T., et al. 2019, MNRAS, 485, 3947, doi: 10.1093/mnras/stz632
- McCracken et al. (2012) McCracken, H. J., Milvang-Jensen, B., Dunlop, J., et al. 2012, A&A, 544, A156, doi: 10.1051/0004-6361/201219507
- Morishita (2021) Morishita, T. 2021, ApJS, 253, 4, doi: 10.3847/1538-4365/abce67
- Morishita et al. (2018) Morishita, T., Trenti, M., Stiavelli, M., et al. 2018, ApJ, 867, 150, doi: 10.3847/1538-4357/aae68c
- Oesch et al. (2018) Oesch, P. A., Bouwens, R. J., Illingworth, G. D., Labbé, I., & Stefanon, M. 2018, ApJ, 855, 105, doi: 10.3847/1538-4357/aab03f
- Oesch et al. (2015) Oesch, P. A., van Dokkum, P. G., Illingworth, G. D., et al. 2015, ApJ, 804, L30, doi: 10.1088/2041-8205/804/2/L30
- Oesch et al. (2016) Oesch, P. A., Brammer, G., van Dokkum, P. G., et al. 2016, ApJ, 819, 129, doi: 10.3847/0004-637X/819/2/129
- Oke & Gunn (1983) Oke, J. B., & Gunn, J. E. 1983, ApJ, 266, 713, doi: 10.1086/160817
- Postman et al. (2012) Postman, M., Coe, D., Benítez, N., et al. 2012, ApJS, 199, 25, doi: 10.1088/0067-0049/199/2/25
- Roberts-Borsani et al. (2022a) Roberts-Borsani, G., Morishita, T., Treu, T., Leethochawalit, N., & Trenti, M. 2022a, ApJ, 927, 236, doi: 10.3847/1538-4357/ac4803
- Roberts-Borsani et al. (2021) Roberts-Borsani, G., Treu, T., Mason, C., et al. 2021, ApJ, 910, 86, doi: 10.3847/1538-4357/abe45b
- Roberts-Borsani et al. (2022b) —. 2022b, arXiv e-prints, arXiv:2207.01629. https://arxiv.org/abs/2207.01629
- Roberts-Borsani et al. (2016) Roberts-Borsani, G. W., Bouwens, R. J., Oesch, P. A., et al. 2016, ApJ, 823, 143, doi: 10.3847/0004-637X/823/2/143
- Schmidt et al. (2014) Schmidt, K. B., Treu, T., Trenti, M., et al. 2014, ApJ, 786, 57, doi: 10.1088/0004-637X/786/1/57
- Schmidt et al. (2016) Schmidt, K. B., Treu, T., Bradač, M., et al. 2016, ApJ, 818, 38, doi: 10.3847/0004-637X/818/1/38
- Shapley (2011) Shapley, A. E. 2011, ARA&A, 49, 525, doi: 10.1146/annurev-astro-081710-102542
- Shipley et al. (2018) Shipley, H. V., Lange-Vagle, D., Marchesini, D., et al. 2018, ApJS, 235, 14, doi: 10.3847/1538-4365/aaacce
- Stark et al. (2017) Stark, D. P., Ellis, R. S., Charlot, S., et al. 2017, MNRAS, 464, 469, doi: 10.1093/mnras/stw2233
- Strait et al. (2020) Strait, V., Bradač, M., Coe, D., et al. 2020, ApJ, 888, 124, doi: 10.3847/1538-4357/ab5daf
- Strait et al. (2021) —. 2021, ApJ, 910, 135, doi: 10.3847/1538-4357/abe533
- Tamura et al. (2019) Tamura, Y., Mawatari, K., Hashimoto, T., et al. 2019, ApJ, 874, 27, doi: 10.3847/1538-4357/ab0374
- Trenti et al. (2011) Trenti, M., Bradley, L. D., Stiavelli, M., et al. 2011, ApJ, 727, L39, doi: 10.1088/2041-8205/727/2/L39
- Treu et al. (2013) Treu, T., Schmidt, K. B., Trenti, M., Bradley, L. D., & Stiavelli, M. 2013, ApJ, 775, L29, doi: 10.1088/2041-8205/775/1/L29
- Treu et al. (2015) Treu, T., Schmidt, K. B., Brammer, G. B., et al. 2015, ApJ, 812, 114, doi: 10.1088/0004-637X/812/2/114
- Treu et al. (2022) Treu, T., Roberts-Borsani, G., Bradac, M., et al. 2022, ApJ, in press, arXiv:2206.07978. https://arxiv.org/abs/2206.07978
- Vanzella et al. (2011) Vanzella, E., Pentericci, L., Fontana, A., et al. 2011, ApJ, 730, L35, doi: 10.1088/2041-8205/730/2/L35
- Watson et al. (2015) Watson, D., Christensen, L., Knudsen, K. K., et al. 2015, Nature, 519, 327, doi: 10.1038/nature14164
- Willott et al. (2022) Willott, C. J., Doyon, R., Albert, L., et al. 2022, PASP, 134, 025002, doi: 10.1088/1538-3873/ac5158
- Zheng et al. (2014) Zheng, W., Shu, X., Moustakas, J., et al. 2014, ApJ, 795, 93, doi: 10.1088/0004-637X/795/1/93
- Zitrin et al. (2014) Zitrin, A., Zheng, W., Broadhurst, T., et al. 2014, ApJ, 793, L12, doi: 10.1088/2041-8205/793/1/L12
- Zitrin et al. (2015) Zitrin, A., Labbé, I., Belli, S., et al. 2015, ApJ, 810, L12, doi: 10.1088/2041-8205/810/1/L12