Early results from GLASS-JWST. XI: Stellar masses and mass-to-light ratio of galaxies 111Released on …
Abstract
We exploit James Webb Space Telescope (JWST) NIRCam observations from the GLASS-JWST-Early Release Science program to investigate galaxy stellar masses at . We first show that JWST observations reduce the uncertainties on the stellar mass by a factor of at least 5-10, when compared with the highest quality data sets available to date. We then study the UV mass-to-light ratio, finding that galaxies exhibit a two orders of magnitude range of values for a given luminosity, indicative of a broad variety of physical conditions and star formation histories. As a consequence, previous estimates of the cosmic star stellar mass density – based on an average correlation between UV luminosity and stellar mass – can be biased by as much as a factor of 6. Our first exploration demonstrates that JWST represents a new era in our understanding of stellar masses at , and therefore of the growth of galaxies prior to cosmic reionization.
1 Introduction
Stellar mass is one of the most fundamental physical properties describing galaxies. Reliable measurements of this galaxy property are crucial to understand the overall picture of galaxy formation and evolution. Stellar masses of galaxies are usually calculated by fitting stellar population synthesis models to broad band multiwavelength photometry. The accuracy of these estimates hinges on the availability of rest-frame optical and near-infrared (NIR) photometry (e.g. Santini et al., 2012; Paulino-Afonso et al., 2022), which trace the bulk of the emission from stars that most contribute to the stellar mass. This wavelength range is exquisitely sampled by HST up to . At higher redshift Spitzer has been widely used but is able to provide information on the very brightest galaxies only, as it is limited by low sensitivity and poor angular resolution (compared to HST), and blending issues, especially in crowded fields.
As a consequence of the observational limitations prior to JWST, most studies of galaxies at to date converted rest-frame UV fluxes into mass estimates through an average mass-to-light ratio (, for simplicity referred to as in the following), rather than computing the stellar masses on a source-by-source base (e.g. González et al., 2011; Song et al., 2016; Kikuchihara et al., 2020).
Another limitation prior to JWST is that, without rest-frame optical and NIR observations one could miss a large fraction of intrinsically red galaxies, i.e. those galaxies that are faint in the UV, such as evolved or dust–obscured systems. Current high redshift samples are therefore likely to be severely incomplete in terms of this population. As a consequence, are calibrated (almost only) on UV-detected, Lyman Break Galaxies (LBG), and likely inappropriately applied to a larger variety of galaxy populations (as discussed in Grazian et al., 2015).
In this Letter we use the power of JWST to carry out the first determination of stellar masses at high redshift using rest-frame optical data. By comparing with previous work we demonstrate the importance of this new observing window. In practice, we exploit the first NIRCam (Rieke et al., 2005) observations of the GLASS-ERS 1324 program (Treu et al., 2022), and measure stellar masses of galaxies, analyze their , and critically assess the adoption of the UV emission as a mass tracer.
We emphasize that this is a first look at this important issue, based on the current understanding of the data quality and calibration of NIRCam data222The ”pedigree” of the data products adopted here is CAL_VER 1.6.0; CRDS_CTX jwst_0942.pmap (released on July 29 2022).. We expect to significantly improve our data set and analysis in the near future.
This Letter is organized as follows: we describe the dataset and methodology in Sect. 2, present our results in Sect. 3, and summarize our findings in Sect. 4. We adopt the standard Cold Dark Matter concordance cosmological model ( km s-1 Mpc-1, , and ) and a Chabrier (2003) (IMF). Magnitudes are given in the AB system.
2 Data set and methods
We use the first set of NIRCam observations taken on June 28-29 2022 as part of the GLASS-ERS 1324 program in 7 wide filters (F090W, F115W, F150W, F200W, F277W, F356W and F444W). These data were taken in parallel to NIRISS (Doyon et al., 2012) observations (Roberts-Borsani et al., 2022, Paper I), targeting the Abell2744 cluster, with the NIRCam fields centered at RA=0:14:02.6142, Dec=-30:21:38.793 and RA=0:13:58.4752, Dec=-30:18:52.094. They were analysed through the JWST pipeline333https://jwst-docs.stsci.edu/jwst-science-calibration-pipeline-overview, slightly modified as described by Merlin et al. (2022, Paper II). Source detection was carried out on the F444W band, while aperture fluxes were computed in the other bands on the PSF-matched images. We use corrected aperture photometry, computed as explained by Merlin et al. (2022).
Galaxies were selected based on color and photometric redshift criteria, as described in two companion papers. The sample is described by Leethochawalit et al. (2022, Paper X), while Castellano et al. (2022, Paper III) focuses on . In total, 14 candidates were selected based on their colors and signal-to-noise-ratio (SNR), and additional 5 were included based on the photo- selection. We refer to the two companion papers mentioned above for further details. Our total sample comprises 19 galaxies, spanning a range in redshfit from 6.9 to 12.1, with a mean (median) value of 8.6 (8.1), over an effective area of 6.6 arcmin2 (which is smaller than the NIRCam field of view due to non perfect overlap of the images in all bands).
For one of the galaxies in our sample, namely GHZ2, the photometry has been calculated ad-hoc to avoid contamination from a bright close-by galaxy. The photometric measurement of this source is described in detail in Castellano et al. (2022).
2.1 Stellar mass estimates
Stellar masses and the other physical parameters, including the observed absolute UV magnitudes at 1500Å (), were measured by fitting synthetic stellar templates to the 7-band NIRCam photometry with zphot (Fontana et al., 2000). When the nominal flux errors are smaller than 0.05 mags, we set a minimum photometric uncertainty in all bands corresponding to this threshold to account for uncertainties in the NIRCam calibration. We adopt in the following the photometric redshifts computed by Leethochawalit et al. (2022) and Castellano et al. (2022). We fixed the redshift to the EAzY value, with the exception of two of the color selected galaxies (GHZ3 and GHZ5 in Castellano et al. 2022), for which EAzY prefers a lower redshift solution while zphot fits them at . We use the zphot redshifts for these sources. We built the stellar library following the assumptions of Merlin et al. (2021). We adopt Bruzual & Charlot (2003) models, including nebular emission lines according to Castellano et al. (2014) and Schaerer & de Barros (2009). We do not include Ly emission because it is most likely absorbed by the Intergalactic Medium at these redshifts, although for clarity it is drawn in the Spectral Energy Distributions (SED) shown in Fig. 1. We assume delayed exponentially declining Star Formation Histories (SFH()) with ranging from 0.1 to 7 Gyr (the adoption of more complicated SFHs, e.g. including recent bursts, will be addressed in a future analysis). We let the age range from 10 Myr to the age of the Universe at each galaxy redshift. Metallicity is allowed to be 0.02, 0.2 and 1 times Solar, and dust extinction is assumed to follow a Calzetti et al. (2000) law with E(B-V) varying from 0 to 1.1. We compute uncertainties on the physical parameters by retaining for each object the minimum and maximum fitted masses among all the solutions with a probability of being correct, both fixing the redshift to the best-fit value and allowing it to vary within its 1 and 2 ranges. For this analysis, for simplicity, we consider uncertainties at fixed redshifts. We will explore any residual degeneracy with redshift in future work.
We have compared the stellar masses computed with zphot with those computed at the very same redshift with Bagpipes (Carnall et al., 2018) assuming a log-normal SFH, used by Leethochawalit et al. (2022). We find good agreement between the two, with some discrepancy only for a few low mass galaxies. These discrepancies arise in objects with very small 4000Å break (D4000). For these objects, the photometry at long wavelengths depends critically on the assumptions about emission lines, which are different for the two codes. This is clearly a topic that will deserve further attention as larger samples of spectra at become available to calibrate the models.
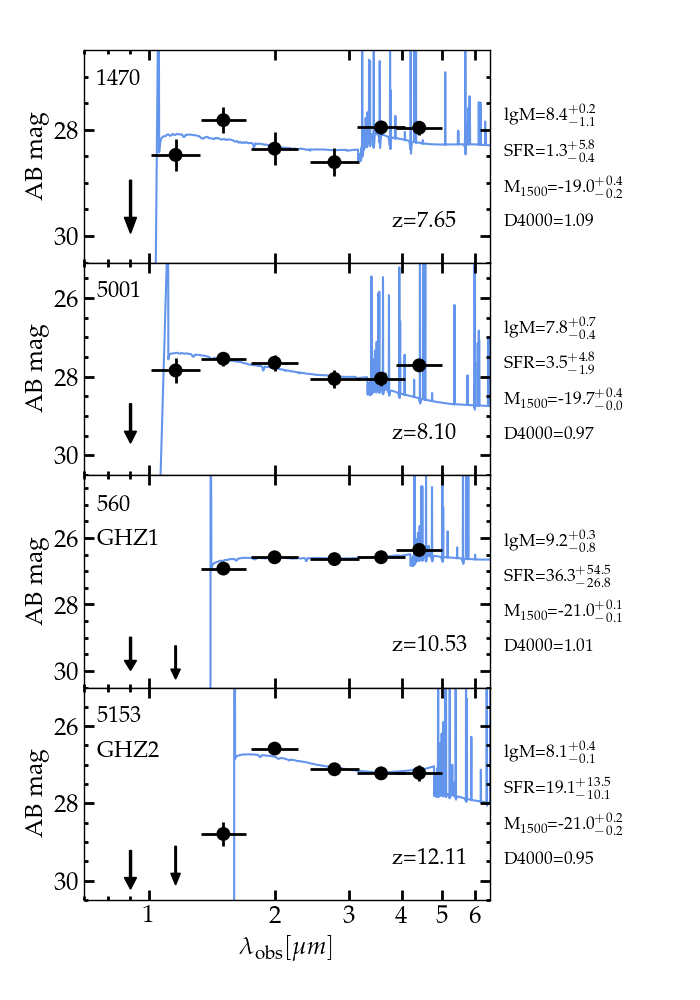
We show in Fig. 1 a few examples of the SED and best-fit templates of our candidates: two candidates, one with high and a pronounced D4000 (ID1470) and another one with low and a D4000 smaller than 1 (ID5001), and the two most robust candidates at , namely GHZ1 and GHZ2 presented by Castellano et al. (2022). We note that two out of these four galaxies exhibit D40001, which is indicative of extremely young stellar populations and a spectrum dominated by nebular continuum. While the optical rest-frame is nicely sampled at – and also marginally at – at higher redshift we are limited to the spectral region blueward of the break. For these galaxies longer wavelength observations with MIRI will be a valuable addition.
Remarkably, GHZ2 shows a characteristic U-shape pattern (Carnall et al., 2022) (i.e. an extremely blue UV slope with the Balmer break seen in emission) that allows us to nicely constrain its SED. Despite its extremely high redshift, its intrinsic luminosity allows for an accurate physical characterization.
Modest lensing magnification is expected to be present in the parallel fields (Medezinski et al., 2016; Bergamini et al., 2022), so that the stellar masses and UV luminosities should be taken as lower limits. In this initial set of papers we neglect this effect. The issue will be revisited after the completion of the campaign.
In any case, the main results of the present Letter are independent of the lensing magnification. In particular, lensing affects masses and luminosities in the same way, so the ratio is free from magnification uncertainties. Furthermore, relative uncertainties on the stellar mass are also independent of magnification.
3 Results and discussion
3.1 Accuracy of stellar mass estimates
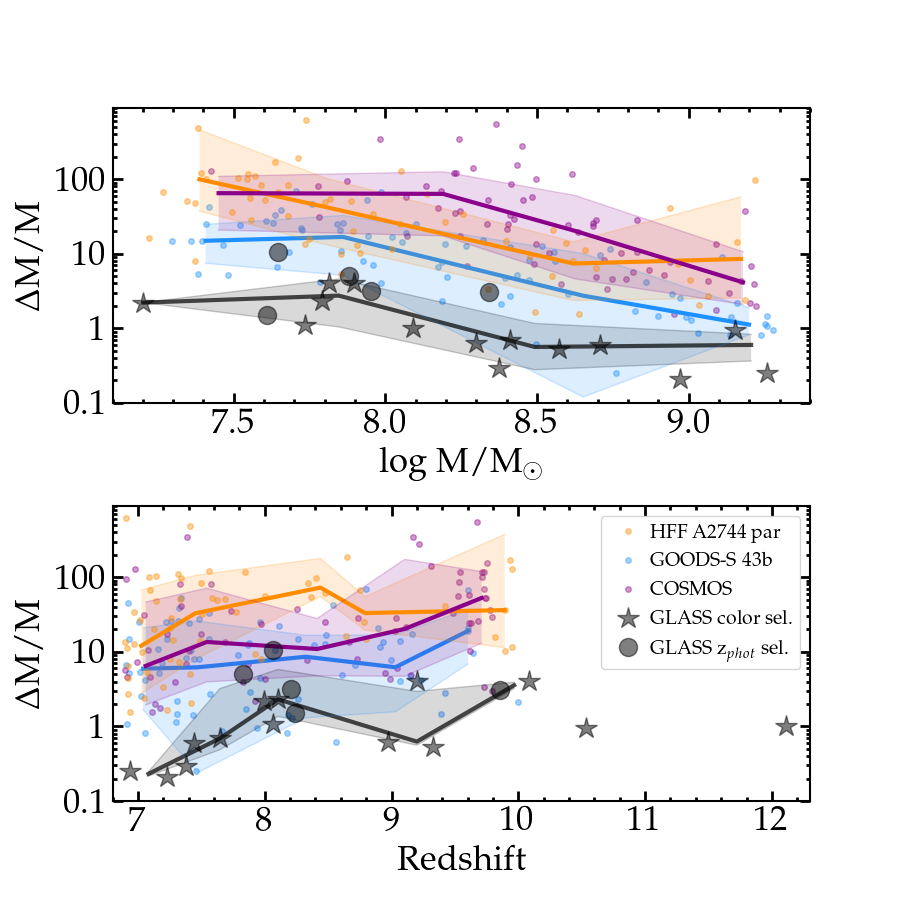
JWST observations allow for a significant reduction of the uncertainties on the stellar mass measurement. Figure 2 shows the relative uncertainty at a 1 level as a function of stellar mass and redshift. The error is computed by scanning all models with acceptable as described above.
The inferred from GLASS observations is compared with the uncertainty affecting the stellar masses in three of the highest quality and most exploited data sets that were available before the advent of JWST. All of them are obtained with a combination of HST, Spitzer and ground–based data covering approximately the same spectral range of this work, but with much lower depth and SNR longward m. These are: i) the 43 band catalog of the CANDELS GOODS-S field by Merlin et al. (2021), ii) the 43 band CANDELS COSMOS catalog of Nayyeri et al. (2017) and iii) the 10 band catalog of Hubble Frontier Field (HFF) A2744 parallel by Merlin et al. (2016) and Castellano et al. (2016). The 5 limiting magnitudes in the CH1 and CH2 IRAC bands are (i, total magnitudes), 24.4 (ii, aperture photometry within a 1 FWHM radius) and (iii, calculated as described in Merlin et al. 2016), to be compared with the 29.3-29.7 depth (5 limiting point source magnitudes in 0.1″ radius) of the F356W and F444W GLASS observations (Merlin et al., 2021). In all cases, we restricted to the galaxies of similar redshift () and mass ( ) as the GLASS sample. In addition, we cleaned the catalogs by removing all sources flagged in the original catalogs due to photometric issues as well as spectroscopic and photometric stars. The latter were identified requiring SNR(H160)10 and either a) SExtractor (Bertin & Arnouts, 1996) classstar0.95 or b) classstar0.8 and populating the stellar locus of the BzK diagram (Daddi et al., 2004). For the GOODS-S and COSMOS catalogs, we also removed X-ray selected AGNs according to the official CANDELS selection.
We remark that the computation of the error on mass depends on the code and on the library adopted. For this reason, we have used exactly the same code and template library, but for safety the comparison should be considered as an estimate of the relative improvement that can be obtained via JWST optical rest-frame photometry.
Figure 2 shows that, in the redshift and mass range considered here, JWST observations improve the accuracy on the stellar mass measurements by factors ranging from to 30 on average compared to measurements based on Spitzer, HST and ground based observations only, at a given stellar mass or redshift. The improvement is more significant with respect to the HFF data set. The HFF catalog lacks IRAC CH3 and CH4 bands, which are instead included in the CANDELS catalogs, and suffers from shorter exposure times with Spitzer. Therefore, the deeper HST photometry of HFF compared to CANDELS is not complemented by similarly deeper IRAC CH1 and CH2 observations. In any case, we need to emphasize that the exposure times of the Spitzer data are significantly larger than those of JWST here, up to more than 100hr in the case of GOODS-S.
Unsurprisingly, the accuracy improves for more massive objects, which are on average brighter and proportionally less affected by the (uncertain) contribution of nebular emission lines. The relative improvement compared to HFF is even more significant if analysed as a function of redshift, increasing up to a factor of 30-50. Most importantly, as shown in the previous section, JWST data enable not only the detection of galaxies, but also an accurate estimate of their stellar mass.
3.2 The mass–luminosity relation
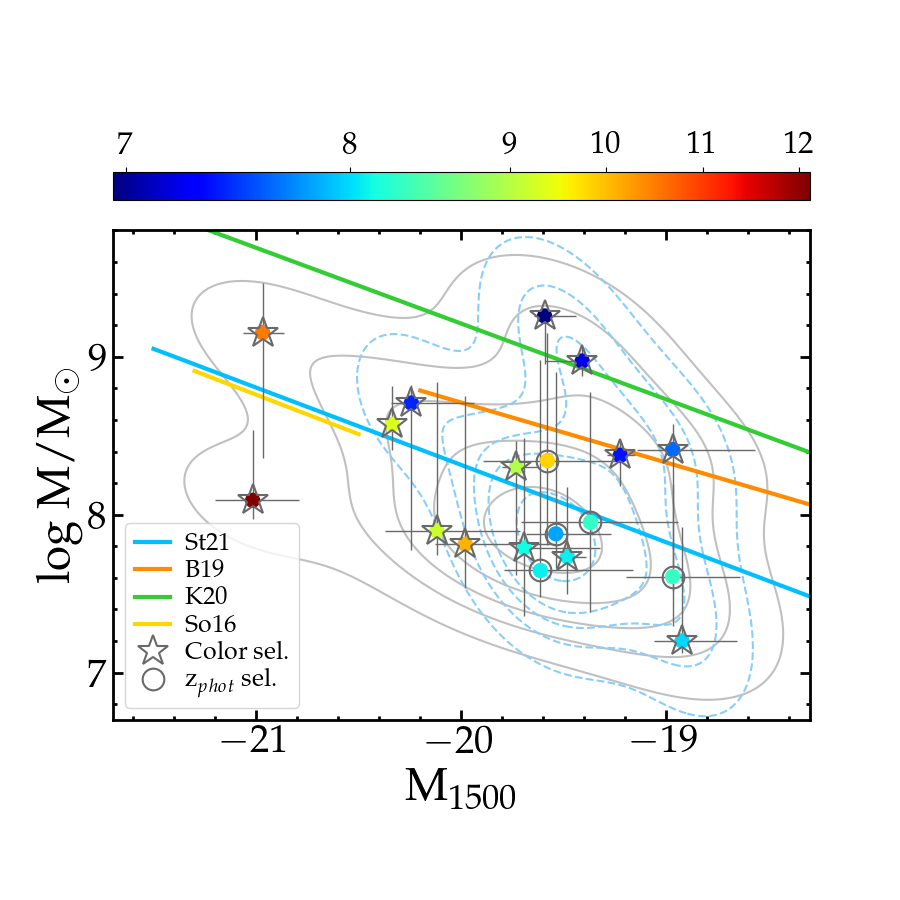
We revisit here the so-called mass-luminosity correlation for LBG and characterize for the first time whether it is valid, and what is the scatter around the relation, by means of JWST data.
Prior to JWST, numerous studies have relied on the UV stellar luminosities to estimate the stellar mass of high redshift galaxies, lacking rest-frame optical and near infrared data, by adopting an average (stellar) mass-(UV)luminosity correlation. This correlation has been used to estimate the stellar mass function by converting the UV luminosity function (e.g. González et al., 2011; Song et al., 2016; Kikuchihara et al., 2020).
Fig. 3 shows the mass-luminosity relation compared with previous estimates from the literature. At variance with previous works, our data do not show a correlation between mass and UV absolute magnitude, with a Pearson coefficient equal to -0.37 (a similar value is obtained limiting the fit to sources, for a cleaner comparison with previous studies). We note that the luminosity range probed by our data is limited due to the small volume of our observations, insufficient to include the brighter and rarer sources. Nevertheless, the scatter at is very large (a factor of 50 in mass). This happens despite the fact that our sample is biased in favour of LBG and against galaxies with older/dustier stellar populations (none of our candidates has a best-fit E(B-V) larger than 0.2), whose search requires a different strategy. Should these galaxies be detected in future JWST analysis, we expect the measured scatter in to further increase.
3.3 The stellar mass-to-light ratio
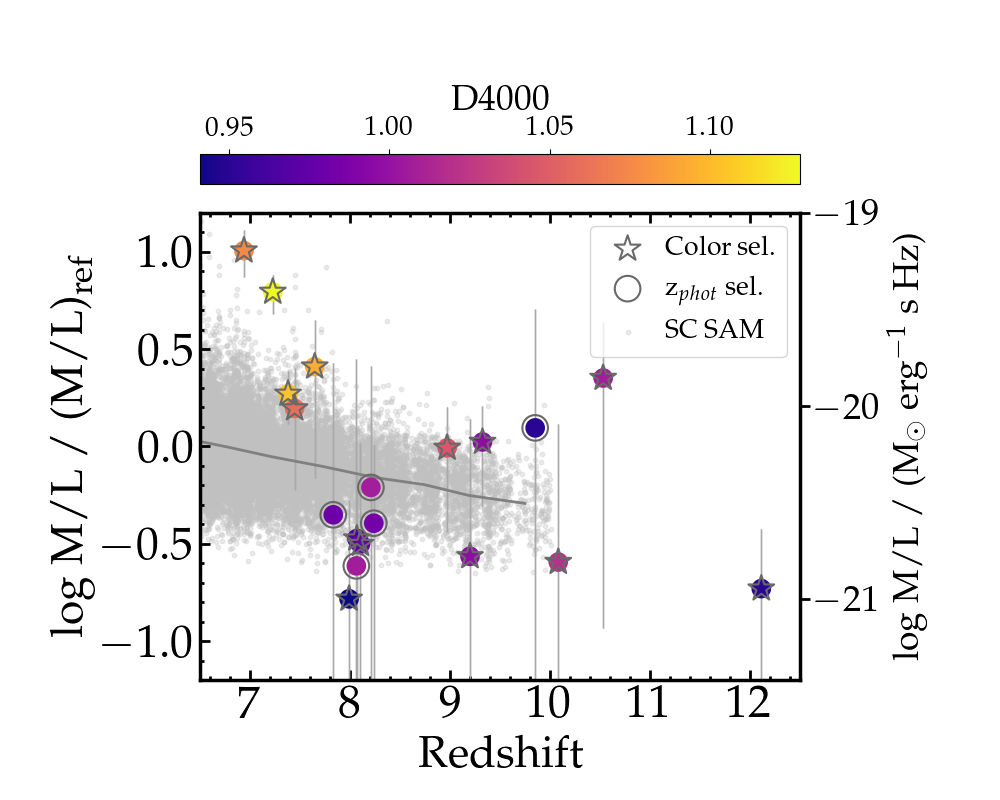
We show in Fig. 4 the mass-to-light ratio as a function of redshift. The mass-to-light ratio is plotted in units of a reference () calculated for a 100 Myr old galaxy, with Solar metallicity, no dust, and constant SFH (such a galaxy, according to Bruzual & Charlot 2003 models, has a stellar mass of 7.9 M⊙ and a 1500Å luminosity of 1.3 erg/s/Hz if normalized to a SFR of 1).
The mass-to-light significantly changes from galaxy to galaxy, spanning two orders of magnitude within our sample, consistent with what seen on Fig. 3. This result implies that the high- galaxy population is largely heterogeneous, with galaxies observed in different evolutionary stages, as well as experiencing a broad variety of SFHs. In particular, the observed high suggest the presence of evolved stellar populations already existing at these high redshift, with tantalizing evidence that aggregation of baryons may proceed at a faster rate than predicted by galaxy formation models.
The wide range of observed implies that previous results based on an average value for large galaxy samples should be revisited and revised, and might change significantly once JWST information is included.
As expected, the mass-to-light ratio correlates with the amplitude of the D4000 break, encoded in the color map, with more evolved systems showing higher . Similar behavior is observed also with other galaxy properties that are indicative of the galaxy evolutionary stage, such as the specific SFR or age/2444With the adopted parameterization, an age/2 equal to 1 corresponds to the peak of the SFH, with lower and higher values characterizing the increasing and decreasing phase, respectively..
Due to the large error bars, the limited size of the sample and incompleteness effects, it is difficult to assess or exclude an evolutionary trend.
To gain some insight on this issue, we plot in Fig. 4 the predictions from the Santa Cruz semianalytic model (Somerville et al., 2021), showing a decreasing trend all the way to . Our data encompass and exceed the predicted scatter in . The range of predicted in the model, spanning a factor of 10, correlates with the specific SFR, likely due to the combination of bursty and smooth SFHs. While observational uncertainties prevent us from drawing firm conclusions, the significantly larger scatter that we observe suggests that the simulations may underestimate the burstiness of mass growth.
3.4 The observed cosmic Stellar Mass Density
We discuss here the accuracy of cosmic Stellar Mass Density (SMD) estimates obtained by converting luminosities through an average ratio.
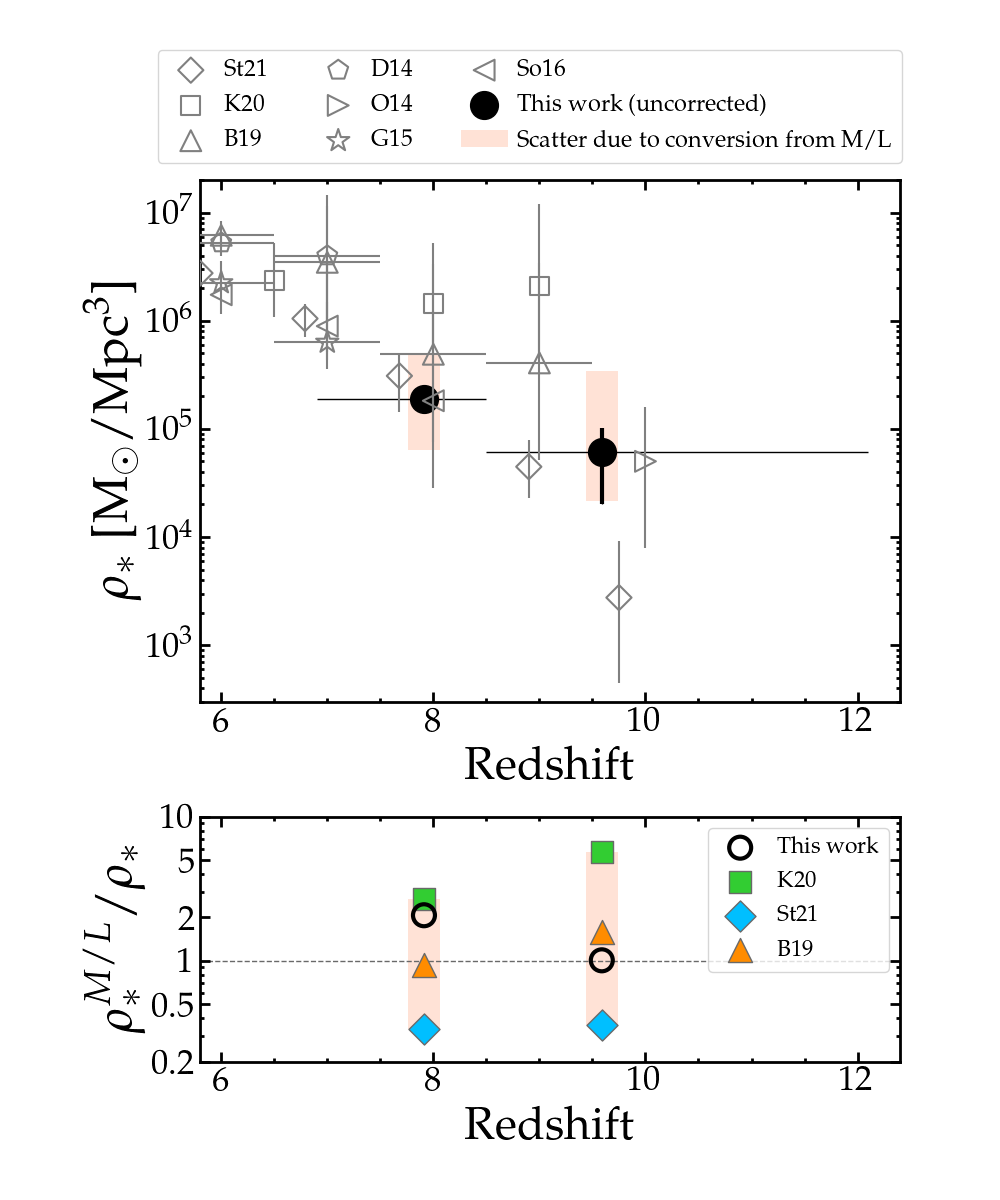
We show in the upper panel Fig. 5 a first attempt to infer the SMD. We calculate the observed SMD () by adding up the stellar masses of all galaxies in two redshift bins ( and ) and dividing by the cosmological volume of the bins. The associated error bars are obtained by propagating the mass uncertainties.
Following a common approach at these redshifts, we also compute the SMD () by converting UV luminosities through different mass-luminosity relations taken from the literature (Kikuchihara et al., 2020; Bhatawdekar et al., 2019; Stefanon et al., 2021), as well as by means of the mean measured in this study in each redshift bin. The salmon shaded regions on Fig. 5 show the range of SMDs spanned by these indirect measurements.
The ratio between these measurements and is shown in the lower panel of Fig. 5. This ratio can be as high as a factor of 6, in both directions. The actual discrepancy depends on the mass and luminosity distributions of the specific data set, that may be different from the one on which the mass-luminosity relations have been estimated. However, we note that not even the average inferred on the same sample of galaxies is always able to reproduce the measured SMD, depending on the distribution of sources within the redshift bin.
Fig. 5 also reports a collection of SMD measurements from the literature. These data show that, while a consensus has been reached at (e.g. McLeod et al., 2021), the global picture is much more uncertain at redshifts above , where more than a factor of 10 variance exists among different studies. In this first paper, we do not attempt to compare our finding with the literature. We defer this comparison to future work once incompleteness and lensing magnification will have been properly characterized (these two effects move the points in opposite directions). Nevertheless, we want to draw the attention to the level of uncertainty that can be introduced in the SMD when direct stellar mass measurements are not available. We have demonstrated that the scatter among the results obtained with various estimates of the is a dominant source of uncertainty, that will require the full power of JWST to be contained.
4 Summary and conclusions
This Letter presents a first analysis of the stellar masses and mass-to-light ratios of galaxies above . This analysis can only be performed thanks to the new GLASS-JWST NIRCam data that directly probe the rest-frame optical flux of these galaxies. We show that with JWST stellar masses of galaxy candidates can be measured with an accuracy that is at least 5-10 times better than previously possible, with considerably shorter exposure times. The observed UV spans two orders of magnitude, revealing a broad variety of physical conditions in early galaxies. We demonstrate that previous assumptions of an average UV , or mass-luminosity relation, may introduce systematic uncertainties in the cosmic SMD estimates that can be as high as a factor of 6. This exploratory study demonstrates the power of JWST for studying high redshift galaxies and the assembly of their stellar mass. We will address this topic in more detail in a future analysis after completion of the GLASS-JWST program.
References
- Bergamini et al. (2022) Bergamini, P., Acebron, A., Grillo, C., et al. 2022, Submitted to A&A, arXiv:2207.09416, arXiv:2207.09416. https://arxiv.org/abs/2207.09416
- Bertin & Arnouts (1996) Bertin, E., & Arnouts, S. 1996, A&AS, 117, 393
- Bhatawdekar et al. (2019) Bhatawdekar, R., Conselice, C. J., Margalef-Bentabol, B., & Duncan, K. 2019, MNRAS, 486, 3805, doi: 10.1093/mnras/stz866
- Bruzual & Charlot (2003) Bruzual, G., & Charlot, S. 2003, MNRAS, 344, 1000, doi: 10.1046/j.1365-8711.2003.06897.x
- Calzetti et al. (2000) Calzetti, D., Armus, L., Bohlin, R. C., et al. 2000, ApJ, 533, 682, doi: 10.1086/308692
- Carnall et al. (2018) Carnall, A. C., McLure, R. J., Dunlop, J. S., & Davé, R. 2018, MNRAS, 480, 4379, doi: 10.1093/mnras/sty2169
- Carnall et al. (2022) Carnall, A. C., Begley, R., McLeod, D. J., et al. 2022, Submitted to MNRAS Letters, arXiv:2207.08778, arXiv:2207.08778. https://arxiv.org/abs/2207.08778
- Castellano et al. (2014) Castellano, M., Sommariva, V., Fontana, A., et al. 2014, A&A, 566, A19, doi: 10.1051/0004-6361/201322704
- Castellano et al. (2016) Castellano, M., Amorín, R., Merlin, E., et al. 2016, A&A, 590, A31, doi: 10.1051/0004-6361/201527514
- Castellano et al. (2022) Castellano, M., Fontana, A., Treu, T., et al. 2022, ApJ, accepted, arXiv:2207.09436. https://arxiv.org/abs/2207.09436
- Chabrier (2003) Chabrier, G. 2003, ApJ, 586, L133, doi: 10.1086/374879
- Daddi et al. (2004) Daddi, E., Cimatti, A., Renzini, A., et al. 2004, ApJ, 617, 746, doi: 10.1086/425569
- Doyon et al. (2012) Doyon, R., Hutchings, J. B., Beaulieu, M., et al. 2012, in Society of Photo-Optical Instrumentation Engineers (SPIE) Conference Series, Vol. 8442, Space Telescopes and Instrumentation 2012: Optical, Infrared, and Millimeter Wave, ed. M. C. Clampin, G. G. Fazio, H. A. MacEwen, & J. Oschmann, Jacobus M., 84422R, doi: 10.1117/12.926578
- Duncan et al. (2014) Duncan, K., Conselice, C. J., Mortlock, A., et al. 2014, MNRAS, 444, 2960, doi: 10.1093/mnras/stu1622
- Fontana et al. (2000) Fontana, A., D’Odorico, S., Poli, F., et al. 2000, AJ, 120, 2206, doi: 10.1086/316803
- González et al. (2011) González, V., Labbé, I., Bouwens, R. J., et al. 2011, ApJ, 735, L34+, doi: 10.1088/2041-8205/735/2/L34
- Grazian et al. (2015) Grazian, A., Fontana, A., Santini, P., et al. 2015, A&A, 575, A96, doi: 10.1051/0004-6361/201424750
- Kikuchihara et al. (2020) Kikuchihara, S., Ouchi, M., Ono, Y., et al. 2020, ApJ, 893, 60, doi: 10.3847/1538-4357/ab7dbe
- Leethochawalit et al. (2022) Leethochawalit, N., Trenti, M., Santini, P., & Yang, L. e. a. 2022, ApJ, accepted, arXiv:2207.11135
- McLeod et al. (2021) McLeod, D. J., McLure, R. J., Dunlop, J. S., et al. 2021, MNRAS, 503, 4413, doi: 10.1093/mnras/stab731
- Medezinski et al. (2016) Medezinski, E., Umetsu, K., Okabe, N., et al. 2016, ApJ, 817, 24, doi: 10.3847/0004-637X/817/1/24
- Merlin et al. (2022) Merlin, E., Bonchi, A., Paris, D., Belfiore, D., & et al. 2022, ApJ, accepted, arXiv:2207.11701
- Merlin et al. (2016) Merlin, E., Amorín, R., Castellano, M., et al. 2016, A&A, 590, A30, doi: 10.1051/0004-6361/201527513
- Merlin et al. (2021) Merlin, E., Castellano, M., Santini, P., et al. 2021, A&A, 649, A22, doi: 10.1051/0004-6361/202140310
- Nayyeri et al. (2017) Nayyeri, H., Hemmati, S., Mobasher, B., et al. 2017, ApJS, 228, 7, doi: 10.3847/1538-4365/228/1/7
- Oesch et al. (2014) Oesch, P. A., Bouwens, R. J., Illingworth, G. D., et al. 2014, ApJ, 786, 108, doi: 10.1088/0004-637X/786/2/108
- Paulino-Afonso et al. (2022) Paulino-Afonso, A., González-Gaitán, S., Galbany, L., et al. 2022, A&A, 662, A86, doi: 10.1051/0004-6361/202142577
- Rieke et al. (2005) Rieke, M. J., Kelly, D., & Horner, S. 2005, in Society of Photo-Optical Instrumentation Engineers (SPIE) Conference Series, Vol. 5904, Cryogenic Optical Systems and Instruments XI, ed. J. B. Heaney & L. G. Burriesci, 1–8, doi: 10.1117/12.615554
- Roberts-Borsani et al. (2022) Roberts-Borsani, G., Morishita, T., Treu, T., et al. 2022, ApJ, accepted, arXiv:2207.11387. https://arxiv.org/abs/2207.11387
- Santini et al. (2012) Santini, P., Fontana, A., Grazian, A., et al. 2012, A&A, 538, A33, doi: 10.1051/0004-6361/201117513
- Schaerer & de Barros (2009) Schaerer, D., & de Barros, S. 2009, A&A, 502, 423, doi: 10.1051/0004-6361/200911781
- Somerville et al. (2021) Somerville, R. S., Olsen, C., Yung, L. Y. A., et al. 2021, MNRAS, 502, 4858, doi: 10.1093/mnras/stab231
- Song et al. (2016) Song, M., Finkelstein, S. L., Ashby, M. L. N., et al. 2016, ApJ, 825, 5, doi: 10.3847/0004-637X/825/1/5
- Stefanon et al. (2021) Stefanon, M., Bouwens, R. J., Labbé, I., et al. 2021, ApJ, 922, 29, doi: 10.3847/1538-4357/ac1bb6
- Treu et al. (2022) Treu, T., Roberts-Borsani, G., Bradac, M., et al. 2022, ApJ, 935, 110, doi: 10.3847/1538-4357/ac8158