\setstackgap
L \SetBgContents\LongstackPREPRINT - accepted by 30th IFIP/IEEE International Conference on Very Large Scale Integration 2022 (VLSI-SoC 2022)\SetBgPosition3.5cm,1cm\SetBgOpacity1.0\SetBgAngle0\SetBgScale1.8
NISTT: A Non-Intrusive SystemC-TLM 2.0
Tracing Tool
Abstract
The increasing complexity of systems-on-a-chip requires the continuous development of electronic design automation tools. Nowadays, the simulation of systems-on-a-chip using virtual platforms is common. Virtual platforms enable hardware/software co-design to shorten the time to market, offer insights into the models, and allow debugging of the simulated hardware. Profiling tools are required to improve the usability of virtual platforms. During simulation, these tools capture data that are evaluated afterward. Those data can reveal information about the simulation itself and the software executed on the platform.
This work presents the tracing tool NISTT that can profile SystemC-TLM-2.0-based virtual platforms. NISTT is implemented in a completely non-intrusive way. That means no changes in the simulation are needed, the source code of the simulation is not required, and the traced simulation does not need to contain debug symbols. The standardized SystemC application programming interface guarantees the compatibility of NISTT with other simulations. The strengths of NISTT are demonstrated in a case study. Here, NISTT is connected to a virtual platform and traces the boot process of Linux. After the simulation, the database created by NISTT is evaluated, and the results are visualized. Furthermore, the overhead of NISTT is quantified. It is shown that NISTT has only a minor influence on the overall simulation performance.
Index Terms:
SystemC, TLM, ESL, LD_PRELOAD- AAPCS64
- Procedure Call Standard for the 64-bit Architecture
- AArch64
- ARM 64-bit Architecture
- AI
- Artificial Intelligence
- AIBA
- An Automated Intra-cycle Behavioral Analysis for SystemC-based design exploration
- AMD
- Advanced Micro Devices
- API
- Application Programming Interface
- ARM
- Advanced RISC Machines
- AST
- Abstract Syntax Tree
- AVP64
- An ARMv8 Virtual Platform
- BL
- Branch-With-Link
- BP
- breakpoint
- CPU
- Central Processing Unit
- CRC
- Cyclic Redundancy Check
- CSV
- Character-Separated Values
- DB
- database
- DBMS
- \Acldb Management System
- DDR
- Double Data Rate
- DES
- Discrete Event Simulation
- DLA
- Deep Learning Accelerator
- DMI
- Direct Memory Interface
- DS
- Developer Studio
- DWARF
- Debugging With Arbitrary Record Formats
- EDA
- Electronic Design Automation
- ELF
- Executable and Linkable Format
- ESA
- European Space Agency
- ESL
- Electronic System Level
- fd
- file descriptor
- FIG
- Fault Injection in glibc
- FP
- Frame Pointer
- FPGA
- Field Programmable Gate Array
- FVP
- Fixed Virtual Platform
- GCC
- GNU Compiler Collection
- GDB
- GNU Debugger
- GIC
- Generic Interrupt Controller
- GOT
- Global Offset Table
- GUI
- Graphical User Interface
- HW
- Hardware
- IBM
- International Business Machines
- ID
- identifier
- IEEE
- Institute of Electrical and Electronics Engineers
- I/O
- Input/Output
- IR
- Intermediate Representation
- IRQ
- Interrupt Request
- ISS
- Instruction-Set Simulator
- LR
- Link Register
- MISO
- Master Input Slave Output
- MNIST
- Modified National Institute of Standards and Technology
- MOSI
- Master Output Slave Input
- NVDLA
- NVIDIA Deep Learning Accelerator
- OS
- Operating System
- PC
- Program Counter
- PID
- process ID
- PCCTS
- Purdue Compiler Construction Tool Set
- PCI
- Peripheral Component Interconnect
- PLT
- Procedure Linkage Table
- PMU
- Performance Monitoring Unit
- QEMU
- Quick Emulator
- RAM
- Random-Access Memory
- RISC
- Reduced Instruction Set Computer
- Real-Time Factor
- RTL
- Register-Transfer Level
- RTOS
- real-time operating system
- SATA
- Serial AT Attachment
- SD
- Secure Digital
- SDHCI
- SD Host Controller Interface
- SoC
- System-on-a-chip
- SP
- Stack Pointer
- SPI
- Serial Peripheral Interface
- SQL
- Structured Query Language
- SSD
- Solid State Drive
- SW
- Software
- TCP
- Transmission Control Protocol
- TLM
- Transaction-level Modeling
- UART
- Universal Asynchronous Receiver / Transmitter
- UNIX
- Uniplexed Information and Computing Service
- VCD
- Value Change Dump
- VCML
- Virtual Components Modeling Library
- VIPER
- Virtual Platform Explorer
- VP
- Virtual Platform
- WFI
- Wait For Interrupt
I Introduction
Nowadays, simulation is an important part of the design process of a System-on-a-chip (SoC). Virtual Platforms can be developed in an early stage of the design process to serve as the enabler of Hardware (HW)/ Software (SW) co-design. A VP is a simulation of a complete SoC that can execute target SW without modification. To support the development, standardized frameworks like SystemC-TLM 2.0 are used [1]. SystemC defines standardized interfaces for models and their connection at the Electronic System Level (ESL). The Transaction-level Modeling (TLM) extension abstracts communications between models like memory accesses or interrupts to speed up the simulation.
Compared to real HW, VPs have the benefit of allowing easy debugging and analysis. Due to Moore’s law and the related increasing complexity of SoCs, simulations have also become more nested and complex. This problem leads to performance issues in the simulation and the target SW. Additional tools are required to reveal which parts of the simulation or the target SW need to be optimized to overcome those issues. Those tools are called SystemC frontends. A distinction is made between static, dynamic, and hybrid approaches. Static approaches analyze the source code of the simulation and extract information without executing the simulation. Dynamic techniques take the dynamic behavior of the simulation into account. Modules that are created during runtime and the workload that is executed on the VP are considered. For that, the simulation is executed and analyzed. Hybrid approaches combine the two techniques by analyzing both the static and the dynamic behavior. Often, static analysis is used to search and annotate functions of interest. Based on those annotations, the dynamic behavior is analyzed. The static evaluation requires a tool that reads the source code of the simulation. This tool can either be a parser or a compiler.
In this paper, we present NISTT as a novel approach to tracing the behavior of SystemC-TLM-2.0-based simulations. The design goals of NISTT are:
As shown in Fig. 1, NISTT is placed between the VP and the SystemC library. It can intercept function calls to the SystemC library to analyze data. NISTT does not place any requirements on the simulation or the used toolchain. The official SystemC library and the preferred toolchain can be used without changes. The standardization of the SystemC Application Programming Interface (API) guarantees compatibility. Furthermore, NISTT is invisible to the simulation. The simulation behavior is untouched.
II Related Work
| SystemC Frontend | Analysis | Non-Intrusive | Works Without Access To | Used Tools | ||
|---|---|---|---|---|---|---|
| Static | Dynamic | Source Code | Debug Symbols | |||
| SystemCXML [2] | ✓ | ✓ | ✗ | ✓ | Doxygen | |
| \hdashlineParSysC [3] | ✓ | ✓ | ✗ | ✓ | Parser | |
| \hdashlineGenz et al. [4] | ✓ | ✓ | ✓ | ✗ | ✓ | PCCTS-based parser |
| \hdashlinePinapa [5] | ✓ | ✓ | ✗ | ✗ | ✓ | Modified GCC, modified SystemC library |
| \hdashlinePinaVM [6] | ✓ | ✓ | ✗ | ✗ | ✓ | LLVM, modified SystemC library |
| \hdashlineSHaBE [7] | ✓ | ✓ | ✓ | ✗ | ✗ | GCC plugin, GDB |
| \hdashlineAIBA [8] | ✓ | ✓ | ✓ | ✗ | ✗ | GDB |
| \hdashlineQuiny [9] | ✓ | ✗ | ✗ | ✓ | Modified SystemC library | |
| \hdashlineScoot [10] | ✓ | ✗ | ✗ | ✓ | Custom C++ frontend, simplified SystemC library | |
| \hdashlineReSp [11] | ✓ | ✓ | ✗ | ✓ | Python wrapper | |
| \hdashlineStoppe et al. [12] | ✓ | ✓ | ✓ | ✗ | ✗ | Debug symbols, SystemC API |
| NISTT | ✓ | ✓ | ✓ | ✓ | LD_PRELOAD | |
Over the past years, many SystemC frontends have been developed. An overview of different frontends has been created by Marquet et al. in [13]. Table I shows an extended compilation of existing approaches. As mentioned before, the approaches can be classified as static, dynamic, or hybrid.
The static approaches are often based on a parser that analyzes the C++ source code of the simulation and derives information from the parsed output. Different approaches for the implementation of the parser exist. SystemCXML [2] uses Doxygen’s C++ front end to parse the module code. ParSysC [3] uses a Purdue Compiler Construction Tool Set (PCCTS)-based parser to convert the SystemC representation to a Register-Transfer Level (RTL) Intermediate Representation (IR) to analyze the simulated system. Genz et al. also developed a PCCTS-based parser for the static analysis and a code generator that injects additional code into the simulation to evaluate runtime information [4].
A problem that often occurs when SystemC parsers are used is the limitation to a subset of the SystemC language. Therefore, compilers can be used instead of parsers to extract static information. Pinapa [5] uses a modified GNU Compiler Collection (GCC) to get the abstract syntax tree of the simulation from which static information is extracted. Dynamic information is extracted by executing the elaboration phase of the simulation, in which SystemC builds up the module hierarchy. Pinapa has been further developed to PinaVM [6]. PinaVM uses the LLVM IR to insert additional code into the simulation that is used to capture runtime information.
SHaBE [7] and AIBA [8] use GNU Debugger (GDB) to debug the simulation during execution. SHaBE uses a GDB plugin to extract data during the elaboration phase to build up the module hierarchy. AIBA creates a GDB command file from a static analysis which controls GDB during the execution to set breakpoints and store data. This approach has been further developed to support the tracing of TLM transactions [14]. Quiny [9] is a dynamic approach that uses a modified SystemC library that implements C++ operator overloading to retrieve information during runtime. Scoot [10] is a model extractor based on a custom C++ frontend that analyzes the source code using simplified SystemC header files to extract the module hierarchy, sensitivity list of the processes, and the port bindings. ReSp [11] adds Python wrappers to SystemC models which allow interaction during the simulation. The approach proposed by Stoppe et al. [12] uses the debug information of the compiled simulation executable and the SystemC API to capture simulation-related data.
Most presented static approaches try to extract the module hierarchy and the connections between the modules. This information does not include the runtime behavior of the simulation. Furthermore, all approaches need access to the source code of the simulation to either directly analyze it or compile the simulation using customized tools. That can be a drastic limitation, especially for industrial VPs where the source code is not distributed to the customer. Another aspect that stood out is the need for an extensive static analysis most hybrid approaches use to configure their dynamic analysis. It would be beneficial to perform the dynamic analysis without a preceding static one to keep the complexity of the tool as low as possible. For those reasons, the idea for the development of NISTT is to create a tracing tool that works without a static analysis, does not require access to the source code of the simulation, and is as simple as possible.
III Proposed NISTT Approach
The design idea behind NISTT is to create a tool that is capable of tracing an already compiled SystemC-TLM-2.0-based simulation without accessing its source code or debug symbols. These requirements increase the usability of the tracing tool compared to existing approaches. To trace an already compiled simulation, NISTT intercepts the calls of the simulation to the shared SystemC library to extract data. The interception of function calls without access to the source code can be done due to the standardized SystemC API. The LD_PRELOAD feature of the Linux dynamic linker/loader, ld, is used to perform this interception. ld is responsible for loading shared libraries that are needed by a program. During runtime, ld dynamically links function calls to those libraries. The shared libraries that are needed by an executable are listed in the dynamic section of the compiled Executable and Linkable Format (ELF) file. The Linux environment variable LD_PRELOAD can be used to define paths of additional shared libraries that are loaded by ld, regardless of whether they are required by the executable or not. When the executable calls a function that is defined in a shared library, ld needs to resolve that call. The matching of the function to be called and the available functions is based on the function name. In the case of a C program, that name corresponds to the name given by the programmer. For C++ programs, a mangled name is used that is created by the compiler based on the name, return type, and parameter types of the function.
Preloading a library that contains a function with the same name as a function of a required shared library overrides the implementation of that function. When the executable calls the function, ld resolves the call. ld searches for an implementation of that function in the loaded shared objects. The first function that is found is the one implemented in the preloaded library because it is loaded before the required libraries. Thus, preloading can be used to intercept calls to a shared library by implementing a function with the same name in a preloaded library.
III-A Working Principle of NISTT
NISTT uses LD_PRELOAD to intercept calls to the SystemC library and extract tracing information. That enables interaction with the simulation without changing or accessing the source code of the simulation or dependent libraries. The only requirement is that the simulation must be dynamically linked against a SystemC-TLM-2.0-compatible library.
The working principle of NISTT is shown in Fig. 2. NISTT is a library that needs to be preloaded to a SystemC-TLM-2.0-based simulation using LD_PRELOAD. The library implements SystemC functions whose calls and passed data should be traced. When the simulation calls such a function, ld links the call to the NISTT implementation . NISTT can then access and evaluate the passed parameters and store a data point in a database . The original SystemC function is called afterward to keep the simulation behavior unchanged . For that, the API of the Linux dynamic linker/loader is used. After the original SystemC function returns , a second data point can be stored in the database . Then, the NISTT function returns . When the simulation calls a SystemC function that is not implemented in NISTT, dl directly forwards the call to the original library, as shown by the solid arrows on the left.
III-B Traced SystemC Functions
NISTT can trace the following simulation properties:
-
•
SystemC process/coroutine scheduling
-
•
Quantum duration of processes
-
•
Processes waiting on event notifications
-
•
Notification of events
-
•
Course of simulation time and real-time
NISTT overrides multiple variants of the SystemC function wait to intercept its calls. wait can be used inside SystemC threads to suspend the execution of the thread in a non-preemptive way and resume it at a later point in time. Parameters can be passed to the wait function to specify when the SystemC scheduler should resume the execution of the thread. One variant of the wait function accepts an amount of simulation time that needs to pass until the thread is resumed. Another implementation gets a SystemC event or a collection of SystemC events as a parameter. In that case, the thread is resumed once the events have been notified. When an overridden wait function of NISTT is called, the name of the calling SystemC process and simulation time/real-time timestamps are stored in a database along with information on the duration of the suspension. Depending on the parameters of the wait function, that information is either the amount of simulation time that should be waited or the name of the event that needs to be notified.
The data stored on wait calls can be used for various analyses. For instance, they provide information on the scheduling of SystemC threads. SystemC threads are coroutines that use the wait function to suspend their execution by calling the scheduler. During an intercepted wait call, the first data point is stored in the database when the execution of a thread is suspended . Before the thread is resumed, a second data point is stored . To trace the first entry into a thread, NISTT also intercepts calls to the function sc_thread_cor_fn. This function is used to invoke a coroutine.
Another property that can be derived from wait calls is the quantum duration. In loosely-timed SystemC-TLM 2.0 simulations, the concept of temporal decoupling is used. Thereby, the simulation performance is increased by reducing the temporal accuracy. SystemC threads are allowed to run ahead of the global simulation time to decrease the number of synchronizations. They keep the elapsed time since their last synchronization with the global simulation time as their local time. When the local time of a thread exceeds a limit or an operation that requires high accuracy should be executed, the thread needs to synchronize with the global simulation time. This synchronization is done by calling the wait function with the difference in time as a parameter. This difference in time is called quantum. The used quantum durations of the process provide information on the simulation performance. In general, large quantum durations are targeted because they increase the decoupling and thereby accelerate the simulation.
Apart from the wait function that gets a time as a parameter, SystemC also offers a function to suspend the execution of a thread until a specified event is notified. This function can, e.g., be used in the implementation of a CPU model to implement a Wait For Interrupt (WFI) instruction. To emulate the execution of WFI on a VP, wait can be called with the interrupt event as parameter. Besides tracing threads that are waiting on notifications of events, NISTT can also trace the notification itself. For that, the SystemC function notify of the class sc_event is implemented in NISTT to intercept calls. Depending on the parameters, the event is directly notified, or the notification is delayed by the specified amount of simulation time.
Every data point that is stored in the database contains timestamps of the current simulation time and the elapsed real-time since the beginning of the simulation. Those two timestamps can be used to put the simulation time in relation to the time needed for the simulation, the real-time . The Real-Time Factor () can be calculated to measure the simulation performance.
The data stored in the database can be visualized and evaluated in a post-processing step. Visualizations using Python and Matplotlib [15] are presented in the next chapter.
In the future, additional SystemC functions can be implemented in NISTT to extend the functionality. However, there are some limitations. Inlined SystemC functions and methods defined in template classes cannot be overridden using preloading. That is because they are directly compiled into the executable that uses those functions and therefore not stored in the shared library.
IV Experimental Evaluation
NISTT is used to profile the boot process of a VP in a case study to demonstrate the functionality of the tool. The tracing overhead is measured and compared to an intrusive implementation. As the profiled target, the Virtual Components Modeling Library (VCML)-based [16] VP AVP64 [17] is used. Since NISTT is implemented in a non-intrusive way, no changes in SystemC, VCML, or AVP64 are needed.
Fig. 3 depicts the architecture of the VP. It consists of an ARMv8 CPU and peripherals that are connected via a bus. Interrupts are implemented by a TLM-based interrupt protocol. An Operating System (OS) kernel like Linux can be booted from a virtual Secure Digital (SD) card using the Host Controller Interface (SDHCI). PL011 ARM PrimeCell UART models serve as user interface. They can be configured to print their output to the host’s terminal and read-in user input. The VP is a loosely-timed simulation, i.e., the SystemC threads are temporal decoupled, keep their local time, and regularly synchronize with the simulation time. Memory accesses and interrupts are implemented by TLM transactions.
All benchmarks have been executed on a computer equipped with a AMD Ryzen 9 3900X 12-Core CPU, RAM, and a Samsung 860 EVO SATA III SSD, running CentOS 7.9 with Linux 3.10.0. The maximum allowed quantum duration for the simulation was .
IV-A Case Study
AVP64 was started with NISTT being preloaded. Fig. 4 depicts the captured results of the first seconds of the Linux boot process. The during the simulation is shown in Fig. 4a. It can be observed that the fluctuates during the simulation. This fluctuation depends on the workload that is executed on the VP. Different parts of the workload cause different CPU utilization. When the utilization is low, idle cycles of the CPU are not simulated, which increases the performance. Besides that aspect, interactions with peripherals can also reduce the due to early quantum terminations.
Fig. 4b shows the used quantum durations of the CPU thread. During the periods where the is low, the quanta are comparatively small. If no data points are printed, that point in time has not been simulated for the CPU model. The reason for that is that the state of the CPU stayed unchanged during that time. That is, e.g., the case when the CPU is in idle mode. The Linux idle mode is implemented by executing the WFI instruction. AVP64 emulates this instruction by using the SystemC wait function with the interrupt event as a parameter. Thereby, the execution of the processor thread is suspended until the next interrupt raises.
Fig. 4c visualizes the notified SystemC events. The IN_FREE event is used by the VCML register model to serialize parallel accesses to TLM target sockets of a peripheral. It is notified after each handled transaction of the corresponding peripheral. That means, every time the IN_FREE event is notified, a register of the peripheral has been written. Thus, the figure reveals when interactions with peripherals take place.
Besides the IN_FREE event, the events IRQ[0]_ev and arm_timer_ns of the CPU model are of importance. The first event, IRQ[0]_ev, is notified every time an interrupt is signaled to the CPU by the Generic Interrupt Controller (GIC). That is the reason why the notification pattern of the IRQ[0]_ev of the CPU and the IN_FREE event of the GIC look similar. Every time an interrupt is signaled to the CPU, the CPU interacts with the CPU interface of the GIC to handle and acknowledge the interrupt. The second event of the CPU, arm_timer_ns, is used to implement a timer. When the timer is set to expire after a certain time, the event is programmed to be notified at this time. This delayed notification is visualized in Fig. 4c by an arrow starting at the time of programming and pointing to the time of expiration. There are three periods during the boot process where the timer is programmed to expire after a comparatively long period of time (-; -; -). During these periods, no quantum data were recorded. That strengthens the assumption that the OS was in idle mode during those periods and used the timer to wake up.
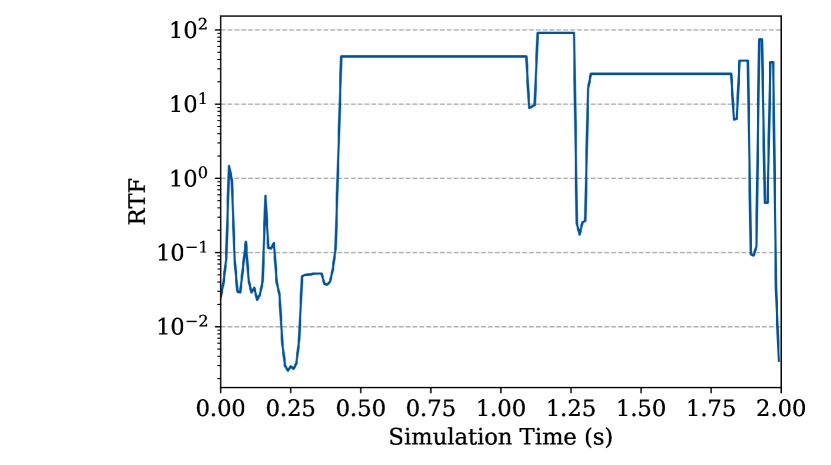
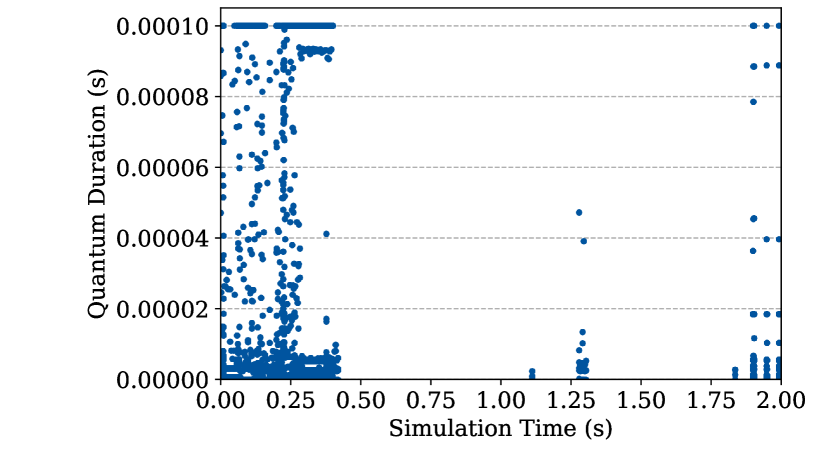
Table II shows the needed computation time to execute the SC_THREADs of the VP. The simulation of of the Linux boot took . of the simulation, the processor thread of the CPU model was active. Since the boot process is used as the benchmark, the CPU was the most compute-intensive model of the platform.
| Module | SC_THREAD | Compute Time () | Amount () |
|---|---|---|---|
| System | timeout | ||
| \hdashlineETHOC | tx_process | ||
| \cdashline2-3 | rx_process | ||
| \hdashlineSDHCI | dma_tread | ||
| \hdashlineCPU | processor_thread | ||
| Total |
IV-B Performance
The idea of NISTT is to trace the execution of a VP and to place as few requirements as possible on the simulation. Therefore, LD_PRELOAD is used to limit the requirements to the usage of a shared SystemC library. This section examines whether the performance of NISTT is reduced due to its non-intrusive implementation. If changing simulation-dependent libraries had not conflicted with the requirements, instrumentation of functions of interest inside the SystemC library would have been an alternative implementation with the same tracing results as NISTT. This alternative, intrusive implementation is compared to NISTT to evaluate the differences in performance. Furthermore, the general overhead of NISTT is classified.
The simulation of the VP is executed in four different configurations to evaluate the tracing overhead of NISTT. As shown in Table III, the configurations differ in the tracing implementation and the way the simulation is linked against SystemC. NISTT requires a dynamic linkage against SystemC to work. The intrusive reference implementation is used to profile the overhead of intercepting function calls using preloading. As a reference, the execution time of the unmodified VP without tracing is measured.
| Name | Tracing | SystemC Linkage |
|---|---|---|
| Reference | - | dynamic |
| \hdashlineI,static | intrusive | static |
| \hdashlineI,shared | intrusive | dynamic |
| \hdashlineNI,shared (NISTT) | non-intrusive | dynamic |
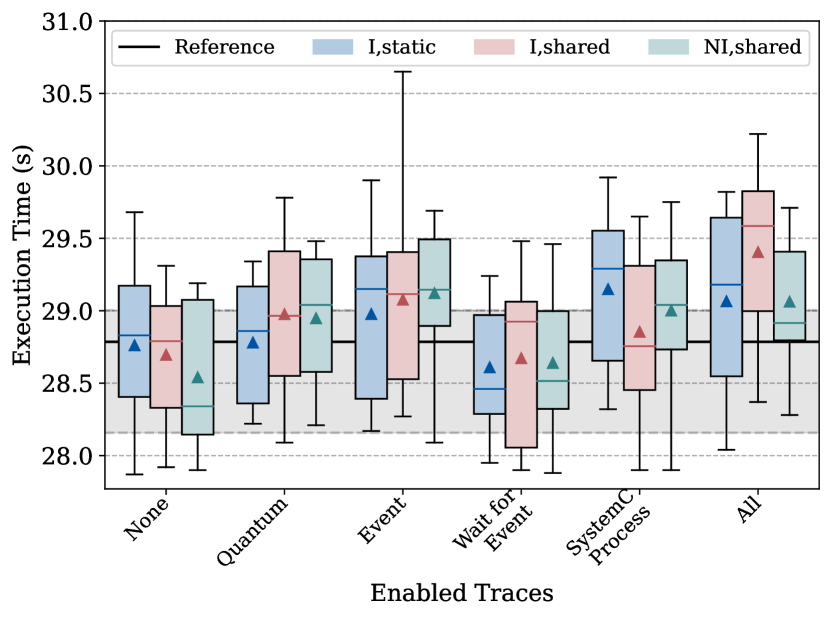
The first of the Linux boot process are again used as the benchmark to quantify the overhead of NISTT and the two intrusive implementations compared to the reference VP without tracing. Fig. 5 shows the results for the different configurations and different activated traces.
When the tracing is implemented but deactivated (cf. None), i.e., additional functions are present in either SystemC or the preloaded NISTT library, but data are not stored in a database, the execution times are similar to the one of the reference implementation without tracing. In general, no clear relation between used linking and needed execution time could be detected. Even NISTT does not harm the simulation performance compared to the corresponding intrusive implementation. What is noticeable, however, is that the kind of tracing that is enabled has an influence on the execution time. That is because the traces are executed with different frequencies and therefore cause various overheads. The Wait for Event trace, e.g., is only triggered times during the simulation and therefore caused only a little overhead. The Quantum trace captured data points which results in a visibly higher execution time. The highest overhead is created, and most data points are stored, by the Event trace ( data points) and the SystemC Process trace (ata points). Those results show that the produced overhead is mainly caused by the kind of the trace rather than its implementation (intrusive/non-intrusive) or used linkage. However, a non-intrusive implementation like NISTT has the advantage that the simulation does not need to be adapted to the tool. The standardized SystemC API assures compatibility. Furthermore, no access to the source code of the simulation is needed for the non-intrusive implementation. The simulation itself stays unchanged and does not need to be recompiled to be traced.
V Conclusion
This paper presents a novel approach for tracing a SystemC-TLM-2.0-based simulation in a non-intrusive way. Due to the standardization of the SystemC API, NISTT can trace every simulation that is based on SystemC without making special requests to the implementation. Source code or debug symbols of the simulation are not needed, which drastically increases the usability compared to existing approaches. NISTT stores the captured tracing data in a database to allow evaluation and analysis in a post-processing step. We showed that the non-intrusive implementation of NISTT does not reduce the performance compared to an intrusive one. The non-intrusive implementation has the advantage of not requiring compile-time modifications. Thereby, also VPs can be analyzed where the source code can not be accessed.
However, there is also a limitation of NISTT due to its implementation using preloading. NISTT is only capable of redirecting calls to SystemC functions that are located in the library object file. Thereby, calls to inlined functions or functions of template classes cannot be intercepted. Despite this limitation, NISTT is a powerful tool that offers deep insights into SystemC-TLM-2.0-based simulations like VPs without the need of having access to their source code. It can capture relevant ESL-simulation data and can easily be extended to trace additional functions of interest.
References
- [1] IEEE Standards Association and others, “IEEE standard for standard SystemC language reference manual,” pp. 1–638, conference Name: IEEE Std 1666-2011 (Revision of IEEE Std 1666-2005).
- [2] D. Berner, J.-P. Talpin, H. D. Patel, D. Mathaikutty, and S. K. Shukla, “SystemCXML: An exstensible SystemC front end using XML.” in FDL, pp. 405–409.
- [3] G. Fey, D. Große, T. Cassens, C. Genz, T. Warode, and R. Drechsler, “ParSyC: an efficient SystemC parser,” in In SASIMI. Citeseer.
- [4] C. Genz and R. Drechsler, “Overcoming limitations of the SystemC data introspection,” in 2009 Design, Automation & Test in Europe Conference & Exhibition. IEEE, pp. 590–593.
- [5] M. Moy, F. Maraninchi, and L. Maillet-Contoz, “Pinapa: An extraction tool for systemc descriptions of systems-on-a-chip,” in Proceedings of the 5th ACM international conference on Embedded software, pp. 317–324.
- [6] K. Marquet and M. Moy, “PinaVM: a SystemC front-end based on an executable intermediate representation,” in Proceedings of the tenth ACM international conference on Embedded software, pp. 79–88.
- [7] H. Broeders and R. Van Leuken, “Extracting behavior and dynamically generated hierarchy from SystemC models,” in 2011 48th ACM/EDAC/IEEE DAC. IEEE, pp. 357–362.
- [8] M. Goli, J. Stoppe, and R. Drechsler, “AIBA: an automated intra-cycle behavioral analysis for SystemC-based design exploration,” in 2016 IEEE 34th International Conference on Computer Design (ICCD). IEEE, pp. 360–363.
- [9] T. Schubert and W. Nebel, “The quiny SystemCTM front end: Self-synthesising designs,” in Advances in Design and Specification Languages for Embedded Systems. Springer, pp. 93–109.
- [10] N. Blanc, D. Kroening, and N. Sharygina, “Scoot: A tool for the analysis of SystemC models,” in International Conference on Tools and Algorithms for the Construction and Analysis of Systems. Springer, pp. 467–470.
- [11] G. Beltrame, L. Fossati, and D. Sciuto, “Resp: A nonintrusive transaction-level reflective mpsoc simulation platform for design space exploration,” vol. 28, no. 12, pp. 1857–1869, publisher: IEEE.
- [12] J. Stoppe, R. Wille, and R. Drechsler, “Data extraction from SystemC designs using debug symbols and the SystemC API,” in 2013 IEEE Computer Society Annual Symposium on VLSI (ISVLSI). IEEE, pp. 26–31.
- [13] K. Marquet, M. Moy, and B. Karkare, “A theoretical and experimental review of SystemC front-ends,” in 2010 Forum on Specification & Design Languages (FDL 2010). IET, pp. 1–6.
- [14] M. Goli, J. Stoppe, and R. Drechsler, “Automated nonintrusive analysis of electronic system level designs,” vol. 39, no. 2, pp. 492–505.
- [15] J. D. Hunter, “Matplotlib: A 2d graphics environment,” vol. 9, no. 3, pp. 90–95, publisher: IEEE COMPUTER SOC.
- [16] J. H. Weinstock, “Virtual components modeling library (vcml),” original-date: 2018-01-22T10:24:21Z. [Online]. Available: https://github.com/janweinstock/vcml
- [17] L. Jünger, J. H. Weinstock, R. Leupers, and G. Ascheid, “Fast SystemC processor models with unicorn,” in Proceedings of the Rapid Simulation and Performance Evaluation: Methods and Tools, ser. RAPIDO ’19. Association for Computing Machinery, pp. 1–6. [Online]. Available: https://doi.org/10.1145/3300189.3300191