Geometry and physics in the deformations of crystalline caps
Abstract
Elucidating the interplay of stress and geometry is a fundamental scientific question arising in multiple fields. In this work, we investigate the geometric frustration of crystalline caps confined on the sphere in both elastic and plastic regimes. Based on the revealed quasi-conformal ordering, we discover the partial, but uniform screening of the substrate curvature by the induced curvature underlying the inhomogeneous lattice. This scenario is fundamentally different from the conventional screening mechanism based on topological defects. In the plastic regime, the yield of highly stressed caps leads to fractures with featured morphologies not found in planar systems. We also demonstrate the strategy of engineering stress and fractures by vacancies. These results advance our general understanding on the organization and adaptivity of geometrically-frustrated crystalline order.
I Introduction
Condensed matters confined on curved geometries are widely seen in multiple fields, Nelson (2002a); Bowick and Giomi (2009) ranging from protein shells Caspar and Klug (1962); Lidmar et al. (2003); Zandi et al. (2004) to liquid interfaces coated by colloids Dinsmore et al. (2002); Bausch et al. (2003); Ershov et al. (2013) and liquid-crystals. Nelson (2002b); Fernández-Nieves et al. (2007) The intrinsic conflict of two-dimensional ordering and substrate curvature creates unique stress patterns. Grason and Davidovitch (2013); Azadi and Grason (2014) Especially, resolving the accumulated stress in regular particle arrays leads to rich physics associated with the elastic Grason and Davidovitch (2013); Vernizzi et al. (2011) and plastic Azadi and Grason (2014); Li et al. (2019); Yao (2017); Mitchell et al. (2017) response of the system, which also underlies a host of problems in materials geometry. Examples include the curvature driven patterned deformations Grason and Davidovitch (2013); Vernizzi et al. (2011); Klein et al. (2007) and the exceedingly rich topological defect structures. Bausch et al. (2003); Bowick et al. (2002); Irvine et al. (2010); Kusumaatmaja and Wales (2013) While much has been learned about the elastic patterns and defect motifs in curved 2D crystals, Nelson (2002a); Bowick and Giomi (2009); Audoly and Pomeau (2010) the microscopic process of the transition from the elastic deformation to the yield of the crystalline order and its connection with stress has not yet been fully explored.
The goal of this work is to elucidate these fundamental questions regarding the adaptivity of crystalline order on curved space. Li et al. (2019); Yao (2017) The spherical crystalline cap provides a suitable model to address these questions. Grason and Davidovitch (2013); Li et al. (2019); Yao (2017) The crystalline cap is composed of a regular array of point particles that interact by the Lennard-Jones (L-J) potential. Jones (1924) In this work, by applying the fixed boundary condition, the stretching of the cap could be precisely controlled by shrinking the sphere. By the combination of geometric analysis and elasticity theory, we analytically analyze the inhomogeneous packings of the particles in mechanical equilibrium, reveal the quasi-conformal ordering underlying the inhomogeneous lattice, and discover the partial, but uniform screening of the substrate curvature by the inhomogeneity-induced curvature. This scenario is fundamentally different from the conventional screening mechanism based on topological defects. Nelson and Peliti (1987); Bowick et al. (2000) The highly stressed cap ultimately experiences plastic deformation. The featured morphology of the fracture and the associated energetics are discussed. We also demonstrate the strategy of exploiting the stress-concentration effect of vacancies Timoshenko and Goodier (1970); Landau and Lifshitz (1959) to engineer stress and fractures. This work demonstrates the rich physics in the deformations of crystalline caps, and may have implications in the engineering of extensive crystalline materials.
II Model and method
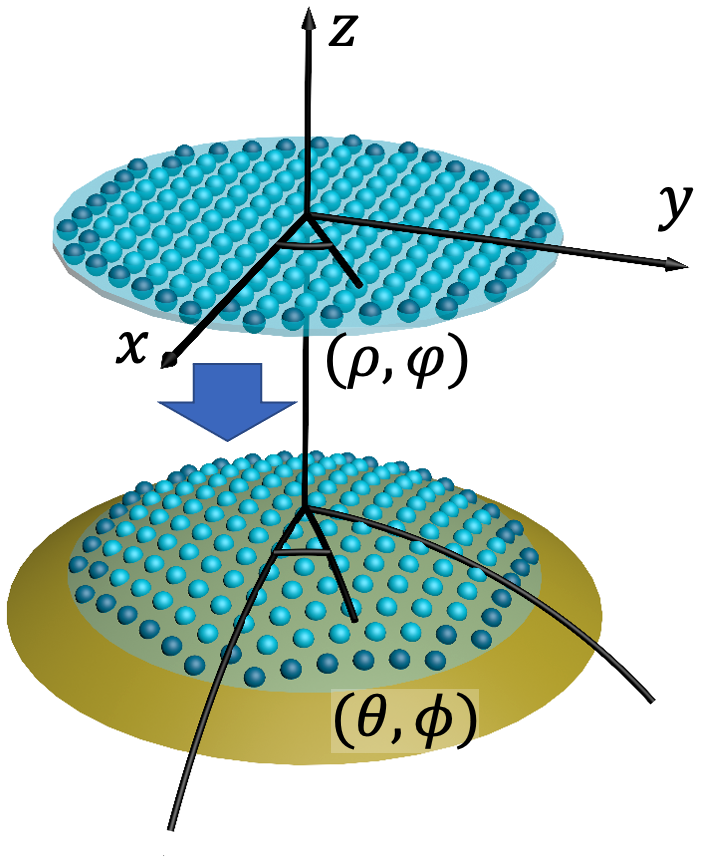
In our model, the L-J potential allows us to conveniently explore both the elastic and plastic regimes; the formally simple L-J potential has also been extensively used to model various chemical and physical bonds . Israelachvili (2011) , where is the Euclidean distance between two particles, is the equilibrium distance, and is the minimum potential energy. All of the particles are confined on the sphere of radius by geometric constraint without resorting to any external potential. The particles on the boundary annulus of the cap are anchored, which constitutes the fixed boundary condition [see Fig. 1(a)]. The cap is stress free in the limit of infinitely large . The degree of the stretching is characterized by , where is the radius of the circular boundary and is the geodesic radius of the spherical cap. , where is the Gaussian curvature of the spherical substrate of radius . do Carmo (1976) as . In simulations, the radius of the sphere is gradually reduced. For each given , the system is fully relaxed to the lowest energy state by the movement of the particles on the surface of the sphere according to the high-precision steepest descent method. Snyman and Wilke (2005); Yao and Olvera de la Cruz (2016); SI In this work, the units of length and energy are and .
III Results and discussion
We first analytically analyze the elastic deformation of the crystalline cap by the continuum elasticity theory. The packing of the L-J particles in mechanical equilibrium is determined by the force balance equations in terms of the stress tensor . Landau and Lifshitz (1959) In spherical coordinates (, ), the in-plane force balance equation of becomes
| (1) | |||
| (2) |
To deal with the boundary condition, we express the force balance equations in terms of the displacement over the undeformed planar disk, where the polar coordinates are established [see Fig. 1(a)]. The detailed derivation is presented in Supplemental Material. Belytschko et al. (2013); SI By applying the boundary conditions of and making use of the rotational symmetry of the system, we obtain the analytical expressions for the strain field up to :
| (3) | ||||
| (4) | ||||
The shear components of the strain tensor are zero. In Eqs.(3) and (4), the terms in the square brackets are the higher order correction terms in comparison with the conventional approximate solutions to the FvK equations. The FvK equations describe the out-of-plane deformation of plates. Landau and Lifshitz (1959). The axisymmetric form of the FvK equations is:Grason and Davidovitch (2013); King et al. (2012)
| (5) | ||||
| (6) |
and are the in-plane stress tensors in polar coordinates on the undeformed plate. is the out-of-plane deformation. is the bending modulus, is the exerted normal force per unit area and is the Laplacian operator. By expressing Eq. (5) in terms of and applying the boundary conditions , we obtain the expressions for the strain field up to the order of , as contained in Eqs. (3) and (4). SI
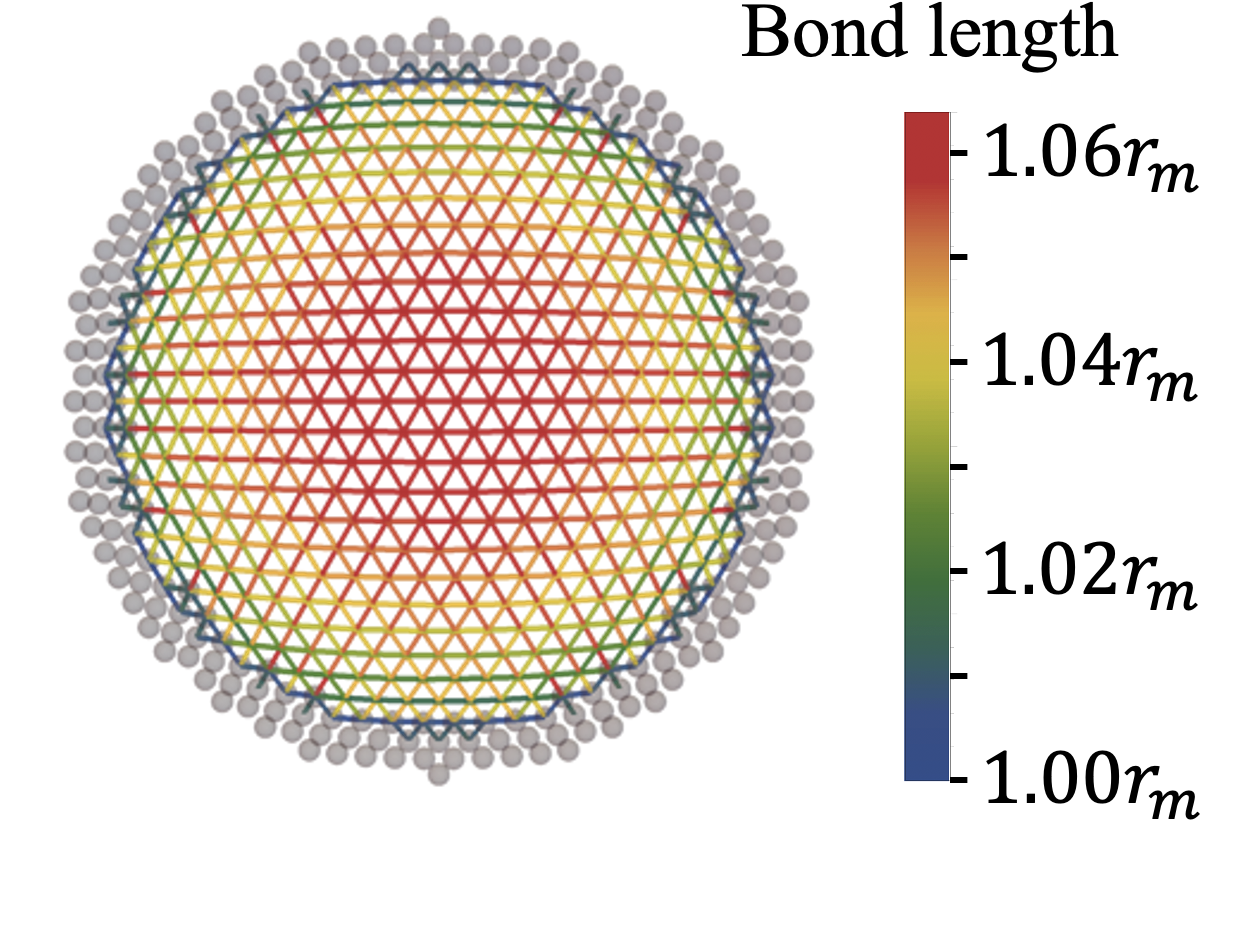
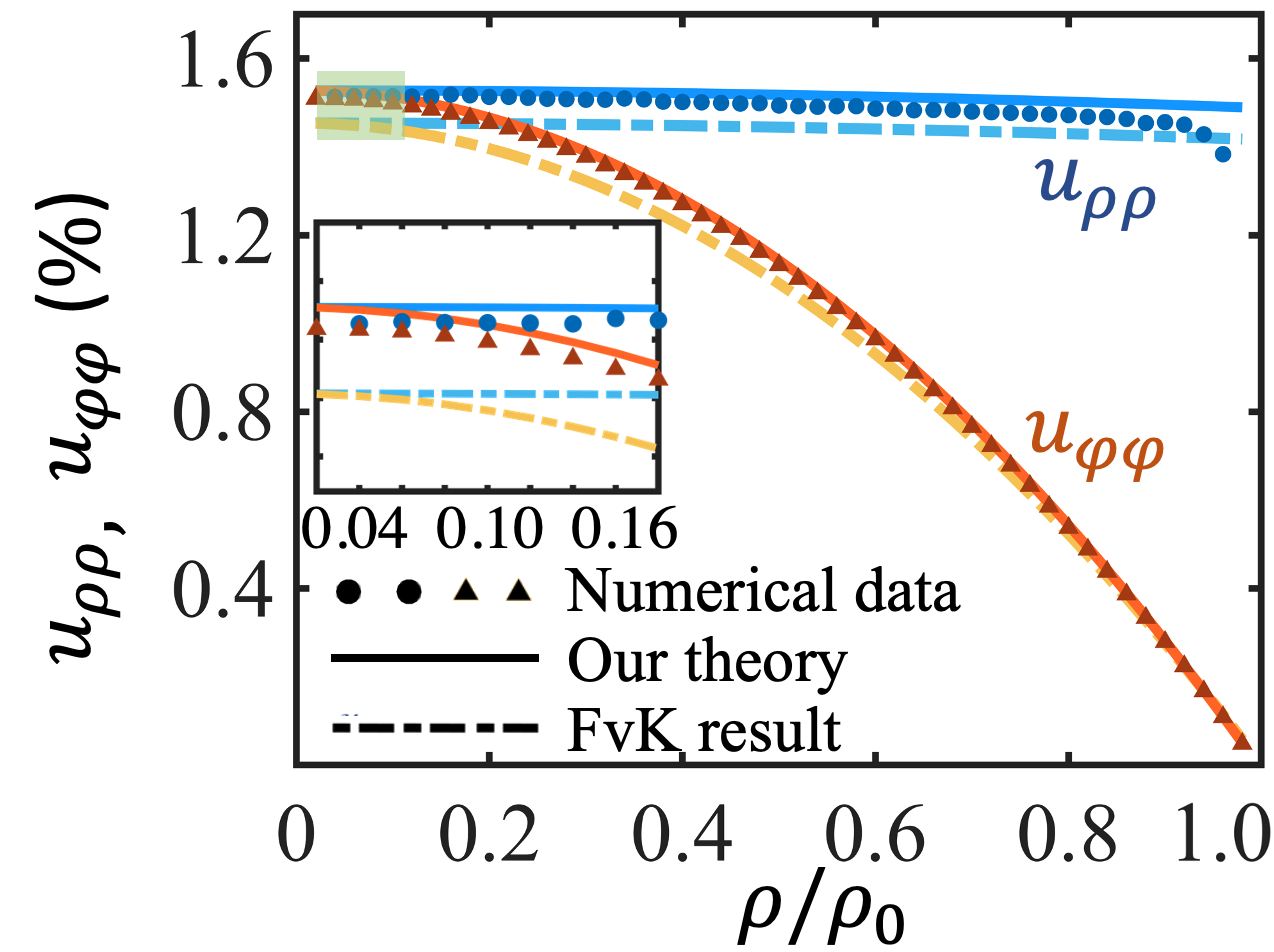
Equations (3) and (4) show that the homogeneously curved substrate geometry creates an inhomogeneous strain field, which is fundamentally different from the case of a planar membrane under radial tension. Simulations confirm the inhomogeneous distribution of the L-J particles on the sphere, as shown in Fig. 1(b). Analysis of the bond length, which are constructed by the standard Delaunay triangulation procedure, Nelson (2002a) shows that the central region in the deformed lattice is subject to a stronger stretching. Furthermore, the ratio of the maximum to the minimum bond length in the equilibrium configuration increases with the value of , indicating that the degree of inhomogeneity is enhanced as the sphere shrinks.
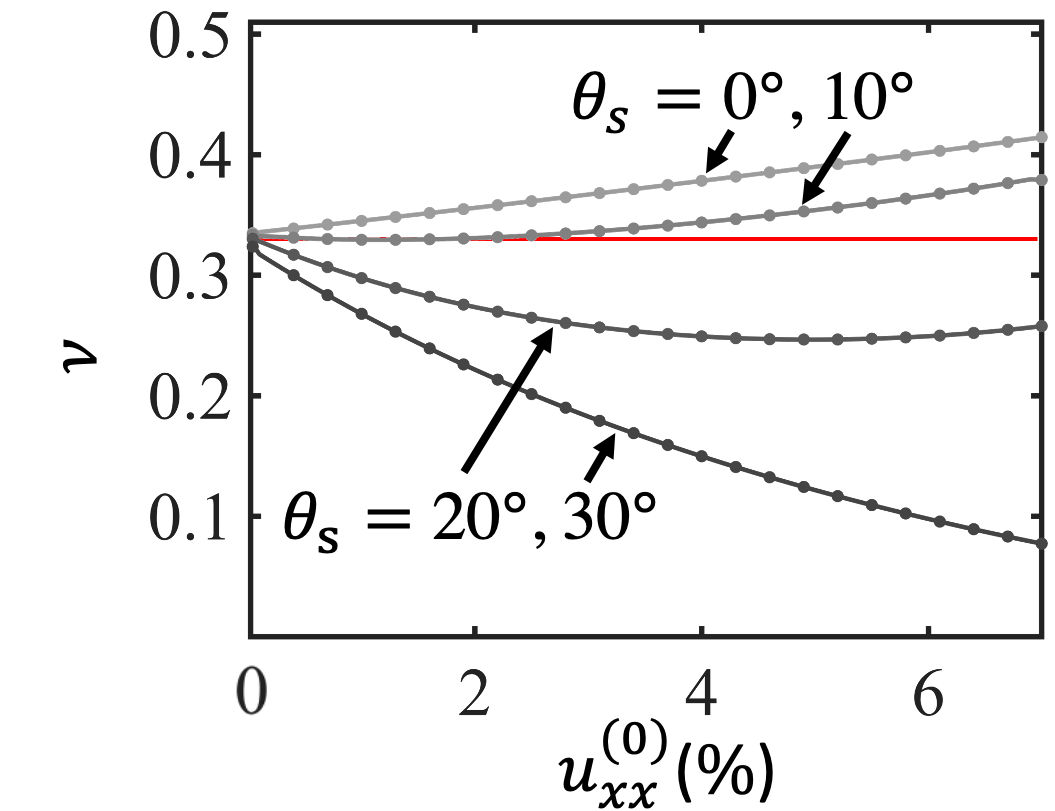
In Eqs. (3) and (4), we notice that the strain field is completely determined by the Gaussian curvature of the substrate and the Poisson’s ratio ; the Young’s modulus does not enter the equation. It is known that for an isotropic elastic medium composed of linear springs in triangular lattice. Landau and Lifshitz (1959); Seung and Nelson (1988) However, since the residual strain could influence the value of , Greaves et al. (2011) could we still specify a uniform value to the Poisson’s ratio for our system?

To address this question, we numerically study the dependence of the Poisson’s ratio on the magnitude of the preset strain and the direction of stretching. The detailed information about the measurement of Poisson’s ratio is presented in Supplemental Material. SI From Fig. 1(d), we see that the nonmonotonous -curves converge to a common value that is very close to as becomes vanishingly small. It suggests that the Poisson’s ratio of a slightly stretched crystalline cap may be approximately specified by a uniform value. As such, the parameter appearing in Eqs.(3) and (4) shall be interpreted as an effective Poisson’s ratio, Greaves et al. (2011) whose value is determined as by matching the analytical result and the simulation data for . for .
We plot the theoretically obtained strain field in Fig. 1(c) by inserting the value of into Eqs. (3) and (4). Comparison with the numerical results shows that the positive terms in the first square brackets in Eqs. (3) and (4) significantly reduce the gap between the analytical results based on the FvK equations and the simulation data.
Now, we resort to the geometric concepts of metric and curvature to analyze the deformed lattice of the L-J particles in mechanical equilibrium for fully understanding the inhomogeneity phenomenon. A key observation is that the distribution of the bond angle is sharply concentrated at for varying values of . SI The deformation of the lattice is therefore approximately angle-preserved. Rothen et al. (1993); Pierański (1989) In mathematics, strictly angle-preserved deformation is known as conformal transformation. Here, the quasi-conformal deformation of the lattice allows us to approximately construct the metric of the following form on the undeformed planar disk:
| (7) |
where . and are the length of the line element at before and after the deformation, respectively. Equation 7 represents a purely geometric approach to understanding the deformation of the lattice.
According to the Gauss’s Theorema Egregium, the Gaussian curvature is solely determined by the metric. Struik (1988) As determined by Eq. (7), the Gaussian curvature associated with the intrinsic inhomogeneity of the lattice (regardless of its shape in three-dimensional Euclidean space) is: Mughal and Moore (2007); Soni et al. (2018)
| (8) |
where the ratio of the densities . is the density of the undeformed lattice. is the Laplacian operator. The subscript in is to indicate that this curvature is associated with the lattice; the Gaussian curvature of the spherical substrate is denoted as . From the geometric perspective, by stretching the lattice, the spherical substrate essentially induces a Gaussian curvature in the resulting inhomogeneous lattice. Could the induced Gaussian curvature , as governed by the mechanical law, fully screen the curvature of the substrate geometry? In other words, is ?
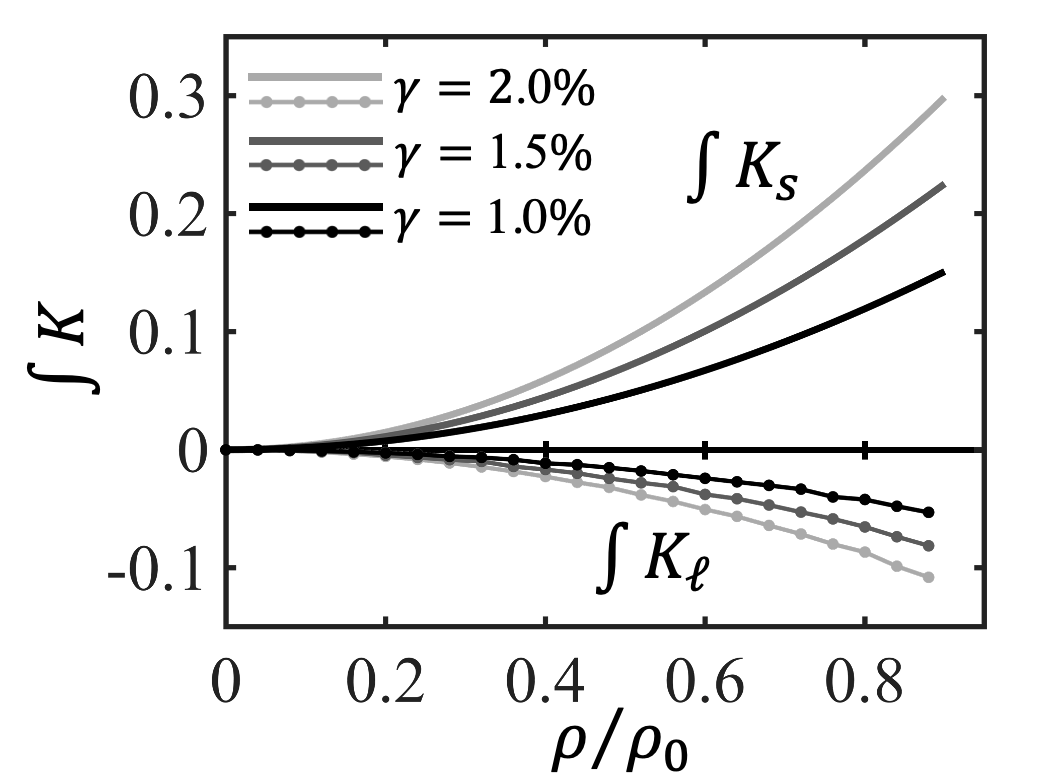
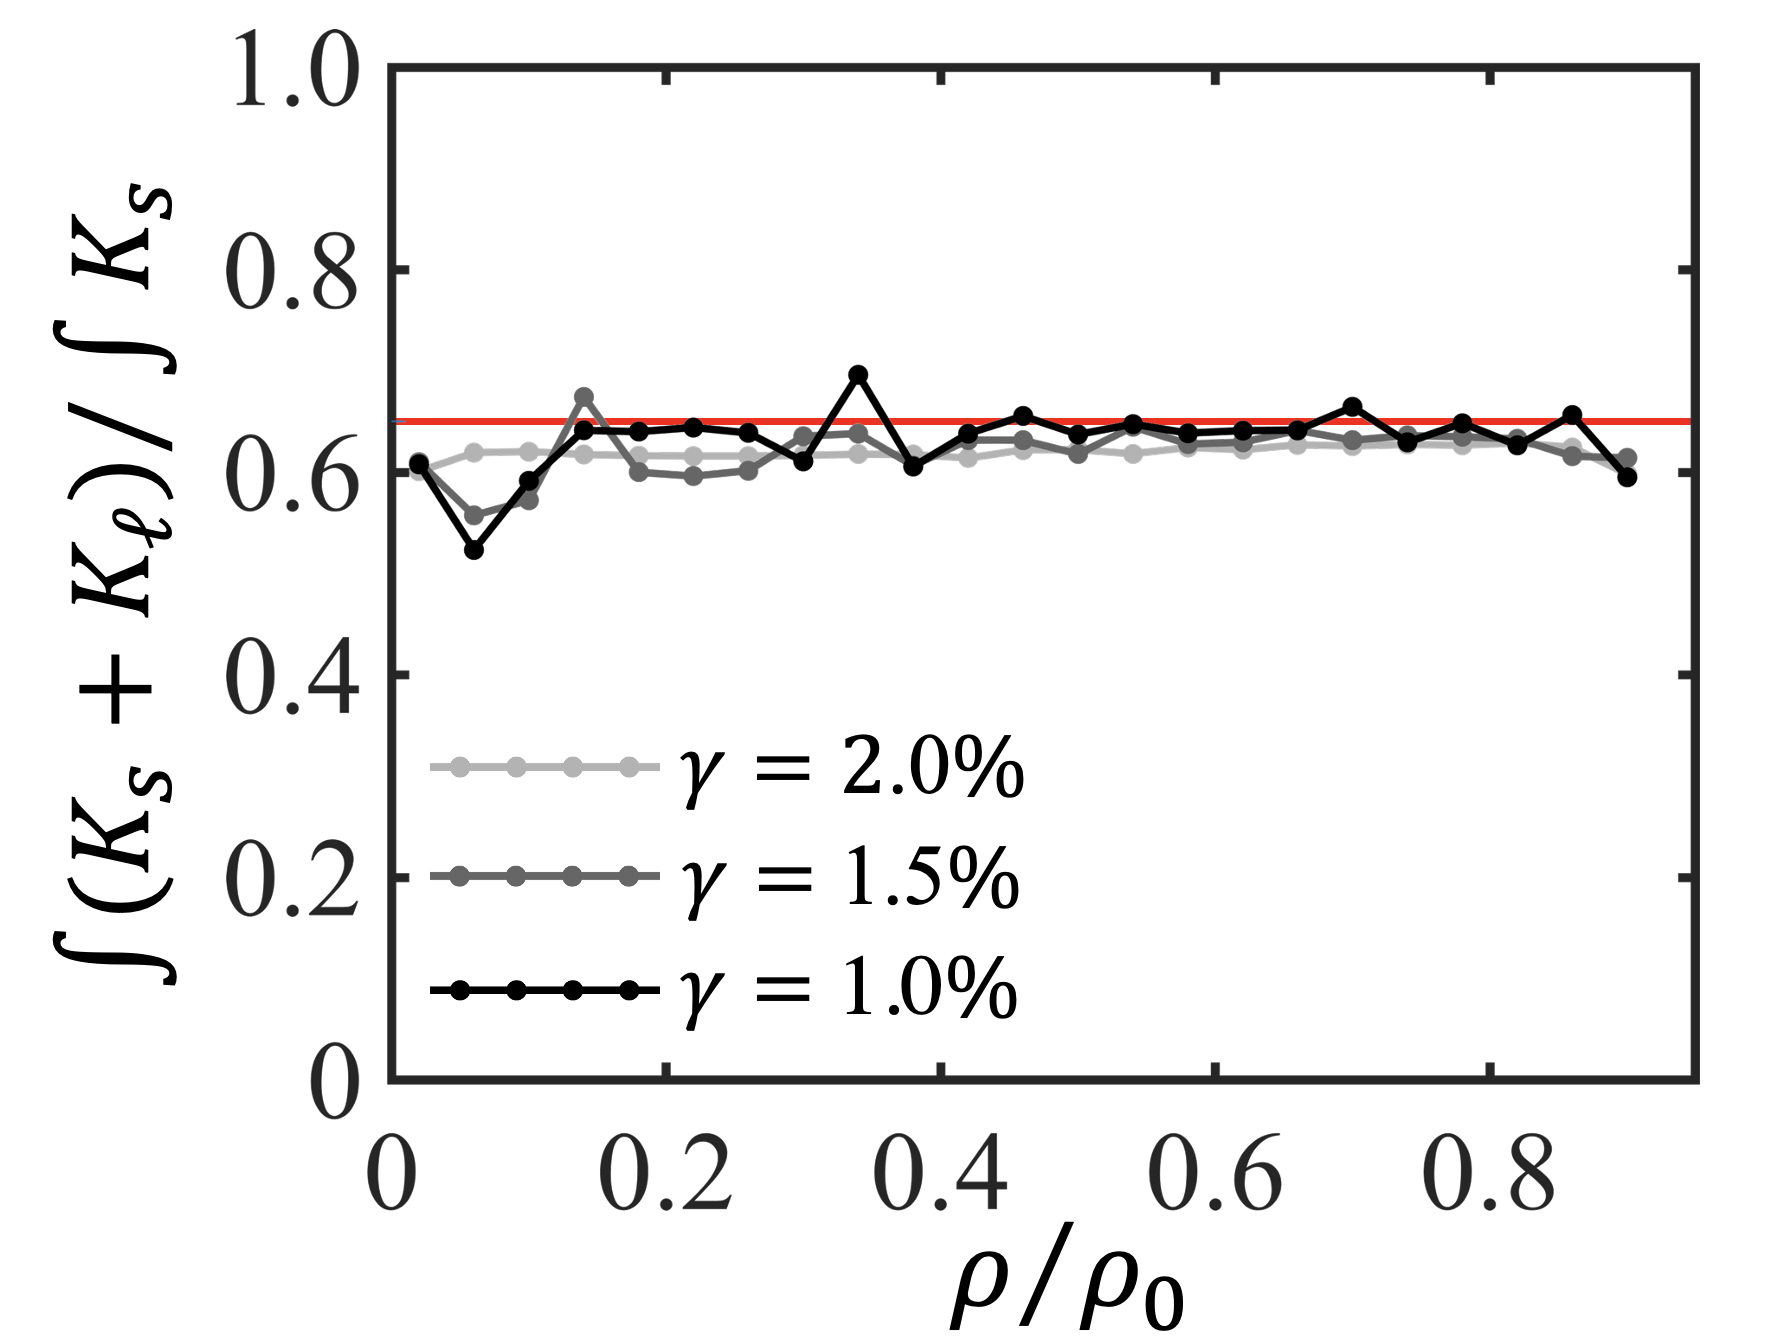
To address this question, we further analyze the simulation data to address inquiry into the nature of the induced curvature . The plot of the integrated curvatures is presented in Fig. 2(a). First of all, we see that the sign of is negative over the entire lattice at varying degrees of stretching. But the magnitude of the integrated is always smaller than the integrated . In other words, the curvature of the spherical substrate could not be fully screened by the induced curvature. From Fig. 2(b), we see that the ratio of the excess integrated curvature and the integrated is rather stable. It implies that the inhomogeneity created in the deformed lattice is to uniformize the screening of the substrate curvature, although this screening is not complete.
To explore the physical origin of the partial, but uniform screening phenomenon, we first establish the relation between and the strain tensor under the small deformation approximation: SI
| (9) |
Note that Eq. (9) could be used to analyze the intrinsic curvature structure in a series of problems related to the wrinkling of circular sheets under tension or in differential growth. Cerda and Mahadevan (2003); Sharon et al. (2007) Inserting Eqs. (3) and (4) into Eq. (9), we have
| (10) |
Equation (10) clearly shows that in general. is determined by both the curvature of the substrate and microscopic interaction; the later effect is reflected in the quantity of the Poisson’s ratio according to Eq. (10). Here, it is of interest to note that the amount of excess curvature is completely determined by the Poisson’s ratio, and it is independent of other elastic moduli of the material. For our elastic cap system, where , the relative excess curvature is about by Eq. (10). This result agrees well with the simulation data in Fig. 2.
Here, we shall emphasize that the screening mechanism by creating inhomogeneity with quasi-conformal ordering occurs in the elastic regime, and it is fundamentally different from the conventional screening scenario of plastic deformation based on topological defects. Nelson and Peliti (1987); Bowick et al. (2000) In the plastic deformation of geometrically frustrated 2D crystals on curved space, topological defects tend to proliferate to screen the Gaussian curvature of the substrate surface to minimize the elastic free energy. Nelson and Peliti (1987); Bowick et al. (2000) In our system, the proliferation of topological defects is suppressed under the fixed boundary condition. Our previous study on the frustration of L-J crystal clusters on the sphere shows that, under the stress-free boundary condition, the appearance of interior dislocations accompanies the formation of step structures along the cluster contour. Yao (2017) The fixed boundary condition forbids the relative displacement of the boundary particles, and thus suppresses the proliferation of interior topological defects. As such, the crystalline cap system deactivates the screening mechanism based on topological defects, and adopts the fashion of creating inhomogeneity to fit the curved substrate.
We proceed to explore the plastic deformation regime, where the highly stretched crystalline cap ultimately yields under the accumulated stress. Simulations show that the cap is fractured as the value of exceeds , regardless of the relative position of the entire lattice with respect to the center of the cap. The global rupture of the cap is triggered by slightly increasing at the rate of ; is at the order of . A typical fracture pattern is shown in Fig. 3(a); fracture patterns with three branches are also observed. SI It is uniformly observed that the fracture takes a turn near the boundary. The radial and azimuthal fractures occur simultaneously. In this turning, the microscopic morphology of the fracture transforms from the zigzag to the flat type, as illustrated in Fig. 3(a).
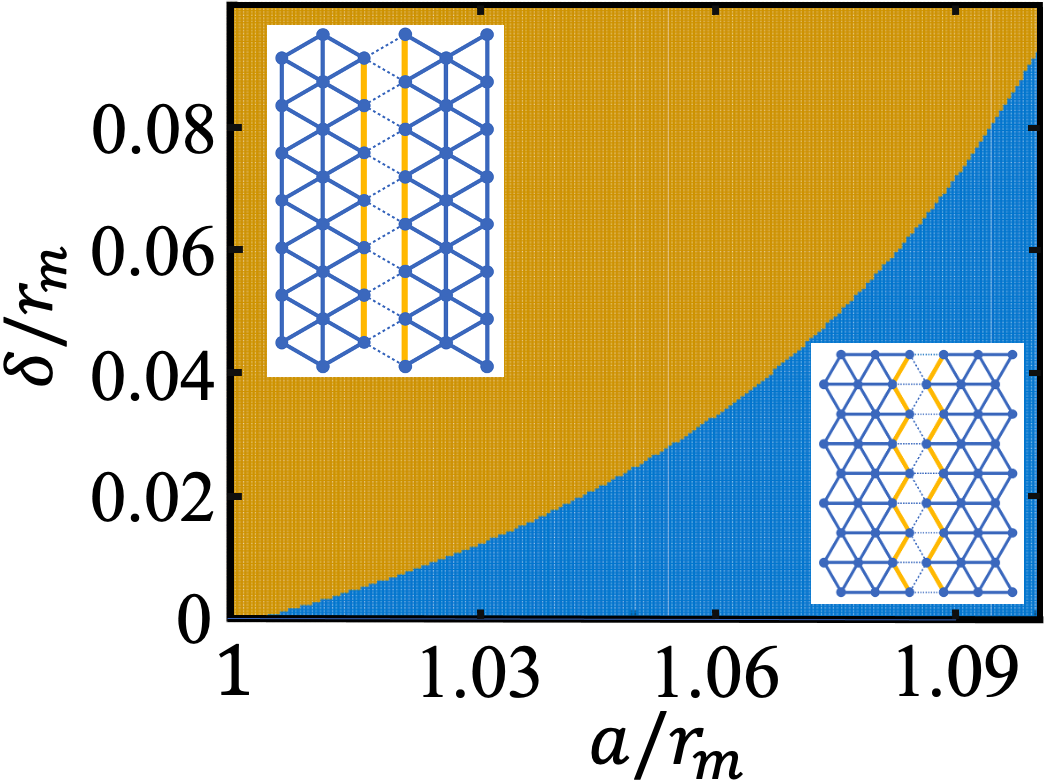
To understand the formation of the featured rupture mode in Fig.3(a), we first analyze the strain field in the central region. This region is isotropically stretched, and it is subject to maximum stretching according to the solved strain field. In an isotopically stretched two-dimensional crystal, which type of fracture will cost less energy? To address this question, we perform numerical experiment with a planar L-J lattice under isotropic stretching whose lattice spacing is . By comparing the energies of creating zigzag and flat fractures of separation , we obtain the phase diagram in Fig.3(b). It turns out that the zigzag fracture is relatively energetically favored. This explains the observed zigzag fracture in the central region of the cap.
The turning of the fracture is driven by the highly anisotropic strain field near the boundary of the cap, as shown in the and curves in Fig.1(c). Under the much larger radial strain , the lattice tends to break along the azimuthal direction. To conclude, the microscopic crystalline structure determines the morphology of the central fracture pattern, and the anisotropy of the strain field is responsible for the turning of the fracture near the boundary. The remarkable coexistence of the radial and azimuthal fractures, which is absent in planar systems, is essentially originated from the confluence of elasticity, curvature and the microscopic crystalline structure. Note that curvature-driven fracture phenomena are also reported in the deformation of nanoparticle monolayers Mitchell et al. (2018) and the 2D crystallization on the sphere. Ortellado et al. (2022)
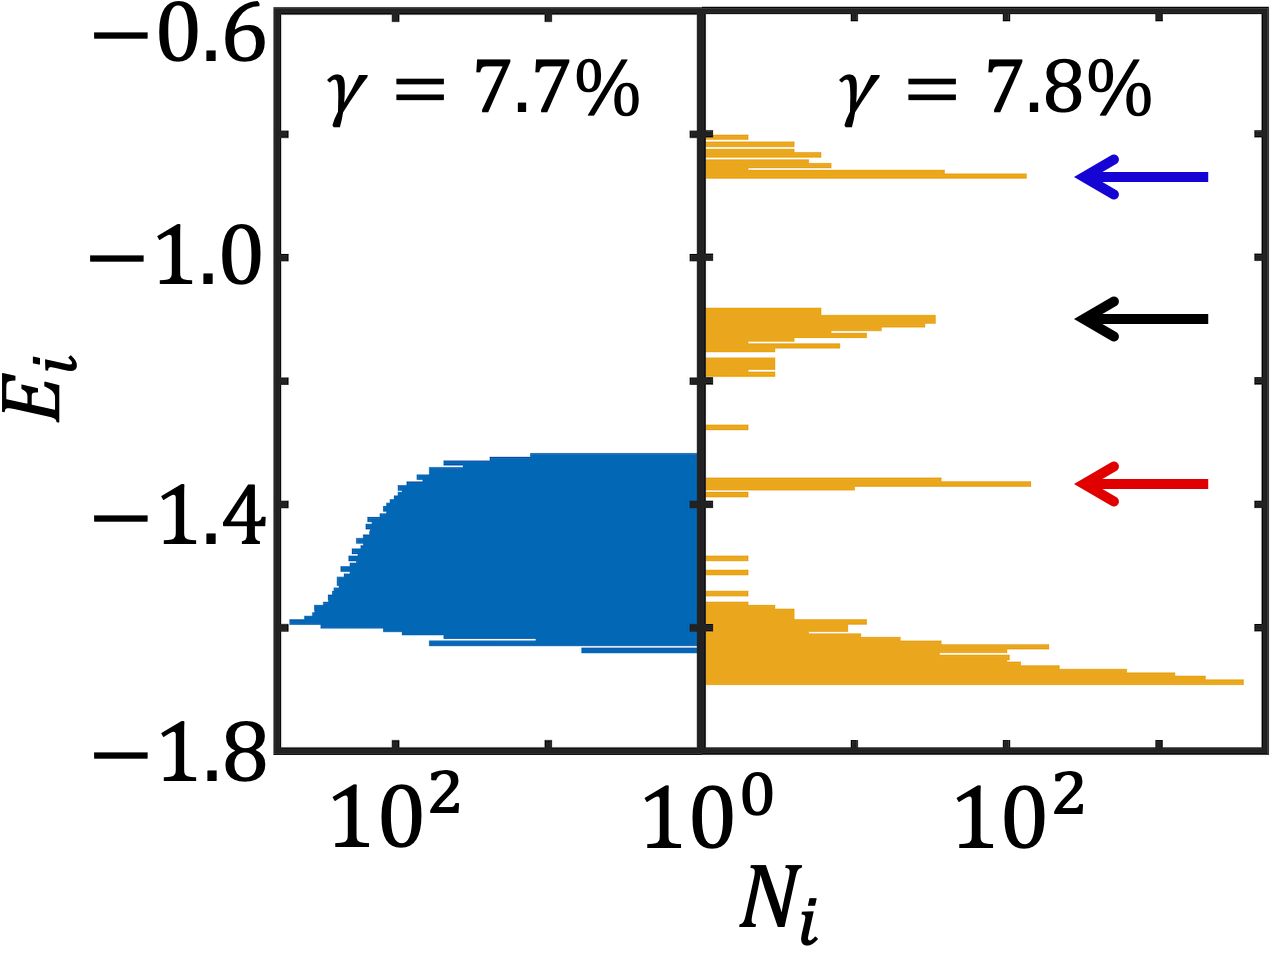
Now, we discuss the energetics in the fracture of the crystalline cap. Simulations show that the rupture event fundamentally changes the energy landscape. The redistribution of the energy among individual particles is summarized in Fig. 3(c). We see that the original single-peak profile splits into multiple energy bands. Some particles jump to a few higher energy bands, but the energy of most particles is lowered. The total energy of the system is significantly reduced by . We also notice that the width of the original energy profile shrinks in this process, indicating a reduced discrepancy in the energy of the particles occupying the same energy band.
The stress-steered rupture of the cap inspires us to explore the notion of actively controlling the fracture by engineering the stress over the surface. Specifically, we propose the strategy of introducing microscopic vacancies and exploiting the stress-concentration effect to redistribute the stress and guide the formation of the fracture. Timoshenko and Goodier (1970); Yao (2020)
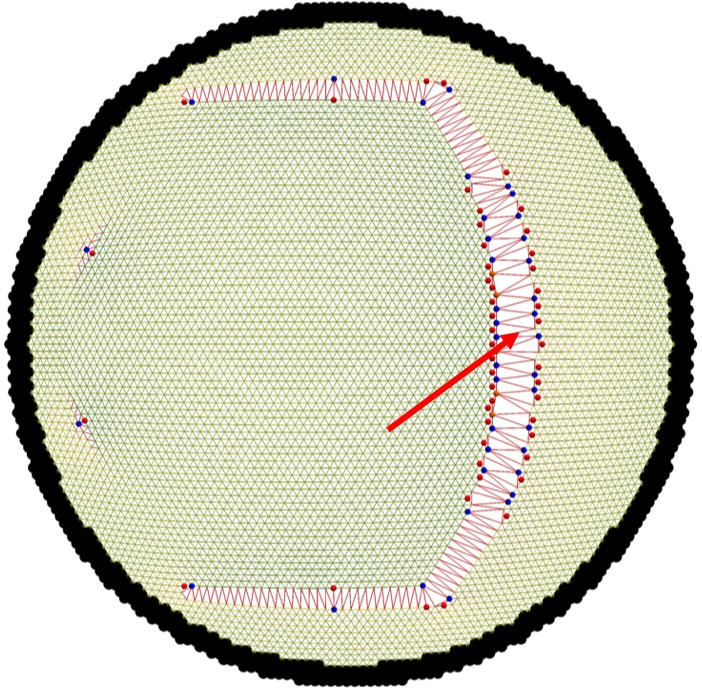
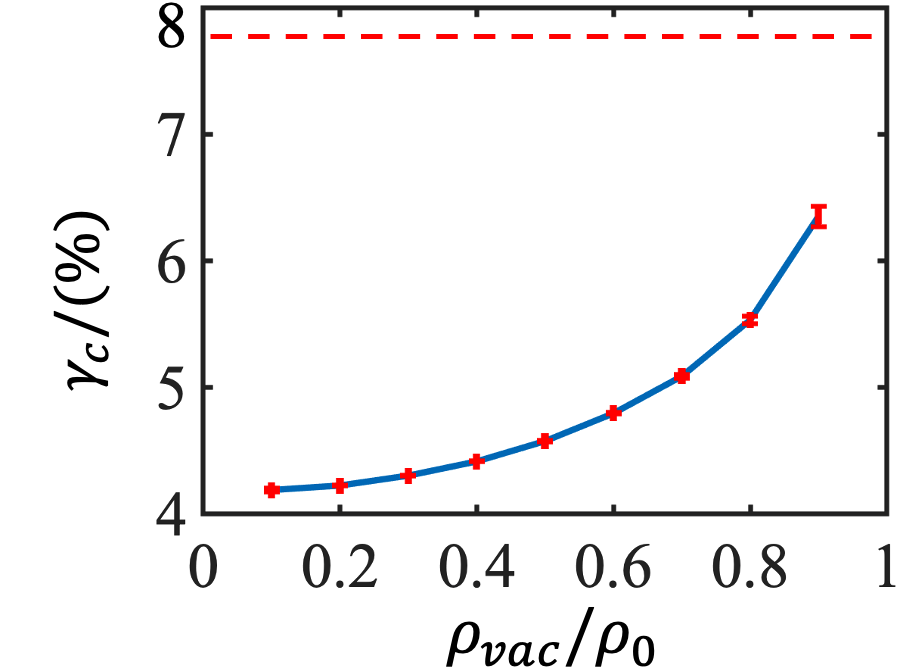
A vacancy is created by removing a single particle in the crystalline cap. In the presence of the vacancy, whose location is indicated by the arrow in Fig. 4(a), the resulting fracture pattern is completely different from the case in Fig.3(a). The formation of the new pattern is attributed to the vacancy-driven amplified discrepancy of the radial and azimuthal strains surrounding the vacancy. The dominant radial strain ultimately leads to the azimuthal fracture passing through the vacancy. Timoshenko and Goodier (1970) Instabilities caused by the stress-focusing effect of vacancies are also found in particulate elastic systems. Yao (2020) Simulations further show that introducing a vacancy, especially near the center of the cap, could significantly reduce the strength of the cap, as shown in Fig.4(b). The dashed line in Fig.4(b) indicates the value of for the case of vacancy-free cap. It is remarkable that the microscopic operation of removing a single particle leads to macroscopic effects in both aspects of fracture pattern and material strength. More examples of fracture patterns as controlled by the number and locations of vacancies are provided in Supplemental Material. SI
IV Conclusions
In summary, we have used the crystalline cap model to reveal the generic behaviors in the adaptivity of the two-dimensional crystalline systems on curved space in both elastic and plastic regimes. In the elastic regime, the geometric concepts of metric and curvature provide a vigorous formalism for understanding the observed inhomogeneous organization of the particles in the quasi-conformal lattice. In the plastic regime, we observe the microscopic yield of highly stressed caps, rationalize the emergence of the fracture patterns, and demonstrate the strategy of exploiting the stress-concentration effect of vacancies to actively control the fractures. This work shows the essential role of geometry to foster insights into the deep connection between inhomogeneity, stress and curvature.
Acknowledgements
This work was supported by the National Natural Science Foundation of China (Grants No. BC4190050). The authors acknowledge the support from the Student Innovation Center at Shanghai Jiao Tong University.
References
- Nelson (2002a) D. R. Nelson, Defects and Geometry in Condensed Matter Physics (Cambridge University Press, Cambridge, 2002).
- Bowick and Giomi (2009) M. J. Bowick and L. Giomi, Adv. Phys. 58, 449 (2009).
- Caspar and Klug (1962) D. L. D. Caspar and A. Klug, Cold Spring Harb. Symp. Quant. Biol. 27, 1 (1962).
- Lidmar et al. (2003) J. Lidmar, L. Mirny, and D. R. Nelson, Phys. Rev. E 68, 051910 (2003).
- Zandi et al. (2004) R. Zandi, D. Reguera, R. F. Bruinsma, W. M. Gelbart, and J. Rudnick, Proc. Natl. Acad. Sci. U.S.A. 101, 15556 (2004).
- Dinsmore et al. (2002) A. D. Dinsmore, M. F. Hsu, M. G. Nikolaides, M. Marquez, A. R. Bausch, and D. A. Weitz, Science 298, 1006 (2002).
- Bausch et al. (2003) A. R. Bausch, M. J. Bowick, A. Cacciuto, A. D. Dinsmore, M. F. Hsu, D. R. Nelson, M. G. Nikolaides, A. Travesset, and D. A. Weitz, Science 299, 1716 (2003).
- Ershov et al. (2013) D. Ershov, J. Sprakel, J. Appel, M. A. C. Stuart, and J. van der Gucht, Proc. Natl. Acad. Sci. U.S.A. 110, 9220 (2013).
- Nelson (2002b) D. R. Nelson, Nano Lett. 2, 1125 (2002b).
- Fernández-Nieves et al. (2007) A. Fernández-Nieves, V. Vitelli, A. S. Utada, D. R. Link, M. Márquez, D. R. Nelson, and D. A. Weitz, Phys. Rev. Lett. 99, 157801 (2007).
- Grason and Davidovitch (2013) G. M. Grason and B. Davidovitch, Proc. Natl. Acad. Sci. U.S.A. 110, 12893 (2013).
- Azadi and Grason (2014) A. Azadi and G. M. Grason, Phys. Rev. Lett. 112, 225502 (2014).
- Vernizzi et al. (2011) G. Vernizzi, R. Sknepnek, and M. Olvera de la Cruz, Proc. Natl. Acad. Sci. U.S.A. 108, 4292 (2011).
- Li et al. (2019) S. Li, R. Zandi, A. Travesset, and G. M. Grason, Phys. Rev. Lett. 123, 145501 (2019).
- Yao (2017) Z. Yao, Soft Matter 13, 5905 (2017).
- Mitchell et al. (2017) N. P. Mitchell, V. Koning, V. Vitelli, and W. T. M. Irvine, Nat. Mater. 16, 89 (2017).
- Klein et al. (2007) Y. Klein, E. Efrati, and E. Sharon, Science 315, 1116 (2007).
- Bowick et al. (2002) M. J. Bowick, A. Cacciuto, D. R. Nelson, and A. Travesset, Phys. Rev. Lett. 89, 185502 (2002).
- Irvine et al. (2010) W. T. Irvine, V. Vitelli, and P. M. Chaikin, Nature 468, 947 (2010).
- Kusumaatmaja and Wales (2013) H. Kusumaatmaja and D. J. Wales, Phys. Rev. Lett. 110, 165502 (2013).
- Audoly and Pomeau (2010) B. Audoly and Y. Pomeau, Elasticity and Geometry (Oxford University Press, Oxford, 2010).
- Jones (1924) J. E. Jones, Proc. R. Soc. A 106, 463 (1924).
- Nelson and Peliti (1987) D. Nelson and L. Peliti, J. Phys. 48, 1085 (1987).
- Bowick et al. (2000) M. J. Bowick, D. R. Nelson, and A. Travesset, Phys. Rev. B 62, 8738 (2000).
- Timoshenko and Goodier (1970) S. P. Timoshenko and J. N. Goodier, Theory of Elasticity (McGraw-Hill Book Company, New York, 1970).
- Landau and Lifshitz (1959) L. D. Landau and E. Lifshitz, Theory of Elasticity (Pergamon, London, 1959).
- Israelachvili (2011) J. N. Israelachvili, Intermolecular and Surface Forces, 3rd ed. (Academic Press, 2011).
- do Carmo (1976) M. P. do Carmo, Differential geometry of curves and surfaces. (Prentice Hall, 1976) pp. I–VIII, 1–503.
- Snyman and Wilke (2005) J. A. Snyman and D. N. Wilke, Practical Mathematical Optimization (Springer, New York, 2005).
- Yao and Olvera de la Cruz (2016) Z. Yao and M. Olvera de la Cruz, Phys. Rev. Lett. 116, 148101 (2016).
- (31) See Supplemental Material for technical details about the numerical simulation, the analytical elastic and geometric analysis, and more information about the fracture patterns.
- Belytschko et al. (2013) T. Belytschko, W. K. Liu, B. Moran, and K. Elkhodary, Nonlinear Finite Elements for Continua and Structures (John Wiley & Sons, New York, 2013).
- King et al. (2012) H. King, R. D. Schroll, B. Davidovitch, and N. Menon, Proc. Natl. Acad. Sci. U.S.A. 109, 9716 (2012).
- Seung and Nelson (1988) H. S. Seung and D. R. Nelson, Phys. Rev. A 38, 1005 (1988).
- Greaves et al. (2011) G. N. Greaves, A. Greer, R. S. Lakes, and T. Rouxel, Nat. Mater. 10, 823 (2011).
- Rothen et al. (1993) F. Rothen, P. Pieranski, N. Rivier, and A. Joyet, Eur. J. Phys. 14, 227 (1993).
- Pierański (1989) P. Pierański, in Phase Transitions in Soft Condensed Matter, edited by R. Tormod and S. David (Springer, New York, 1989) pp. 45–48.
- Struik (1988) D. Struik, Lectures on Classical Differential Geometry, 2nd ed. (Dover Publications, New York, 1988).
- Mughal and Moore (2007) A. Mughal and M. A. Moore, Phys. Rev. E 76, 011606 (2007).
- Soni et al. (2018) V. Soni, L. R. Gomez, and W. T. Irvine, Phys. Rev. X 8, 11039 (2018).
- Cerda and Mahadevan (2003) E. Cerda and L. Mahadevan, Phys. Rev. Lett. 90, 074302 (2003).
- Sharon et al. (2007) E. Sharon, B. Roman, and H. L. Swinney, Phys. Rev. E 75, 046211 (2007).
- Mitchell et al. (2018) N. P. Mitchell, R. L. Carey, J. Hannah, Y. Wang, M. Cortes Ruiz, S. P. McBride, X.-M. Lin, and H. M. Jaeger, Soft Matter 14, 9107 (2018).
- Ortellado et al. (2022) L. Ortellado, D. A. Vega, and L. R. Gómez, Phys. Rev. E 105, 014801 (2022).
- Yao (2020) Z. Yao, Soft Matter 16, 5633 (2020).