Universality and identity ordering in heteropolymer coil-globule transition
Abstract
The coil-globule transition of an energy polydisperse chain, a model heteropolymer system where the number of monomer species is as large as the total number of monomers, is studied by means of computer simulations. In this study, we systematically explore the consequences of having different functional form and variance of the energy distribution on the coil-globule transition in general. In particular, considering Gaussian (G) and uniform (U) distributions, the effect of varying polydispersity index, , on the transition temperature , chain size, internal structure and spatial organization of monomers in the globule, and kinetics of the folding are addressed. It is found that the transition temperature of the model heteropolymer is lower than that of the homopolymer counterpart, and increases with (both G and U) and consistently. The results of our study suggest that is governed by the most probable value (rather than the width) of the pair-wise energy distribution. Interestingly, the nature of the collapse transition turns out to be universal, i.e., when scaled properly (irrespective of the functional form and variance) all the swelling curves fall on a master curve and it is well described by the same scaling form of the homopolymer counterpart. However, following quenching, the transition from coil to globule is relatively fast for heteropolymer (with no significant difference between G and U systems, and no significant dependence within the considered range). On the other hand, internal organization in the collapsed state, quantified through mean contact probability, show distinct scaling regimes. Also we observe segregation of monomers based on their identities which is more pronounced in the case of uniform distribution.
I Introduction
A polymer chain in an extended or coil conformation can undergo structural transition to a compact globular structure and vice versa upon changing its environment (like temperature and PH) which is often seen in a number of biomacromolecules, e.g. protein folding and denaturation process, and in synthetic polymers.Sherman ; Frerix ; Tanaka0 ; Kita ; Xuuu ; Nakata
The coil-globlue transition was first predicted by Stockmayer in 1960 and observed experimentally by Tanaka et al. in 1979.Stockmayer ; Tanaka1 ; Tanaka2
It is clear by now that the observed structural transition is a result of the contest between the contribution of intramolecular interactions of the monomers and the loss of entropy due to swelling.Lifshitz ; Grosberg1 ; Grosberg2 ; Grosberg3 ; Grosberg4 ; Grosberg5
For fully flexible polymer chains, such transition is of second order and for semi-flexible or stiff polymers it is of first order.Grosberg6 ; Post ; Rampf ; Noguchi ; Bastolla
In addition to its fundamental interest, the phenomena of coil-globule transition is also relevant to protein folding and DNA condensation,Go ; Dill ; Onuchic ; Bloomfield network collapse, etc., and thus it has been a subject of intense research.Lesage ; MaedaY ; DingY ; Birshtein ; Tanaka ; Wittkop ; Polson ; Maffi ; Holehouse
Biopolymers have multi-species domains or residues, e.g. proteins and DNAs/RNAs have different residues which in a coarse-grained picture represent energetically different regions. Thus proteins are not simple homopolymer, but rather a finite-size heteropolymers. Since real protein sequences statistically look like random sequences the theoretical works that provide many aspects of the folding process employ random heteropolymer (RHP) model,Bryngelson ; Shakhnovich ; shakhnovich2006 ; Socci ; Pande where the simplest model consider two kinds of residues (i.e. hydropbic and hydrophilic amino acids) randomly distributed along the chain and in more general case it goes up to 20 amino acids.
Describing the physics of heteropolymer freezing (as a simple approximation to protein folding) relies on random energy model (REM), developed by Derrida Derrida to study spin glass system.Pande1997
The qualitative study of forming a unique structure in polypeptide chains and the enumeration of compact states of copolymers were carried out validating the use of REM in heteropolymers, and even highlighting its potential in understanding the evolution of proteins.Shakhnovich ; Shakhnovich1
Although RHP model gives good insight into the fundamentals of heteropolymer freezing, it lacks some important features, e.g. cooperative folding leading to native structure of the protein, and this leads to the idea of designed heteropolymer with the general requirements for sequences to be protein-like.shakhnovich2006
The RHP also represent intrinsically disordered proteins (IDP) which do not have a well defined native structure. Despite lacking a unique state, IDP plays a vital role in biological condensates of cells, ranging from cell signalling, transduction, cell physiology to diseases.McCarty ; Dyson1 ; Shin ; Banani An interesting phenomenon observed in these disordered proteins is coacervation, a phase condensation leading to a liquid-liquid phase separation.Patel ; Molliex
The known principles of polymer physics have been applied to study liquid-liquid phase separation of proteins and nucleic acids because they share familiar characteristics of the well-accepeted phase behaviour of polymer solutions.Quiroz ; Brangwynne ; Lin ; Dignon
In studying such complex systems, computer simulations, in addition to experiments and theory, have been of immense help in revealing many general aspects of the coil-globule transition.Dai ; Polson ; Steinhauser ; Wittkop ; Oever
There already exists a large volume of literature in the homo/hetero-polymer coil-globule transition, and yet, in this study, we reconsider the collapse transition of an energy polydisperse chain, a generic model heteropolymer, to highlight the role of the underlying energy distribution and its consequence on the coil-globule transition, in general, by means of molecular dynamics simulations.
To this end, we consider two types of energy distributions, namely, Gaussian and uniform distributions, and investigate the role of distribution shape on the coil-globule transition temperature, and the effect of variance is also studied. (Use of other type of distribution function, e.g., log-normal distribution is reported in reference vilip2021 .) In addition to this, we also address whether the nature of collapse transition depends on the distribution function or not. Another pertinent question is how rapid the globule formation is compared to the reference homopolymer system (of same molecular weight and same mean interaction energy).
One of the interesting aspect is the internal organization and identity ordering of monomers in the globular state which we study by means of contact map analysis. A contact map provides information of the preferred monomer-monomer interactions and it has been used to study the 3D structural organization of proteins in folded states.Vendruscolo ; Shoemaker ; Dyson
Both the folding of proteins and the complex three dimensional organizations of chromosomes have biomolecular machinery which has yet to be properly understood like the gene activity and the functional state of a living cell.Chiariello
The remainder of the paper is organized as follows. Model and simulation details are presented in section II. While in section III, the results on the coil-globule transition and -temperature, internal organization and energetics, and folding kinetics are discussed. Finally, we conclude the paper in section IV.
II Model and simulation details
The polymer chains are simulated using coarse-grain bead-spring model of Kremer and Grest,kremer_JCP_92 where a polymer chain is represented by beads connected with springs. All the pairwise interactions in the system is modeled via Lennard-Jones (LJ) potential,
| (2.1) |
where is the separation between a pair of particles, the monomer diameter, and the interaction strength between a pair of particles (following Lorentz-Berthelot mixing rule Berthelot ). The LJ potential is cut-off and shifted to zero at . The monomer connectivity along the chain is assured via finitely extensible, nonlinear, elastic (FENE) springs grest_kramer_PRA_33 represented by the potential,
| (2.2) |
where is the separation of neighboring monomers along the chain. The spring constant and the maximum extension between two consecutive monomers along the chain . The above values of and ensure that the chains avoid bond crossing and very high frequency modes kremer_JCP_92 ; Kremer .
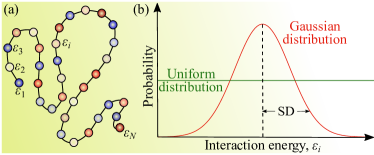
For this study we consider two types of chain differing in their interaction energy distribution, namely, Gaussian (G) and uniform (U) energy distributions described in the following. As sketched in figure 1, each monomer is assigned an interaction energy, , drawn randomly from a Gaussian distribution (refer afterwards as G-system) defined as
| (2.3) |
with SD the standard deviation and the mean; and uniform distribution defined as
| (2.4) |
For uniform distribution (refer afterwards as U-system) in the range the mean and the SD are, respectively,
| (2.5) |
In this study, for both distribution types, the mean is fixed at and the polydispersity is varied by changing the SD. Also for the reference homopolymer chain, we set the value of pair-wise interaction at . The degree of polydispersity is quantified through polydispersity index , and for uniform distribution it is
| (2.6) |
The model considered here belongs to the independent interaction model (where the number of monomer spercies is as large as the total number of monomers) which is used in modeling heteropolymer or disordered proteins.Pande
All the physical quantities used here are expressed in LJ reduced units,Frenkel ; Allen where and are the basic length and energy scales respectively. The reduced temperature and time are defined as and , where represents the LJ time unit, and , , , and are the Boltzmann constant, absolute temperature, real time, and mass, respectively.
The molecular dynamics (MD) simulations were carried out using Langevin dynamicsAllen ; Frenkel where the equations of motion are given by
| (2.7) |
where and are the position and mass of particle , respectively, and being the friction coefficient which is taken to be the same for all particles, is the potential acting on monomer of the polymer chain, and are random external forces which follows the relations: and where and denotes the Cartesian components.
The friction coefficient , with the characteristic viscous damping time which we fixed at and it determines the transition from inertial to overdamped motion. The chosen value of gives the correct thermalization for our study. The equations of motion are integrated using velocity-Verlet scheme with a time step of .
In this study, a single polymer chain is tethered at the center of a cubic simulation box which is periodic in all directions. Various chain lengths in the range are considered and depending on the chain size simulation box size varies in the range . Taking a chain relaxed at high temperature (where it assumes extended conformation) we quenced the chain to various lower temperatures and equilibrate at the temperature for sufficient amount of time where the thermodynamic quantities, e.g., total energy remains constant with time and then followed by production runs where various quantities of interest are measured. Typical relaxation time varies in the range MD steps, and production runs last between MD steps depending on the chain length. The results reported here are obtained by averaging over 20 replicas with each replica having a different set of interaction parameter . All the simulations were carried out using LAMMPS code.Plimpton
III Results and discussion
III.1 Collapse Transition
Upon changing temperature (or solvent quality), a polymer chain can transform its state from an extended coil conformation to a collapsed globule and vice-versa. At a particular temperature called -temperature, the second virial coefficient vanishes and it leads to the conformation of a real chain adopting that of an ideal chain and thus the chain size, , with being the number of monomers in the chain.Rubinstein The collapse transition is driven by the balance of net monomer-monomer interaction and the conformational entropy of the chain.Grosberg6 For instance, at a low temperature the effective monomer-monomer interaction is more attractive relative to monomer-solvent interaction and so the chains adopt a compact globular shape. However with decreasing chain size, the conformational entropy also decreases. The free energy of the polymer chain, in terms of swelling ratio, , can be written as
| (3.8) |
with where is the mean-square radius of gyration, and the elastic free energy and the interaction free energy (in mean-field approximation) are
| (3.9) | |||||
| (3.10) |
respectively, with as the monomer density, being a constant, and are the second and third virial coefficients respectively. Minimization of equation 3.8 w.r.t. gives the Flory formula for the swelling coefficient of the chain:
| (3.11) |
which captures the main feature of coil-globule transition and serves as a basis for understanding the phenomena.Lifshitz ; Grosberg1 ; Grosberg2 ; Grosberg3 ; Grosberg4 ; Grosberg5 ; Birshtein A more detailed treatment of the same are due to Sanchez.Sanchez . In the above equation, the second virial coefficient, , which gives the excluded volume, , contribution is related to the pair-wise interaction potential, , as
| (3.12) |
in which the effective transition temperatute, , is given by
| (3.13) |
When , the exclded volume and hence we recover the value of Flory exponent, . From equation 3.13, it is clear that the -temperature depends explicitly on the form of pair potential which in turn depends on the distribution of pair interaction parameter, , see equation 2.1.
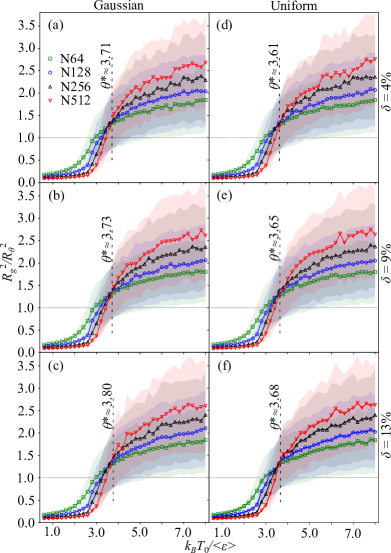
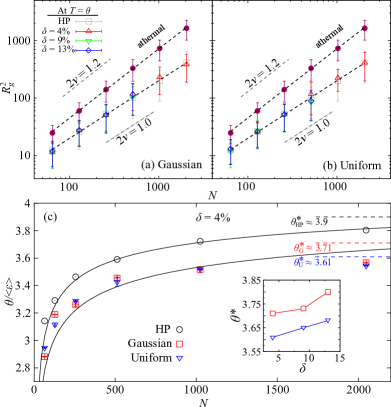
In figure 2, we plot the swelling ratio, , as a function of rescaled temperature for chains of various sizes shown at three different values of polydispersity index, . The temperature at which (denoted by ) differs for different chain length, see figure 3, for the chain size scaling and variation of as a function of . The -temperature varies with as , where is the ideal or true transition temperature,Rubinstein which one can achieve in the limit . At the transition temperature, the polymer chain behaves as an ideal chain and the plot of swelling ratio for different show a common intersection point at where the curvature changes.Steinhauser The same analysis is carried out for the reference homopolymer system to determine and (see SI). For the reference homopolymer system, we obtain (see SI), while it is relatively low for energy polydisperse chains.
The plot of vs polydispersity index is shown as inset in figure 3(c). For both Gaussian and uniform systems the value of increases with increasing . However, the value is consistently lower for the system with uniform energy distribution. Thus, the observed trend is (a) at a given value of , and (b) increases with increasing for both uniform and Gaussian energy polydisperse polymers. The observed increase of with is consistent with the result of earlier theoretical calculations where it is shown that the transition from a coil to random-globule is directly proportional to variance of the distribution.Pande1997
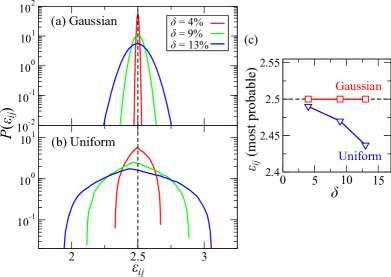
Since is related to the interaction potential of the system, see equation 3.13, and through equation 2.1, meaning that the transition temperature depends on the type of energy distribution. As we can see in figure 4, the distribution of , i.e. the convolution of two random variables and , is also Gaussian for the Gaussian distribution of (equation 2.3) where the mean and most probable values coincide, while for the uniform distribution (equation 2.4) , and shifts to a smaller value with increasing variance of the distribution, see figure 4(c). And at the same value of polydispersity index , the distribution is relatively broad for uniform distribution. These observations suggest that the value of is dictated by the value of rather than the width of the distribution in the sense that (although uniform distribution is broader) and thus . Moreover, for a given distribution (i.e. Gaussian or uniform), the increase in with increasing indicates that, here, the transition temperature is dictated by the population of larger .
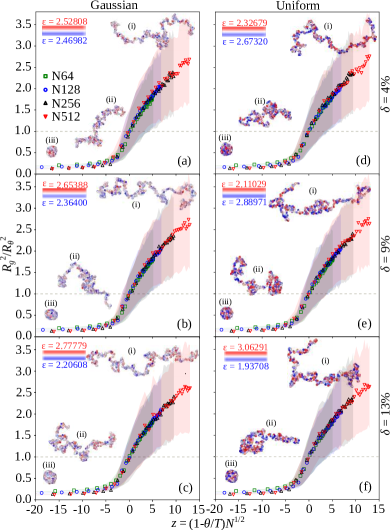
Finally, in order to see whether there is any qualitative difference on the nature of collapse transition between the two energy polydisperse systems, we replot the swelling curve shown in figure 2 as a function of interaction parameter . As we can see in figure 5, irrespective of energy distribution types and polydispersity value, all the curves collapsed to a master curve and this is not different from the homopolymer collpase. Thus the collapse transition behavior is universal, and it shown that the chain swelling ratio for and for with being the Flory exponent.Rubinstein In the following we discuss the results on the analysis of favorable contacts in the globular state.
III.2 Internal structure and energetics
Since the monomers have distinct interaction parameters, (drawn randomly from the given distribution), it is expected that, in the globular state, favorable contacts which lowers the energy of the systems form neighboring pairs. The favorable contacts are studied by means of contact map which, for any - monomer pair, is defined as
| (3.14) |
where is the separation between the - pair, and is the cut-off distance for defining neighbors. Here, the value of roughly corresponds to the first minima of pair correlation function. For a polymer chain of monomers, represents the elements of a connectivity matrix and corresponds to the energy of the nearest neighbour in contact.LMirny ; Chan
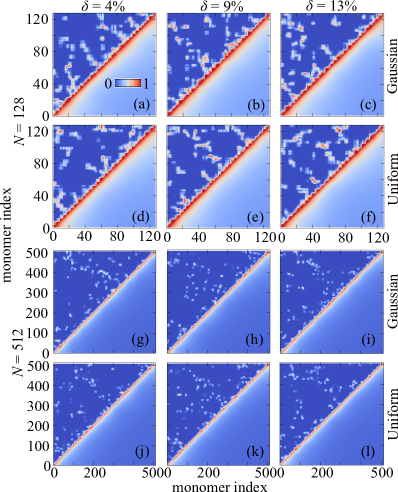
In figure 6, we display the 2D contact map (for ) obtained from 5000 independent configurations (of a particluar realization of random values, i.e., a randomly choosen replica) at three different values of polydispersity index for both Gaussian and uniform systems. Apart from neighboring monomers along the chain (where the contact probability is 1) there are preferred monomer-monomer contacts as indicated by the non-zero value of probability at off-diagonal elements of the matrix. Static pattern of contact map is expected for polymer chain with specific interaction sites (or fixed primary sequence). However, in our case, the observed pattern differ for different realizations of random values. It also depends on the polydispersity index. In order to understand an effective picture of monomer organization in the compact globule, we further calculate the mean contact probability defined as
| (3.15) |
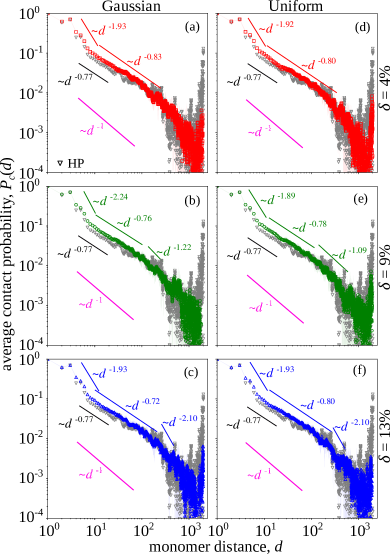
where is the monomer distance along the chain. In general, and the value of exponent characterizes the packing of chain in the globular state.Nazarov ; Imakaev ; Mirny ; Dekker ; Aiden For example, based on simple mean-field arguments, in a fractal space-filling like structure and thus .Aiden However, a more accurate study (which goes beyond the mean-field approximation) reveal that .Grosberg2014 In our study, for the energy polydisperse polymers, we calculate the mean contact probability and check the nature of packing.
In figure 7, we display the mean contact probability (obtained from 1000 independent configurations and averaged over 10 replicas) for the longest chain length considered in this study, i.e., . As one can see, for both Gaussian and uniform energy polydisperse chains, the scaling is observed with two distinct regimes: (i) (or in the range ) for which is larger than that of a 3D random walk where ,Imakaev and (ii) for the exponent is closer to (or in the range ). (For the number of data points are relatively less and thus statistically not significant and therefore the discussion is omitted here.)
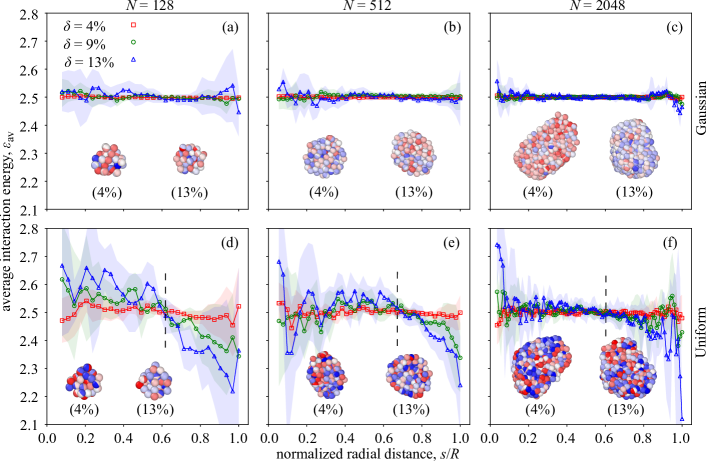
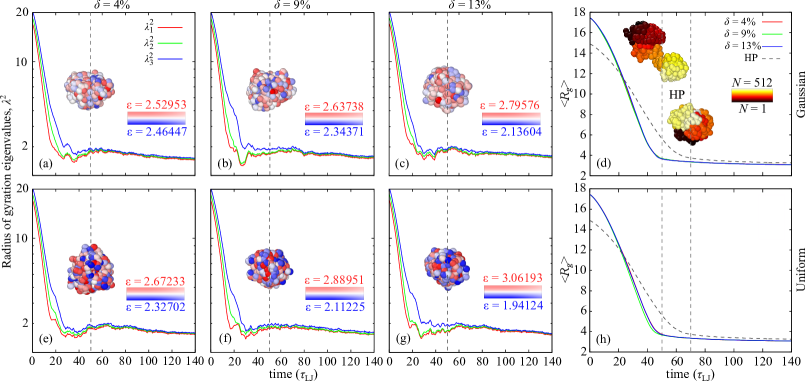
Another interesting aspect of packing is the spatial organization of energetically different monomers within the globule which we characterize by the radially averaged interaction parameter, with as the number of particles in a shell of thickness d at a radial distance from the center of the globule. In figure 8, variation of with normalized radial distance is shown for both Gaussian and uniform systems for different chain lengths and polydispersity index .
In case of the Gaussian system, the average value throughtout the globule indicating a homogeneous (in terms of particle identity) distribution within the globule; however, a slight increase (or decrease) at the inner core (or edge) of the globle is visible for large chain length at (not visible for smaller value of ).
On the other hand, for the uniform system, it is observed that for distance (inner core) of the globule size, and for (mid-region) the value of (oscillating about the mean value) and for larger distance, i.e. (outer-region), the value is lower than the mean (which is independent of chain length).
The overall trend indicates monomer segregation based on the identity, i.e., the inner core of the globule predominently consists of particles with high values, whereas in the mid-region there is homogeneous particle distribution, and the outer-region consists mostly of low particles. The observed self organization or enrichment (or depletion) of high particles at the core (or edge) of the globlue is more pronounced for larger value of . Similar particle identity ordering is also observed in energy polydisperse fluid systems, where as a consequence of segregation interesting particle dynamics emerges.shagolsem2015 ; shagolsem2016 The difference between the Gaussian and the uniform systems can be understood from the fact that, for a given value of , the width of (or ) distribution is relatively large for the uniform system, see figure 4, and consequently population of the particles that belong to the tail of the distribution is large leading to the pronounced effect.
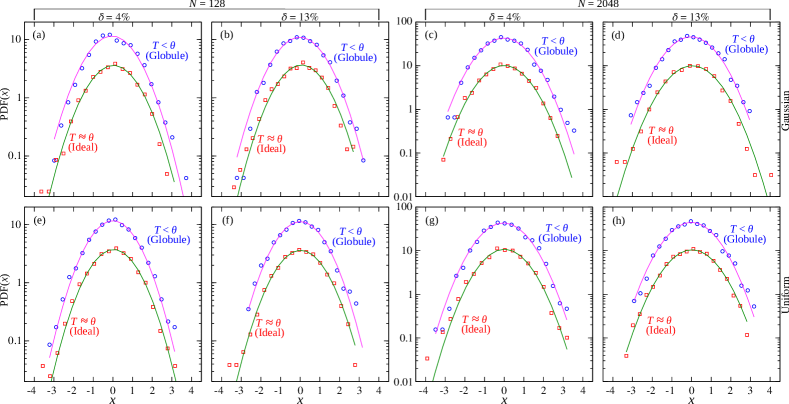
In the fluctuations of a wide variety of systems, e.g. in turbulence and magnetic systems, it is observed that as one approaches the critical point, the distribution of the fluctuations deviates from the Gaussian behavior.bramwell1998 ; portelli2001 Here also we check whether any such deviation is seen by calculating the distribution of the fluctuations of global potential energy per particle (with as the total potential energy, see equation 2.1, and as the number of monomers) when the chain adopts ideal statistics and in the globule state, i.e., at and , respectively. The rescaled distributions (with zero mean and unit variance) of potential energy is shown in figure 9 for both Gaussian and uniform systems for two values of polydispersity index . At both the considered points, the fluctuation is well described by the Gaussian curve and no significant deviation is observed. In the following section, we investigate the time evolution of polymer conformation leading to globular state by means of shape measures and mean contact probability.
III.3 Folding Kinetics
Conformational changes during folding from an extended state to compact globular structure is monitored through gyration tensor S as instantaneous shape measures.theodorou1985 ; solc_stockmayer_1971 ; solc1971 By choosing a principal axis system, where S is in a diagonal form with eigenvalues and such that , the instantaneous shape of a polymer chain is characterized in terms of asphericity, , and acylindricity, , defined as
| (3.16) |
Here, the quantity and measure the deviations from spherical and cylindrical shapes, respectively, with and for perfect sphere and cylinder, respectively. And trace of S represent the squared radius of gyration, i.e., .
To this end, the system initially at high temperature () is quenched to and the evolution of eigenvalues and average size are monitorted, see figure 10 for a chain of . It is clear from the figure that coil-globule transition happens at a relatively short time scale, e.g., by , the eigenvalues are roughly constant and as time increases difference between the eigenvalues are quite small and the structure is already a globule. The same is true for a homopolymer; however, the globule is achieved at a slightly later time of , see figure 10(d),(h) (also see supplementary information). Apparently, no significant effect on the transient phase is observed as a consequence of having different polydispersity index (within the considered range of values) for both Gaussian and uniform systems.
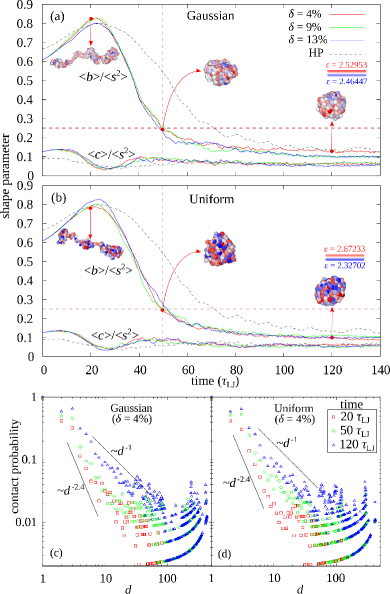
The evolution of average value of asphericity, , and acylindricity, , normalized by is shown in figure 11(a)-(b) for both energy polydisperse systems plotted along with that of the homopolymer. As we can see in the figure, for both Gaussian and uniform systems, immediately following the quench, increases from an initial value of about 0.6 to a maximum of about 0.8 when , where polymer adopts pearl-necklace conformation (an intermediate state during folding), which is followed by a rapid decrease and then a saturation around 0.1 at sufficiently long time. On the other hand, the value of , after remaining roughly constant (around 0.15) for a while, decreases to a minimum of about 0.05 when which is followed by a slight increase and then the saturation occurs. On comparison, the overall change in the value of acylindricity is small. It is interesting to note that, compared to homopolymer, energy polydisperse chain reach globular state rather rapidly. For instance, at , for energy polydisperse chains , while for homopolymer it is roughly 0.53, see figure 11, also see figure 10(d) for the relative difference in the chain conformations.
Finally, we check the evolution of instantaneous mean contact probability at 20 (early), 50 (intermediate), and 120 (late) time in units during the folding. The contact probabilities obtained from different replicas are shown in figure 11(c)-(d) for both Gaussian and uniform energy polydisperse chains at . We observe that for both systems, and during the transient phase the magnitude of exponent decreases from (in the extended state) to (in the stable globular state) indicating formation of fractal-like globular structure as shown in the figure.
IV Conclusion
Coil-globule transition is a classic problem which is still of great interest for its relevance to protein folding related problems. In this study also, we have carried out an extensive computer simulation of an energy polydisperse chain, a model heteropolymer (belonging to the independent interaction model), and investigated the effect of the functional form of the distribution and polydispersity index, , on the coil-globule transition in general. In particular, considering a Gaussian and uniform distribution functions, the consequences of varying (up to 13%) on the -temperature, chain size scaling, identity organization in the globular state, and kinetics of the folding are addressed in this study.
It is observed that, for a given distribution, with increasing (or variance of the distribution) the -temperature increases in general and its dependence follows . As one would expect, the chain size with at the respective -temperature for all values of considered. Interestingly, the asymptotic value for the model heteropolymer is found to be lower than the homopolymer counterpart and they follow the sequence: . For the independent interaction model,Pande1997 the transition temperature is shown to be proportional to the variance of the distribution which is in agreemenent with our result. Furthermore, our finding that suggest that the value of is dictated by the most probable value, , of the distribution of pair-wise interaction rather than the width of the distribution, i.e., at a given , here despite uniform distribution being broader (see figure 4). However, the nature of collapse transition turns out to be universal in the sense that when scaled properly all the swelling curves fall on a master curve, i.e., it is independent of the functional form and variance of the distribution, which is also not different from that of the homopolymer.
The 2D contact map, despite showing favourable monomer-monomer contacts in the compact state, lacks a specific pattern due to the random nature of interaction sites along the chain. However, the internal polymer organization characterized by the mean contact probability show distinct regimes: (i) at short countour distance, , we find with , and (ii) for in the range we get . On the other hand, spatial organization of monomers in the compact state show segregation based on the monomer identity. It is observed that monomers with high interaction parameters are predominently at the core (typically less than 10% of the globule radius, where the average interaction parameter is larger than the mean of the distribution) followed by a region of homogeneous distribution and eventually decays below the mean for distance beyond roughly 60% of the globule radius. Relatively, the segregation is more pronounced in the case of uniform distribution and it increases with higher . Finally, the study of structural evolution following quenching revel that coil to globule transition is faster in the case of energy polydisperse chain (and weakly depend on ).
Since topology and shapes of proteins play an important role in many biological functions understanding the interplay of topology and instantaneous shape of this model heteropolymer is important. Therefore, as an extension to the current study we shall explore the effect of having different topologies on the phase transition and other static properties of the model heteropolymer system.
Acknowledgements.
T. Vilip gratefully acknowledges fruitful discussions with M. Premjit, J. Pame, T. Premkumar, S. Jimpaul, and U. Somas.References
- (1) Sherman, E., & Haran, G. (2006). Coil-globule transition in the denatured state of a small protein. Proceedings of the National Academy of Sciences, 103(31), 11539-11543.
- (2) Tanaka, F., Koga, T., Kojima, H., & Winnik, F. M. (2009). Temperature and tension induced coil-globule transition of Poly (N-isopropylacrylamide) chains in water and mixed solvent of water/methanol. Macromolecules, 42(4), 1321-1330.
- (3) Kita, R., & Wiegand, S. (2005). Soret coefficient of poly (N-isopropylacrylamide)/water in the vicinity of coil-globule transition temperature. Macromolecules, 38(11), 4554-4556.
- (4) Frerix, A., Schonewald, M., Geilenkirchen, P., Müller, M., Kula, M. R., & Hubbuch, J. (2006). Exploitation of the coil-globule plasmid DNA transition induced by small changes in temperature, pH salt, and poly (ethylene glycol) compositions for directed partitioning in aqueous two-phase systems. Langmuir, 22(9), 4282-4290.
- (5) Xu, J., Zhu, Z., Luo, S., Wu, C., & Liu, S. (2006). First observation of two-stage collapsing kinetics of a single synthetic polymer chain. Physical review letters, 96(2), 027802.
- (6) Nakata, M. (1995). Coilglobule transition of poly (methyl methacrylate) in a mixed solvent. Physical Review E, 51(6), 5770.
- (7) Stockmayer, W. H. (1960). Problems of the Statistical Thermodynamics of Dilute Polymer Solution. Makromolekul. Chem., 35, 54-74.
- (8) Nishio, I., Sun, S. T., Swislow, G., & Tanaka, T. (1979). First observation of the coil–globule transition in a single polymer chain. Nature, 281(5728), 208-209.
- (9) Swislow, G., Sun, S. T., Nishio, I., & Tanaka, T. (1980). Coil-globule phase transition in a single polystyrene chain in cyclohexane. Physical review letters, 44(12), 796.
- (10) Lifshitz, I. M., Grosberg, A. Y., & Khokhlov, A. R. (1978). Some problems of the statistical physics of polymer chains with volume interaction. Reviews of Modern Physics, 50(3), 683.
- (11) Grosberg, A. Y., & Khokhlov, A. R. (1987). Physics of phase transition in solutions of macromolecules. Sov. Sci. Rev. A, 8, 147-252.
- (12) Grosberg, A. Y., & Kuznetsov, D. V. (1992). Quantitative theory of the globule-to-coil transition. 1. Link density distribution in a globule and its radius of gyration. Macromolecules, 25(7), 1970-1979.
- (13) Grosberg, A. Y., & Kuznetsov, D. V. (1992). Quantitative theory of the globule-to-coil transition. 2. Density-density correlation in a globule and the hydrodynamic radius of a macromolecule. Macromolecules, 25(7), 1980-1990.
- (14) Grosberg, A. Y., & Kuznetsov, D. V. (1992). Quantitative theory of the globule-to-coil transition. 3. Globule-globule interaction and polymer solution binodal and spinodal curves in the globular range. Macromolecules, 25(7), 1991-1995.
- (15) Grosberg, A. Y.,& Kuznetsov, D. V. (1992). Quantitative theory of the globule-to-coil transition. 4. Comparison of theoretical results with experimental data. Macromolecules, 25(7), 1996-2003.
- (16) Grosberg, A. Y., & Khokhlov, A. R. (1994). Statistical Physics of Macromolecules. AIP, Woodbury, NY.
- (17) Post, C. B., & Zimm, B. H. (1979). Internal condensation of a single DNA molecule. Biopolymers: Original Research on Biomolecules, 18(6), 1487-1501.
- (18) Rampf, F., Binder, K., & Paul, W. (2006). The phase diagram of a single polymer chain: New insights from a new simulation method. Journal of Polymer Science Part B: Polymer Physics, 44(18), 2542-2555.
- (19) Noguchi, H., & Yoshikawa, K. (1997). First-order phase transition in a stiff polymer chain. Chemical physics letters, 278(1-3), 184-188.
- (20) Bastolla, U., & Grassberger, P. (1997). Phase transitions of single semistiff polymer chains. Journal of statistical physics, 89(5), 1061-1078.
- (21) Go, N. (1983). Theoretical studies of protein folding. Annual review of biophysics and bioengineering. 12(1), 183-210.
- (22) Dill, K. A. (1990). Dominant forces in protein folding. Biochemistry, 29(31), 7133-7155.
- (23) Onuchic, J. N., & Luthey-Schulten, Z., & Wolynes, P. G. (1997). Theory of protein folding: the energy landscape perspective. Annual review of physical chemistry, 48(1), 545-600.
- (24) Bloomfield, V. A. (1996). DNA condensation. Current opinion in structural biology. 6(3), 334-341.
- (25) Lesage, A., Dahirel, V., Victor, J. M., & Barbi, M. (2019). Polymer coil–globule phase transition is a universal folding principle of Drosophila epigenetic domains. Epigenetics & chromatin, 12(1), 1-15.
- (26) Maeda, Y., Nakamura, T., & Ikeda, I. (2001). Changes in the hydration states of poly (N-alkylacrylamide)s during their phase transitions in water observed by FTIR spectroscopy. Macromolecules, 34(5), 1391-1399.
- (27) Ding, Y., Ye, X., & Zhang, G. (2005). Microcalorimetric investigation on aggregation and dissolution of poly (N-isopropylacrylamide) chains in water. Macromolecules, 38(3), 904-908.
- (28) Birshtein, T. M., & Pryamitsyn, V. A. (1987). Theory of the coil-globule transition. Polymer Science USSR, 39, 2039-2046.
- (29) Tanaka, G., & Mattice, W. L. (1995). Chain collapse by atomistic simulation. Macromolecules, 28(4), 1049-1059.
- (30) Wittkop, M., Kreitmeier, S., & Göritz, D. (1996). The collapse transition of a single polymer chain in two and three dimensions: A Monte Carlo study. The Journal of chemical physics, 104(9), 3373-3385.
- (31) Polson, J. M., & Moore, N. E. (2005). Simulation study of the coil-globule transition of a polymer in solvent. The Journal of chemical physics, 122(2), 024905-024909.
- (32) Maffi, C., Baiesi, M., Casetti, L., Piazza, F., & De Los Rios, P. (2012). First-order coil-globule transition driven by vibrational entropy. Nature communications, 3(1), 1-8.
- (33) Holehouse, A. S., & Pappu, R. V. (2018). Collapse transition of proteins and the interplay among backbone, sidechain, and solvent interactions. Annual Review of Biophysics, 47, 1.1-1.21.
- (34) Bryngelson, J. D., & Wolynes, P. G. (1987). Spin glasses and the statistical mechanics of protein folding. Proceedings of the National Academy of sciences, 84(21), 7524-7528.
- (35) Shakhnovich, E. I., & Gutin, A. M. (1989). Formation of unique structure in polypeptide chains: theoretical investigation with the aid of a replica approach. Biophysical chemistry, 34(3), 187-199.
- (36) Shakhnovich, E. (2006). Protein folding thermodynamics and dynamics: where physics, chemistry, and biology meet. Chemical reviews, 106(5), 1559-1588.
- (37) Socci, N. D., & Onuchic, J. N. (1994). Folding kinetics of proteinlike heteropolymers. The Journal of chemical physics, 101(2), 1519-1528.
- (38) Pande, V. S., Grosberg, A. Y., Joerg, C., & Tanaka, T. (1996). Is heteropolymer freezing well described by the random energy model? Physical review letters, 76(21), 3987.
- (39) Derrida, B. (1980). Random-energy model: Limit of a family of disordered models. Physical review letters, 45(2), 79.
- (40) Pande, V. S., Grosberg, A. Y., & Tanaka, T. (1997). Statistical mechanics of simple models of protein folding and design. Biophysical journal, 73(6), 3192-3210.
- (41) Shakhnovich, E., & Gutin, A. (1990). Enumeration of all compact conformations of copolymers with random sequence of links. The journal of chemical physics, 93(8), 5967-5971.
- (42) McCarty, J., Delaney, K. T., Danielsen, S. P., Fredrickson, G. H., & Shea, J. E. (2019). Complete phase diagram for liquid–liquid phase separation of intrinsically disordered proteins. The journal of physical chemistry letters, 10(8), 1644-1652.
- (43) Dyson, H. J., & Wright, P. E. (2005). Intrinsically unstructured proteins and their functions. Nature reviews Molecular cell biology, 6(3), 197-208.
- (44) Shin, Y., & Brangwynne, C. P. (2017). Liquid phase condensation in cell physiology and disease. Science, 357(6357), eaaf4382.
- (45) Banani, S. F., Lee, H. O., Hyman, A. A., & Rosen, M. K. (2017). Biomolecular condensates: organizers of cellular biochemistry. Nature reviews Molecular cell biology, 18(5), 285-298.
- (46) Patel, A., Lee, H. O., Jawerth, L., Maharana, S., Jahnel, M., Hein, M. Y., Stoynov S., Mahamid J., Saha S., Franzmann T. M., Pozniakovski A., Poser, I., Maghelli, N., Royer, L. A., Weigert, M., Myers, E. W., Grill, S., Drechsel, D., Hyman,, A. A., & Alberti, S. (2015). A liquid-to-solid phase transition of the ALS protein FUS accelerated by disease mutation. Cell, 162(5), 1066-1077.
- (47) Molliex, A., Temirov, J., Lee, J., Coughlin, M., Kanagaraj, A. P., Kim, H. J., Mittag, T., & Taylor, J. P. (2015). Phase separation by low complexity domains promotes stress granule assembly and drives pathological fibrillization. Cell, 163(1), 123-133.
- (48) Quiroz, F. G., & Chilkoti, A. (2015). Sequence heuristics to encode phase behaviour in intrinsically disordered protein polymers. Nature materials, 14(11), 1164-1171.
- (49) Brangwynne, C. P., Tompa, P., & Pappu, R. V. (2015). Polymer physics of intracellular phase transitions. Nature Physics, 11(11), 899-904.
- (50) Lin, Y. H., Forman-Kay, J. D., & Chan, H. S. (2016). Sequence-specific polyampholyte phase separation in membraneless organelles. Physical review letters, 117(17), 178101
- (51) Dignon, G. L., Zheng, W., Best, R. B., Kim, Y. C., & Mittal, J. (2018). Relation between single-molecule properties and phase behavior of intrinsically disordered proteins. Proceedings of the National Academy of Sciences, 115(40), 9929-9934.
- (52) Dai, L., Mu, Y., Nordenskiöld, L., & van der Maarel, J. R. (2008). Molecular dynamics simulation of multivalent-ion mediated attraction between DNA molecules. Physical review letters, 100(11), 118301.
- (53) Steinhauser, M. O. (2005). A molecular dynamics study on universal properties of polymer chains in different solvent qualities. Part I. A review of linear chain properties. The Journal of chemical physics, 122(9), 094901-094913.
- (54) Van den Oever, J. M. P., Leermakers, F. A. M., Fleer, G. J., Ivanov, V. A., Shusharina, N. P., Khokhlov, A. R., & Khalatur, P. G. (2002). Coil-globule transition for regular, random, and specially designed copolymers: Monte Carlo simulation and self-consistent field theory. Physical Review E, 65(4), 041708.
- (55) Singh, T. V., & Shagolsem, L. S. (2021). Shape Analysis of Energy Polydisperse Polymers. Macromolecular Symposia, 399, 2100002.
- (56) Vendruscolo, M., Najmanovich, R., & Domany, E. (1999). Protein folding in contact map space. Physical review letters, 82(3), 656.
- (57) Shoemaker, B. A., Wang, J., & Wolynes, P. G. (1997). Structural correlations in protein folding funnels. Proceedings of the National Academy of Sciences, 94(3), 777-782.
- (58) Dyson, H. J., Wright, P. E., & Scheraga, H. A. (2006). The role of hydrophobic interactions in initiation and propagation of protein folding. Proceedings of the National Academy of Sciences, 103(35), 13057-13061.
- (59) Chiariello, A. M., Annunziatella, C., Bianco, S., Esposito, A., & Nicodemi, M. (2016). Polymer physics of chromosome large-scale 3D organisation. Scientific reports, 6(1), 1-8.
- (60) Kremer, K., & Grest, G. S. (1990). Dynamics of entangled linear polymer melts: A molecular‐dynamics simulation. The journal of chemical physics, 92(8), 5057-5086.
- (61) Berthelot, D., (1889) Comptes Rendus Acad. Sci. Paris, 126, 1703
- (62) Grest, G. S., & Kremer, K. (1986). Molecular dynamics simulation for polymers in the presence of a heat bath. Physical Review A, 33(5), 3628.
- (63) Abrams, C. F., & Kremer, K. (2001). The effect of bond length on the structure of dense bead–spring polymer melts. The journal of chemical physics, 115(6), 2776-2785.
- (64) Allen, M. P., & Tildesley, D. J. (2017). Computer Simulation of Liquids, 2nd Edition, Oxford University Press, Oxford.
- (65) Frenkel D., & Smit, B. (2001). Understanding Molecular Simulation: From Algorithms to Applications, 2nd Edition, Academic Press, Cambridge.
- (66) Plimpton, S. (1995). Fast parallel algorithms for short-range molecular dynamics. J. Comp. Phys., 117, 1-19.
- (67) Rubinstein, M, & Colby, R. H. (2003). Polymer Physics, Oxford University Press.
- (68) Sanchez, I. C. (1979). Phase transition behaviour of the isolated polymer chain. Macromolecules, 12(5), 980-988.
- (69) Mirny, L., & Domany, E. (1996). Protein fold recognition and dynamics in the space of contact maps. Proteins: Structure, Function, and Bioinformatics, 26(4), 391-410.
- (70) Chan, H. S., & Dill, K. A. (1996). Comparing folding codes for proteins and polymers. Proteins: Structure, Function, and Bioinformatics, 24(3), 335-344.
- (71) Nazarov, L. I., Tamm, M. V., Avetisov, V. A., & Nechaev, S. K. (2015). A statistical model of intra-chromosome contact maps. Soft matter, 11(5), 1019-1025.
- (72) Imakaev, M. V., Tchourine, K. M., Nechaev, S. K., & Mirny, L. A. (2015). Effects of topological constraints on globular polymers. Soft matter, 11(4), 665-671.
- (73) Mirny, L. A. (2011). The fractal globule as a model of chromatin architecture in the cell. Chromosome research, 19(1), 37-51.
- (74) Dekker, J., Marti-Renom, M. A., & Mirny, L. A. (2013). Exploring the three-dimensional organization of genomes: interpreting chromatin interaction data. Nature Reviews Genetics, 14(6), 390-403.
- (75) Lieberman-Aiden, E., Van Berkum, N. L., Williams, L., Imakaev, M., Ragoczy, T., Telling, A., Amit, I., Lajoie, B. R., Sabo, P.J., Dorschner, M. O., Sandstorm, R., Bernstein, B., Bender, M. A., Groudine, M., Gnirke, A., Stamatoyannopoulos, J., Mirny, L. A., Lander, E. S., & Dekker, J. (2009). Comprehensive mapping of long-range interactions reveals folding principles of the human genome. Science, 326(5950), 289-293.
- (76) Grosberg, A. Y. (2014). Annealed lattice animal model and Flory theory for the melt of non-concatenated rings: towards the physics of crumpling. Soft Matter, 10(4), 560-565.
- (77) Shagolsem, L. S., Osmanovic, D., Peleg, O., & Rabin, Y. (2015). Pair interaction ordering in fluids with random interactions. J. Chem. Phys., 142, 051104.
- (78) Shagolsem, L. S., & Rabin, Y. (2016). Particle dynamics in fluids with random interactions. J. Chem. Phys., 144, 194504.
- (79) Bramwell, S. T., Holdsworth, P. C. W., & Pinton, J. F. (1998). Universality of rare fluctuations in turbulence and critical phenomena. Nature, 396(6711), 552-554.
- (80) Portelli, B., Holdsworth, P. C. W., Sellitto, M., & Bramwell, S. T. (2001). Universal magnetic fluctuations with a field-induced length scale. Physical Review E, 64(3), 036111.
- (81) Theodorou, D. N., & Suter, U. W. (1985). Shape of unperturbed linear polymers: polypropylene. Macromolecules, 18(6), 1206-1214.
- (82) Šolc, K., & Stockmayer, W. H. (1971). Kinetics of diffusion‐controlled reaction between chemically asymmetric molecules. I. general theory. The Journal of Chemical Physics, 54(7), 2981-2988.
- (83) Šolc, K. (1971). Shape of a Random-Flight Chain. The Journal of Chemical Physics, 55(1), 335-344.